Article

Mucin-Grafted Polyethylene Glycol Microparticles Enable Oral Insulin Delivery for Improving Diabetic Treatment

by
Momoh A. Mumuni
1,*,
Ugwu E. Calister
2,
Nafiu Aminu
3,
Kenechukwu C. Franklin
1,
Adedokun Musiliu Oluseun
4,
Mohammed Usman
5,
Barikisu Abdulmumuni
6,
Oyeniyi Y. James
3,
Kenneth C. Ofokansi
1,
Attama A. Anthony
1,
Emmanuel C. Ibezim
1 and
David Díaz Díaz
7,8,9,*
1
Drug Delivery Research Unit, Department of Pharmaceutics, University of Nigeria Nsukka, 410001 Enugu State, Nigeria
2
Department of Pharmaceutical Technology and Industrial Pharmacy, University of Nigeria, Nsukka, 410001 Enugu State, Nigeria
3
Department of Pharmaceutics and Pharmaceutical Microbiology, Usmanu Danfodiyo University, 840101 Sokoto, Nigeria
4
Department of Pharmaceutics and Pharmaceutical Technology, University of Uyo, 520271 Akwa-Ibom State, Nigeria
5
Department of Chemistry, Usmanu Danfodiyo University, 840 Sokoto, Nigeria
6
Department of Geology, University of Nigeria Nsukka, 410001 Enugu State, Nigeria
7
Departamento de Química Orgánica, Universidad de La Laguna, Avda. Astrofísico Francisco Sánchez 3, La Laguna, 38206 Tenerife, Spain
8
Instituto de Bio-Orgánica Antonio González, Universidad de La Laguna, Avda. Astrofísico Francisco Sánchez 2, La Laguna, 38206 Tenerife, Spain
9
Institut für Organische Chemie, Universität Regensburg, Universitätsstr. 31, 93053 Regensburg, Germany
*
Authors to whom correspondence should be addressed.
Appl. Sci. 2020, 10(8), 2649; https://doi.org/10.3390/app10082649
Submission received: 20 March 2020 / Revised: 5 April 2020 / Accepted: 7 April 2020 / Published: 11 April 2020

Abstract

:
In this study, different ratios of mucin-grafted polyethylene-glycol-based microparticles were prepared and evaluated both in vitro and in vivo as carriers for the oral delivery of insulin. Characterization measurements showed that the insulin-loaded microparticles display irregular porosity and shape. The encapsulation efficiency and loading capacity of insulin were >82% and 18%, respectively. The release of insulin varied between 68% and 92% depending on the microparticle formulation. In particular, orally administered insulin-loaded microparticles resulted in a significant fall of blood glucose levels, as compared to insulin solution. Subcutaneous administration showed a faster, albeit not sustained, glucose fall within a short time as compared to the polymeric microparticle-based formulations. These results indicate the possible oral delivery of insulin using this combination of polymers.

1. Introduction

Globally, diabetes is one of the most common metabolic diseases, affecting more than 345 million people worldwide [1]. It is estimated that in 2030, this number will increase to about 552 million, which is outrageous and a serious threat to public health [2]. Diabetes is broadly classified into two major groups, namely, Type 1, also known as insulin-dependent diabetes, which occurs when the body cannot produce enough insulin or when the pancreas is unable to produce sufficient insulin, causing hyperglycemia; and Type 2, a more common type of diabetes that results from the combination of inadequate insulin secretion and insulin resistance. In Type 1, the patient requires routine administration of insulin, being nowadays considered the most effective treatment with high specificity and activity [3]. Currently, the conventional route of insulin administration is subcutaneous, which faces many hurdles such as the difficulty of achieving a normal pattern of nutrient-related and basal insulin, significant tissue trauma and pain, particularly with multiple dosing, and hypoglycemia episodes [4].
In order to abrogate these challenges, it is of utmost importance to develop adequate oral insulin delivery systems for effective diabetes therapy. Indeed, oral ingestion remains the most desirable route for the application of pharmaceuticals, as it does not require a skilled health care professional and it therefore conveniently allows self-administration of the drug [5]. Oral ingestion of insulin would deliver the drug directly to the liver through portal circulation, mimicking the fate of endogenously secreted insulin [6]. However, oral delivery of many peptidic drugs faces important challenges. The high molecular weight and hydrophilic nature of many peptides limit their passive diffusion across the cell membrane, which forces them to pass through the gaps in the paracellular space (1−5 nm) [7]. Moreover, in the gastrointestinal tract (GIT), insulin absorption after oral administration is hampered by some pharmacokinetic challenges due to acidic gastric pH and the presence of digestive enzymes [3]. Insulin oral delivery has been investigated using some strategies to address these physicochemical problems by the use of colloidal systems such as microparticles (MPs), liposomes, nanoparticles, and microemulsions, just to mention a few [8]. Among these carriers, MPs have been proposed to overcome the pharmacokinetic problems associated with oral insulin delivery since they prevent peptide degradation in the acidic environment, prolong residence time, increase drug absorption, and promote controlled release, resulting in a better therapeutic response and patient compliance. MP delivery systems are usually formulated by encapsulation of the desired drug using a suitable inert polymeric carrier [9].
Within this context, a suitable biopolymer with mucoadhesive properties can be used as an enclosing carrier in MP preparation in order to enhance stability and achieve controlled release of, especially, some drugs that metabolize quickly. Mucoadhesiveness helps enhance closeness and prolong contact between drugs in polymeric carriers and their mucous surfaces, which maximizes the rate of drug absorption [10]. Such delivery systems confer significant advantages, particularly for drugs that are unstable in the GIT. In this context, we recently developed a polyethylene glycol (PEG)/mucin system for oral delivery of metformin hydrochloride, where PEG acts as an adhesion enhancer [11]. Regarding the other component of this system, mucins are a family of high-molecular-weight glycosylated proteins produced by epithelial tissues in most animals, being the major structure-forming component of the viscoelastic mucus [12,13]. These glycoconjugates have gained increasing attention from researchers working on drug delivery as a biocompatible modifier for a variety of enzymes and proteins, enhancing their mucoadhesiveness [14,15]. Additionally, improved in vivo retention time and a reduction in toxicity, antigenicity, and immunogenicity are also advantages provided by the use of mucins in drug delivery systems.
Thus, based on the above-mentioned reports, we hypothesized that a polymeric drug carrier based on blends of mucin and PEG could be advantageous for insulin delivery due to the biocompatible, biodegradable, and protective nature of these polymers. As compared to previous reports on MP-based formulations [16], PEG/mucin-based MPs offer a competitive advantage for insulin protection in an acidic medium due to the PEG component. Moreover, the mucin is resistant to proteolytic enzymes and improves mucoadhesion to the mucosal wall, which leads to an increase in the residence time in the GIT [14,17]. Consequently, the main objective of this study was to develop MPs based on snail mucin and PEG-4000 coated with Eudragit RS100, a pH-sensitive polymer, to facilitate the encapsulation of insulin in the core of the MPs. Additionally, the ability of the MPs to enhance the intestinal bioavailability of insulin was also evaluated in vivo in diabetic rats.

2. Materials and Methods

2.1. Materials

Human insulin (Humulin) was obtained from Elly Pharm. Ltd., India; Eudragit® RS 100 from Evonik, Darmstadt, Germany; and acetone from BDH. Purified and deionized water was obtained from the Department of Pharmaceutics, University of Nigeria, Nsukka. Mucin was extracted using acetone as described by Adikwu and co-workers [13]. Wistar rats were obtained from the Department of Veterinary Medicine, University of Nigeria, Nsukka. All other chemicals and solvents used in this study were of analytical grade and used without further purification.

2.2. Preparation of Empty MPs

Polymeric MPs were prepared at five different ratios of mucin to polyethylene glycol (1:1, 1:2, 1:3, 1:4, and 1:5), as described in Table 1. Approximately 10 g of mucin and 10 g of PEG-4000 were dispersed separately in 40 mL of distilled water to obtain a homogenous dispersion and were allowed to stand for 24 h. The solution of PEG-4000 was gradually added to the mucin dispersion and dispersed using a Silverson L4R mixer (Silverson Machines Ltd, Waterside, England), affording a homogeneous mixture. Both dispersions were added gradually into a 250 mL container containing 20 mL of soft liquid paraffin. The resulting mixture was subsequently subjected to homogenization using an ultrasonic probe sonicator (Model: ATP 500, Mumbai, India) at 50 Watt for 10 min in an ice bath. The so-formed MPs were then recovered through filtration using a millipore filter. Thereafter, the MPs were washed several times with cold acetone to remove any trace of liquid paraffin. The recovered MPs were dried in a desiccator and stored in airtight containers for further studies. The same procedure was repeated for all other batches and coded A0–A5 (Table 1).

2.3. Coating of the MPs

The coating of the MPs was carried out following the procedure reported in the literature [14,18,19,20] with slight modifications. In brief, a 2.0% solution of Eudragit® RS-100 in dichloromethane was freshly prepared, and MPs (5.0 g) were gently dispersed and shaken for about 3 min in the corresponding coating solution. The so-formed coated MPs were recovered by filtration using a filter tube (Advantec Toyo Kaisha, Ltd., Tokyo, Japan) and dried by flushing cold air. This procedure was repeated five times; then, the coated MPs were recovered, air dried, and stored in an airtight bottle for further studies.

2.4. Loading of Insulin in MPs

A diffusion method was employed for loading insulin into the MPs and to prevent the disruption of the insulin structure during the mixing and homogenization steps. Specifically, coated MPs (5.0 g) were placed in a beaker, and insulin solution (15 mL of a 100 IU/mL solution) was added. The MPs were allowed to hydrate by interaction with the insulin solution for 20 min. The hydrated MPs were then recovered and subsequently freeze-dried for 12 h. Thereafter, the resultant insulin-loaded MPs were stored in airtight screw-capped bottles and stored at 5 °C for further use. The same procedures were employed for batches A1–A5, while batch A0 was prepared in the absence of insulin and served as a negative control.

2.5. Characterization of Insulin-Loaded MPs

2.5.1. Thermal Analysis

The melting transitions and changes in heat capacity of the batches of insulin-loaded MPs were determined using a Netzsch differential scanning calorimeter (DSC), model DSC 204 F1 (Erich NETZSCH GmbH & Co. Holding KG, Selb, Germany). Each sample (ca. 3–5 mg) was weighed into a hermetically sealed aluminum pan, and the thermal properties were determined within the range 20–400 °C at a heating rate of 10 K/min under a 20 mL/min nitrogen flux. Baselines were determined using an empty pan, and all the thermograms were baseline-corrected.

2.5.2. Recovery Values of Insulin-Loaded MPs

The amount of MPs recovered from the formulation was calculated using Equation (1), while the recovery rate was estimated using Equation (2):
%   Recovery = W 1 W 2 + W 3 × 100  
where W1 is the weight of the MPs (g), W2 is the amount of insulin (g), and W3 is the amount of carrier and additives (g).
Recovery   rate   ( % ) = Amount   recovered Original   amount × 100

2.5.3. Encapsulation Efficiency (EE) and Drug Loading (DL) of Insulin-Loaded MPs

Each batch of insulin-loaded MPs (10 mg) was dispersed in phosphate buffer (10 mL, pH 7.4) and was placed into a microconcentrator (5000 MWCO Vivascience, Hanover, Germany). The mixtures were centrifuged (TDL-4 B. Bran Scientific and Instru. Co., London, England), for 120 min at 1500 rpm, and the supernatants were assayed using a spectrophotometric method. The percentage of insulin encapsulated in the MPs was obtained with reference to a standard Beer’s plot of pure insulin and drug loading using Equations (3) and (4), respectively.
Encapsulation   efficiency = Actual   drug   content Theoretical   drug   content × 100
Drug   loading = Amount   of   drug   encapsulated Weight   of   the   formulation × 100

2.5.4. Morphology and Particle Size Evaluations

The morphology of the MPs was determined using scanning electron microscopy (SEM) (JEOL-6500F, Tokyo, Japan) under an accelerated voltage of 4 KV and a working distance of 6 mm. Briefly, a drop of sample dispersion was spread onto a metal slab, and the excess droplets were removed using filter paper. The samples were then coated in a cathode evaporator with a fine carbon layer and observed by SEM.
The mean particle size and distribution of the insulin-loaded MPs were analyzed using a microscopic imaging analysis principle, employing a polarized light microscope (Leica Microsystems GmbH, Wetzlar, Germany) with a Motic image analyzer attachment (Moticam, Fujian, China). All tests were carried out in triplicate and the results were averaged.

2.6. In Vitro Release Study

The in vitro release profiles of the insulin were evaluated using a dialysis membrane in acidic pH of 1.2 (HCl solution) or in pH phosphate buffer solution as a release medium to simulate the gastric juice and intestinal juice of the gastrointestinal environment, respectively. Herein, insulin-loaded MPs (50 mg) were enclosed in a dialysis membrane tubing (80–100 kDa, Spectrum Laboratories Inc., Lorzweiler, Germany) end-to-end secured with a thread to avoid leakage of the content. Thereafter, the membrane containing insulin MPs was suspended in 200 mL of HCl solution (pH 1.2) or phosphate buffer solution (pH 7.4) in a beaker mounted on a magnetic stirrer set at 50 rpm and maintained at 37 ± 1 °C. At different time intervals, aliquots of release medium (5 mL) were withdrawn and replaced with the same volume of fresh medium to maintain sink conditions. The withdrawn samples were filtered and analyzed by UV–visible spectrophotometry at 271 nm. The amount of insulin released was calculated using the standard calibration curve for insulin. The experiments were done in triplicate and the results were averaged.

2.7. Antidiabetic Study

Wistar albino rats with an average weight of 160 g were purchased from the animal house of the Department of Pharmacology and Toxicology, University of Nigeria, Nsukka, and were allowed to acclimatize in laboratory conditions for 7 days before the experimental procedures. Prior to animal studies, the ethical animal procedures were obtained from the institutional ethics department and the reference number DOR/UNN/17/00014 was assigned. The ethical principle is in line with the approved standard [21,22]. Before starting the experiments, the animals were fasted for 12 h but allowed free access to water.

2.7.1. Induction of Diabetes

Albino male rats with average weight 160 g were fasted for 12 h before the initiation of diabetes. Diabetes was elicited with intraperitoneal administration of 0.5 mL alloxan monohydrate prepared with normal saline (0.9% NaCl) at a dose of 200 mg/kg. The blood glucose levels were monitored for 72 h using an Accu-Check digital glucose meter (F. Hoffmann-La Roche AG, Basel, Switzerland) for all the rats until the induction and stabilization of a diabetic state. Parameters such as urinary urgency and weight loss were monitored for 5–7 days post-administration. Rats with elevated blood glucose levels of ≥100 mg/dL along with other signs of diabetes were enlisted in this investigation.

2.7.2. Antidiabetic Efficacy of Insulin-Loaded MPs

Batch A5 (mucin/PEG-4000 ratio of 1:5) was selected for this evaluation due to the maximum in vitro insulin release and high encapsulation efficiency observed for this batch. Twenty-five diabetic rats were randomly divided into five groups (five rats per group) and caged separately. The groups were treated as follows:
-
Group 1: received orally 50 IU /kg of batch A5;
-
Group 2: received orally 50 IU/kg of pure insulin solution;
-
Group 3: received subcutaneously 5 IU/kg of insulin;
-
Group 4: received orally 5 mL/kg of water;
-
Group 5: received 50 mg/kg of batch A0 (blank).
Groups 3 and 4 served as positive and negative controls, respectively. All the oral administrations were done using a gastric nasal tube. At predetermined time intervals, blood samples were collected from the marginal tail of the rats for 24 h post-administration and the blood glucose levels were checked using a glucometer (Accu-Check, Switzerland).
The serum enzymes were determined by using commercially available kits according to the manufacturers’ instructions.

2.8. Statistical Analysis

Data were analyzed using SPSS Version 16.0m (SPSS Inc. Chicago, IL, USA). All values are expressed as mean ± SD. Differences between means were assessed using one-way ANOVA and Student’s t-test. p < 0.05 was considered statistically significant.

3. Results and Discussion

3.1. Thermal Analysis

DSC measurements were carried out to determine the thermal properties of the MPs. According to the van’t Hoff theory, peak integration and melting temperature values are used to compare the consistency of formulations from different batches and to determine impurities that will change the melting profiles of the materials. Melting temperature is a strong indication of drug purity and therefore allows not only for a quick screening of the melting process, but also for the identification of drug populations that may be in a different conformation or interacting with an excipient, resulting in shoulder regions in the thermograms. The thermograms of insulin, mucin, and PEG-4000 showed endothermic peaks at 94.88, 95.0, and 62.4 °C, respectively (Figure S1), while batches A1–A5 showed peaks at 94.9 °C (Figure 1). In comparison, insulin and mucin presented broader peaks, while PEG-4000 showed a very sharp endothermic peak. The peaks observed for the MPs are consistent with a thermal-induced transition. PEG-4000 is a nonionic amphiphilic polymer with thermotropic phase behavior, including melting temperature and enthalpy changes, that is highly affected by the presence of mucin due to the interactions between both polymers. All insulin-loaded MPs showed endothermic peaks around the melting temperature of mucin and insulin (≈95 °C), independently of the PEG-4000 concentration. A transition peak was observed for each batch due to the solubilization of PEG into the mucin. Therefore, the thermal behavior of the matrixes depends on the interactions between the constituents, as well as their concentrations. The sharpness and symmetry of the endothermic peaks of the insulin-loaded MPs, corresponding to the mucin, are indicative of matrixes with high purity (Figure 1). Furthermore, batches A5, A4, and A3 showed sharper peaks, while batches A1 and A2 displayed slightly broader peaks, suggesting an amorphous nature for the latter. This amorphous feature was observed at lower enthalpy and less crystallinity of the matrixes, which could lead to retention of the entrapped drug over time. The reduced crystallinity may indicate imperfect lattices leading to a special pocket that can accommodate a large number of drug molecules [23]. Hence, an increase in the quantity of PEG-4000 was observed to increase the crystallinity of the formulations, the order being as follows: A5 > A4 > A3 > A2 > A1. The thermogram of batch A0 (blank) clearly showed the expected glass transition (Figure 1).

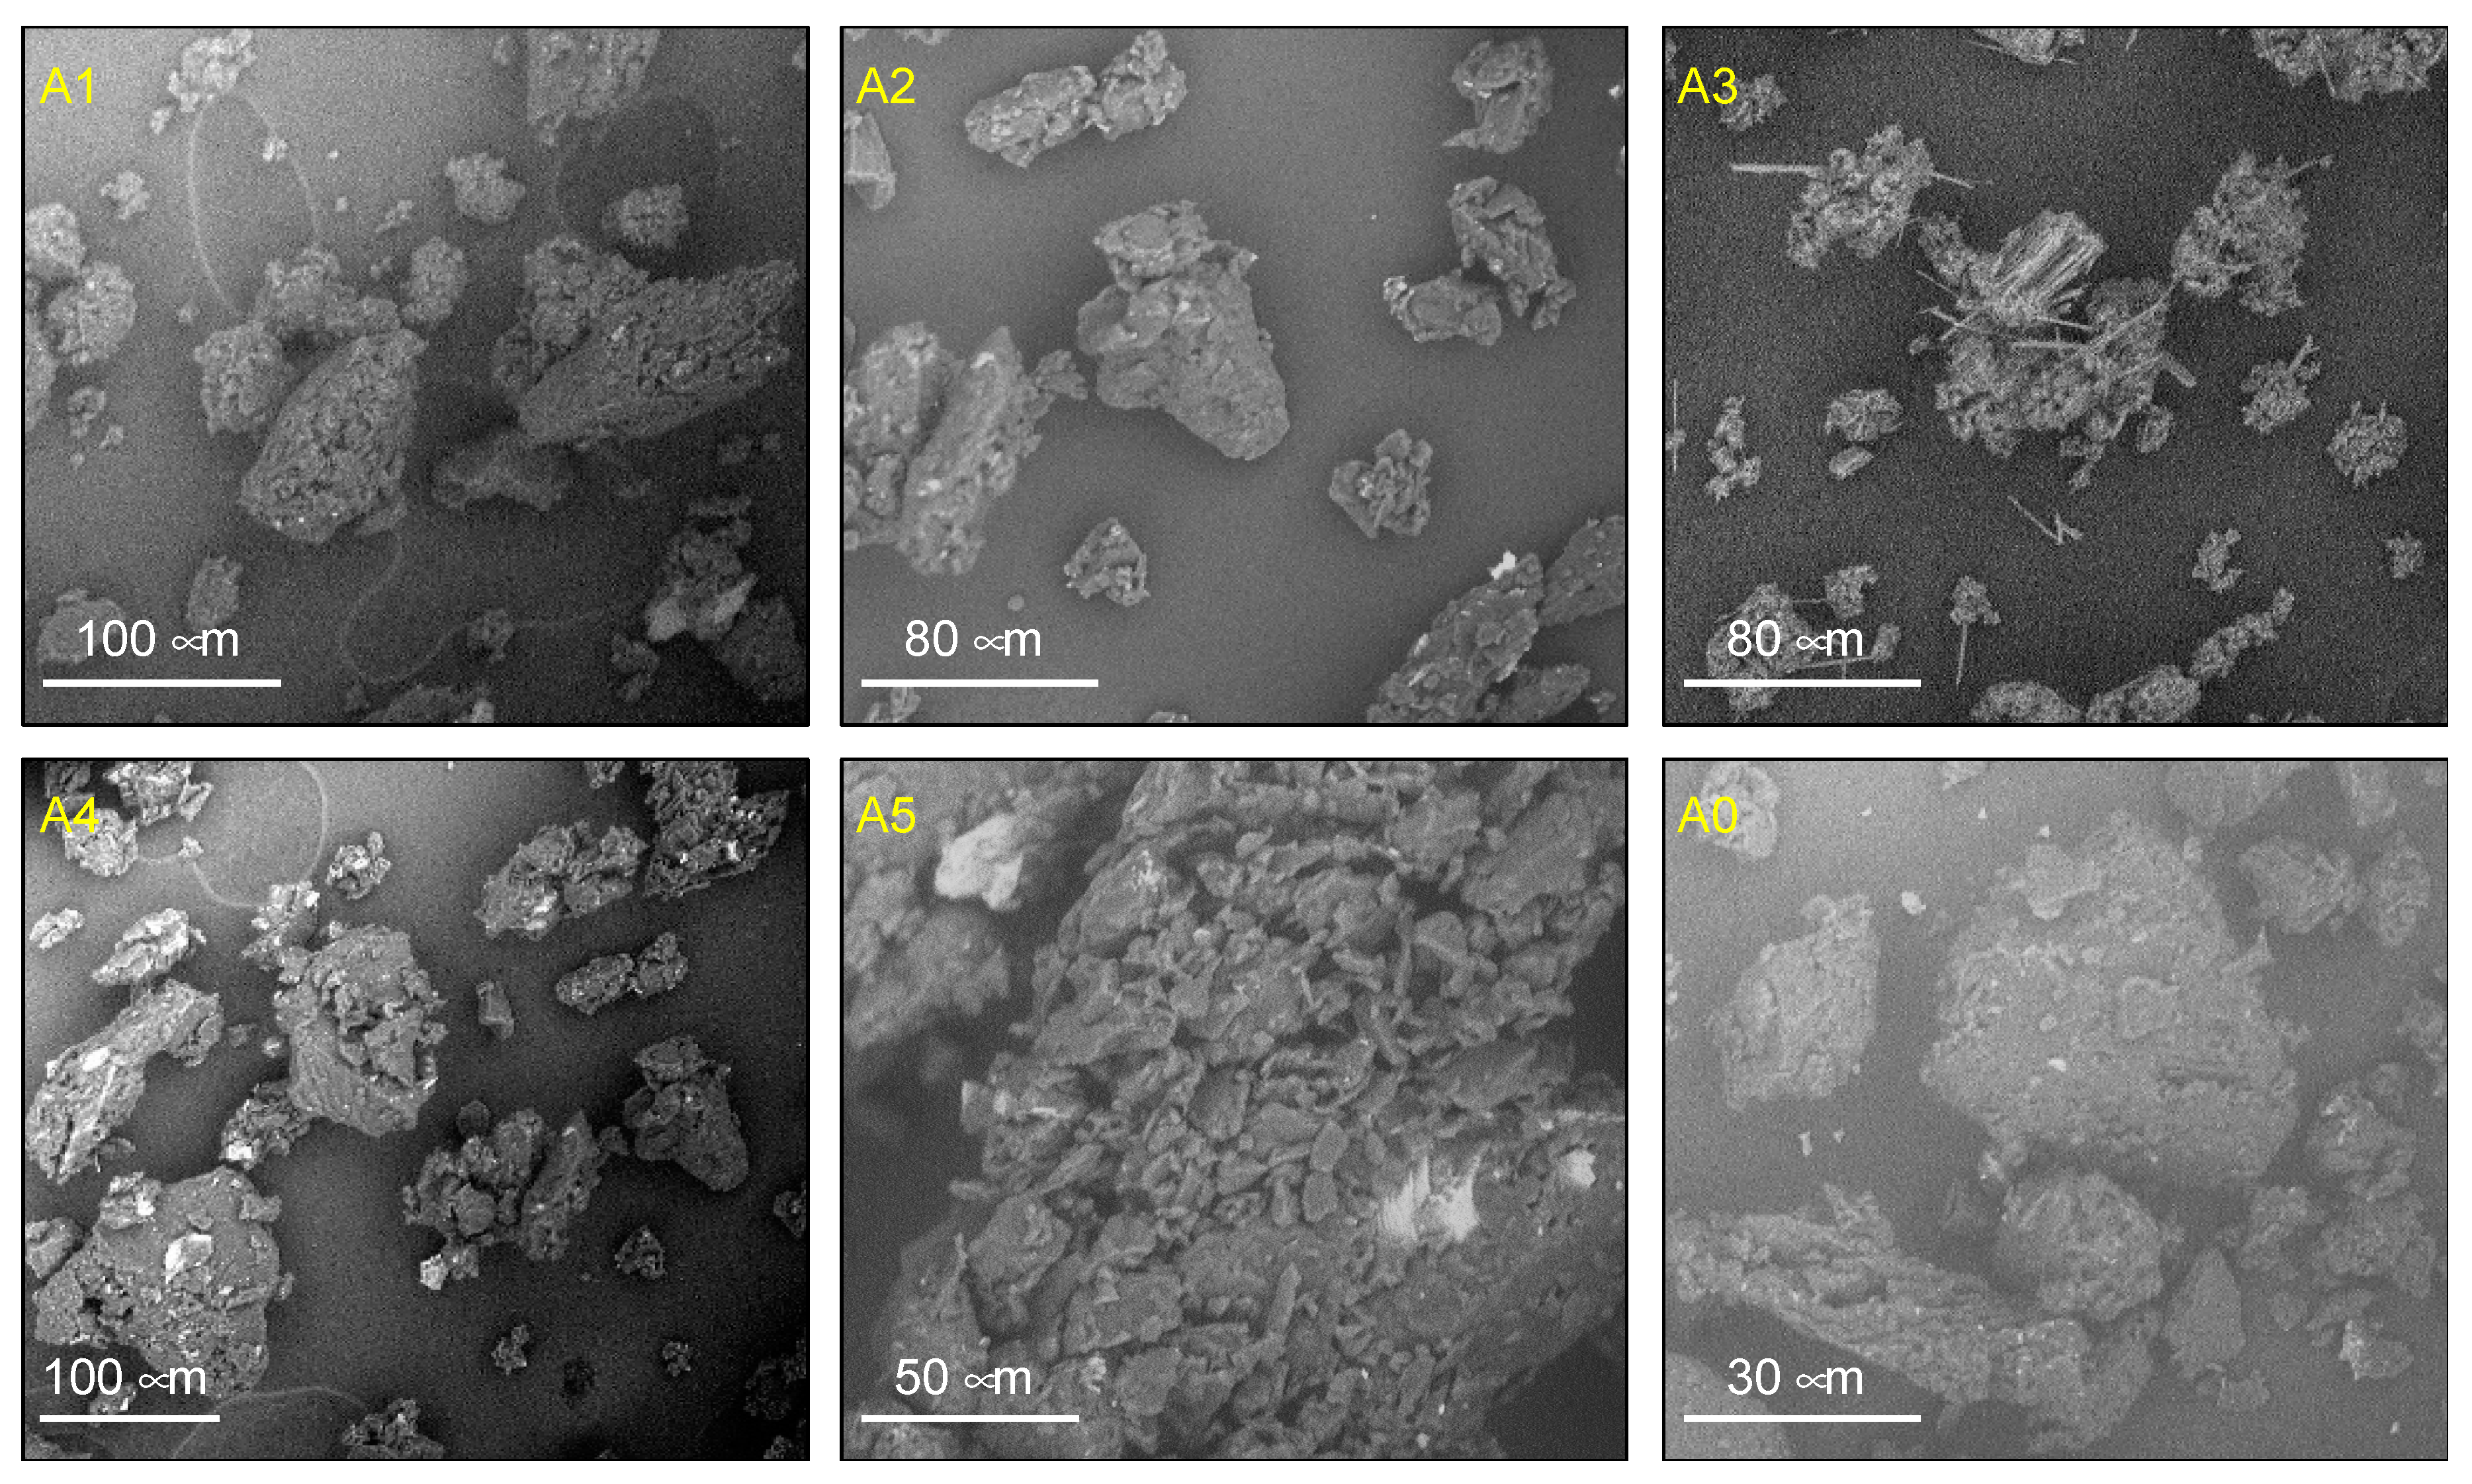
3.2. Morphology and Particle Size of Insulin-Loaded MPs

The morphologies of the MPs were studied by scanning electron microscope (SEM). Several studies have demonstrated that the morphology and pore size of matrixes intended for drug delivery play an important role in the control of the release kinetics [11]. SEM images of batches A1 and A2 revealed small nonspherical particles that clumped together and mixed with little needle-like crystals (Figure 2). The morphology of batch A3 was characterized by large lumpy crystals, while mixtures of lumpy and small crystals were identified in batches A4 and A5 (Figure 2). In general, the MPs showed rough porous surfaces and irregular shapes. Batches A1 and A2 had almost identical morphologies with agglomerated particles, while batches with higher concentration of PEG-4000 (i.e., batches A3–A5) showed a clearer distribution of small and large MPs.
Moreover, particle size may be affected by one or more factors, including, among others, the degree of homogenization, homogenization speed, composition ratio, rate of particle size growth, and crystal habit of the particle [24]. During Ostward ripening, the particles tend to move towards one another, which leads to the formation of aggregates due to the kinetic advantage gain by larger crystals as a result of an increase in the concentration [23,24]. In this study, the particle size was found to increase with increasing PEG/mucin ratio. Therefore, batch A5, having the highest PEG-4000/mucin ratio, displayed a significantly (p < 0.05) higher particle size (398 ± 0.21 µm) as compared to batch A1 with a particle size of 311 ± 0.22 µm, while unloaded MPs (batch A0) showed a particle size of 276 ± 0.03 µm (Table 2). Thus, the particle size tends to increase after drug loading due to the intensification of interparticle attractive interactions (van der Waals forces) leading to particle aggregation.

3.3. Encapsulation Efficiency, Drug Loading, and Recovery Yield of MPs

Encapsulation efficiency (EE) is defined as the ratio between the weight of entrapped drug and the total original weight of the drug, while drug loading (DL) is defined as the ratio between the amount of entrapped drug and the total weight of the matrix [25]. The nature and concentration of the carrier, the formulation technique, and the nature of the active pharmaceutical ingredient are some of the factors that influence the EE and DL of MPs. The insulin-loaded MPs showed EE, DL, and recovery values (RV) that ranged over 81%–92%, 18%–39%, and 75%–89%, respectively (Table 2). These encouraging values were attributed to the method used for the inclusion of insulin; the insulin was not incorporated during the homogenization step because this could lead to degradation, as has been observed for protein drugs subjected to high homogenization forces [7]. The observed high EE% is ascribed to a high adsorption capacity for insulin in these polymeric matrixes. Additionally, an increase in PEG-4000 concentration caused increases in the EE, DL, and RV (e.g., see batch A5 vs. A1) (Table 2). The recovery values (RV) of batches loaded with insulin MPs ranged from 75% to 89%, being much higher than that of the unloaded batch A0 (66.5%). This could be attributed to good adsorption of insulin into the polymeric MPs. Furthermore, batch A5 showed the maximum RV value of 89%, while batch A1 and unloaded batch A0 displayed RV values of 75% and 66%, respectively. Hence, the recovery values increased with drug loading, which is in good agreement with the observations made in previous studies [26].

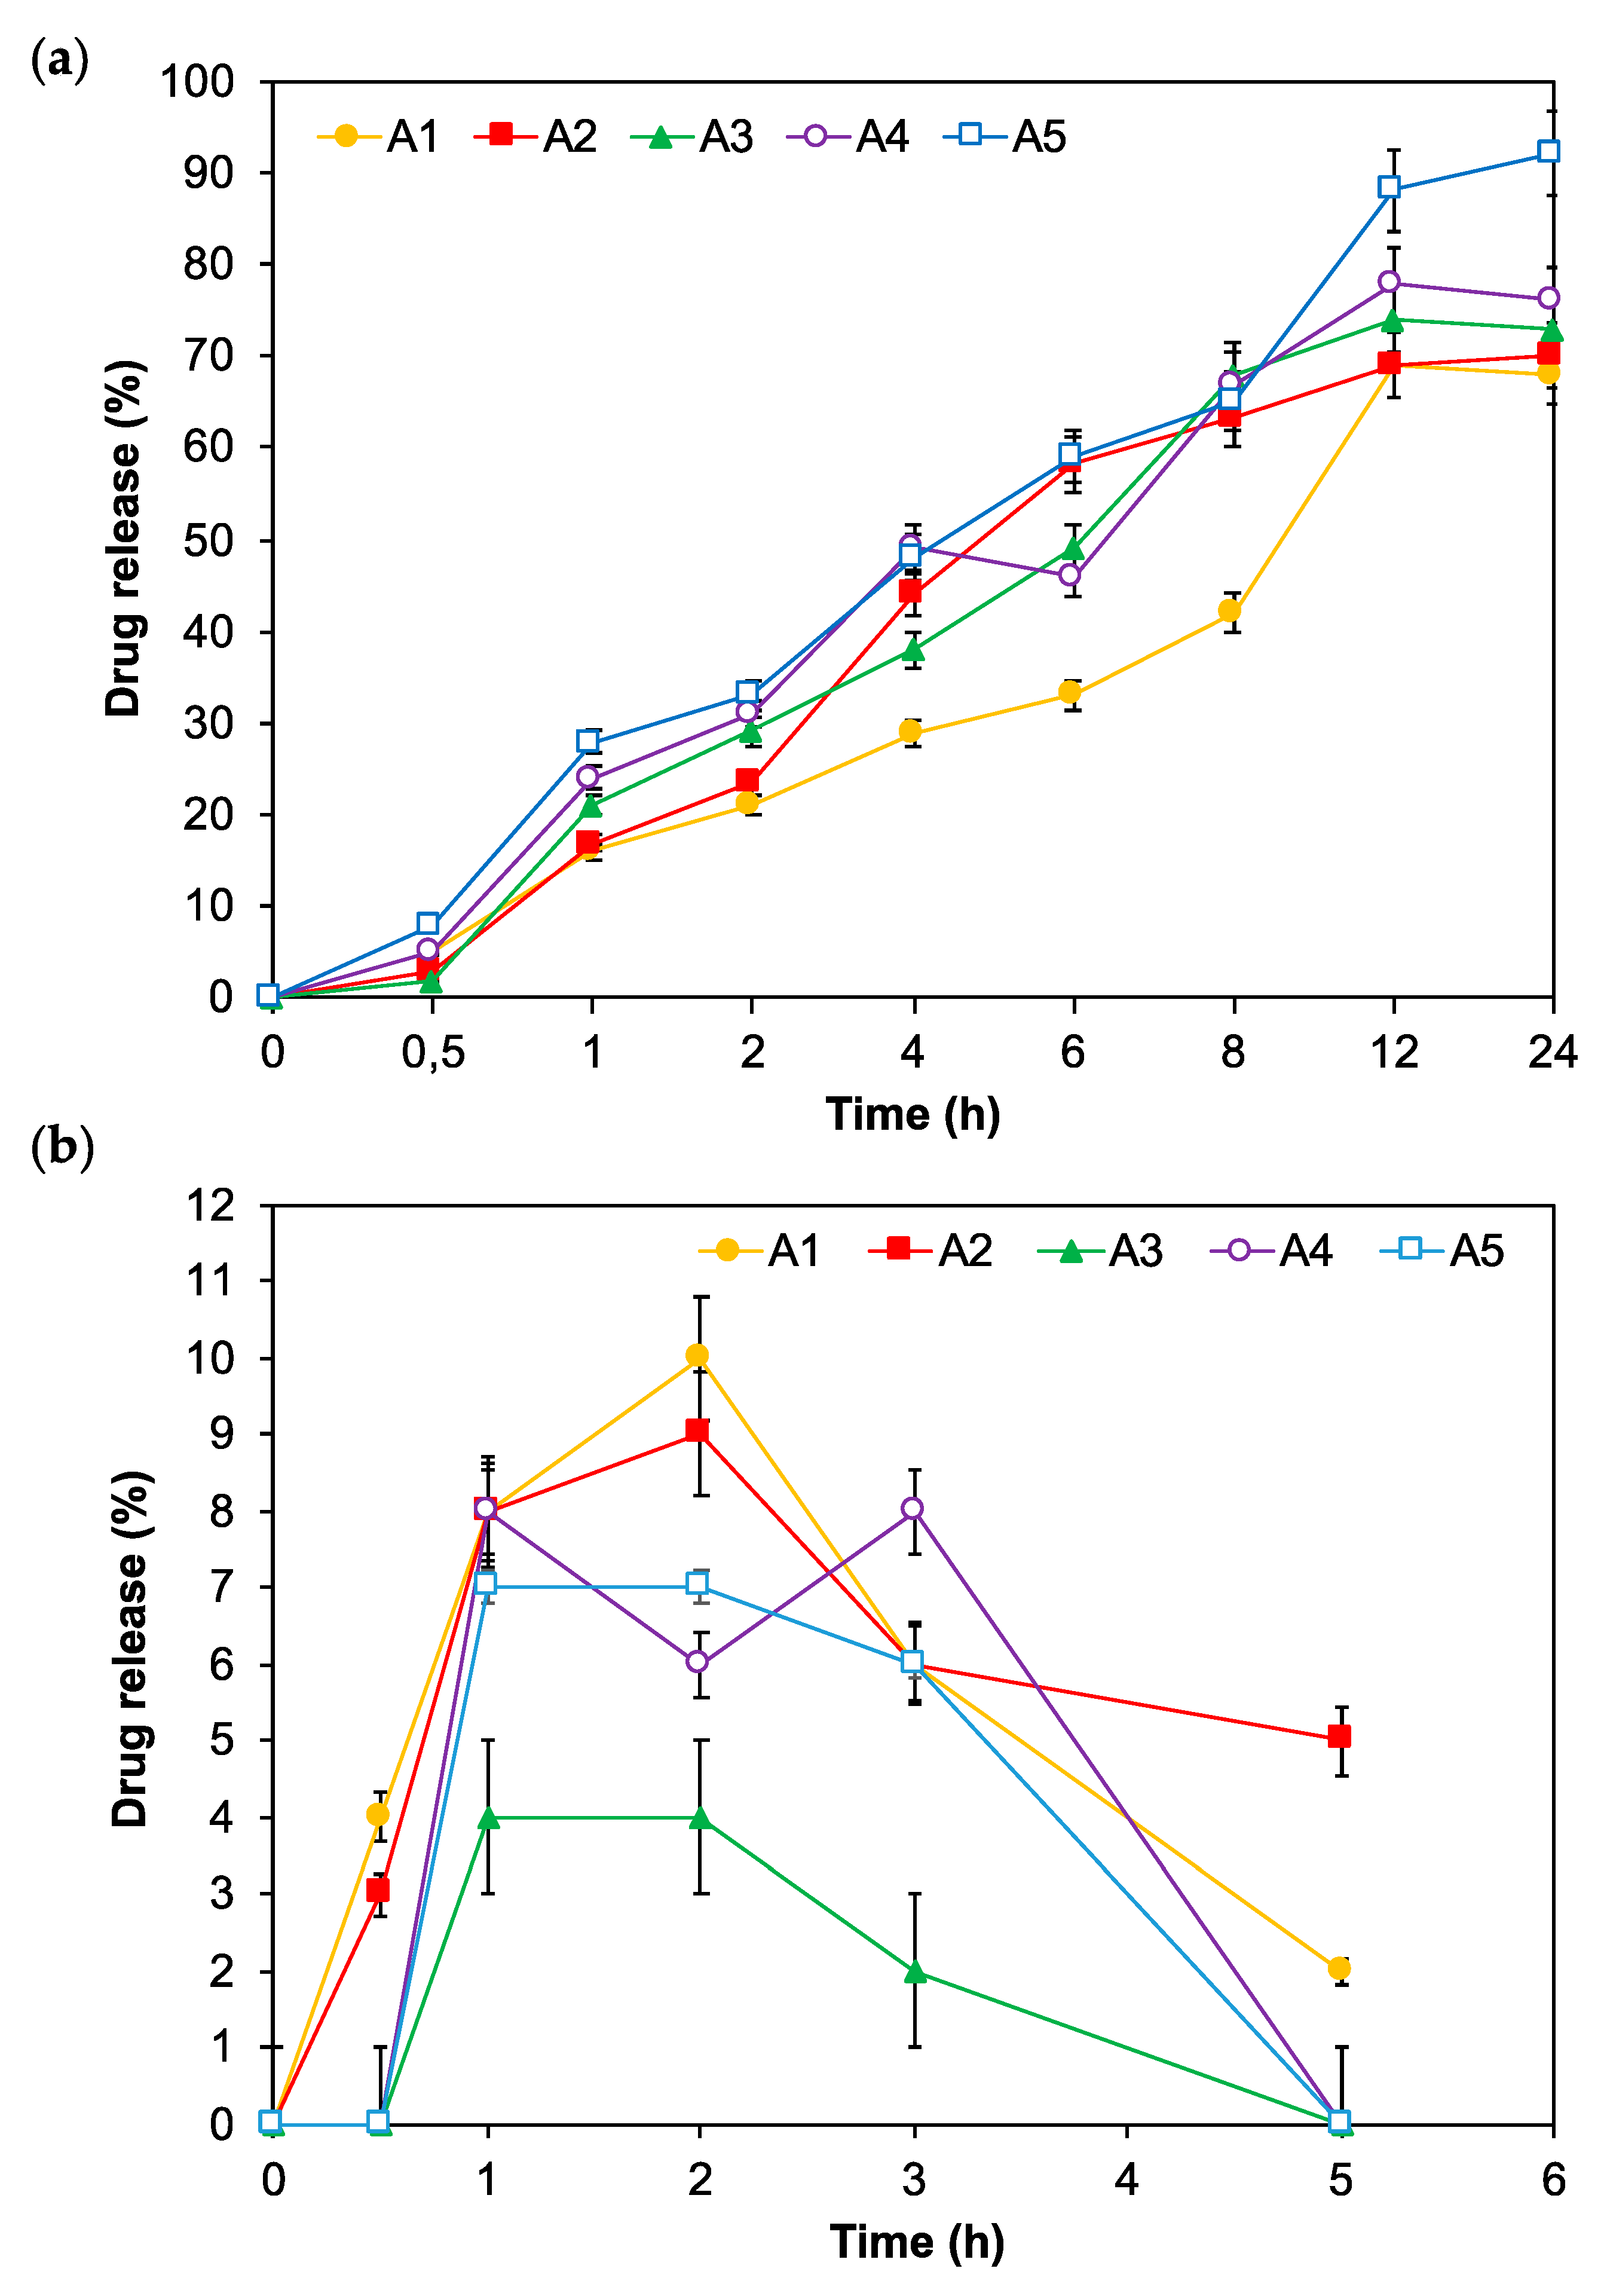
3.4. In Vitro Release of Insulin-Loaded MPs

Figure 3 shows the cumulative release of insulin from the MPs at pH 1.2 and pH 7.4. All formulations showed a gradual release of insulin. Interestingly, there was a minor release of insulin (>12%) at pH 1.2 (Figure 3a), indicating that the MPs coated with Eudragit RS-100 resisted dissolution in the acidic medium, thereby preventing the expulsion of the entrapped insulin. The slight amount of insulin observed in this case could be the result of insulin molecules physically adhered to the surface of the MPs.
Interestingly, higher release of insulin was observed at pH 7.4 (Figure 3b), as compared to the release in acidic medium. Maximum and minimum release were observed in batch A5 (92%) and batch A1 (68%), respectively. The results showed a strong dependence between the insulin release and the PEG concentration used in the formulation. For instance, batch A1 (mucin/PEG = 1:1) showed low release compared to A5 (mucin/PEG = 1:5). This can be correlated to the viscoelastic behavior of the formulation provided by the mucin component, which would create better adherence to the gastrointestinal mucosal wall, resulting in increased drug residence time, site-targeted drug release, and improved drug bioavailability. Furthermore, the mucous gel layer has been shown to have a mean turnover time that varies between 47 and 270 min; this is an important parameter in designing mucoadhesive drug delivery systems [27,28]. It has been noted that the mucous aqueous gel layer blocks drug diffusion and adsorption through the epithelium. The insulin release kinetics followed the order A1 > A2 > A3 > A4 > A5. The maximum drug release observed for the MPs with the highest PEG concentration was ascribed to the capability of PEG chains to disseminate across the mucus and facilitate drug solubilization. This resulted in faster release at the absorption site compared to that of mucin, which is good agreement with previous reports [29]. From the extrapolation of the graph, the T40 (i.e., the time taken to release 40% of the drug) values of batch A1, A2, A3, A4, and A5 MPs were 8, 4, 5, 4, and 4 h, respectively. This was in agreement with the significantly delayed release and higher retention time of batch A1 compared to the other batches.

3.5. In Vivo Antidiabetic and Toxicological Studies

Alloxan was used to induce a hyperglycemic condition in the male rats. Alloxan is a diabetogenic chemical substance that inactivates the β cells of the pancreases, eliciting insulin deficiency without affecting other islet types [30]. The results of the blood glucose reduction test, presented in Figure 4, indicate that insulin-loaded MPs (Group 1) displayed a more pronounced and significant (p < 0.05) blood glucose decrease, from 100 mg/dL to 48 mg/dL post-administration, compared to other samples. This is an indication that the MPs were able to provide protection to the insulin and effectively deliver it to the absorption site in vivo. A dose of 50 IU/Kg has been reported to have a similar effect to a higher dose (100 IU/Kg) with a minimum blood glucose level of 55%, and is thus taken as an effective therapeutic dose to saturate the insulin absorption sites [31]. Group 2, which received pure insulin by oral administration, showed minor hypoglycemia when compared to the group receiving insulin-loaded MPs, indicating that no significant absorption occurred in this group. This small hypoglycemia effect may be due to a small fraction of insulin being directly absorbed through the intestinal wall [32]. Such direct insulin absorption occurs at specific insulin receptors located in intestinal enterocytes [33] and undergoes rapid internalization by the epithelial cells through the interstitial space, ending up in the blood stream. The upper intestinal area has been reported to be the most active area of insulin absorption during fasting conditions [30]. Furthermore, no apparent blood glucose reduction was observed in the groups that received water (negative control, Group 4) or placebo (Group 5). In contrast, Group 3, which received a subcutaneous insulin injection, showed the highest glucose reduction level 2 h after administration. After this time, the glucose level increased again beyond normal levels, unlike in Group 1, where the level was maintained after reaching the highest glucose reduction. This result is an indication that subcutaneous insulin will require multiple doses to stabilize the patient within 12 h.
Toxicological evaluations of the formulations were based on enzymes such as aspartate transaminase (AST) or serum glutamic oxaloacetic transaminase (SGOT), alanine transaminase (ALT) or serum glutamic pyruvic transaminase (SGPT), and alkaline phosphatase (ALP). These enzymes are found mainly in the liver, red blood cells, heart, kidneys, and pancreas, being useful biomarkers for the diagnosis of injured body tissues, particularly in organs such as heart and liver [34,35]. It has been demonstrated that the more AST and ALT are released into the bloodstream, the more tissues are damaged [36]. The results obtained for our formulations showed that the quantities of these enzyme markers (i.e., SGPT, SGOT, ALP) in the serum were within the established reference values (Table 3). In addition, no significant variation from the control batch (water) was observed. Overall, these values suggest that the constituents of the insulin-loaded MPs are safe with no hepatotoxic effects.

4. Conclusions

In conclusion, despite great progress in the knowledge on insulin oral delivery using polymeric systems, there are still some limitations with respect to the stability and toxicity of the formulations. In this work, we demonstrated that insulin-loaded PEG-4000/mucin MPs can help to overcome some of these challenges. Such MPs display a smooth nonspherical morphology and can be prepared with more than 81% encapsulation efficiency via an emulsification–coacervation method followed by drug diffusion. The developed formulations exhibited good physicochemical performance and bioactivity. In vitro release studies at intestinal pH revealed significant insulin release, while maximum insulin was found to be retained within the MPs at stomach acid pH. Specifically, insulin-loaded MPs prepared with a 1:1 mucin/PEG ratio exhibited the highest prolonged drug release, while MPs containing higher PEG concentrations displayed faster drug release. Thus, insulin release was tuned within a range of 68%–92%. Furthermore, insulin-loaded MPs significantly (p < 0.05) reduced the blood glucose level to 62 mg/dL after oral treatment. The blood glucose reduction effect was higher in animals that received orally administered insulin-loaded MPs than in those that were treated with insulin solution administered orally as a negative control. Interestingly, insulin-loaded MPs exhibited maximum glucose level reduction after 6 h, which was equivalent to that observed in the case of conventional subcutaneously administered insulin. Finally, no hepatotoxicity was observed after oral administration of insulin-loaded MPs. These results indicate that the use of insulin-loaded MPs based on the combination of PEG-4000 and mucin, without the use of organic crosslinkers, may be a promising alternative approach for diabetes treatment. Further pharmacokinetic studies to fully evaluate the potential of these polymeric carriers are underway in our laboratories, and the results will be published in due course.

Supplementary Materials

The following are available online at https://www.mdpi.com/2076-3417/10/8/2649/s1, Figure S1: DSC thermograms of mucin (top), insulin (middle), and PEG-4000 (bottom).

Author Contributions

Conceptualization, M.A.M.; Formal analysis, D.D.D.; Funding acquisition, M.A.M. and D.D.D.; Investigation, M.A.M., U.E.C., N.A., K.C.F., A.O.M., M.U., B.A., O.Y.J., K.C.O., A.A.A. and E.C.I.; Supervision, M.A.M.; Writing—original draft, M.A.M., K.C.O., A.A.A. and E.C.I.; Writing—review and editing, D.D.D. All authors have read and agreed to the published version of the manuscript.

Funding

This study was funded by the Tertiary Education Trust Fund (TETFUND)–National Research Fund (NFR) of Nigeria with grant number TETFUND/DESS/NRF/STI/13/VOL.1.

Acknowledgments

Momoh is very grateful to the Classical and Biomedical Laboratory (Nsukka), InterCEDD Centre (Nsukka), and Projex Biomedical Laboratory (Nsukka). We are very thankful to Isa Yakubu, from the Department of Chemical Engineering at the Ahmadu Bello University Zaria, for assisting with thermal characterization of the materials. David Díaz Díaz thanks the Deutsche Forschungsgemeinschaft (DFG) for the Heisenberg Professorship Award and the Spanish Ministry of Science, Innovation and Universities for the Senior Beatriz Galindo Award (Distinguished Researcher).

Conflicts of Interest

The authors declare no conflict of interest.

References

  1. Sah, S.P.; Singh, B.; Choudhary, S.; Kumar, A. Animal models of insulin resistance: A review. Pharmacol. Rep. 2016, 68, 1165–1177. [Google Scholar] [CrossRef] [PubMed]
  2. Whiting, D.R.; Guariguata, L.; Weil, C.; Shaw, J. IDF Diabetes atlas: Global estimates of the prevalence of diabetes for 2011 and 2030. Diabetes Res. Clin. Pract. 2011, 94, 311–321. [Google Scholar] [CrossRef] [PubMed]
  3. Fonte, P.; Araújo, F.; Silva, C.; Pereira, C.; Reis, S.; Santos, H.A. Polymer-based nanoparticles for oral insulin delivery: Revisited approaches. Biotechnol. Adv. 2014, 33, 1342–1354. [Google Scholar] [CrossRef] [PubMed]
  4. Rolla, A.R.; Rakel, R.E. Practical approaches to insulin therapy for type 2 diabetes mellitus with premixed insulin analogues. Clin. Ther. 2005, 27, 1113–1125. [Google Scholar] [CrossRef]
  5. Sastry, S.V.; Nyshadham, J.V.; Fix, J.A. Recent technological advances in oral drug delivery—A review. Pharmaceut. Sci. Tech. Today 2000, 3, 138–143. [Google Scholar] [CrossRef]
  6. Yaturu, S. Insulin therapies: Current and future trends at dawn. World J. Diabetes 2013, 4, 1–7. [Google Scholar] [CrossRef]
  7. Builders, P.F.; Kunle, O.O.; Adikwu, M.U. Preparation and characterization of mucinated agarose: A mucin-agarose physical crosslink. Int. J. Pharm. 2008, 356, 174–180. [Google Scholar] [CrossRef]
  8. Elsayed, A.; Remawi, M.A.; Qinna, N.; Farouk, A.; Badwan, A. Formulation and characterization of an oily-based system for oral delivery of insulin. Eur. J. Pharm. Biopharm. 2009, 73, 269–279. [Google Scholar] [CrossRef]
  9. Huang, Y.J.; Wang, C.H. Pulmonary delivery of insulin by liposomal carriers. J. Control Release 2006, 113, 9–14. [Google Scholar] [CrossRef]
  10. Pothal, R.K.; Sahoo, S.K.; Chatterjee, S.; Sahoo, D.; Barik, B.B. Preparation and evaluation of mucoadhesive microcapsules of theophylline. Ind. Pharm. 2004, 3, 74–79. [Google Scholar]
  11. Momoh, M.A.; Adedokun, M.O.; Adikwu, M.U.; Kenechukwu, F.C.; Ibezim, E.C.; Ugwoke, E.E. Design, characterization and evaluation of PEGylated-mucin for oral delivery of metformin hydrochloride. Afr. J. Pharm. Pharmacol. 2013, 7, 347–355. [Google Scholar]
  12. Mortazavi, S.A.; Carpenter, B.G.; Smart, J.D. Comparative study on the role played by mucus glycoprotein in the rheological behaviors of the mucoadhesive/mucosal interaction. Int. J. Pharm. 1992, 94, 195–201. [Google Scholar] [CrossRef]
  13. Adikwu, M.U.; Aneke, K.O.; Builders, P.F. Biophysical properties of mucin and its use as a mucoadhesive agent in drug delivery: Current development and future concepts. Nigerian J. Pharm. Res. 2005, 4, 60–69. [Google Scholar]
  14. Builders, P.F.; Kunle, O.O.; Okpaku, L.C.; Builders, M.I.; Attama, A.A.; Adikwu, M.U. Preparation and evaluation of mucinated sodium alginate microparticles for oral delivery of insulin. Eur. J. Pharm. Biopharm. 2008, 70, 777–783. [Google Scholar] [CrossRef]
  15. Momoh, M.A.; Kenechukwu, F.C.; Ernest, O.C.; Oluseun, A.; Abdulmumin, B.; Youngson, D.C.; Kenneth, O.C.; Anthony, A.A. Surface-modified mucoadhesive microparticles as a controlled release system for oral delivery of insulin. Heliyon 2019, 5, e02366. [Google Scholar]
  16. Li, L.; Yang, L.; Li, M.; Zhang, L. A cell-penetrating peptide mediated chitosan nanocarriers for improving intestinal insulin delivery. Carbohydr. Polym. 2017, 174, 182–189. [Google Scholar] [CrossRef]
  17. Momoh, M.A.; Emmanuel, O.C.; Onyeto, A.C.; Darlington, Y.; Kenechukwu, F.C.; Ofokansi, K.C.; Attama, A.A. Preparation of snail cyst and PEG-4000 composite carriers via PEGylation for oral delivery of insulin: An in vitro and in vivo evaluation. Trop. J. Pharm. Res. 2019, 18, 919–926. [Google Scholar]
  18. Builders, P.F.; Ibekwe, N.; Okpaku, L.C.; Attama, A.A.; Kunle, O.O. Preparation and characterization of mucinated cellulose microparticles for therapeutic and drug delivery purposes. Eur. J. Pharm. Biopharm. 2009, 72, 34–41. [Google Scholar] [CrossRef]
  19. Chawla, A.; Sharma, P.; Pawar, P. Eudragit S-100 coated sodium alginate microspheres of naproxen sodium: Formulation, optimization and in vitro evaluation. Acta Pharm. 2012, 62, 529–545. [Google Scholar] [CrossRef]
  20. Ramasamy, T.; Ruttala, H.B.; Shanmugam, S.; Umadevi, S.K. Eudragit-coated aceclofenac-loaded pectin microspheres in chronopharmacological treatment of rheumatoid arthritis. Drug Deliv. 2013, 20, 65–77. [Google Scholar] [CrossRef]
  21. Bin, X.; Guohua, J.; Weijiang, Y.; Depeng, L.; Yongkun, L.; Xiangdong, K.; Juming, Y. Preparation of poly(lactic-co-glycolic acid) and chitosan composite nanocarriers via electrostatic self assembly for oral delivery of insulin. Mater. Sci. Eng. C 2017, 78, 420–428. [Google Scholar]
  22. European Community, Council Directive on the Ethics of Experiments Involving Laboratory Animals (86/609/EEC). 2003. Available online: http://data.europa.eu/eli/dir/1986/609/oj (accessed on 9 April 2020).
  23. Kenechukwu, F.C.; Umeyor, C.E.; Momoh, M.A.; Ogbonna, J.D.N.; Chime, S.A.; Nnamani, P.O.; Attama, A.A. Evaluation of gentamicin-entrapped solid lipid microparticles formulated with a biodegradable homolipid from Capra hircus trop. J. Pharm. Res. 2014, 13, 1999-1205. [Google Scholar]
  24. Attama, A.A.; Okafor, C.E.; Builders, P.F.; Okorie, O. Formulation and in vitro evaluation of a PEGylated microscopic lipospheres delivery system for ceftriaxone sodium. Drug Deliv. 2009, 16, 448–457. [Google Scholar] [CrossRef]
  25. Potta, S.G.; Minemi, S.; Nukala, R.K.; Peinado, C.; Lamprou, D.A.; Urquhart, U. Development of solid lipid nanoparticles for enhanced solubility of poorly soluble drugs. J. Biomed. Nanotech. 2010, 6, 634–640. [Google Scholar] [CrossRef] [PubMed]
  26. Momoh, M.A.; Ossai, E.C.; Omeje, C.E.; Omenigbo, O.P.; Kenechukwu, F.C.; Ofokansi, K.C.; Attama, A.A.; Olobayo, K.O. A new lipid-based oral delivery system of erythromycin for prolong sustain release activity. Mater. Sci. Eng. C 2019, 97, 245–253. [Google Scholar] [CrossRef] [PubMed]
  27. Des Rieux, A.; Fievez, V.; Garinot, M.; Schneider, Y.J. Nanoparticles as potential oral delivery systems of proteins and vaccines: a mechanistic approach. J. Control. Release 2006, 116, 1–27. [Google Scholar] [CrossRef] [PubMed]
  28. Raffaele, F.; Monica, L.; Claudio, C.; Massimo, M.; Maurizio, D.; Davide, M. Investigation of size, surface charge, PEGylation degree and concentration on the cellular uptake of polymer nanoparticles. Colloid Surf. B 2014, 123, 639–647. [Google Scholar]
  29. Kenneth, O.; Gerhard, W.; Gert, F.; Conrad, C. Matrix-loaded biodegradable gelatin nanoparticles as new approach to improve drug loading and delivery. Eur. J. Pharm. Biopharm. 2010, 76, 1–9. [Google Scholar]
  30. Abdallah, M.; Yuichi, T.; Hirofumi, T. Design and evaluation of novel pH-sensitive chitosan nanoparticles for oral insulin delivery. Eur. J. Pharm. Sci. 2011, 42, 445–451. [Google Scholar]
  31. Sarmento, B.; Veiga, F.; Ferreira, D. Development and characterization of new insulin containing polysaccharide nanoparticles. Colloids Surf. B 2006, 53, 193–202. [Google Scholar] [CrossRef] [Green Version]
  32. Ziv, E.; Bendayan, M. Intestinal absorption of peptides through the enterocytes. Microsc. Res. Tech. 2000, 49, 346–352. [Google Scholar] [CrossRef]
  33. Salatin, S.; Maleki, D.S.; Yari, K.A. Effect of the surface modification, size, and shape on cellular uptake of nanoparticles. Cell Biol. Int. 2015, 39, 881–890. [Google Scholar] [CrossRef] [PubMed]
  34. Ma, Z.; Lim, T.M.; Lim, L.Y. Pharmacological activity of peroral chitosan-insulin nanoparticles in diabetic rats. Int. J. Pharm. 2005, 293, 271–280. [Google Scholar]
  35. Simon-Giavarotti, K.A.; Giavarotti, L.; Gomes, L.F.; Lima, A.F.; Veridiano, A.M.; Garcia, E.A.; Mora, O.A.; Fernández, V.; Viodela, L.A.; Junqueira, V.B. Enhancement of lindane-induced liver oxidative stress and hepatotoxicityby thyroid hormone is reduced by gadolinium chloride. Free Radic. Res. 2000, 36, 1033–1039. [Google Scholar] [CrossRef] [PubMed]
  36. Kasarala, G.; Tillmann, H.L. Standard liver tests. Clin. Liver Dis. 2016, 8, 13–18. [Google Scholar] [CrossRef] [PubMed]
Figure 1. DSC thermograms of insulin-loaded PEG/mucin matrixes in superposition. Batch description: A0 = mucin/PEG/insulin (1:1:0), A1 = mucin/PEG/insulin (1:1:15), A2 = mucin/PEG/insulin (1:2:15), A3 = mucin/PEG/insulin (1:3:15), A4 = mucin/PEG/insulin (1:4:15), A5 = mucin/PEG/insulin (1:5:15). Note: mucin and PEG are measured in grams, while insulin is measured in milliliters.
Applsci 10 02649 g001
Figure 2. SEM of representative batches of insulin-loaded microparticles (MPs) containing different ratios of mucin to PEG. Formulations: A1 = mucin/PEG/insulin (1:1:15), A2 = mucin/PEG/insulin (1:2:15), A3 = mucin/PEG/insulin (1:3:15), A4 = mucin/PEG/insulin (1:4:15), A5 = mucin/PEG/insulin (1:5:15). Control A0 corresponds to the formulation containing no insulin (mucin/PEG, 1:1). Each formulation is indicated in the top left corner of the corresponding microscopy image.
Applsci 10 02649 g002
Figure 3. Insulin release profiles at pH 7.4 (a) and at pH 1.2 (b). Formulations A1–A5: A1 = mucin/PEG/insulin (1:1:15), A2 = mucin/PEG/insulin (1:2:15), A3 = mucin/PEG/insulin (1:3:15), A4 = mucin/PEG/insulin (1:4:15), A5 = mucin/PEG/insulin (1:5:15). Data represent mean values ± SD (n = 3; p < 0.05). Note: mucin and PEG are measured in grams, while insulin is measured in milliliters.
Applsci 10 02649 g003
Figure 4. Percentage decrease of the blood glucose level in rats treated with insulin-loaded MP formulations (n = 5). Groups G1–G5: G1 = received insulin-loaded MPs (formulation A5), G2 = received pure insulin solution, G3 = received subcutaneous insulin, G4 = received water, G5 = received unloaded MPs (batch A0). Data represent mean values ± SD (n = 3).
Applsci 10 02649 g004
Table 1. Formulations based on different ratios of mucin and PEG-4000 used for preparing insulin-containing microparticle-based carriers.
Formulation BatchMucin (g)PEG-4000 (g)Insulin (mL)
A011 0.0
A11115.0
A212 15.0
A313 15.0
A41415.0
A51515.0
Table 2. Physicochemical parameters of insulin-loaded MPs (n = 5) 1.
Batch 2EE (%)DL (%)PS (µm)RV (%)
A0----276 ± 0.0366 ± 0.14
A182 ± 0.1218 ± 0.01311 ± 0.2275 ± 0.13
A281 ±0.11 26 ± 0.24321 ± 0.1380 ± 0.14
A383 ±0.23 28 ± 0.04328 ± 0.1183 ± 0.17
A484 ±0.1635 ± 0.17346 ± 0.0586 ± 0.13
A592 ± 0.1239 ± 0.12398 ± 0.2189 ± 0.12
1Abbreviations: EE = encapsulation efficiency; DL = drug loading; RV = recovery values; PS = particle size. 2 Formulation A0 = unloaded MPs; formulations A1–A5: A1 = mucin/PEG/insulin (1:1:15), A2 = mucin/PEG/insulin (1:2:15), A3 = mucin/PEG/insulin (1:3:15), A4 = mucin/PEG/insulin (1:4:15), A5 = mucin/PEG/insulin (1:5:15). Data represent mean values ± SD. Note: mucin and PEG are measured in grams, while insulin is measured in milliliters.
Table 3. Toxicology study via liver function test (LFT) 1.
Batch 2SGPT (IU/L)SGOT (IU/L)ALP (IU/L)
A138.0 ± 0.1666 ± 0.01113 ± 0.11
A239.5 ± 0.2165 ± 0.33118 ± 0.23
A336.5 ± 0.1567 ± 0.13120 ± 0.21
A437.0 ± 0.1166 ± 0.04115 ± 0.22
A538.5 ± 0.1368 ± 0.34116 ± 0.52
Control (water)36.0 ± 0.3064 ± 0.12115 ± 0.11
Reference value10-4050-15030-130
1Abbreviations: SGOT = serum glutamic oxaloacetic transaminase; SGPT = serum glutamic pyruvic transaminase; ALP = alkaline phosphatase.2 Batch description: A1 = mucin/PEG/insulin (1:1:15), A2 = mucin/PEG/insulin (1:2:15), A3 = mucin/PEG/insulin (1:3:15), A4 = mucin/PEG/insulin (1:4:15), A5 = mucin/PEG/insulin (1:5:15). Data represent mean values ± SD (n = 3). Note: mucin and PEG are measured in grams, while insulin is measured in milliliters.

