Microalgal Growth in Paper Industry Effluent: Coupling Biomass Production with Nutrients Removal


 ,
, 
 , ,
, , 
Abstract
:
1. Introduction
2. Materials and Methods
2.1. Microalgae Strain and Maintenance Medium
2.2. Paper Industry Effluent and Culture Conditions
2.3. Microalgal Growth Monitoring and Kinetic Growth Parameters
2.4. Nutrients Removal
2.5. Statistical Analysis
3. Results and Discussion
3.1. Microalgal Growth
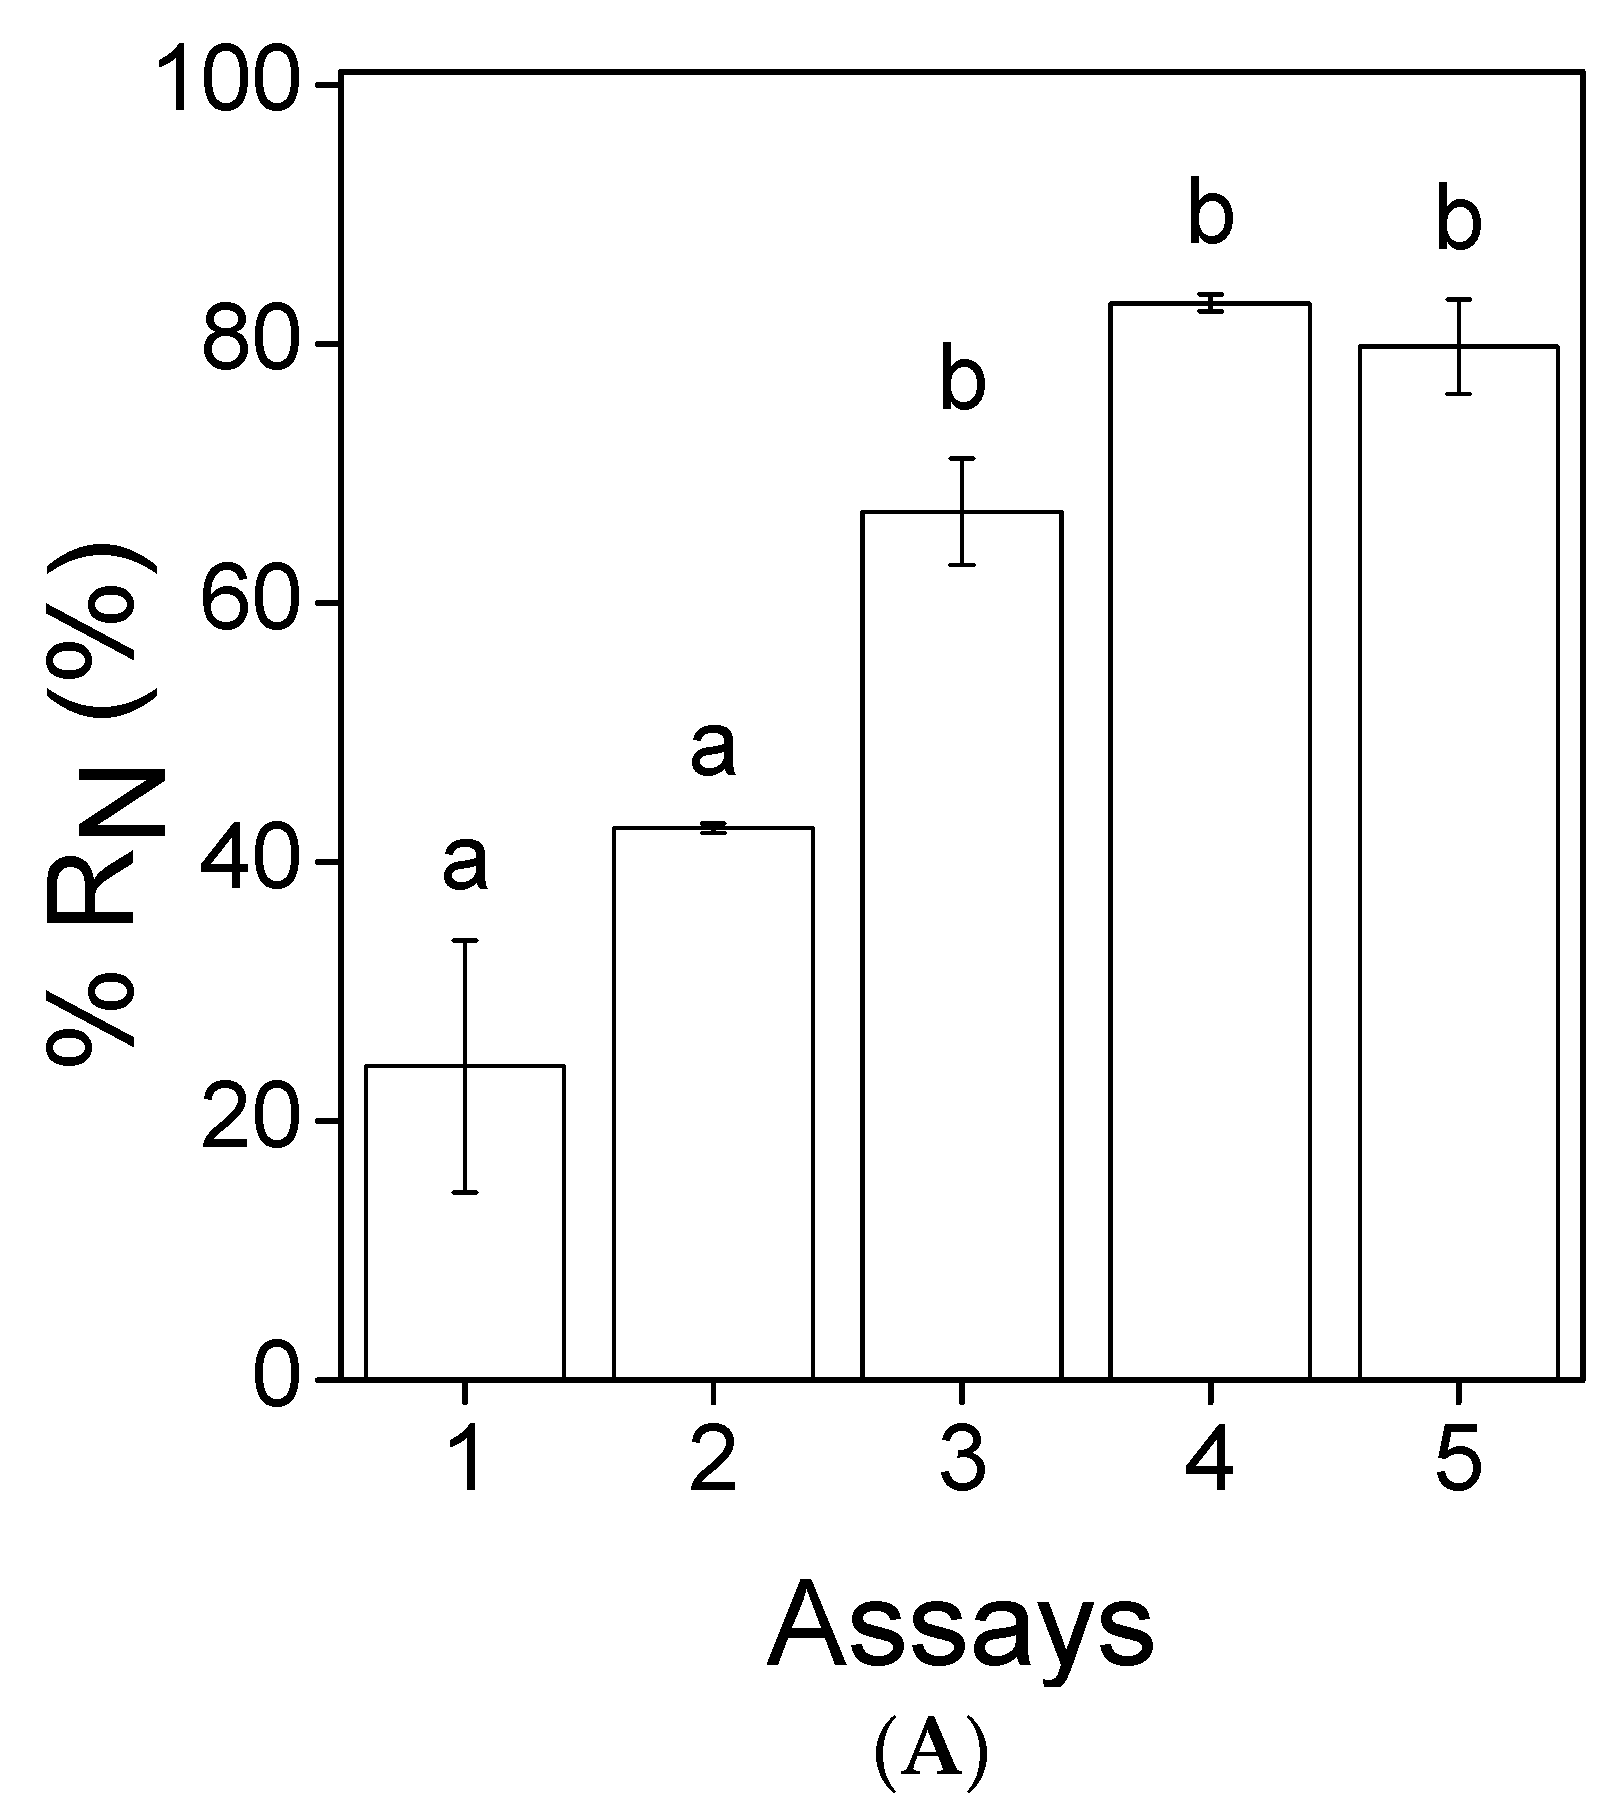
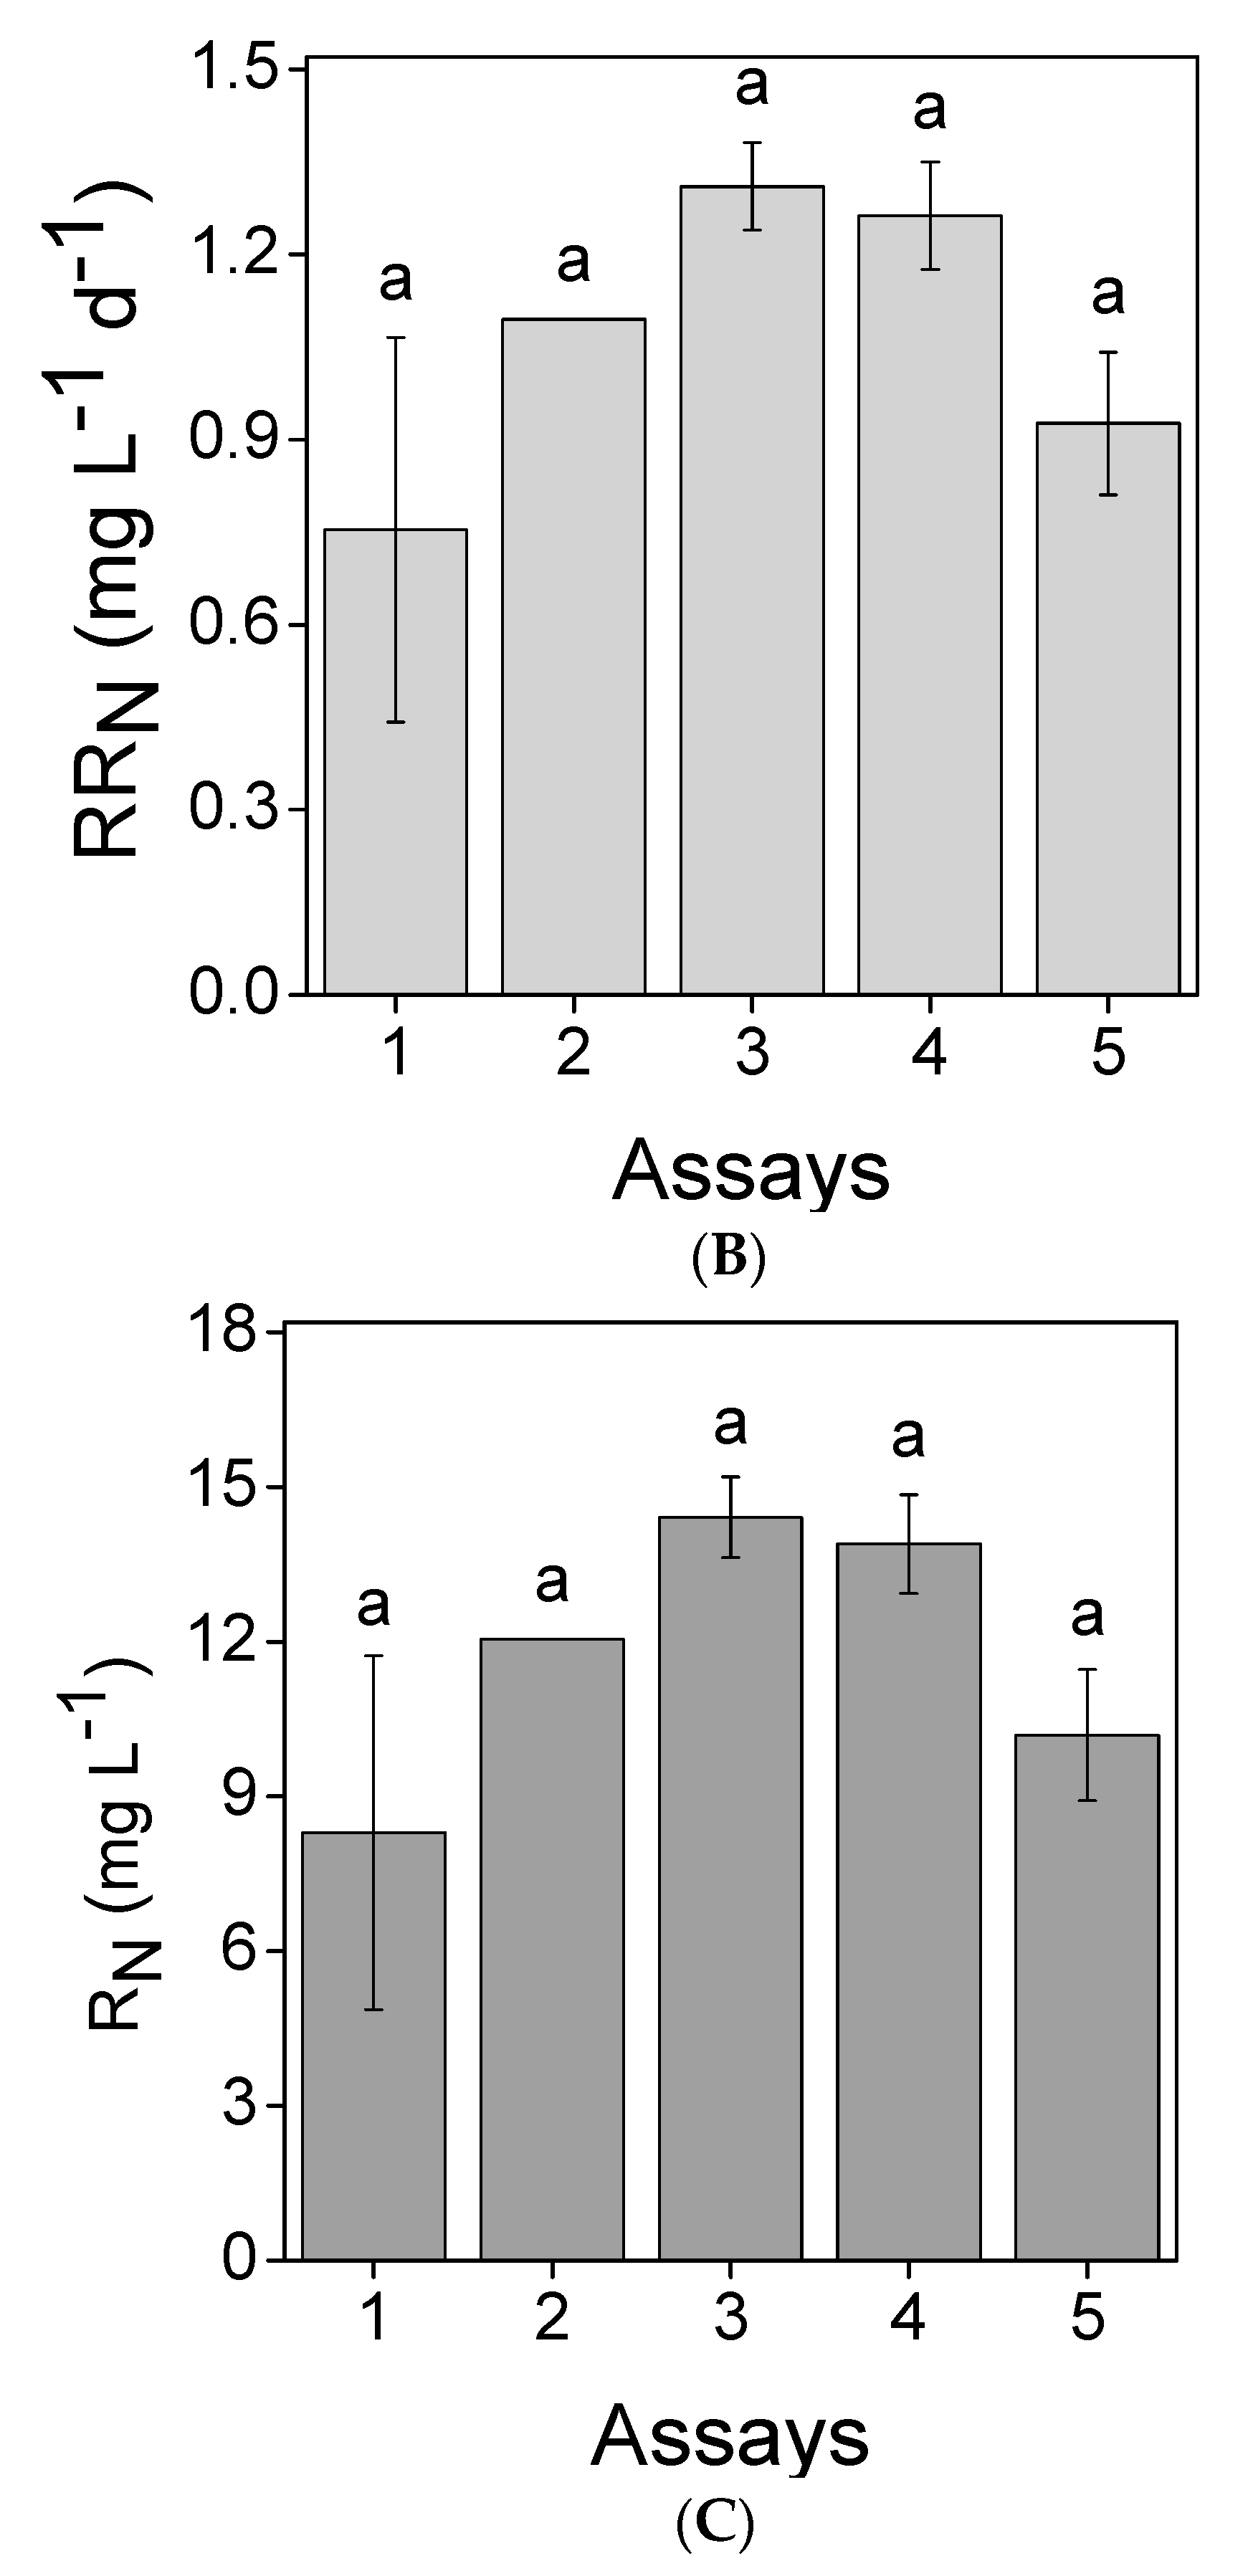
3.2. Nutrients Removal
4. Conclusions
Author Contributions
Funding
Conflicts of Interest
References
- Usha, M.T.; Sarat Chandra, T.; Sarada, R.; Chauhan, V.S. Removal of nutrients and organic pollution load from pulp and paper mill effluent by microalgae in outdoor open pond. Bioresour. Technol. 2016, 214, 856–860. [Google Scholar] [CrossRef] [PubMed]
- Reid, N.; Bowers, T.; Lloyd-Jones, G. Bacterial community composition of a wastewater treatment system reliant on N2 fixation. Appl. Microbiol. Biotechnol. 2008, 79, 285–292. [Google Scholar] [CrossRef]
- Pokhrel, D.; Viraraghavan, T. Treatment of pulp and paper mill wastewater—A review. Sci. Total Environ. 2004, 333, 37–58. [Google Scholar] [CrossRef] [PubMed]
- Piao, W.; Kim, Y.; Kim, H.; Kim, M.; Kim, C. Life cycle assessment and economic efficiency analysis of integrated management of wastewater treatment plants. J. Clean. Prod. 2016, 113, 325–337. [Google Scholar] [CrossRef]
- Singh, G.; Thomas, P.B. Nutrient removal from membrane bioreactor permeate using microalgae and in a microalgae membrane photoreactor. Bioresour. Technol. 2012, 117, 80–85. [Google Scholar] [CrossRef]
- Zang, Y.; Li, Y.; Wang, C.; Zhang, W.; Xiong, W. Towards more accurate life cycle assessment of biological wastewater treatment plants: A review. J. Clean. Prod. 2015, 107, 676–692. [Google Scholar] [CrossRef]
- Tarlan, E.; Dilek, F.B.; Yetis, U. Effectiveness of algae in the treatment of a wood-based pulp and paper industry wastewater. Bioresour. Technol. 2002, 84, 1–5. [Google Scholar] [CrossRef]
- Li, K.; Liu, Q.; Fang, F.; Luo, R.; Lu, Q.; Zhou, W.; Huo, S.; Cheng, P.; Liu, J.; Addy, M.; et al. Microalgae-based wastewater treatment for nutrients recovery: A review. Bioresour. Technol. 2019, 291, 121934. [Google Scholar] [CrossRef]
- Pires, J.C.M.; Alvim-Ferraz, M.C.M.; Martins, F.G.; Simões, M. Carbon dioxide capture from flue gases using microalgae: Engineering aspects and biorefinery concept. Renew. Sustain. Energy Rev. 2012, 16, 3043–3053. [Google Scholar] [CrossRef]
- Rawat, I.; Kumar, R.R.; Mutanda, T.; Bux, F. Dual role of microalgae: Phycoremediation of domestic wastewater and biomass production for sustainable biofuels production. Appl. Energy 2011, 88, 3411–3424. [Google Scholar] [CrossRef]
- Odjadjare, E.C.; Mutanda, T.; Olaniran, A.O. Potential biotechnological application of microalgae: A critical review. Crit. Rev. Biotechnol. 2017, 37, 37–52. [Google Scholar] [CrossRef] [PubMed]
- Rizwan, M.; Mujtaba, G.; Memon, S.A.; Lee, K.; Rashid, N. Exploring the potential of microalgae for new biotechnology applications and beyond: A review. Renew. Sustain. Energy Rev. 2018, 92, 394–404. [Google Scholar] [CrossRef]
- Gentili, F.G. Microalgal biomass and lipid production in mixed municipal, dairy, pulp and paper wastewater together with added flue gases. Bioresour. Technol. 2014, 169, 27–32. [Google Scholar] [CrossRef] [PubMed]
- OECD. Test. No. 201: Freshwater Alga and Cyanobacteria. In Growth Inhibition Test; Organization for Economic Co-operation and Development: Paris, France, 2011. [Google Scholar] [CrossRef] [Green Version]
- Rice, E.W.; Bridgewater, L.; Association, A.P.H.; Association, A.W.W.; Federation, W.E. Standard Methods for the Examination of Water and Wastewater, 22nd ed.; American Public Health Association: Washington, DC, USA, 2012; p. 724. [Google Scholar]
- Silva, N.F.P.; Gonçalves, A.L.; Moreira, F.C.; Silva, T.F.C.V.; Martins, F.G.; Alvim-Ferraz, M.C.M.; Boaventura, R.A.R.; Vilar, V.J.P.; Pires, J.C.M. Towards sustainable microalgal biomass production by phycoremediation of a synthetic wastewater: A kinetic study. Algal Res. 2015, 11, 350–358. [Google Scholar] [CrossRef] [Green Version]
- Larsdotter, K. Wastewater treatment with microalgae—A literature review. Vatten 2006, 62, 31. [Google Scholar]
- Hodaifa, G.; Martínez, M.E.; Sánchez, S. Use of industrial wastewater from olive-oil extraction for biomass production of Scenedesmus obliquus. Bioresour. Technol. 2008, 99, 1111–1117. [Google Scholar] [CrossRef]
- Tao, R.; Kinnunen, V.; Praveenkumar, R.; Lakaniemi, A.-M.; Rintala, J.A. Comparison of Scenedesmus acuminatus and Chlorella vulgaris cultivation in liquid digestates from anaerobic digestion of pulp and paper industry and municipal wastewater treatment sludge. J. Appl. Phycol. 2017, 29, 2845–2856. [Google Scholar] [CrossRef]
- Polishchuk, A.; Valev, D.; Tarvainen, M.; Mishra, S.; Kinnunen, V.; Antal, T.; Yang, B.; Rintala, J.; Tyystjärvi, E. Cultivation of Nannochloropsis for eicosapentaenoic acid production in wastewaters of pulp and paper industry. Bioresour. Technol. 2015, 193, 469–476. [Google Scholar] [CrossRef]
- Molinuevo-Salces, B.; Riaño, B.; Hernández, D.; Cruz García-González, M. Microalgae and Wastewater Treatment: Advantages and Disadvantages. In Microalgae Biotechnology for Development of Biofuel and Wastewater Treatment; Alam, M.A., Wang, Z., Eds.; Springer Singapore: Singapore, 2019; pp. 505–533. [Google Scholar]
- Barros, A.I.; Gonçalves, A.L.; Simões, M.; Pires, J.C.M. Harvesting techniques applied to microalgae: A review. Renew. Sustain. Energy Rev. 2015, 41, 1489–1500. [Google Scholar] [CrossRef] [Green Version]
- Gerde, J.A.; Yao, L.; Lio, J.; Wen, Z.; Wang, T. Microalgae flocculation: Impact of flocculant type, algae species and cell concentration. Algal Res. 2014, 3, 30–35. [Google Scholar] [CrossRef]
- Chisti, Y. Biodiesel from microalgae. Biotechnol. Adv. 2007, 25, 294–306. [Google Scholar] [CrossRef] [PubMed]
- Gonçalves, A.L.; Pires, J.C.M.; Simões, M. A review on the use of microalgal consortia for wastewater treatment. Algal Res. 2017, 24, 403–415. [Google Scholar] [CrossRef]
 ; (B) Assay 2
  ; (C) Assay 3
  ; (D) Assay 4
  ; and (E) Assay 5
  . Error bars correspond to the standard deviation of the mean obtained from two independent experiments.
; (B) Assay 2 ; (C) Assay 3 ; (D) Assay 4 ; and (E) Assay 5 . Error bars correspond to the standard deviation of the mean obtained from two independent experiments.
. Error bars correspond to the standard deviation of the mean obtained from two independent experiments.
; (B) Assay 2 ; (C) Assay 3 ; (D) Assay 4 ; and (E) Assay 5 . Error bars correspond to the standard deviation of the mean obtained from two independent experiments.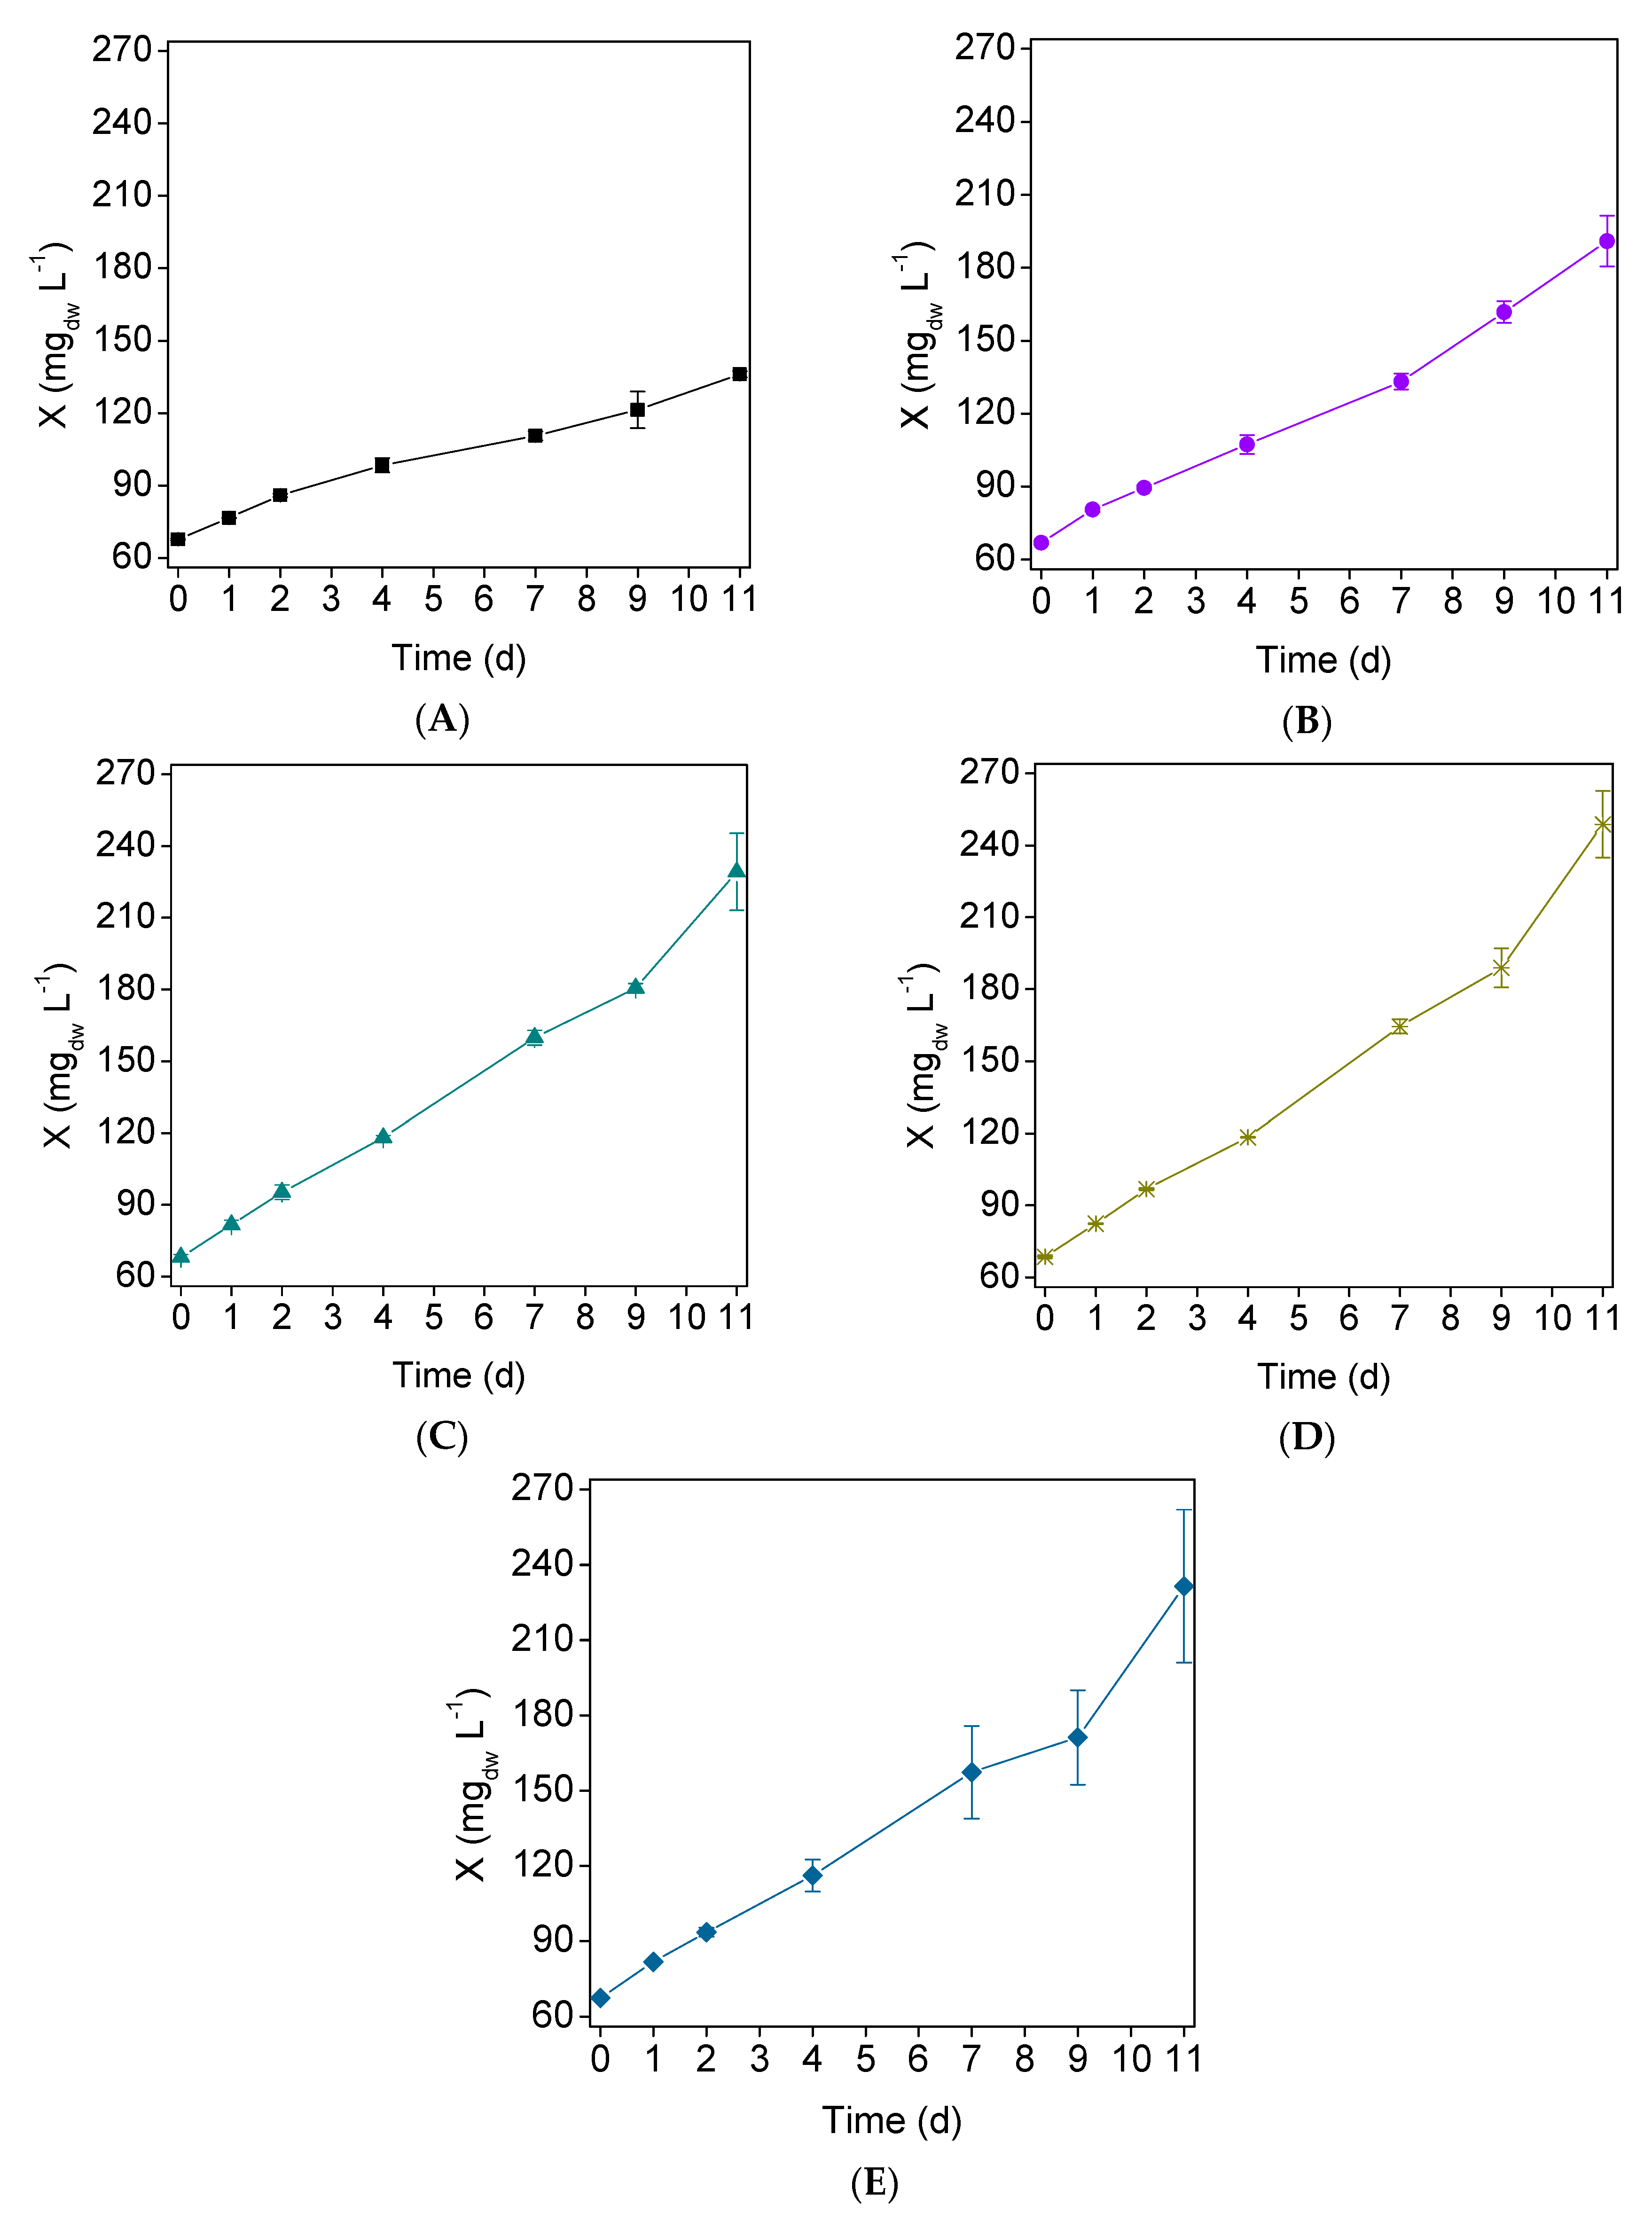
 , 2
, 2  , 3
, 3  , 4
, 4  and 5
and 5  ). Error bars correspond to the standard deviation of the mean obtained from two independent experiments.
, 2 , 3 , 4 and 5 ). Error bars correspond to the standard deviation of the mean obtained from two independent experiments.
). Error bars correspond to the standard deviation of the mean obtained from two independent experiments.
, 2 , 3 , 4 and 5 ). Error bars correspond to the standard deviation of the mean obtained from two independent experiments.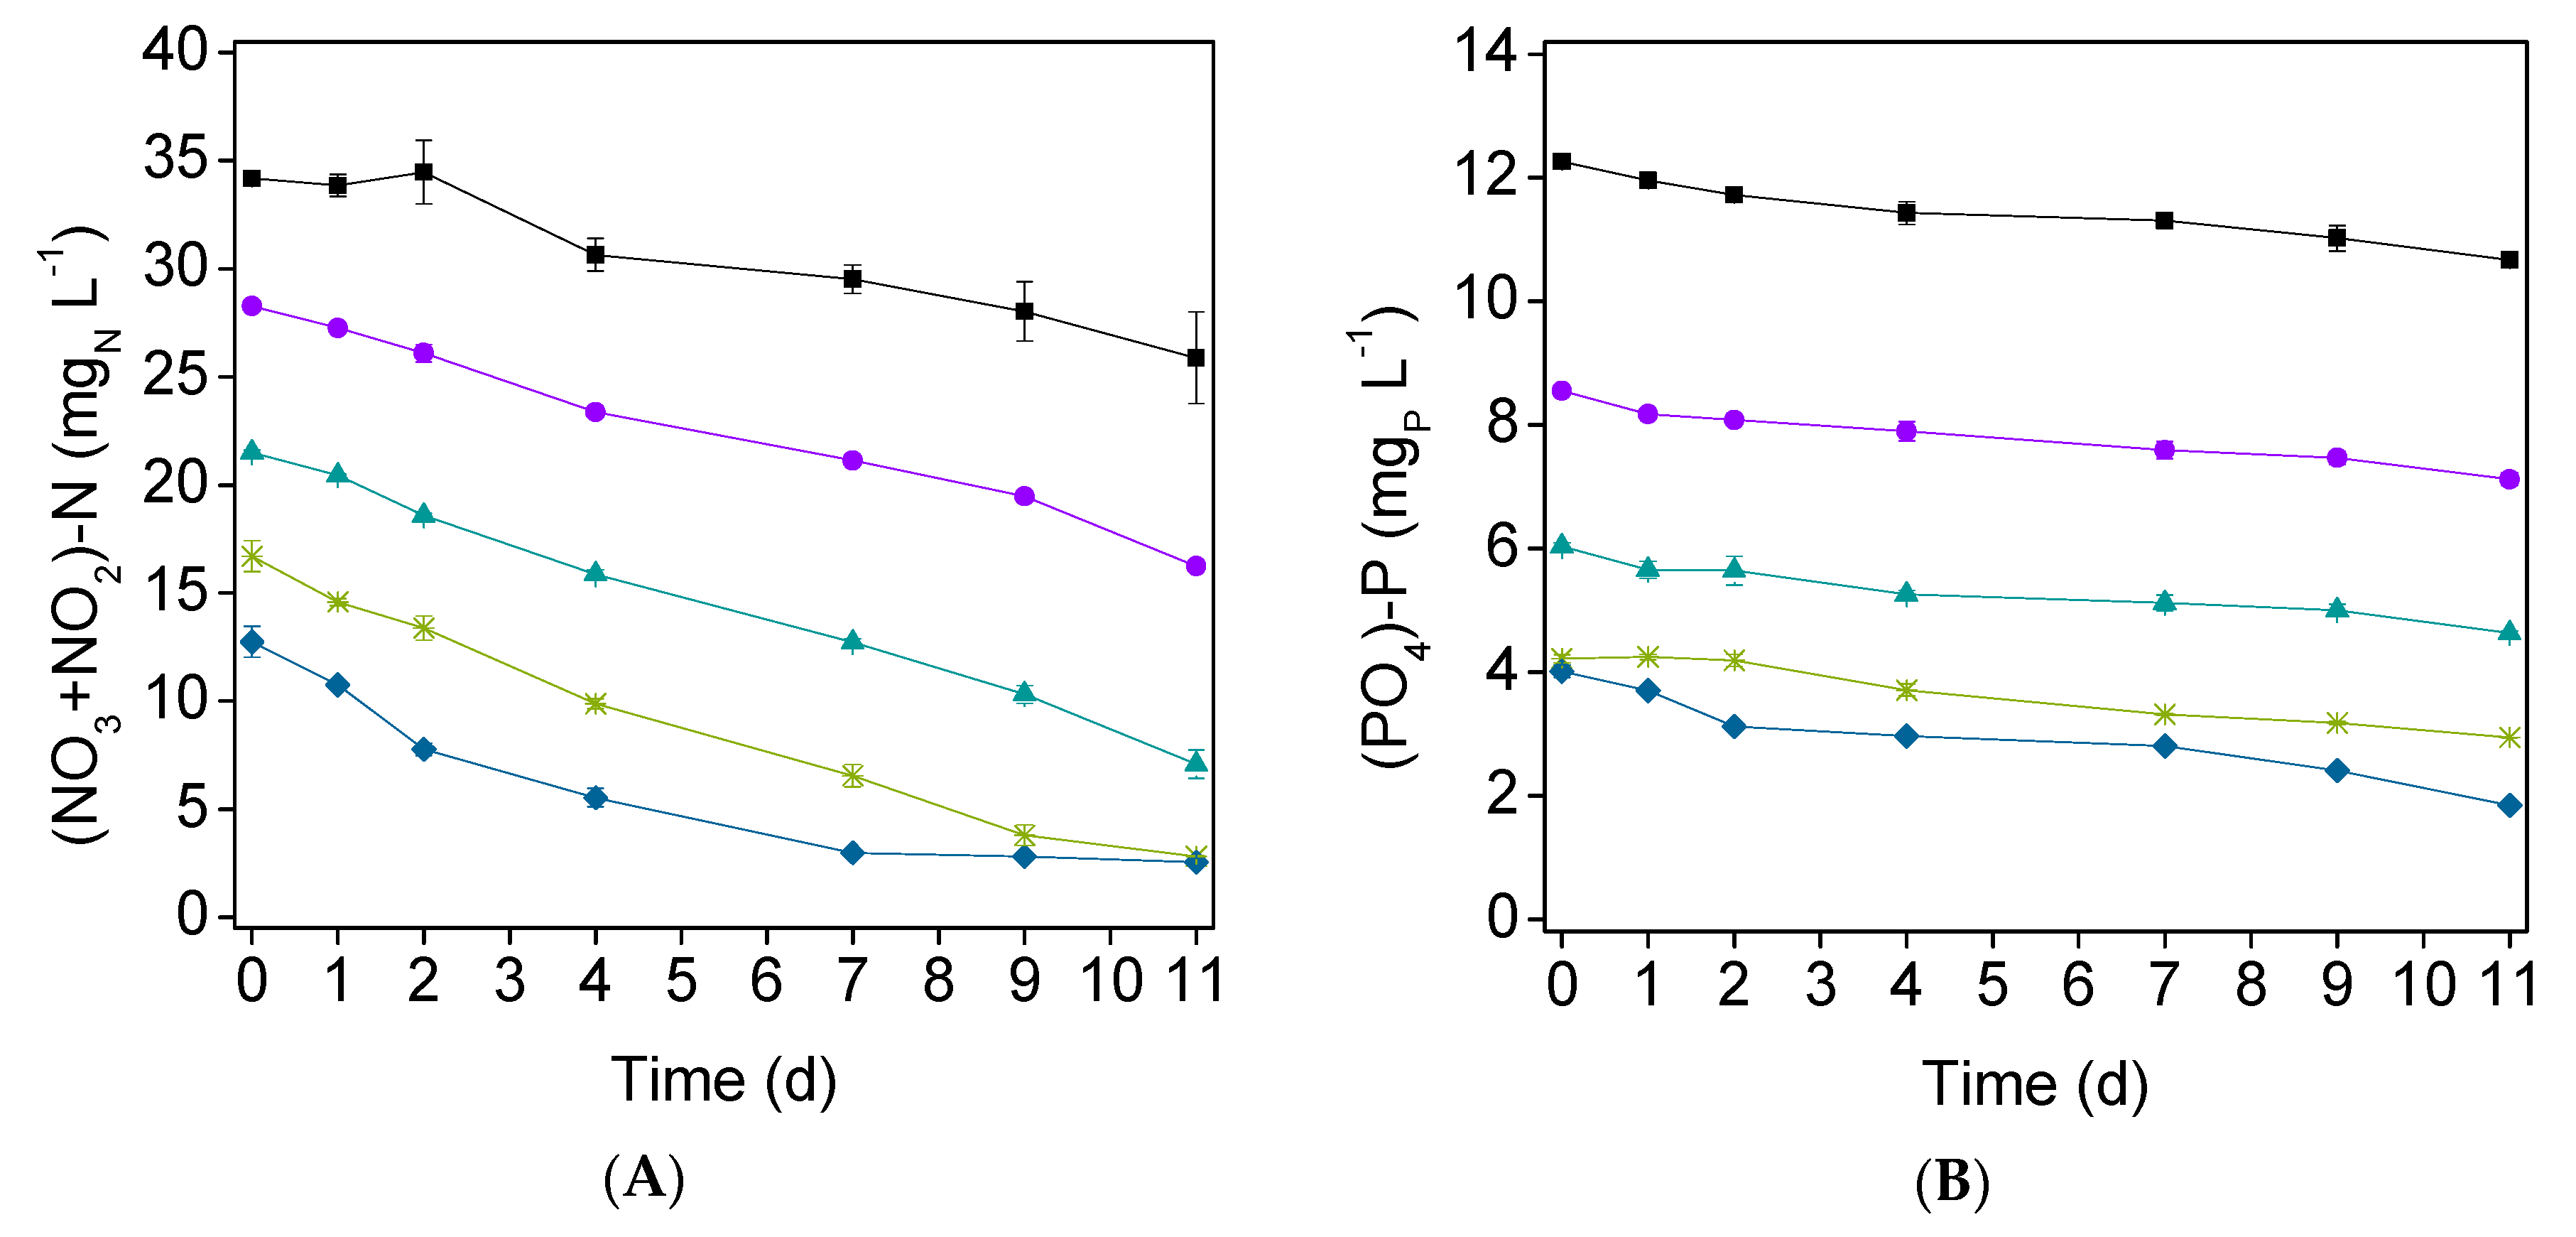

| Parameters | Values | Unit |
|---|---|---|
| Turbidity | 1.55 | NTUa |
| pH | 7.02 | - |
| Dissolved organic carbon (DOC) | 296 | mg L−1 |
| Total dissolved carbon (TDC) | 369 | mg L−1 |
| Dissolved inorganic carbon (DIC) | 72.5 | mg L−1 |
| Soluble chemical oxygen demand (CODS) | 323 | mg L−1 |
| Chlorides (Cl−) | 671 | mg L−1 |
| Sulfates (SO42−) | 808 | mg L−1 |
| Phosphate–phosphorus (PO4–P) | 12.3 | mg L−1 |
| Nitrate–nitrogen (NO3–N) | 8.73 | mg L−1 |
| Nitrite–nitrogen (NO2–N) | 3.42 | mg L−1 |
| Assay | (NO3+NO2)–N (mgN L−1) | PO4–P (mgP L−1) | μ (d−1) | Xmax (mgdw L−1) | Pmax (mdw L−1 d−1) | Paver (mdw L−1 d−1) |
|---|---|---|---|---|---|---|
| 1 | 34.2 | 12.7 | 0.093 ± 0.007 a | 136 ± 1 a | 9.8 ± 0.2 a | 6.22 ± 0.09 a |
| 2 | 28.3 | 8.55 | 0.11 ± 0.01 ab | 191 ± 10 ab | 15 ± 2 ab | 11 ± 1 ab |
| 3 | 21.5 | 6.04 | 0.136 ± 0.004 bc | 229 ± 16 b | 24 ± 7 ab | 15 ± 1 b |
| 4 | 16.7 | 4.22 | 0.134 ± 0.002 bc | 249 ± 14 b | 30 ± 3 b | 16 ± 1 b |
| 5 | 12.7 | 4.01 | 0.16 ± 0.02 c | 231± 31 b | 30 ± 6 b | 15 ± 3 b |
| Effluent | Microalgae | Culture Time (d) | Element / Form | Initial Concentration (mg L−1) | %R (%) | RR (mg L−1 d−1) | Ref. |
|---|---|---|---|---|---|---|---|
| Paper | C. vulgaris | 11 | (NO3+NO2)–N | 34.2 | 24 | 0.75 | This study |
| PO4–P | 12.3 | 13 | 0.14 | ||||
| (NO3+NO2)–N | 28.2 | 43 | 1.1 | ||||
| PO4–P | 8.55 | 17 | 0.13 | ||||
| (NO3+NO2)–N | 21.5 | 67 | 1.3 | ||||
| PO4–P | 6.04 | 23 | 0.13 | ||||
| (NO3+NO2)–N | 16.7 | 83 | 1.3 | ||||
| PO4–P | 4.22 | 30 | 0.12 | ||||
| (NO3+NO2)–N | 12.7 | 80 | 0.93 | ||||
| PO4–P | 4.01 | 54 | 0.20 | ||||
| Pulp and paper mill | C. vulgaris | 14 | NH4–N | 240 | 99 | 17 | [19] |
| PO4–P | 8.00 | 97 | 0.55 | ||||
| Pulp and paper with dairy sludge and municipal | Scenedesmus sp. Scenedesmus dimorphus Selenastrum minutum | 6 | NH4–N | 22.4 | 99 | 3.7 | [13] |
| NO3–N | 1.06 | 27–53 | 0.048–0.094 | ||||
| PO4–P | 10.1 | 96–98 | 1.6–1.7 | ||||
| NH4–N | 14.8 | 96–98 | 2.3–2.4 | ||||
| NO3–N | 1.08 | 41–46 | 0.074–0.083 | ||||
| PO4–P | 1.60 | 96–97 | 0.25–0.26 | ||||
| NH4–N | 21.0 | 99 | 3.5 | ||||
| NO3–N | 1.25 | 27–43 | 0.056–0.090 | ||||
| PO4–P | 2.99 | 90–94 | 0.45–0.47 | ||||
| Paper mill | Scenedesmus sp. | 28 | NO3–N | 2.24 | 65 | 0.052 | [1] |
| PO4–P | 9.86 | 71 | 0.25 |
© 2020 by the authors. Licensee MDPI, Basel, Switzerland. This article is an open access article distributed under the terms and conditions of the Creative Commons Attribution (CC BY) license (http://creativecommons.org/licenses/by/4.0/).
Share and Cite
Porto, B.; Gonçalves, A.L.; Esteves, A.F.; Souza, S.M.A.G.U.d.; Souza, A.A.U.d.; Vilar, V.J.P.; Pires, J.C.M. Microalgal Growth in Paper Industry Effluent: Coupling Biomass Production with Nutrients Removal. Appl. Sci. 2020, 10, 3009. https://doi.org/10.3390/app10093009
Porto B, Gonçalves AL, Esteves AF, Souza SMAGUd, Souza AAUd, Vilar VJP, Pires JCM. Microalgal Growth in Paper Industry Effluent: Coupling Biomass Production with Nutrients Removal. Applied Sciences. 2020; 10(9):3009. https://doi.org/10.3390/app10093009
Chicago/Turabian StylePorto, Bruna, Ana L. Gonçalves, Ana F. Esteves, Selene M. A. Guelli Ulson de Souza, Antônio A. Ulson de Souza, Vítor J. P. Vilar, and José C. M. Pires. 2020. "Microalgal Growth in Paper Industry Effluent: Coupling Biomass Production with Nutrients Removal" Applied Sciences 10, no. 9: 3009. https://doi.org/10.3390/app10093009