Article

Influence of Plasma Characteristics on the Inactivation Mechanism of Cold Atmospheric Plasma (CAP) for Listeria monocytogenes and Salmonella Typhimurium Biofilms

1
CPMF2—Flemish Cluster Predictive Microbiology in Foods, 9000 Ghent, Belgium
2
OPTEC—Optimization in Engineering Center-of-Excellence, KU Leuven, 9000 Ghent, Belgium
3
BioTeC—Chemical and Biochemical Process Technology and Control, Department of Chemical Engineering, KU Leuven, 9000 Ghent, Belgium
4
Department of Electrical Engineering and Electronics, University of Liverpool, Liverpool L69 3GJ, UK
*
Author to whom correspondence should be addressed.
Appl. Sci. 2020, 10(9), 3198; https://doi.org/10.3390/app10093198
Submission received: 16 March 2020 / Revised: 24 April 2020 / Accepted: 28 April 2020 / Published: 4 May 2020
(This article belongs to the Special Issue Biofilms in Focus: A Threat to Foods)

Abstract

:
This research aimed to take a next step towards unravelling the CAP inactivation mechanism for mature (Listeria monocytogenes (Gram positive) and Salmonella Typhimurium (Gram negative)) model biofilms, which will support the further optimization this novel technology. More specifically, we examined how the inactivation mechanism was influenced by the applied processing conditions, i.e., by the electrode configuration, the composition of the gas flow, and the power of the discharge. For each combination of plasma characteristics, we examined if the applied CAP treatment had an effect on (i) the cell membrane, (ii) the intracellular DNA, and (iii) the EPS matrix. In addition, we assessed which (reactive) CAP species were responsible for this lethal/damaging effect and whether these species were able to diffuse into the deeper layers of the biofilms. The results indicated that the inactivation mechanism was indeed influenced by the applied processing conditions. Nevertheless, the bactericidal effect of CAP was always a combination of both damage to the membrane and the DNA, caused by (i) the generation of (intracellular) ROS and RNS, (ii) a drop in pH, and/or (iii) the potential generation of a small amount of UV photons. Moreover, the plasma species were able to penetrate into the deeper layers of the model biofilms and some treatment conditions resulted in an increased biofilm porosity.

Graphical Abstract

1. Introduction

The biofilm mode of living, i.e., bacterial cells encapsulated by a self-produced matrix of extracellular polymeric substances (EPS), has been proven to result in (bacterial) cells becoming highly resistant towards traditional inactivation methods such as the use of antimicrobial agents [1,2,3,4,5,6]. Especially at the mature biofilm stage, i.e., a three-dimensional structure of microcolonies interconnected via water channels and protected by a matrix of different polymers, biofilm-associated cells are maximally protected against several stress factors [2,3,6]. For this reason, biofilm inactivation studies recently shifted towards novel (non-thermal) inactivation methods such as cold atmospheric plasma (CAP). Plasma can be defined as the fourth state of matter and can be created by the addition of energy to a gas. For the generation of CAP, a specific type of plasma, this energy can be added by means of an electrical discharge at atmospheric pressure and at room temperature. As a result, the gas becomes (partially) ionized and contains a variety of reactive species such as ions, photons, free electrons, radicals, and excited (neutral) species [7,8,9,10,11]. Although many studies have proven the ability of CAP to significantly reduce the number of viable biofilm-associated cells [12,13,14,15,16,17], further optimization is still required to guarantee the complete inactivation of all kinds of (mature) biofilms.
Even though the inactivation mechanism of CAP is not yet fully known, especially for biofilms, previous studies indicated that four main factors contributed to CAP’s killing potential. These factors are (i) UV radiation, (ii) charged particles, (iii) reactive oxygen species (ROS), and (iv) reactive nitrogen species (RNS) [18,19]. These species can interact with the cells and result in (i) a damaged (outer) cell membrane, (ii) an altered structure and/or altered functional properties of the intracellular macromolecules, and (iii) a damaged DNA [8,10,20]. The type of generated CAP species and their corresponding concentrations proved to be highly influenced by many (processing) conditions, which in turn affects the ability of CAP to cause damage to the cells. Examples of these influencing (processing) conditions are (i) the Gram type of the (biofilm-associated) cells, (ii) the gas flow composition, and (iii) the electrode configuration [21,22,23]. A more profound investigation of the influence of these conditions on the generation of certain CAP species, their cell targets, and their effect on the biofilm matrix will therefore enable a further optimization of the CAP technology for biofilm inactivation. Especially the latter is of great importance since the biofilm matrix can (i) prevent some of the CAP species reaching the biofilm-associated cells by providing a physical barrier and/or (ii) interact with some of the CAP species to possibly form new (and less reactive) substances [20,23,24]. Moreover, the determination of the specific cell targets can aid to design a highly efficient disinfection schedule by combining CAP treatment with another (mild) inactivation method with a complementary or additional inactivation strategy.
Within this study, a next step is taken towards unravelling the CAP inactivation mechanism for mature biofilms while assessing the influence of four (processing) conditions on this inactivation mechanism. More specifically, it will be investigated which specific (types of) CAP species are generated and how these species interact with the biofilm-associated cells and the biofilm matrix. Three of these conditions involve specific plasma characteristics, i.e., (i) the electrode configuration, (ii) the oxygen level of the gas flow, and (iii) the power of the discharge. The influence of these characteristics on the inactivation efficacy of CAP (in terms of log-reductions) has been examined before in the study of Govaert et al. [17], which will aid to comment on the lethal effect of the generated CAP species. The fourth condition concerns the influence of the biofilm forming species and their Gram type, i.e., two mature model biofilms developed by Listeria monocytogenes (Gram positive) and Salmonella Typhimurium (Gram negative) will be CAP treated using each combination of previously mentioned plasma characteristics.

2. Materials and Methods

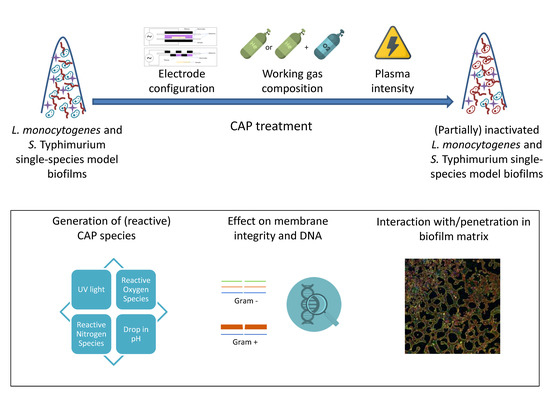
2.1. Experimental Design

In order to unravel the CAP inactivation mechanism for mature biofilms, it was examined how the generated CAP species and their (lethal) effect on the biofilms were influenced by three plasma characteristics (i.e., the electrode configuration, the oxygen level of the gas flow, and the power of the discharge). Regarding the effect on the biofilm-associated cells and the biofilm matrix, it was examined whether (i) the lethal effect of CAP was due to an altered membrane integrity and/or damage to the cellular DNA, (ii) the specifically generated CAP species were able to penetrate into the deeper layers of the biofilm, and (iii) the structure of the biofilm was altered. For each of the tested plasma characteristics, two different levels were examined, i.e., two electrode configurations (dielectric barrier discharge (DBD) and surface barrier discharge (SBD) electrode), two oxygen levels (helium + 0.0 and 1.0% (v/v) oxygen), and two different discharge power values. For the latter influencing factor, it should be mentioned that this was altered by changing the input voltage, i.e., 13.88 and 21.88 V were applied. The selected levels were similar to those investigated in the research of Govaert et al. [17], although only the outer values of previously examined ranges were considered within the presented study. Moreover, in order to comment on the influence of the Gram type and/or the biofilm forming species on CAP’s inactivation mechanism, two different model biofilms were treated. These biofilms were developed by a Gram-positive species (i.e., Listeria monocytogenes) and a Gram-negative species (i.e., Salmonella Typhimurium).
To investigate the generated CAP species, three different experiments were performed. First of all, the generation of UV light was detected by means of UV strips (5–60 mJ/cm2, 250–420 nm). Secondly, a small volume of demineralized water (500 µL) was CAP treated to simulate the chemical reactions that can occur between the generated CAP species and the intracellular fluid and/or the water molecules present within the biofilm matrix. After CAP treatment of the water, the concentration of three (relatively stable) CAP species was quantified (i.e., hydrogen peroxide, nitrite, and nitrate) and the pH was measured. Finally, to determine the generation of intracellular ROS, fluorescence measurements were applied in combination with a selective fluorescent component.
To examine the (lethal) effect of the generated CAP species on the biofilm-associated cells and the biofilm matrix, four different experiments were performed. First of all, the contribution of UV light to the CAP inactivation efficacy was examined by covering the biofilm samples with a quartz disc, preventing all other reactive species to interact with them. Viable plate counts were applied to determine the cell density of the CAP treated model biofilms. Secondly, the membrane integrity of the CAP treated biofilm-associated cells, expressed based on the amount of DNA leakage, was assessed by means of absorbance measurements at 260 nm. Thirdly, cellular DNA damage was investigated by means of fluorescence measurements in combination with SYBR Green I, a selective detector of double-strand DNA (dsDNA). Finally, to examine the depth of penetration of the generated CAP species and the structure of the (CAP treated) model biofilms, confocal laser scanning microscopy (CLSM) was used in combination with live-dead staining. Moreover, the CLSM images can be used as well to comment on the integrity of the cell membranes since the ability of the selective dyes to penetrate into the cells depends on this cell attribute.

2.2. Microorganisms, Pre-Culture Conditions, and Model Biofilm Development

Listeria monocytogenes LMG 23775 (isolated from sausages) and Salmonella Typhimurium LMG 14933 (isolated from bovine liver) were the target microorganisms of this study. Freeze dried cells of both species were acquired from the BCCM/LMG bacteria collection of Ghent University in Belgium and stock-cultures were stored at −80 °C in Brain Heart Infusion broth (BHI, VWR International, Oud-Heverlee, Belgium) and Tryptic Soy Broth (TSB, Becton Dickinson, Franklin Lakes, NJ, USA), respectively, which were both supplemented with 20% (v/v) glycerol (VWR International, Oud-Heverlee, Belgium).
Purity plates were prepared for each experiment, i.e., a loopful of stock-culture was spread onto a Lennox LB agar plate (Lennox LB agar (Becton Dickson, Franklin Lakes, NJ, USA) supplemented with 5 g/L NaCl (Sigma-Aldrich, St. Louis, MO, USA). These purity plates were incubated for 24 h at 30 (Listeria monocytogenes) or 37 °C (Salmonella Typhimurium), which are the optimal growth temperatures for these microorganisms [25]. For the preparation of the pre-cultures, one colony from the incubated purity plate was transferred into an Erlenmeyer flask containing 20 mL of fresh growth medium (Lennox LB broth (Becton Dickson, Franklin Lakes, NJ, USA) supplemented with 5 g/L NaCl). A stationary phase culture with a cell density of approximately 109 CFU/mL was obtained following 24 h of incubation of the Erlenmeyer flasks at 30 (Listeria monocytogenes) or 37 °C (Salmonella Typhimurium).
These pre-cultures were afterwards used to develop strongly adherent and mature Listeria monocytogenes and Salmonella Typhimurium model biofilms according to the protocol of Govaert, et al. [26].

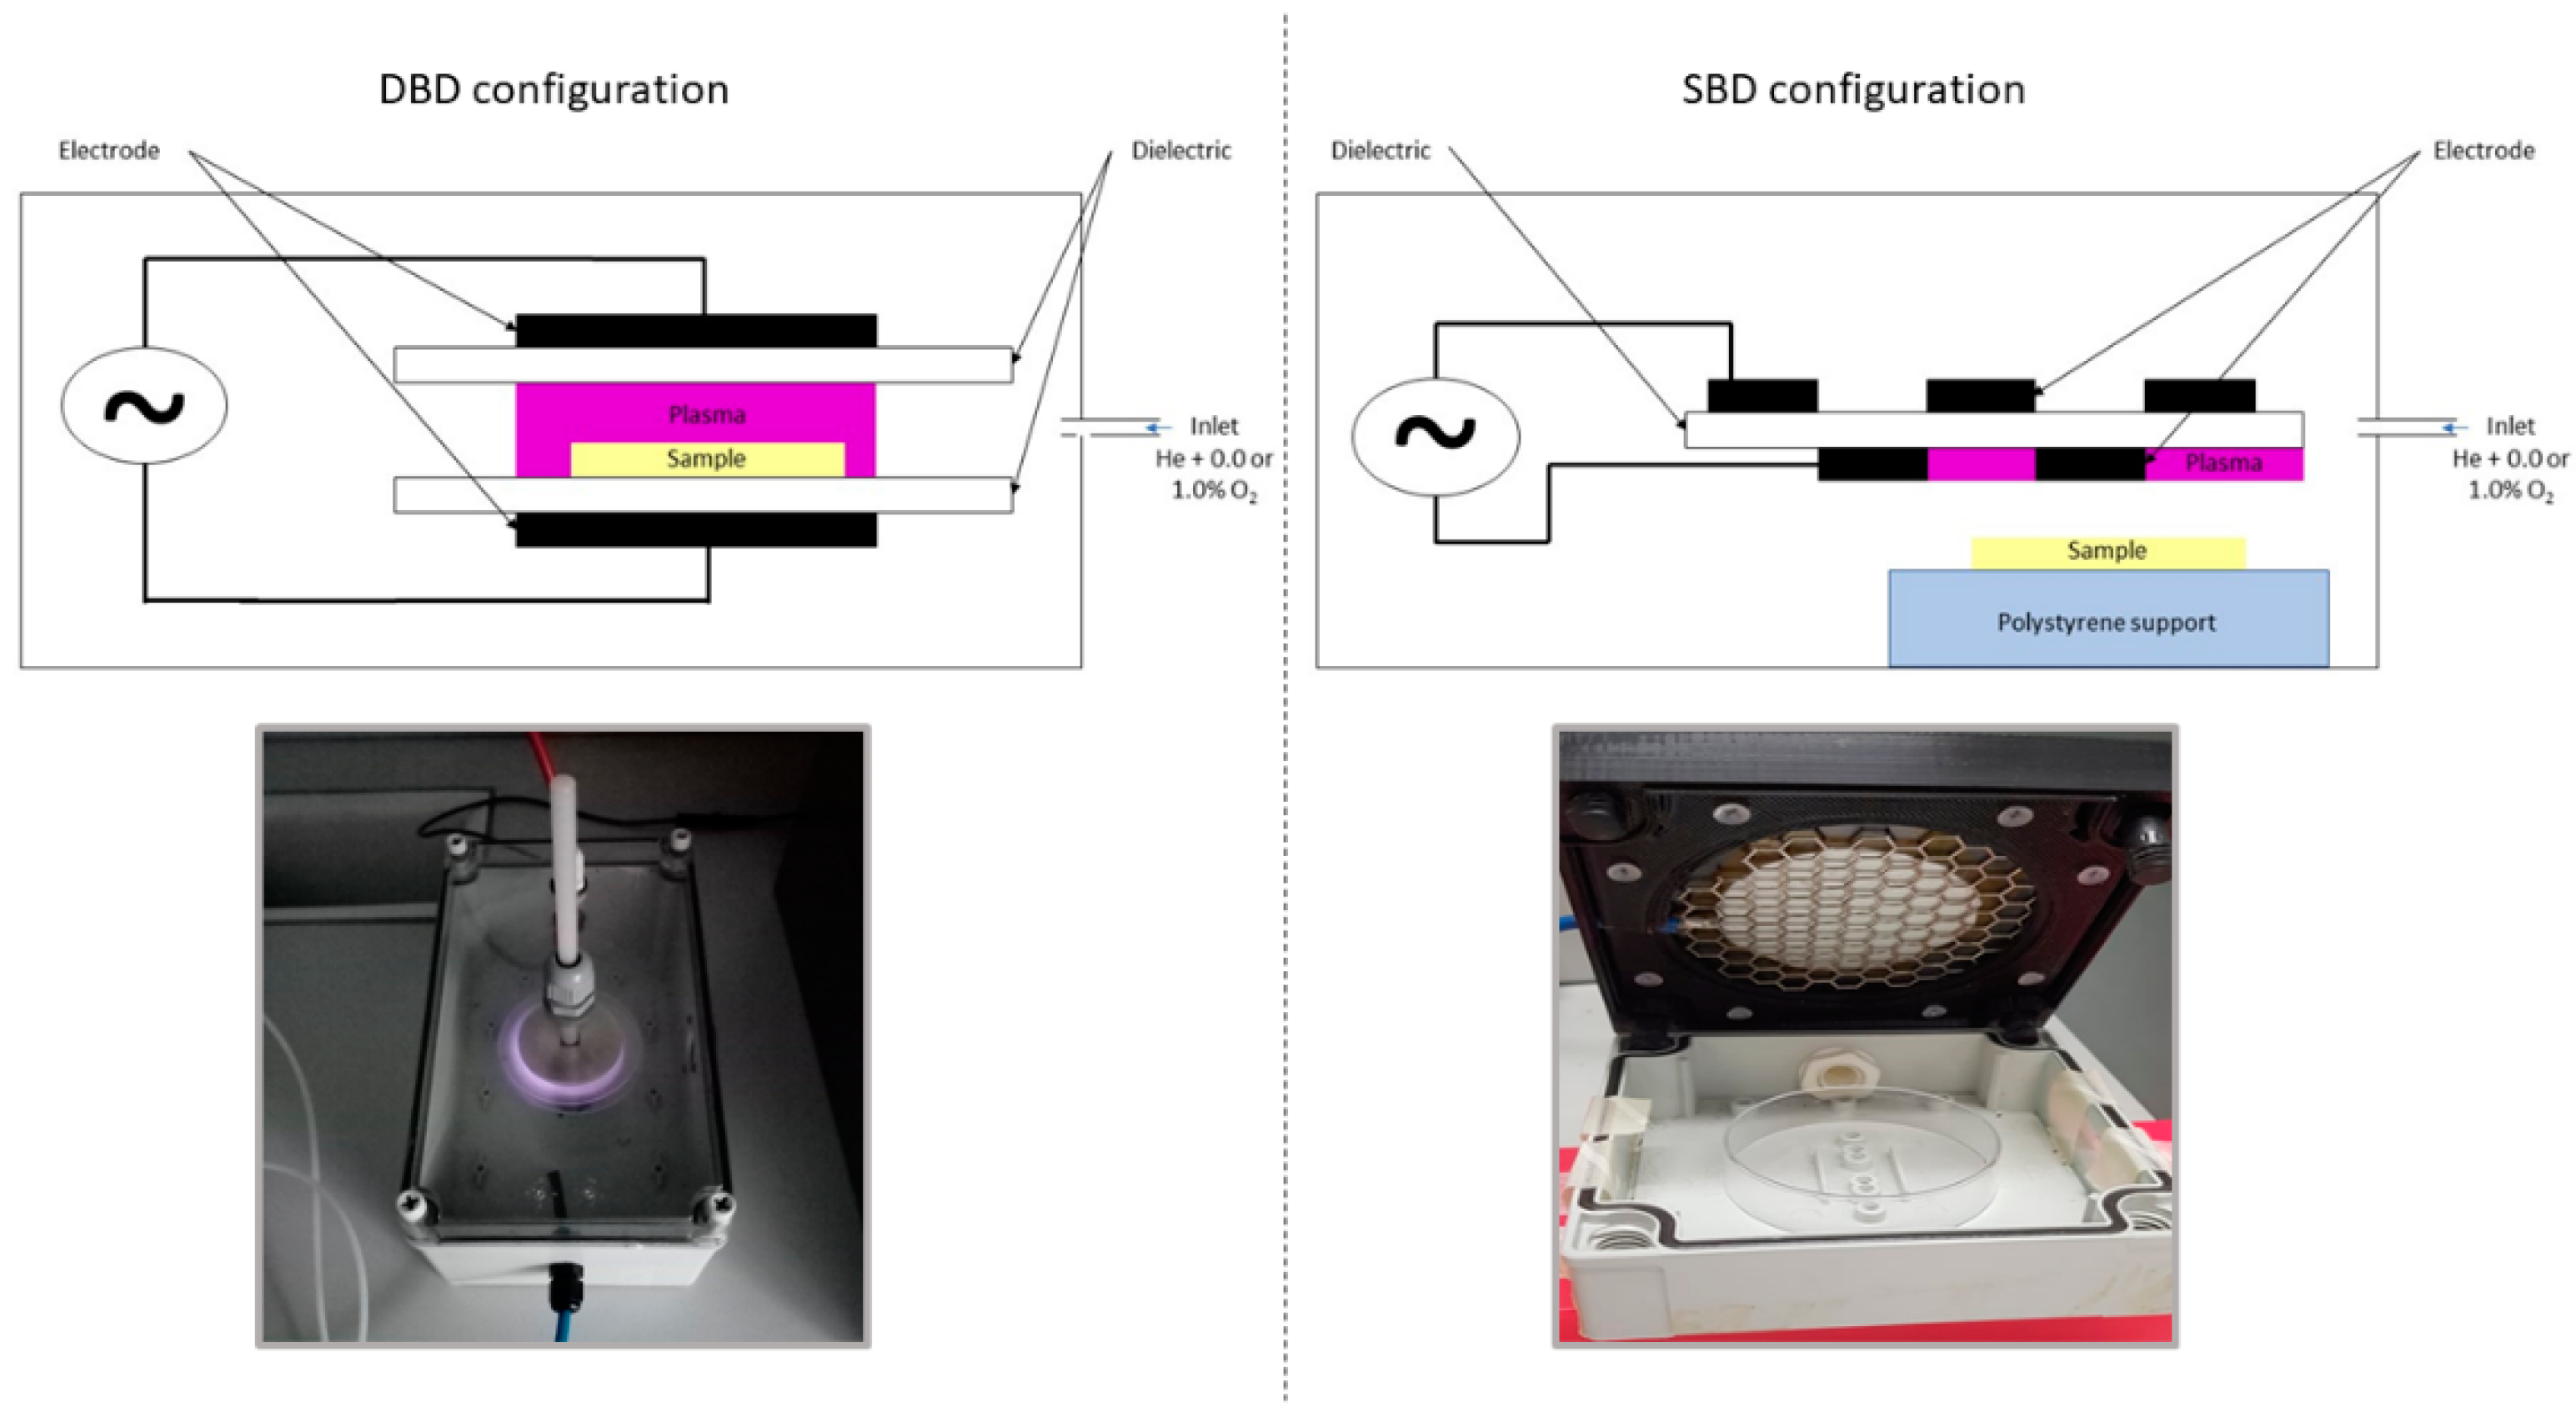
2.3. CAP Equipment and Inactivation Procedure

As mentioned before, two electrode configurations were used, i.e., a DBD and an SBD electrode. For both electrodes, the discharge was generated between two electrodes covered by a dielectric layer. The diameters of the electrodes were 5.5 and 5.0 cm for the DBD and SBD configuration, respectively. For both configurations, the dielectric layer had a diameter of 7.5 cm. An enclosure was provided around both electrodes to increase the residence time of the plasma species and to obtain a more controlled environment. Both enclosures (22.5 cm × 13.5 cm × 10 cm and 10 cm × 10 cm × 4 cm for the DBD and SBD electrode, respectively) were not airtight, which resulted in the presence of impurities from the environment. In case of the DBD configuration, the electrode gap was set at 0.8 cm and the sample (or the UV-TEC strip or the small volume of water) was placed between those electrodes. For the SBD configuration, on the other hand, there was no electrode gap and both electrodes were located on the top of the enclosure. Here, the sample (or the UV-TEC strip or the small volume of water) was placed below the two electrodes while ensuring a similar distance between the sample and the electrodes as was the case for the DBD. In Figure 1, a schematic representation of both electrode configurations has been included as well as a photographic image of both specifically used plasma set-ups.
For all experiments, the plasma was generated in a gas mixture of helium (purity 99.996%, at a flow rate of 4 L/min) and oxygen (purity ≥ 99.995%). Two different oxygen levels were examined, i.e., 0.0 and 1.0% (v/v), which resulted in oxygen flow rates of 0 and 40 mL/min, respectively. The plasma power supply transforms a low voltage DC input (0–60 V) into a high voltage AC signal (0–20 kV), at a frequency up to 30 kHz. As mentioned before, two different input voltages were examined, i.e., 13.88 and 21.88 V. Throughout this manuscript, the terms ‘power of the discharge’ or ‘discharge power’ will be used to refer to this change in input voltage. Depending on the applied electrode configuration and oxygen level, this resulted in eight different peak-to-peak voltages ranging between 2.5 and 8.0 kV and eight different dissipated plasma power values ranging between 1.5 and 7.0 W, respectively. These values can be observed in Table 1. In order to simplify the presentation and the interpretation of the results, the input voltages will be included on the different figures/graphs. Finally, for all experiments, the frequency was set at 15 kHz.
Finally, before energizing the high-voltage power source, the reactor chambers were flushed for 2 or 4 min (SBD and DBD, respectively) to ensure a homogeneous gas mixture. Samples, which were rinsed 3 times with sterile phosphate buffered saline (PBS) solution (to remove the remaining planktonic cells) and allowed to dry prior to treatment, were always treated for 10 min. This treatment time was selected based on the study of Govaert et al. [17], which proved that further inactivation could not be obtained if the treatment time was prolonged due to the occurrence of a tailing phase. For the UV-TEC strips and the small water volumes, a similar CAP treatment time was applied.

2.4. Quantification of the Generated (Reactive) CAP Species

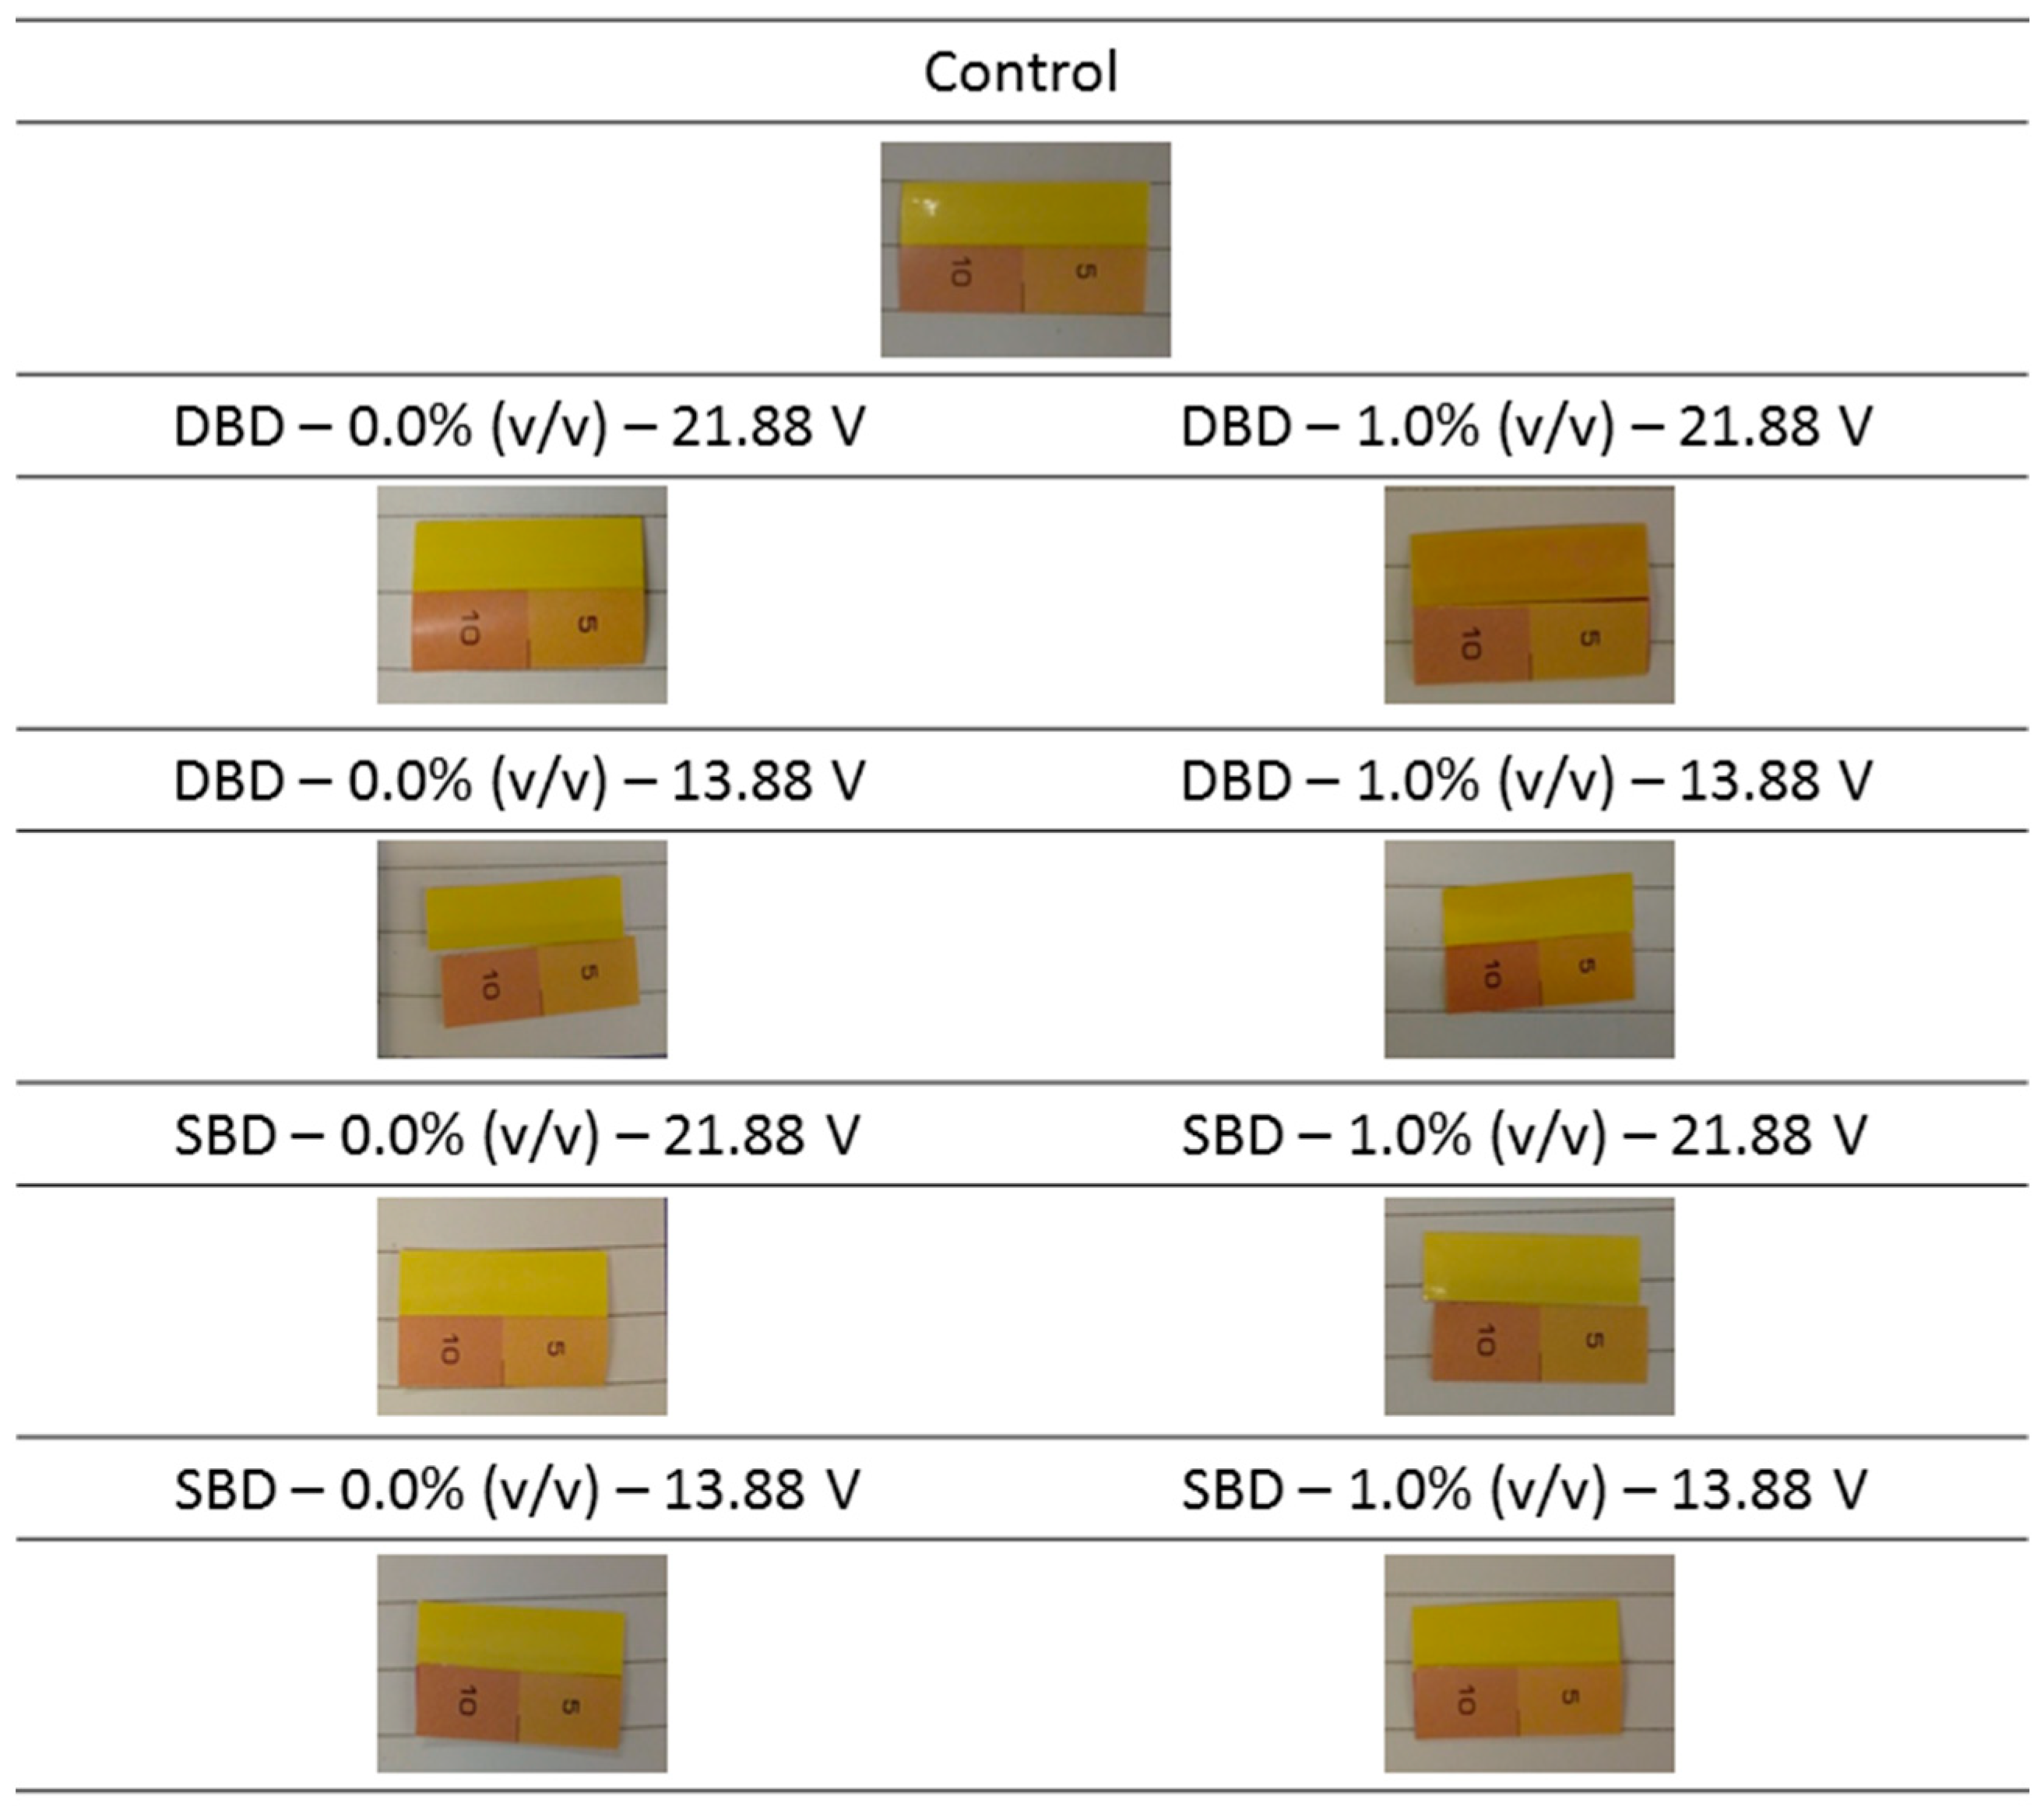
2.4.1. Detection of the Generation of UV Light

For each combination of plasma characteristics, the generation of UV light during CAP treatment was detected and quantified. For this purpose, UV-TEC Control strips (UVio Ltd., Thatcham, UK) were CAP treated for 10 min. These strips can detect UV light ranging between 250 and 420 nm at intensities ranging between 5 and 60 mJ/cm2. A color change occurred when the strips were exposed to (a sufficiently high amount of) UV photons. The color of the CAP treated strips was finally compared with the provided color scale bar, with each color of this scale bar corresponding to a certain intensity of UV light.

2.4.2. Chemical Composition and pH of CAP Treated Water

In order to simulate the chemical reactions that can occur between the generated CAP species and the intracellular fluid and/or the water inside the biofilm matrix, a small amount of water (i.e., 500 µL) was CAP treated using the different combinations of plasma characteristics. The chemical composition and the pH of the water were examined following 10 min of CAP treatment.
For the chemical composition, the concentration of three (relatively stable) CAP species was examined, i.e., hydrogen peroxide (H2O2), nitrite, and nitrate. For the H2O2 concentration, the method of Lu et al. [27] was applied. Here, 100 µL of the CAP treated water was added to a single well of a 96-well microtiter plate (polystyrene, F-bottom, clear, Greiner Bio-One, Vilvoorde, Belgium) containing 10 µL of TiOSO4 (Carl Roth GmbH+Co, Karlsruhe, Germany). Following 10 min of incubation (at room temperature and in the dark), a microplate reader (VersaMax tuneable microtiter plate reader, Molecular Devices, Wokingham, UK) was used to measure the absorbance at 405 nm. In addition, a standard curve was developed in order to convert absorbance values into H2O2 concentrations. For the development of this calibration curve, a 30% (v/v) H2O2 standard solution (Sigma-Aldrich, St. Louis, MO, US) was diluted to obtain solutions with different known concentrations, i.e., 0, 2 × 10⁻⁴%, 3 × 10⁻⁴%, 5 × 10⁻⁴%, 1 × 10⁻³%, 2 × 10⁻³%, 3 × 10⁻³%, and 5 × 10⁻³% (1% = 0.426 M). Three independent replicates (n = 3) were used to determine (i) the equation of the absorbance as function of the H2O2 concentration and (ii) the H2O2 concentration of the CAP treated water using each possible combination of plasma characteristics. To determine the nitrite and nitrate concentration, another colorimetric method was applied using the nitrite/nitrate assay kit (Sigma-Aldrich, St. Louis, MO, USA). As for the H2O2 assay, a calibration curve was again developed to convert absorbance values into nitrite and nitrate concentrations. Three independent replicates (n = 3) were again used to determine (i) the equations of the absorbance values as function of the nitrite and nitrate concentrations and (ii) the nitrite and nitrate concentrations of the CAP treated water using each possible combination of plasma characteristics. The authors refer to the manufacturer’s protocol for the exact procedures.
For the determination of the pH of the CAP treated water, again three independent replicates were used (n = 3). These values were measured using a pH-electrode for small volumes (pH electrode InLab Micro, Mettler Toledo, Zaventem, Belgium).

2.4.3. Generation of Intracellular Reactive Oxygen Species (ROS)

The protocol of Han et al. [28] was slightly adapted to determine the relative amount of intracellular ROS present within the model biofilms following CAP treatment using each possible combination of plasma characteristics. Initially, rinsed and dried model biofilms were CAP treated for 10 min. Following this treatment, biofilms were incubated for 45 min at 37 °C (in the dark) with 900 µL PBS solution and 100 µL of a 500 µM 2′,7′-dichlorodihydrofluorescein diacetate (DCFH2-DA, Sigma Aldrich: St. Louis, MO, USA) working solution, which was prepared in dimethyl sulfoxide (DMSO, 99%, Fisher Scientific, Merelbeke, Belgium). DCFH2-DA is a cell permeable and non-fluorescent probe which can be intracellularly de-esterified by the viable biofilm-associated cells. When ROS species were generated inside the cell during the preceding CAP treatment, this de-esterified molecule will be oxidized, resulting in the formation of the highly fluorescent 2′,7′-dichlorofluorescein molecule. After the incubation period, the biofilms were washed with PBS to remove the excess DCFH2-DA solution and they were allowed to dry (in the dark). Finally, the biofilms were removed from the surface using the cell scraping method [26] and 100 µL of the obtained suspension was transferred to a black multi-well plate (polystyrene, F-bottom, Greiner Bio-One, Vilvoorde, Belgium) to measure the fluorescence. For this purpose, the FilterMax F5 Multi-Mode Microplate Reader (Molecular Devices, Wokingham, UK) was used and the excitation and emission wavelengths were set at 485 and 535 nm, respectively. Three independent biological replicates (n = 3) were again used for each combination of plasma characteristics and an increase in fluorescence in comparison to the untreated (positive control) biofilms indicated that intracellular ROS were formed during CAP treatment of the biofilms, which possibly resulted in cellular damage.

2.5. Effect of the Generated (Reactive) CAP Species on the Biofilms

2.5.1. Viable Cell Density Reduction due to UV Light

In order to comment on the relative contribution of UV light to the CAP inactivation efficacy, Petri dishes with mature L. monocytogenes. Listeria monocytogenes and Salmonella Typhimurium model biofilms were covered with a quartz disc (Alfa AesarTM quartz disc, ø = 76.2 mm, Fisher Scientific, Merelbeke, Belgium) prior to energizing the plasma power source. The quartz disc prevents all plasma species, apart from UV photons, to interact with the biofilm samples [29]. Therefore, log-reductions obtained following CAP treatment of the quartz-covered biofilms were deemed to be solely the result of the generation of UV light. Viable plate counts were used to determine the remaining cell density following 10 min of CAP treatment and the corresponding log-reduction values were calculated based on this remaining cell density and the initial cell density of the untreated model biofilms. Finally, the log-reduction results obtained within the presented research were compared with those previously obtained within the research of Govaert et al. [17] following 10 min of CAP treatment without prior implementation of a quartz disc. Two independent biological replicates (n = 2) were used for this assay.
In order to determine the remaining viable cell density, the biofilms were removed from the surface using previously mentioned cell scraping method. Serial decimal dilutions (in 0.85% (m/v) NaCl solution) of the obtained cell suspension were prepared and plated on agar plates. Brain Heart Infusion Agar (BHIA, BHI supplemented with 14 g/L biological agar, VWR Chemicals, Oud-Heverlee, Belgium) was used for Listeria monocytogenes, while Tryptic Soy Agar (TSA, TSB supplemented with 14 g/L biological agar) was used for Salmonella Typhimurium. For each of the serial dilutions, three drops of 20 µL were plated. Before counting the colonies, BHIA and TSA plates were incubated for at least 24 h at 30 or 37 °C, respectively.

2.5.2. Membrane Integrity
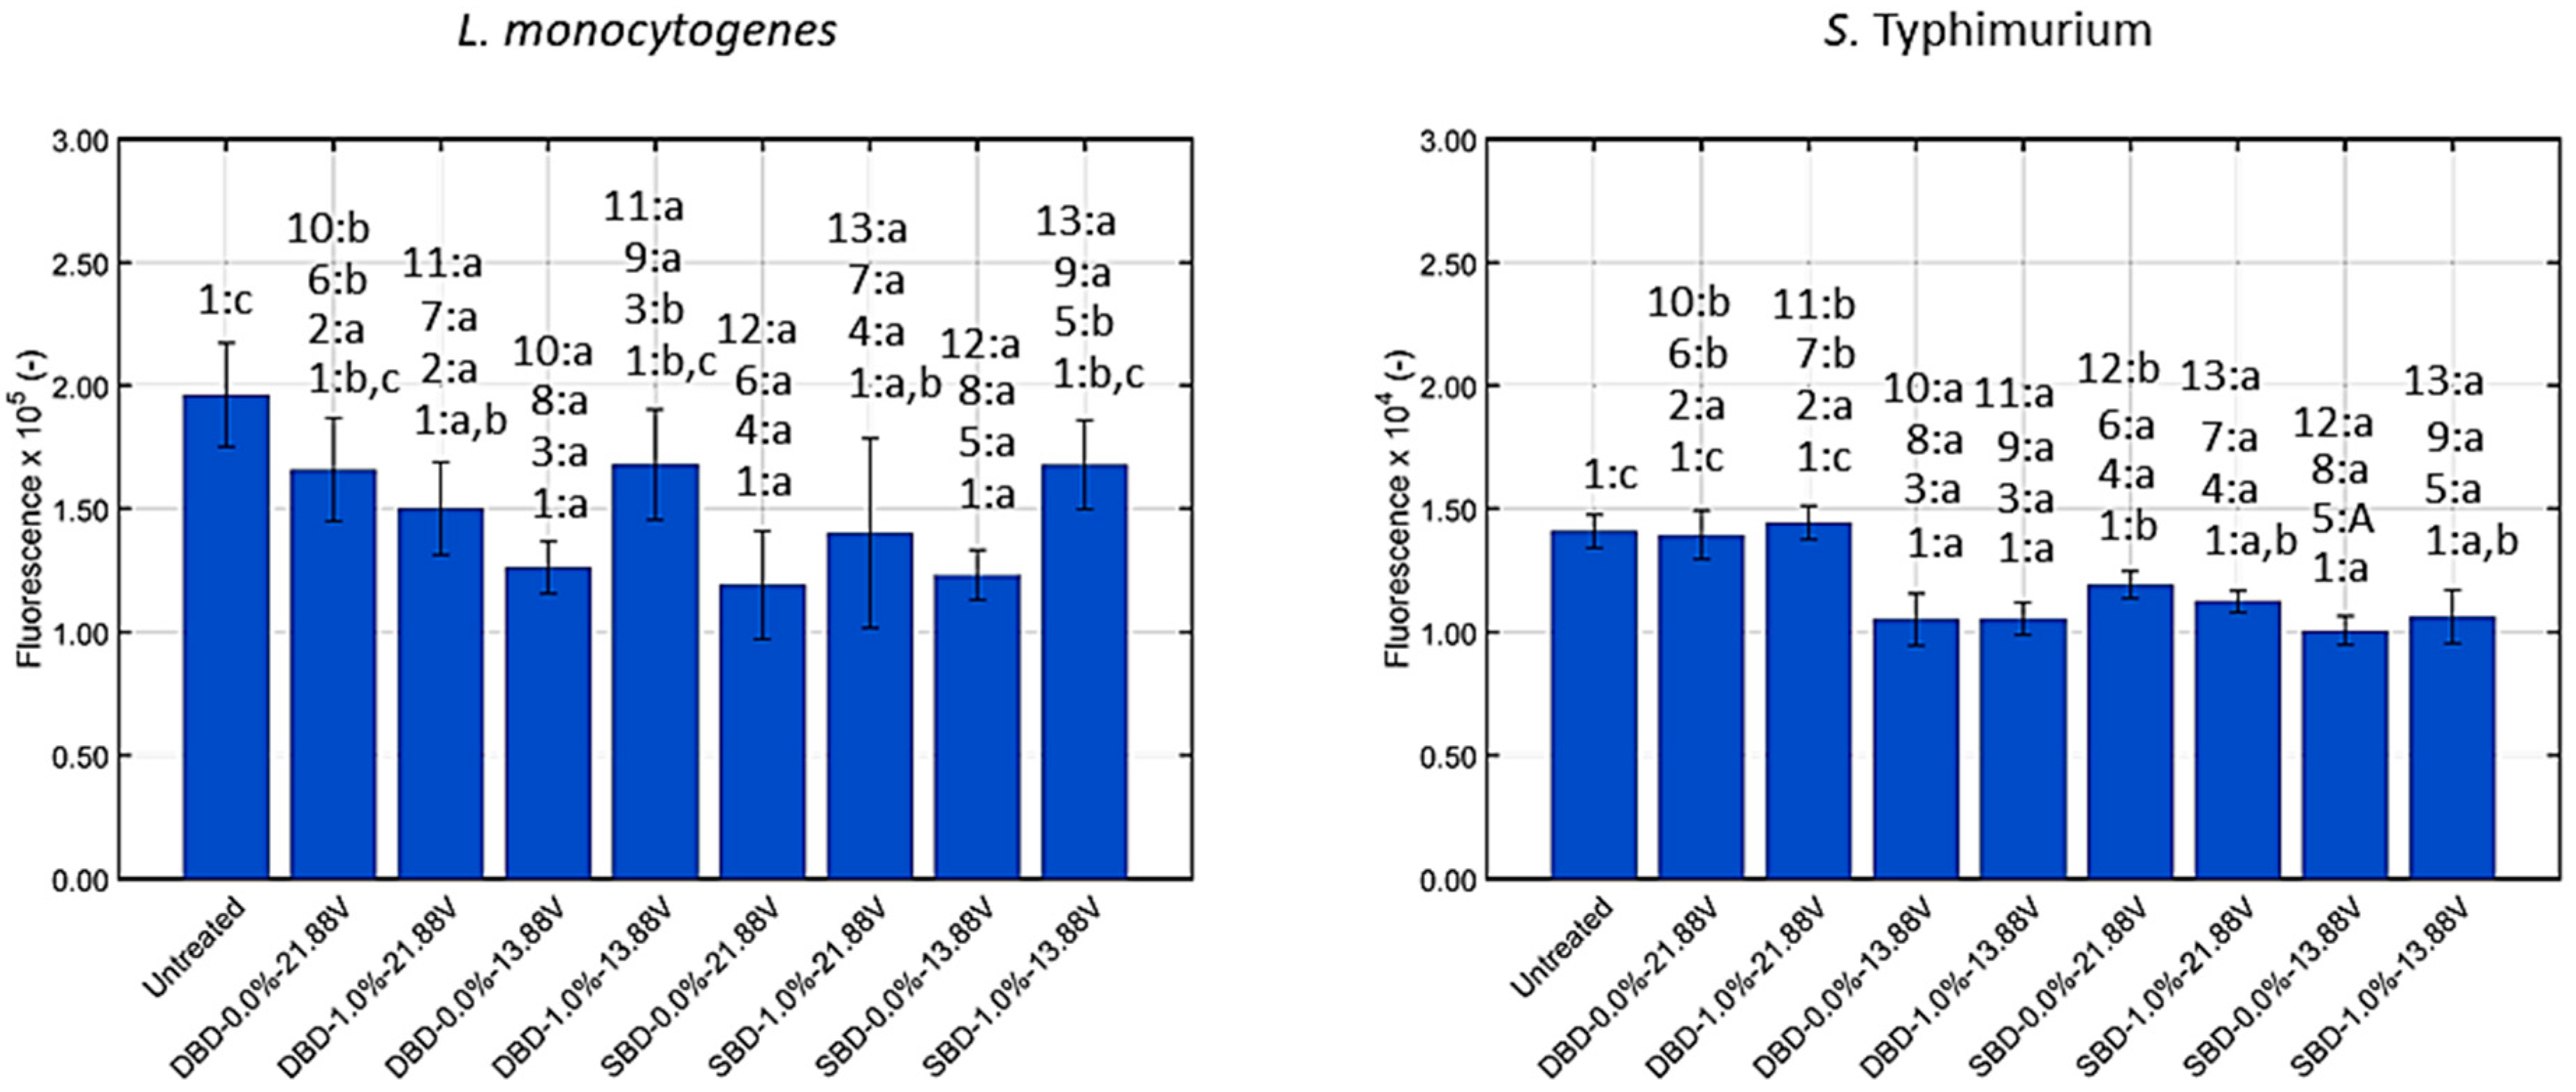
As membrane damage is one of the most important CAP inactivation mechanisms reported in literature (e.g., [8,18,28,30,31]), it was assessed if the examined plasma characteristics had an influence on the integrity of the membrane of the biofilm-associated Listeria monocytogenes and Salmonella Typhimurium cells. For this purpose, CAP treated biofilms were removed from the surface using the cell scraping method and 1.5 mL of the obtained cell suspension was centrifuged at 13,200× g for 10 min. Finally, 200 µL of the supernatant was transferred to a UV-transparent microtiter plate (screenstar, F-bottom, Greiner Bio-One, Vilvoorde, Belgium) and the absorbance was measured at 260 nm using the VersaMax plate reader. Three independent biological replicates (n = 3) were performed for each combination of plasma characteristics. An increase in absorbance in comparison to the untreated model biofilms (= the positive controls) was deemed to be the result of a damaged membrane, originating from the interaction of the generated CAP species with this cellular target.

2.5.3. DNA Damage

Damage to the (intracellular) DNA following 10 min of CAP treatment was examined using SYBR Green I (2-[N-(3-dimethylaminopropyl)-N-propylamino]-4-[2,3-dihydro-3-methyl-(benzo-1,3-thiazol-2-yl)-methylidene]-1-phenylquinolinium), a selective detector of dsDNA (fragments) with different lengths, combined with fluorescence measurements [28].
CAP treated biofilms were removed from the surface using the cell scraping method and 1.5 mL of the obtained suspension was transferred to an empty Eppendorf tube to perform cell lysis. For this purpose, the DNeasy Blood & Tissue Kit (Qiagen, Hilden, Germany) was used. For the Gram-positive Listeria monocytogenes cells, on the one hand, the manufacturer’s protocol was completed up until step 5, including the pre-treatment step with enzymatic lysis buffer. For the Gram-negative Salmonella Typhimurium cells, on the other hand, the protocol was followed up until step 2, again including the recommended pre-treatment steps [32]. Effective cell digestion was assessed by plating the samples on a non-selective medium, i.e., BHIA.
Digested samples were afterwards incubated with a 10,000-fold diluted SYBR Green I (Fischer Scientific, Merelbeke, Belgium) solution for 15 min at 37 °C. Finally, 200 µL of this solution was transferred to a single well of a 96-well microtiter plate (polystyrene, F-bottom, clear, Greiner Bio-One, Vilvoorde, Belgium) and the fluorescence was measured using the FilterMax F5 Multi-Mode plate reader. The excitation and emission wavelengths were 485 and 535 nm, respectively. For this specific assay, again three independent biological replicates (n = 3) were performed for each combination of plasma characteristics. A decrease in absorbance in comparison to the untreated (positive) control biofilms was deemed to be a consequence of the cellular dsDNA being damaged, i.e., single-strand DNA (ssDNA) is formed due to the interaction of reactive CAP species such as ROS and UV light with the biofilm-associated cells.

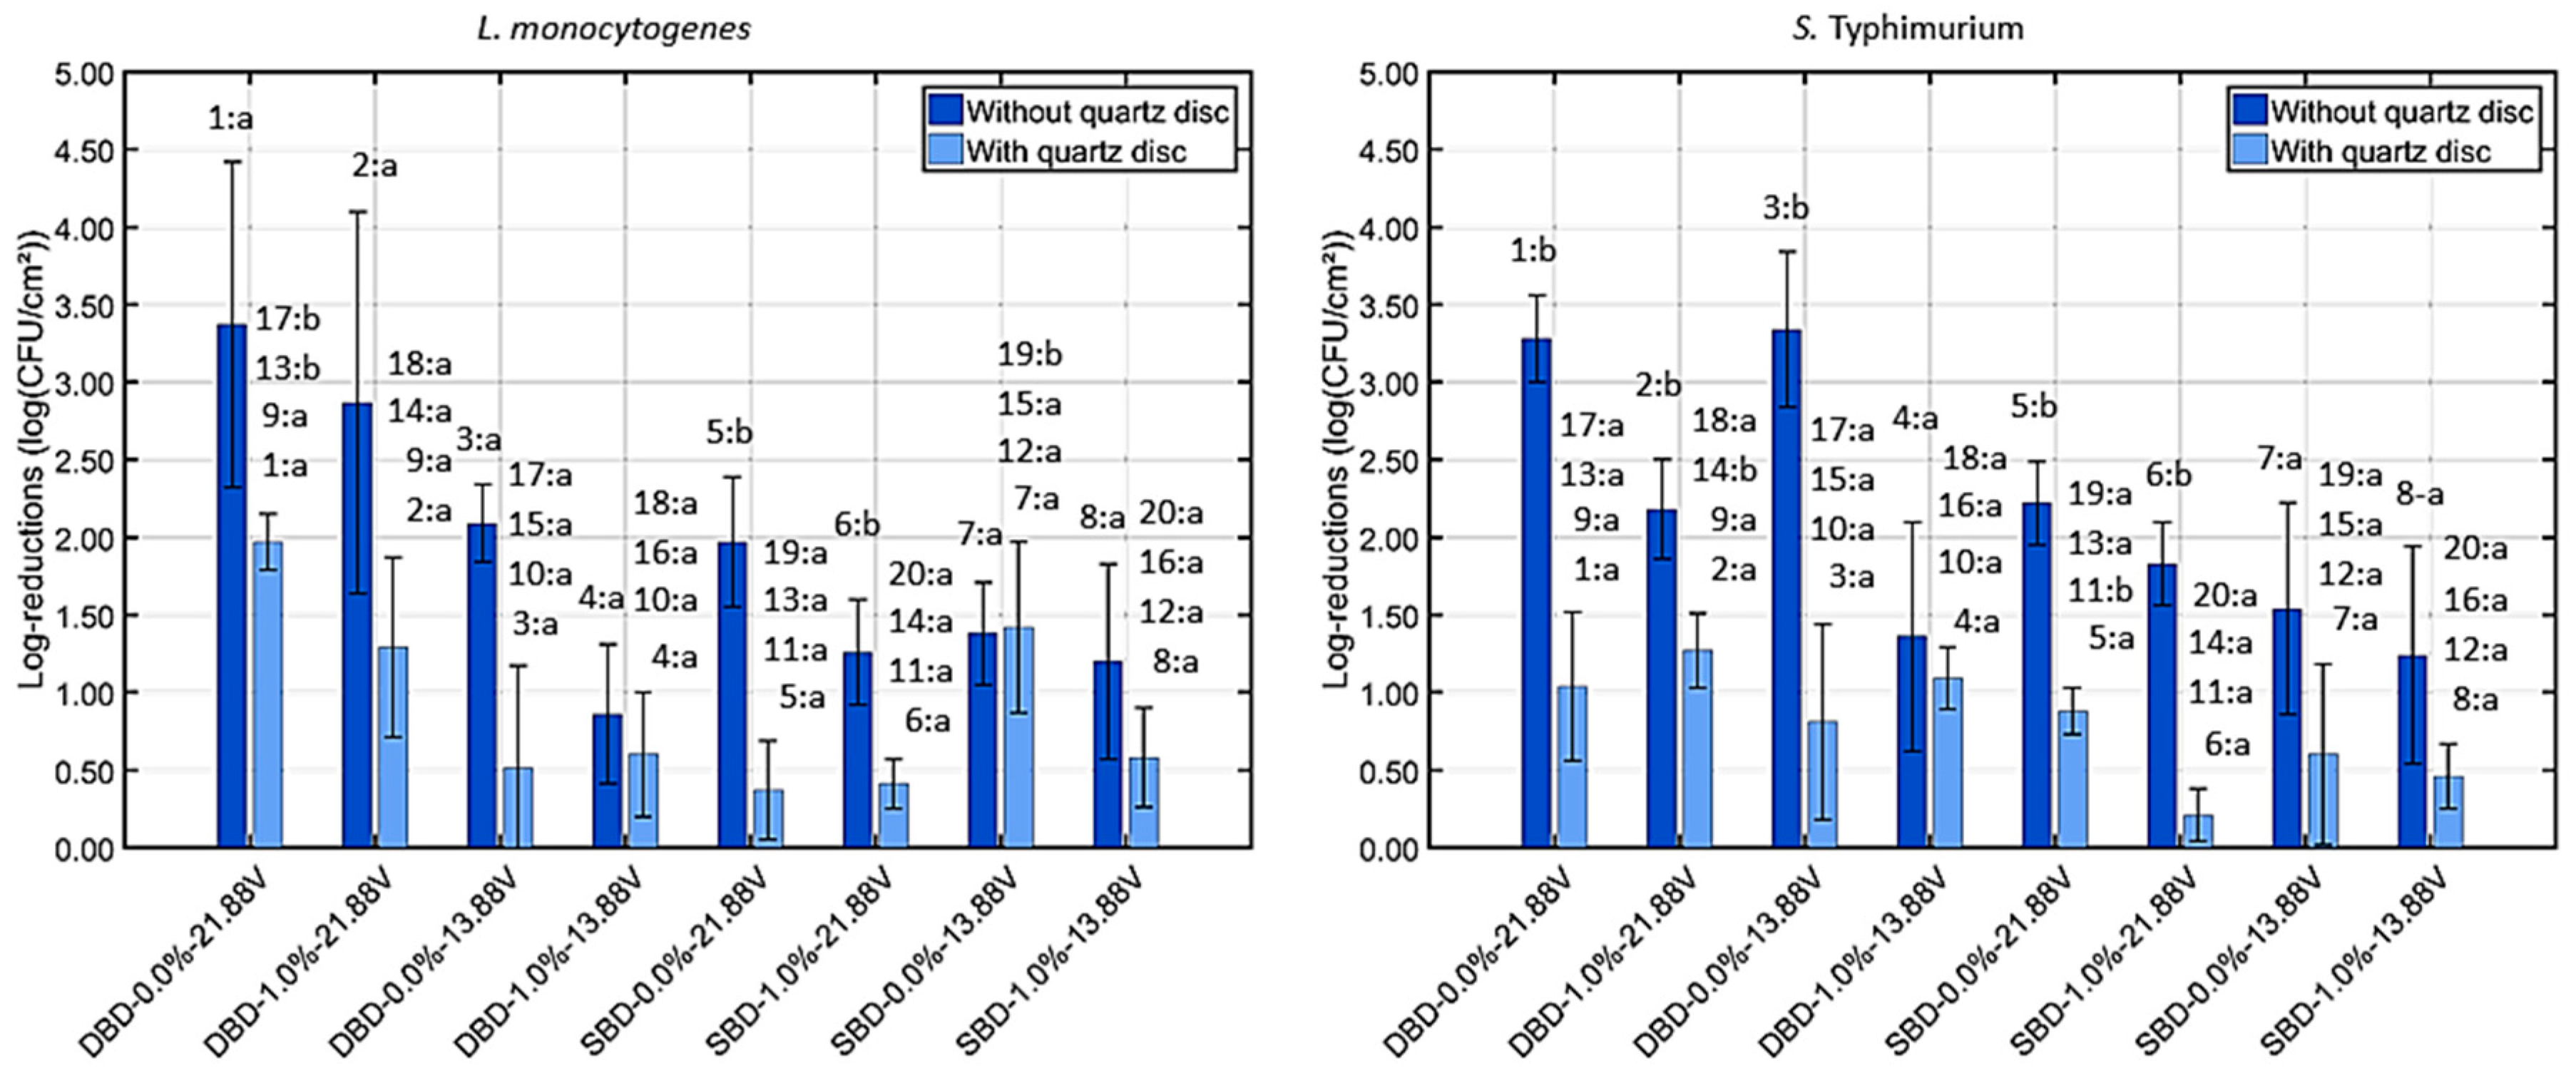
2.5.4. Depth of Penetration of the Generated CAP Species

To visualize the biofilms before and after CAP treatment, 3D images (at zoom = 1× or 2×) were taken using a Nikon A1R confocal laser scanning microscope (CLSM). Fluorescent dyes were used to visualize both the biofilm-associated cells and the matrix. Calcofluor white (Sigma-Aldrich, St. Louis, MO, USA) was used to stain the extracellular (β-)polysaccharides present in the biofilm matrix [33]. For the visualization of the cells, a distinction was made between living and dead/damaged cells using SYTO9 (green) and propidium iodide (red) (LIVE/DEAD™ BacLight™ Bacterial Viability Kit for microscopy, Thermo Fisher Scientific, Waltham, MA, USA). SYTO9 is able to enter both living and dead cells, while propidium iodide is only able to penetrate dead (or injured) cells with a damaged cell membrane [34]. Therefore, 2D images at certain depths of the biofilm can provide information concerning the ability of the specifically generated CAP species to penetrate into the deeper layers of the biofilms. Moreover, the CLSM images can be used to examine the effect of CAP on the structure of the model biofilms.
For this specific experiment, biofilms were (i) removed from the incubator, (ii) rinsed three times with sterile PBS solution, (iii) allowed to dry, (iv) CAP treated (if applicable), and (v) stained with a mixture of the three different stains. The protocol used for staining was adapted from Philips et al. [35]. The authors refer to the study of Govaert et al. [17] for a detailed explanation of the applied chemicals, concentrations, and incubation times for CLSM visualization of the studied biofilms. Afterwards, biofilms were covered with a cover slide (35 mm, No. 1.5 glass thickness, MatTek In Vitro Life Science, Bratislava, Slovakia), which was glued on the Petri dish with nail polish and protected from sunlight. During the visualization of the biofilms, calcofluor white was excited with a 405 nm laser and its emission was measured between 425 and 575 nm. For SYTO9 and propidium iodide, (i) excitation wavelengths of 488 and 560 nm were used and (ii) emission wavelengths were captured at 500–550 and 570–620, respectively. Images were taken using NIS Elements and further analyzed using ImageJ.

2.6. Statistical Analysis

Analysis of variance (ANOVA) tests were performed to determine whether there were any significant differences between the average (i) concentrations, (ii) pH values, (iii) log-reductions, (iv) absorbance values, and (v) fluorescence values obtained using each of the different combinations of plasma characteristics or between the CAP treated samples and the untreated control. Moreover, separate ANOVA tests were performed to determine the influence of one plasma characteristic (e.g., electrode configuration) on previously mentioned attributes while keeping the other characteristics (e.g., oxygen level and discharge power) constant. For each ANOVA test, a different number has been used to indicate which average values were compared to each other. Moreover, if these values were significantly different, this was indicated by means of a different letter, with ‘a’ bearing the lowest value.
The analyses were performed using the Statgraphics 18 software (Statgraphics Technologies, Inc. Graphics, Scott, VA, USA, 2018). A confidence level of 95.0% (α = 0.05) was applied and Fisher’s Least Significant Difference (LSD) test was used to distinguish which values were significantly different from others.
For most experiments, and for each combination of plasma characteristics, average values and corresponding standard deviations presented on the different figures were calculated based on three independent (biological) replicates (n = 3). Only for the log-reduction values obtained with and without incorporation of a quartz disc were two independent (biological) replicates used (n = 2).

3. Results

3.1. Quantification of the Generated (Reactive) CAP Species

3.1.1. Detection of the Generation of UV Light

Pictures from the CAP exposed UV-TEC strips have been provided in Figure 2. As mentioned before, the UV-TEC strips were CAP treated for 10 min using different combinations of plasma characteristics. The colors of the CAP treated strips were compared with the untreated control strip and the provided scale bar. Based on this figure, it can be concluded that only one combination of plasma characteristics resulted in a significant color change in comparison to the control, i.e., DBD-1.0% (v/v) O2–21.88 V. For this specific condition, the strips were exposed to approximately 5 mJ/cm2. Assuming a constant photon emission over the course of the applied CAP treatment, which is not fully true, this corresponds to 8 µW/cm2.

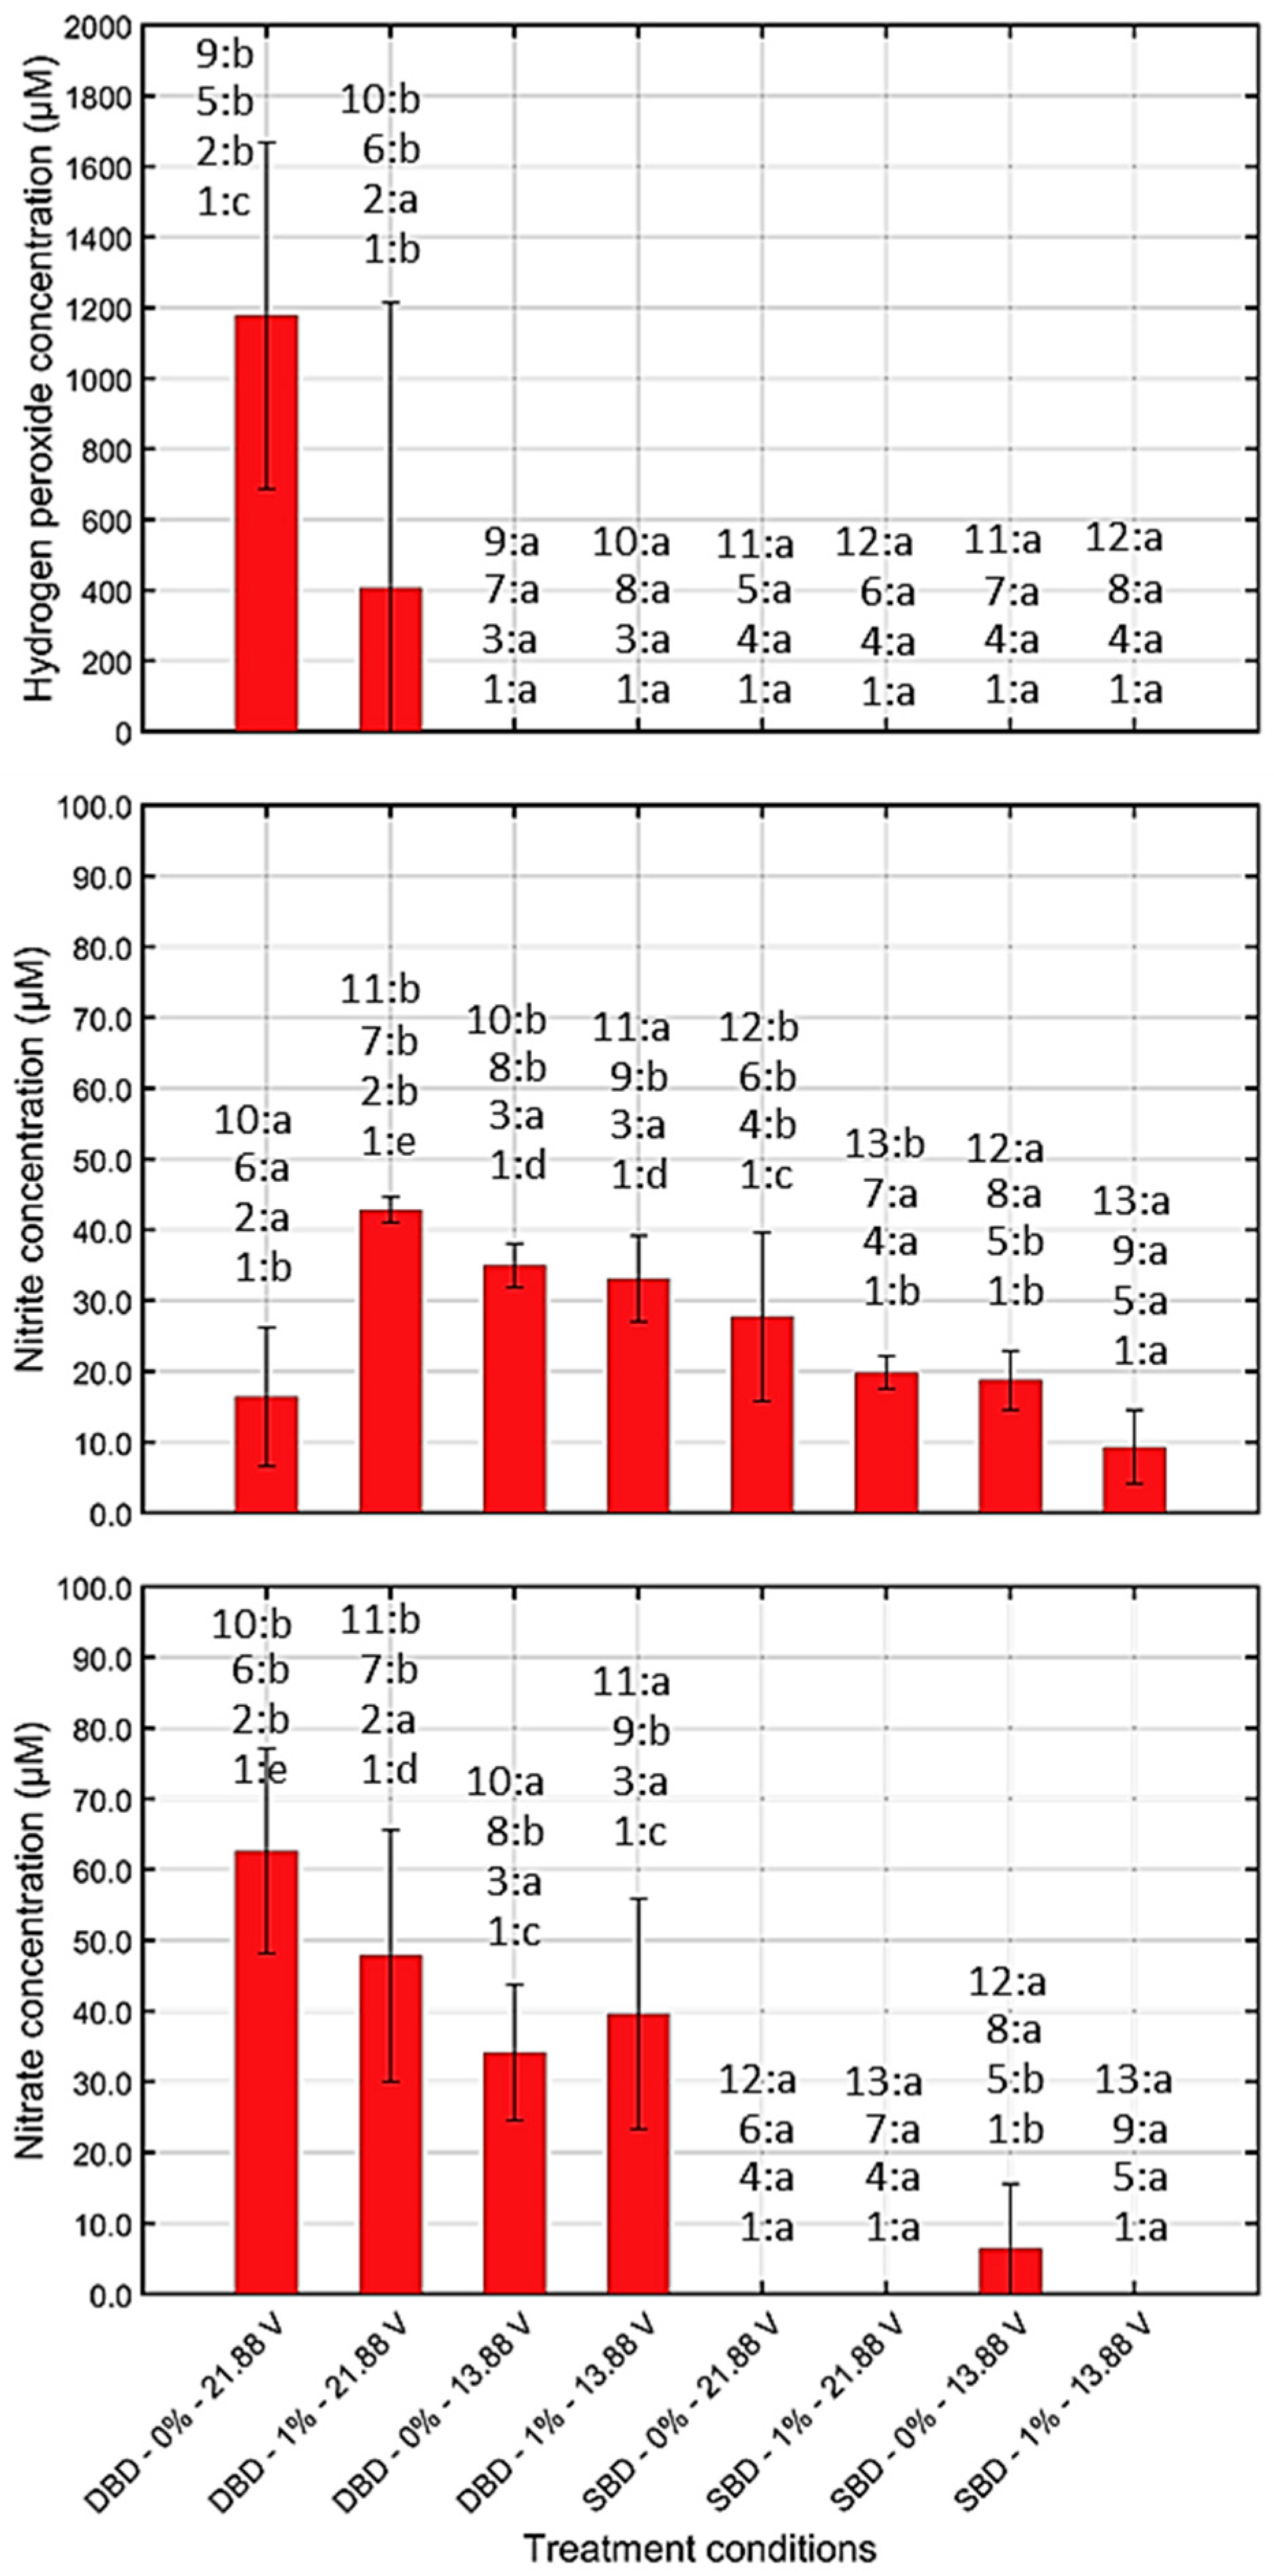
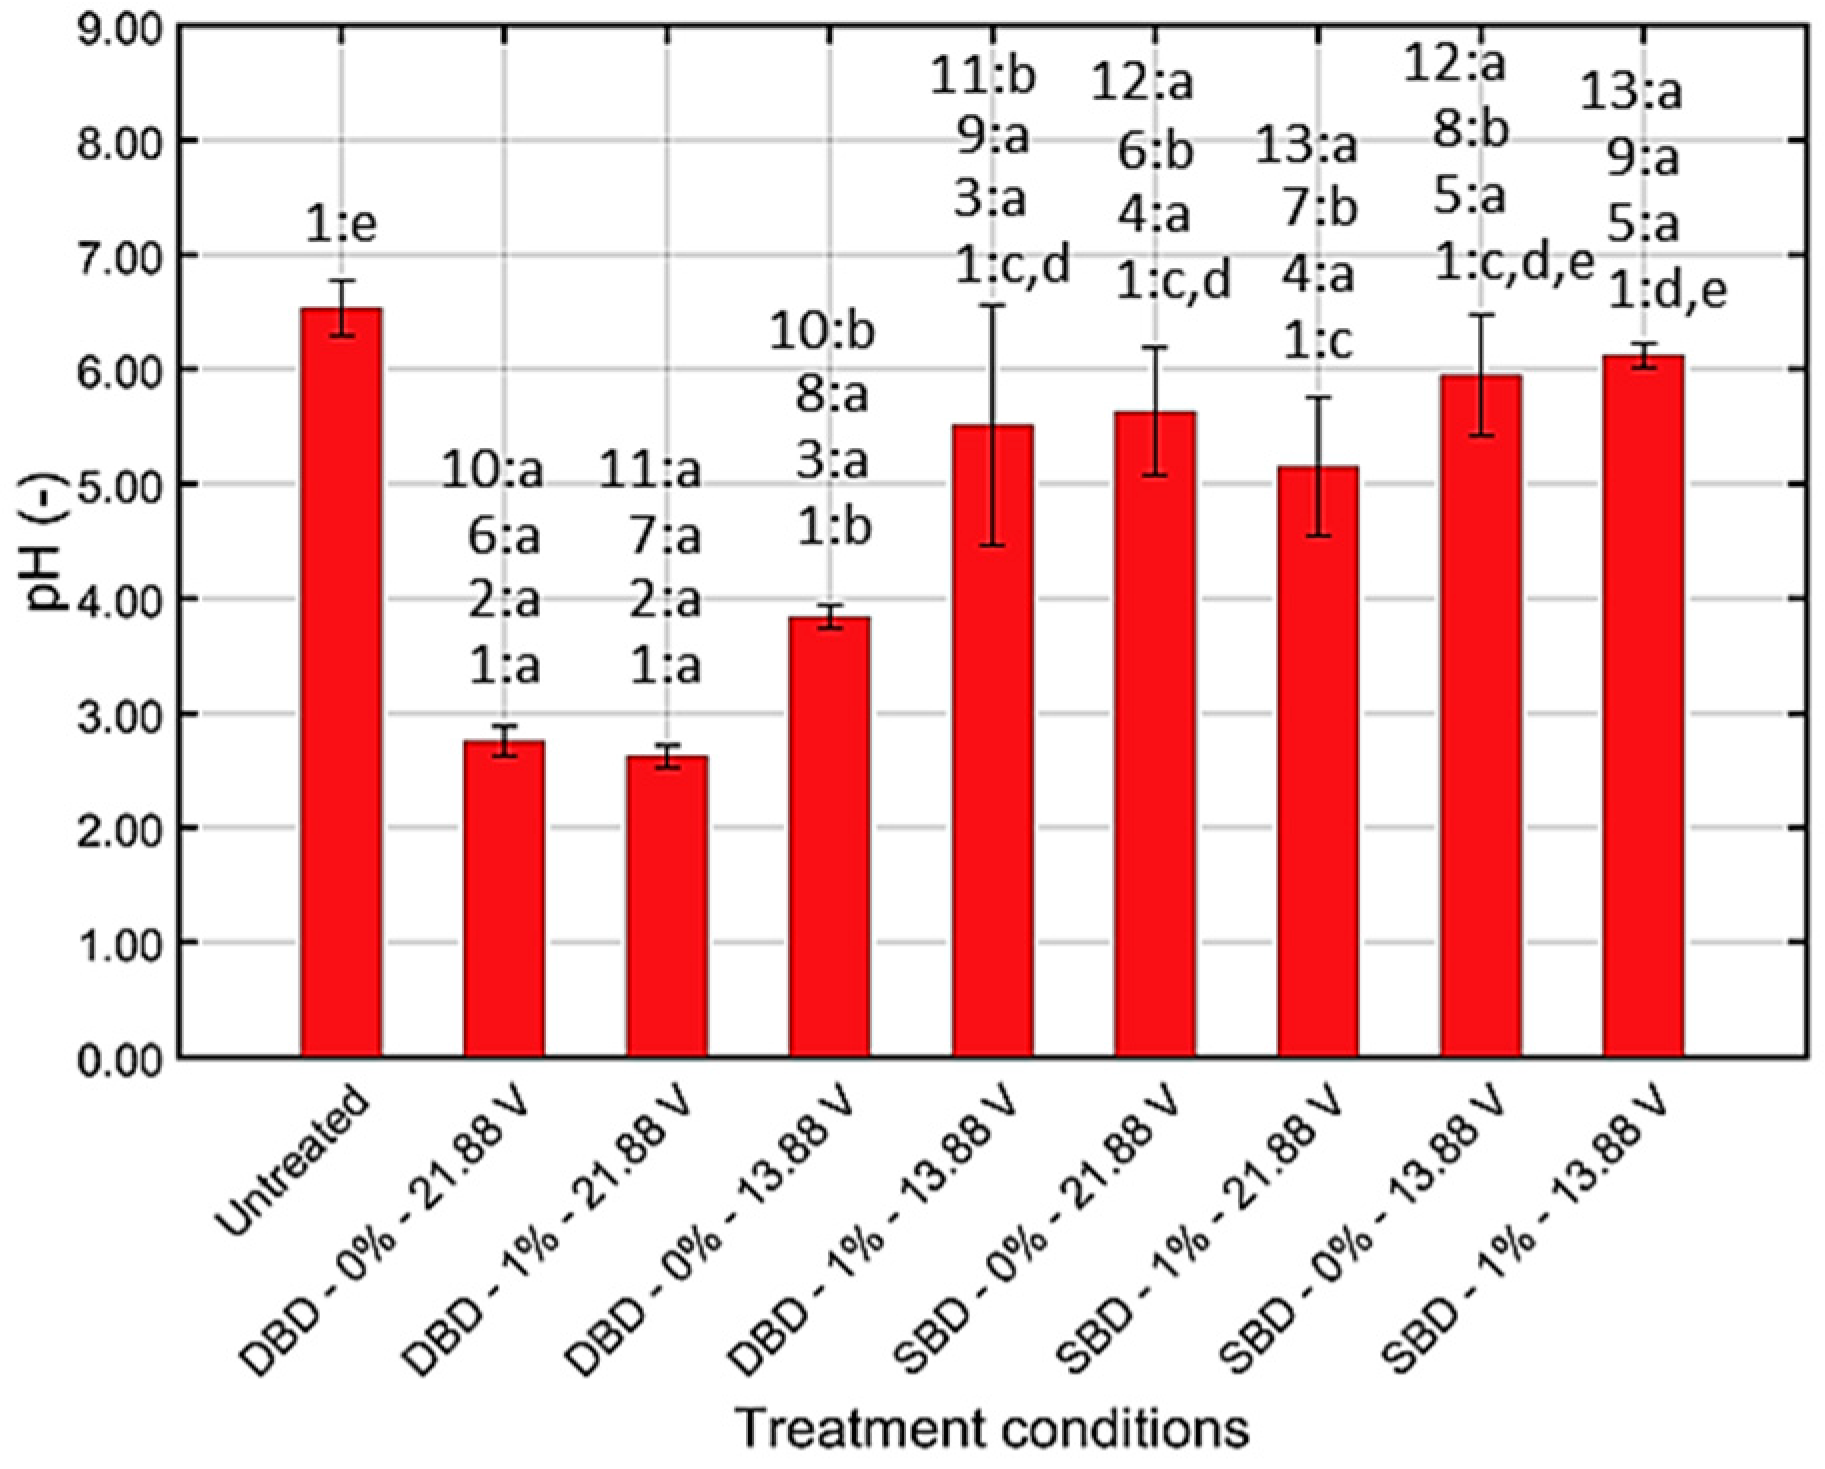
3.1.2. Chemical Composition and pH of CAP Treated Water

Following 10 min of CAP treatment of a small volume of water, the generated concentrations of H2O2, nitrite, and nitrate were quantified (Figure 3) and the pH of the solution (Figure 4) was determined. Separate ANOVA tests were performed to determine if significant differences were observed between all tested conditions and to examine the influence of a certain plasma characteristic while keeping the other plasma characteristics constant.
Based on Figure 3, it can be concluded that H2O2 was only formed at two CAP treatment conditions, i.e., while using the DBD electrode and the highest discharge power at both oxygen levels. As a result, the influence of the plasma characteristics on the formation of H2O2 proved to be rather limited, i.e., the DBD electrode is favored over the SBD electrode at the highest discharge power and the highest discharge power is preferred over the lowest discharge power using the DBD electrode. For the nitrite concentration, all treatment conditions resulted in a significant increase in nitrite compared to the control (blanc). The highest concentration was, however, observed while applying the DBD electrode at the highest discharge power and when oxygen was added to the gas flow. Regarding the influence of the plasma characteristics on the formation of nitrite, it can be concluded that there was no clear correlation between the addition of oxygen and the generation of nitrite since the presence of oxygen either resulted in (i) an increased production of nitrite, (ii) no significant differences, or (iii) a decreased production of nitrite. Generally, higher nitrite concentrations were obtained while using the DBD electrode configuration. Only one exception was observed, i.e., at the highest discharge power and without the addition of oxygen. For this specific case, the opposite trend was observed. Finally, generally higher nitrite concentrations were observed at an increased discharge power. Again, only one exception was observed, i.e., using the DBD electrode without addition of oxygen. The formation of nitrate was also influenced by the applied treatment characteristics. Some combinations of plasma characteristics did not result in a significant increase compared to the control (blanc), while up to 60 µM nitrate was formed using the DBD-0.0% (v/v)-21.88 V. The addition of oxygen generally resulted in a decreased generation of nitrate or no significant differences. Moreover, applying the DBD electrode favored the formation of nitrate, and, while using this specific electrode configuration, an increased nitrate concentration was obtained at an increased discharge power.
With respect to the pH of the CAP treated water (Figure 4), a significant drop in pH compared to the untreated control was observed for most combinations. Only while using the SBD electrode at the lowest discharge power, this was not the case using both oxygen levels. Nevertheless, it should be mentioned that this pH drop was only pronounced for three conditions, i.e., DBD-0.0% (v/v)-21.88 V, DBD-1.0% (v/v)-21.88 V, and DBD-0.0% (v/v)-13.88 V. The pH level was not influenced by the oxygen level since no significant differences were observed between the conditions with and without oxygen addition. However, the pH was influenced by the electrode configuration and the discharge power, i.e., values were (significantly) higher while using the SBD electrode and at the lowest discharge power while using the DBD electrode.

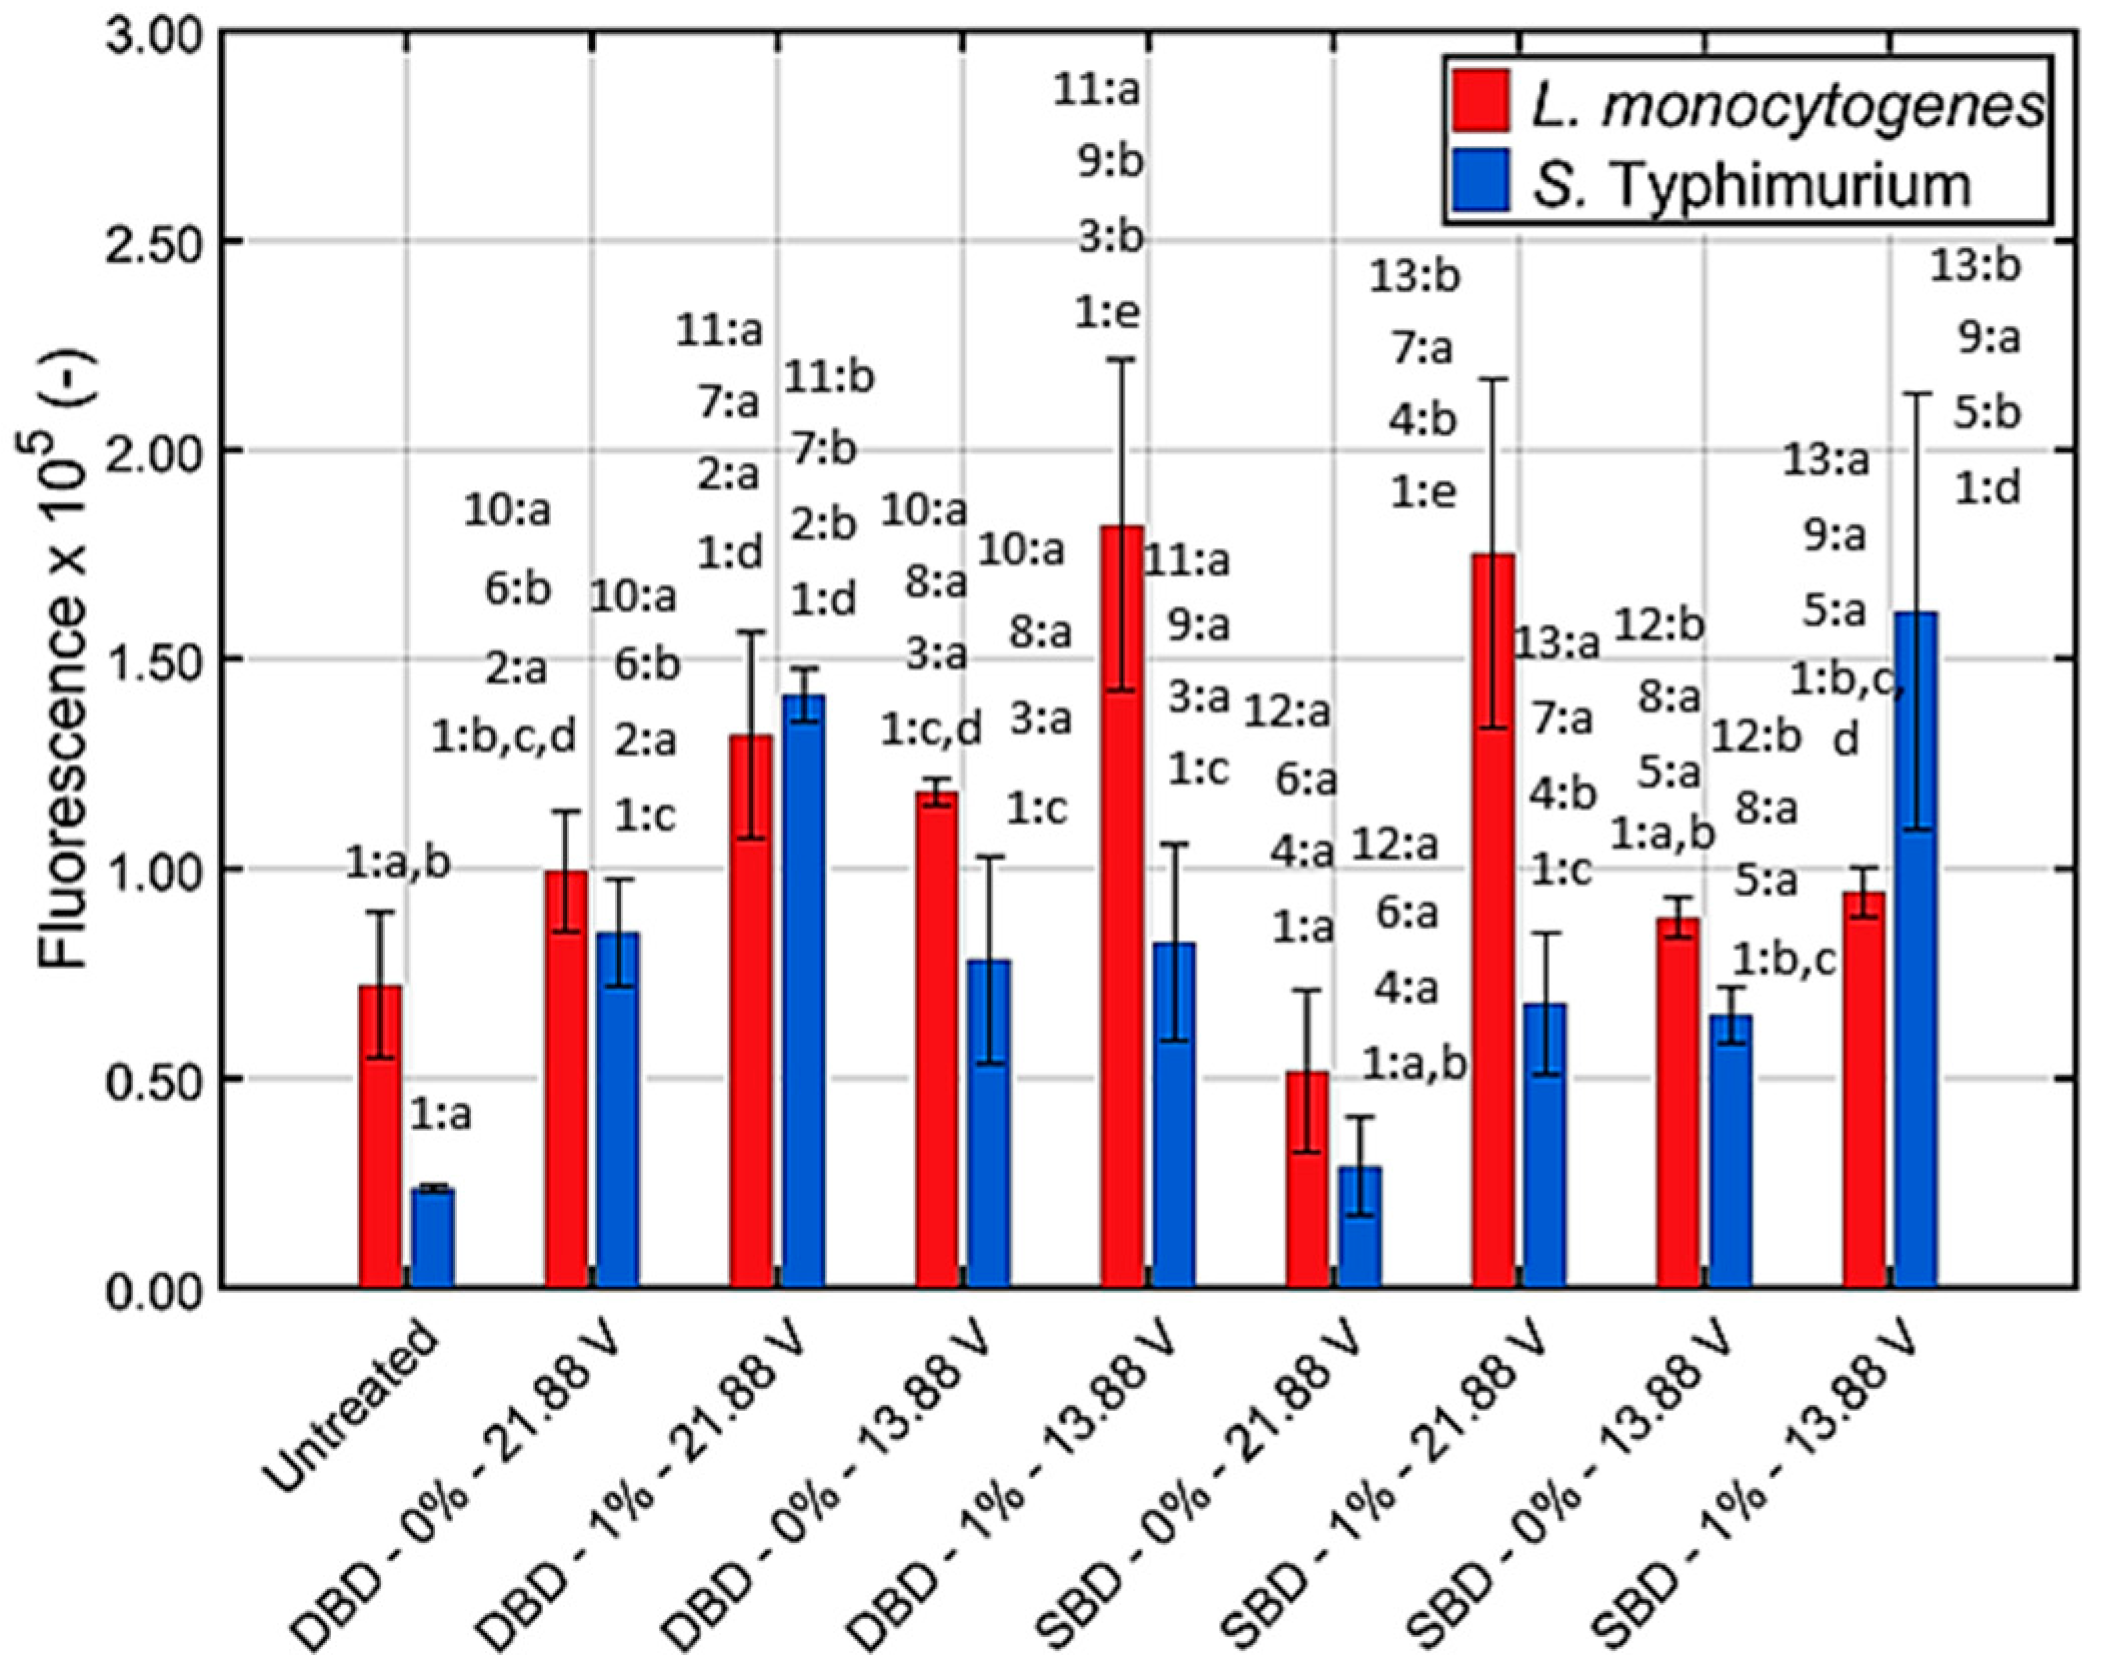
3.1.3. Generation of Intracellular Reactive Oxygen Species (ROS)

The fluorescence measurements obtained for the DCFH2-DA and CAP treated Listeria monocytogenes and Salmonella Typhimurium model biofilms can be observed in Figure 5. Separate ANOVA tests have been performed for each biofilm forming species to (i) make a comparison between the untreated control and all examined combinations of plasma characteristics, and (ii) to examine the influence of a certain plasma characteristic on the intracellular ROS generation while keeping the other characteristics constant.
For Listeria monocytogenes, it can be observed that only four conditions resulted in significantly higher fluorescence values compared with the untreated control, i.e., DBD-1.0% (v/v)-21.88 V, DBD-0.0% (v/v)-13.88 V, DBD-1.0% (v/v)-13.88 V, SBD-1.0% (v/v)-21.88 V. Regarding the influence of the oxygen level, it can be concluded that the addition of oxygen favors the creation of intracellular ROS, although not always significantly proven. For the influence of the electrode configuration, the DBD electrode resulted in (significantly) higher values, or no significant differences were observed compared with the SBD electrode. Finally, the discharge power had no major influence on the formation of intracellular ROS when applying the DBD electrode. For the SBD electrode, on the other hand, a lower discharge power was favorable when no oxygen was added, while the opposite trend was observed with the addition of 1.0% (v/v) oxygen.
For Salmonella Typhimurium, only one condition did not result in a significant increase in fluorescence i.e., SBD-0.0% (v/v)-21.88 V, indicating that the Salmonella Typhimurium cells are generally more vulnerable to the generation of intracellular ROS and/or have a higher permeability for extracellularly created ROS. As for Listeria monocytogenes, the addition of oxygen to the gas flow generally resulted in a (significant) increase in intracellular ROS. For the influence of the electrode configuration, the DBD resulted in significantly higher fluorescence values while applying the highest discharge power. For the lowest discharge power, on the other hand, no significant differences were observed between both electrode configurations. Finally, for the influence of the discharge power, (significantly) higher values were obtained at the highest value while applying the DBD electrode. For the SBD electrode, on the other hand, the opposite trend was observed.

3.2. Effect of the Generated (Reactive) CAP Species on the Biofilms

3.2.1. Viable Cell Density Reduction Due to UV Light

As mentioned before, biofilm samples were covered with a quartz disc to only allow the UV photons to interact with the model biofilms. Log-reductions were calculated based on the remaining viable population following CAP treatment and the cell density of the untreated model biofilms. These initial cell densities were 7.10 ± 0.32 and 6.10 ± 0.34 log10(CFU/cm2) for the untreated Listeria monocytogenes and Salmonella Typhimurium model biofilms, respectively. These log-reductions (with implementation of the quartz disc) were compared with those previously observed without implementation of the quartz disc [17] and this comparison can be observed in Figure 6 for both model biofilms. Separate ANOVA tests were performed to (i) compare the log-reductions obtained with and without quartz disc while applying the same plasma characteristics, and (ii) to examine the influence of one plasma characteristics on the log-reductions obtained with implementation of the quartz disc while keeping the other influencing factors constant.
Based on Figure 6, it can be concluded that the log-reductions obtained with the implementation of the quartz disc were quite low, i.e., the values were generally lower than 1 log10(CFU/cm2). Comparing the log-reduction results obtained with and without the implementation of the quartz disc, it can be observed that only two CAP treatment conditions resulted in significant differences for the Listeria monocytogenes model biofilm, i.e., significantly higher log-reduction values were obtained without the quartz disc for SBD-0.0% (v/v)-21.88 V and SBD-1.0% (v/v)-21.88 V. For the Salmonella Typhimurium model biofilms, on the other hand, log-reduction values without quartz disc were generally higher than the corresponding values with quartz disc. Only three exceptions were observed, i.e., no significant differences were observed for DBD-1.0% (v/v)-13.88 V, SBD-0.0% (v/v)-13.88 V, and SBD-1.0% (v/v)-13.88 V.
Regarding the influence of the plasma characteristics on the contribution of UV light to the CAP inactivation efficacy, it can be concluded that the oxygen level generally did not influence the log-reduction values obtained with the implementation of the quartz disc. Only one exception can be observed for the Salmonella Typhimurium model biofilms, i.e., while using the SBD and the highest discharge power, higher values were obtained without the addition of oxygen. The influence of the electrode configuration was rather limited as well. Significantly higher values using the DBD electrode were only observed for two conditions, i.e., (i) for Listeria monocytogenes using a helium gas flow and the highest discharge power and (ii) for Salmonella Typhimurium using 1.0% (v/v) oxygen and the highest discharge power. Finally, also the discharge power did not have a major influence on the obtained log-reductions with the implementation of the quartz disc. For the Listeria monocytogenes model biofilms, significantly higher values were obtained at the highest discharge power using the DBD electrode and 0.0% (v/v) oxygen, while significantly higher values were obtained at the lowest discharge power using the SBD electrode and 0.0% (v/v) oxygen.

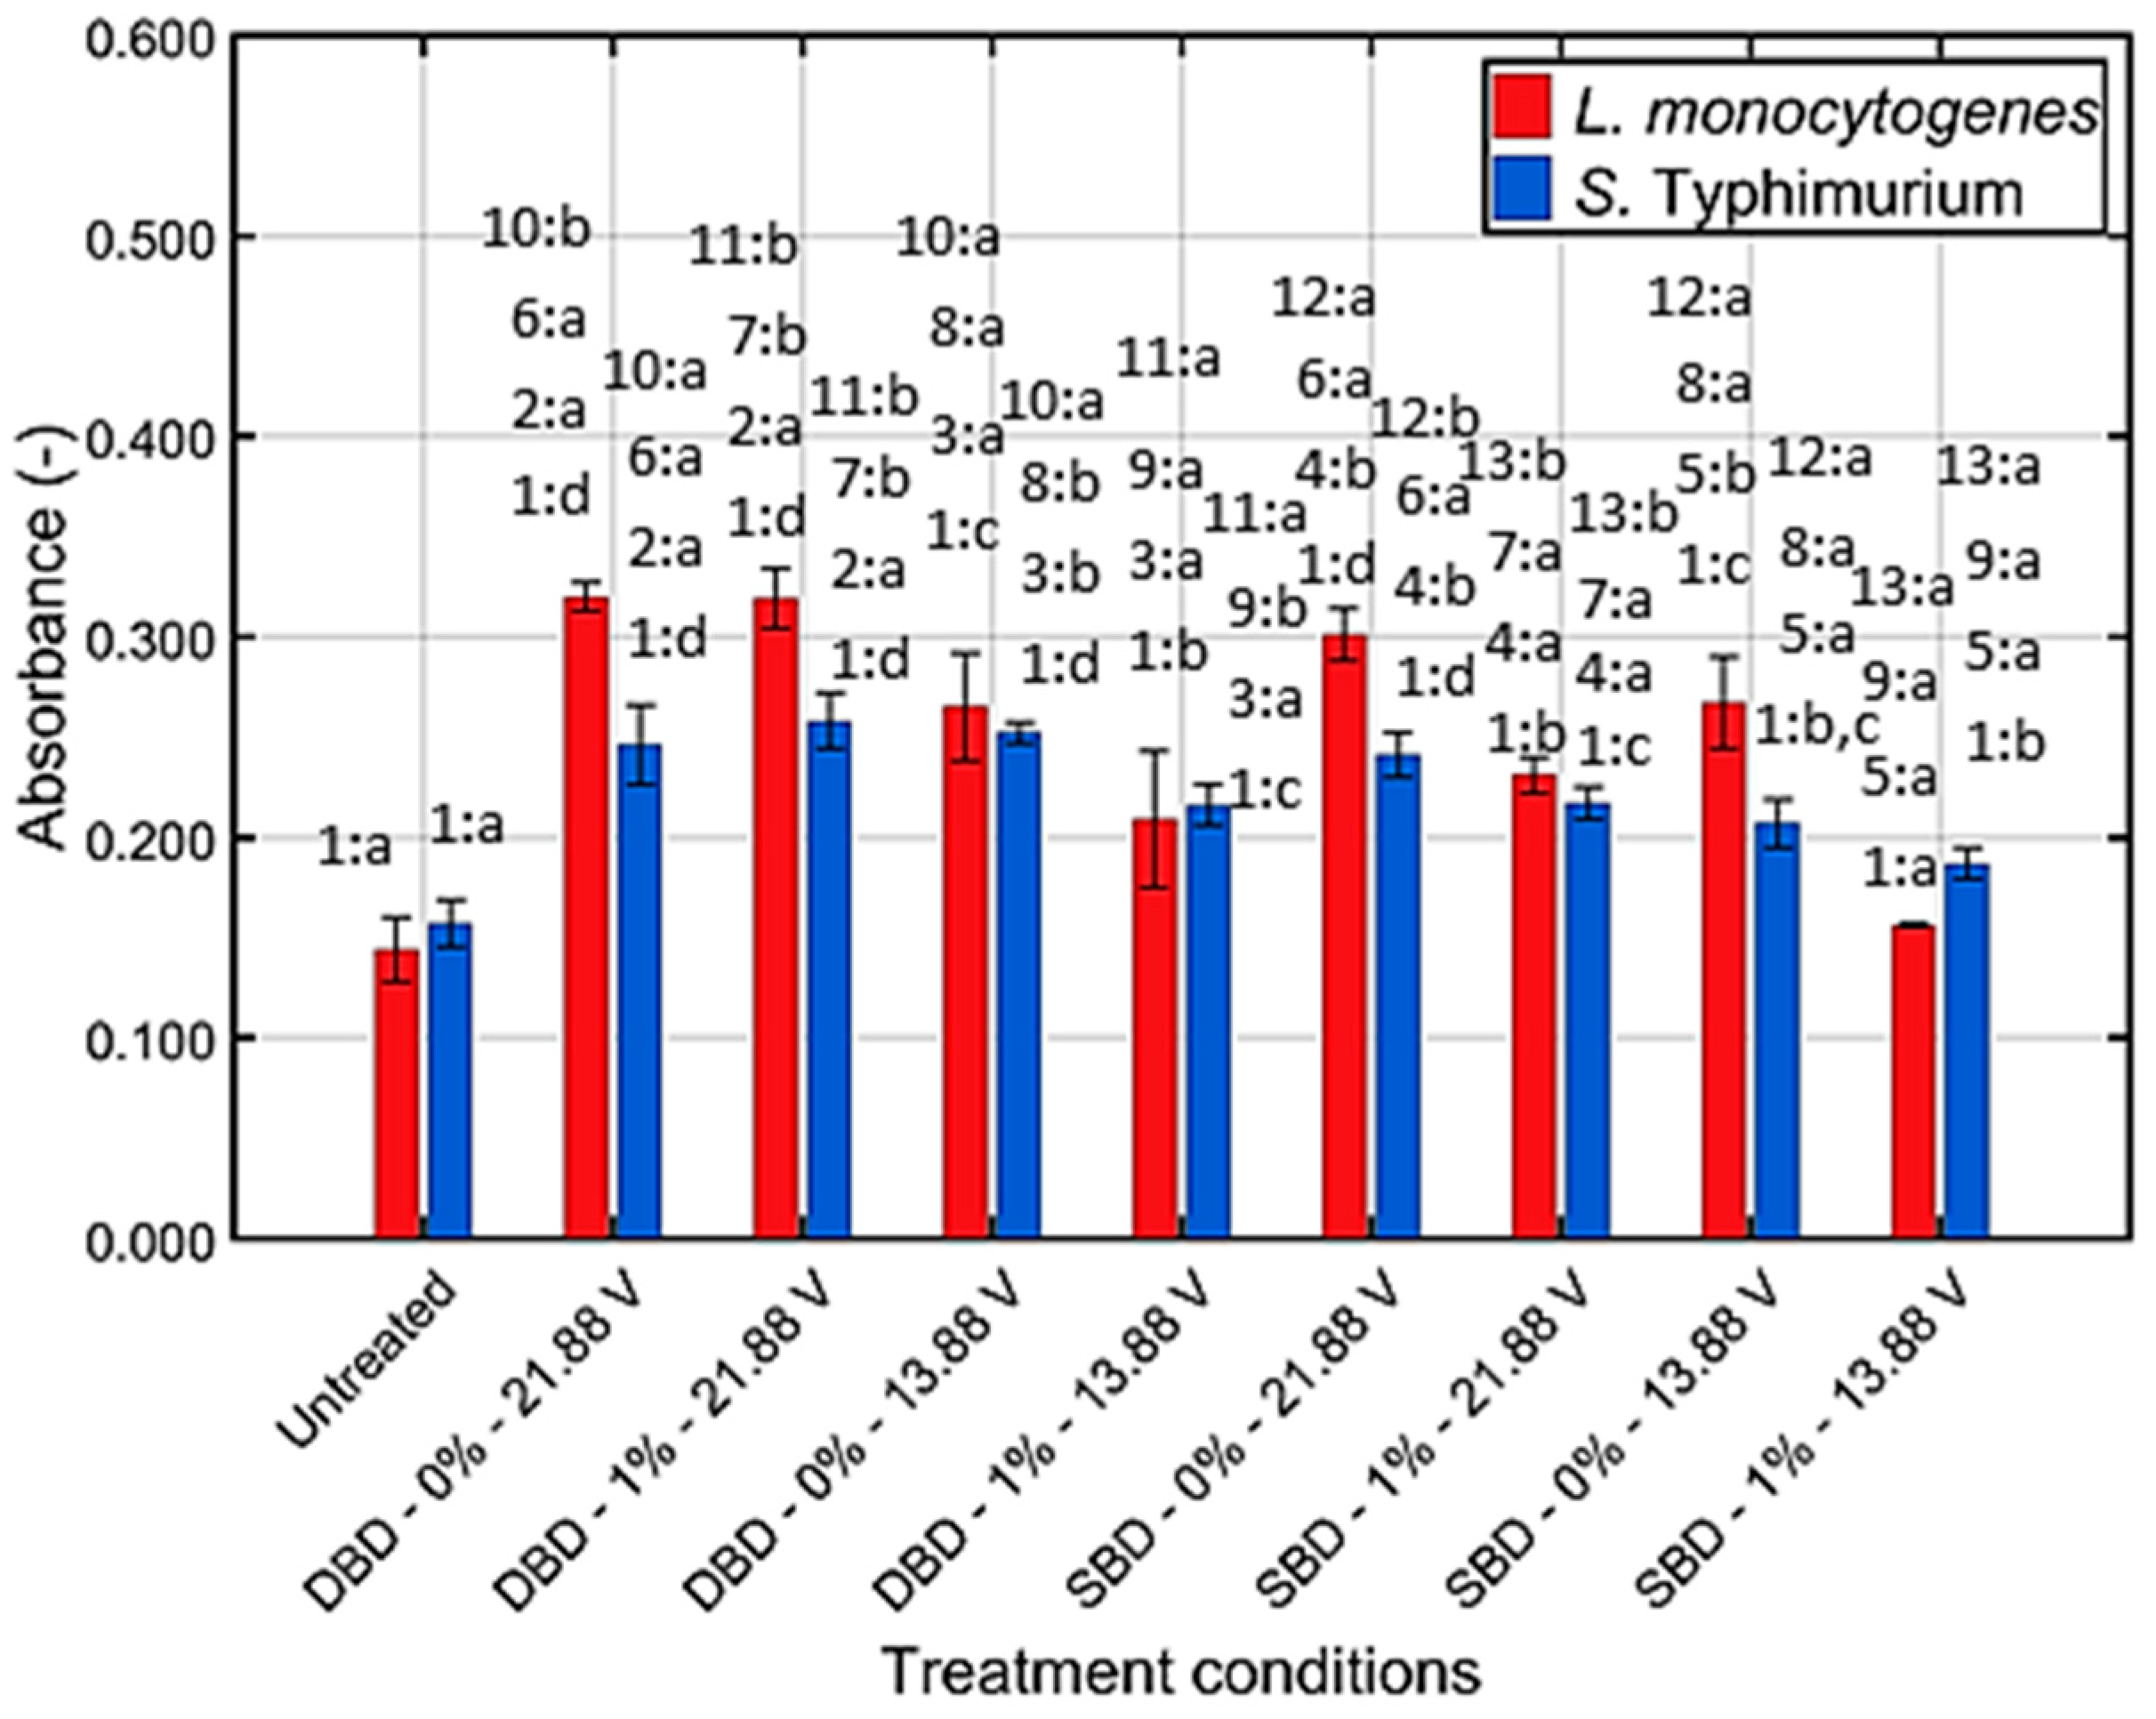
3.2.2. Membrane Integrity

In order to examine the integrity of the cell membrane following CAP treatment and the influence of the plasma characteristics on this cell attribute, leakage of intracellular DNA was quantified by means of absorbance measurements. The results of this experiment have been presented in Figure 7 for both model biofilms. Again, separate ANOVA tests were performed for each biofilm forming species to (i) compare the CAP treated samples with the untreated control and (ii) to examine the influence of a certain plasma characteristic on the membrane integrity while keeping the other characteristics constant.
For both species, almost all CAP treatment conditions resulted in leakage of intracellular DNA to the environment. Only one exception was observed for Listeria monocytogenes, i.e., SBD-1.0% (v/v)-13.88 V. Regarding the influence of the oxygen level, no significant differences were observed, or significantly higher values were obtained without the addition of oxygen to the gas flow. For the influence of the electrode configuration, significantly higher absorbance values were obtained while using the DBD electrode or the absorbance was not influenced by this plasma characteristic. Finally, the membrane integrity was also influenced by the discharge power, i.e., for most conditions, an increased discharge power resulted in a more severe destruction of the membrane.

3.2.3. DNA Damage

As mentioned before, damage to the DNA following CAP treatment was assessed by means of SYBR Green I and fluorescence measurements. The results of this experiment have been presented in Figure 8 for both model biofilms. Again, separate ANOVA tests were performed for each biofilm forming species to (i) compare the CAP treated samples with the untreated control and (ii) examine the influence of a certain plasma characteristic on the ability of the CAP species to cause damage to the DNA while keeping the other characteristics constant.
For both model biofilms, it can be observed that most treatment conditions resulted in a decreased fluorescence or damage to the intracellular DNA, although not always significantly proven. Only for the Salmonella Typhimurium model biofilms, damage to the DNA did not occur for DBD-0.0% (v/v)-21.88 V and DBD-1.0% (v/v)-21.88 V. Regarding the influence of the oxygen level on the ability of CAP to cause damage to the DNA, it can be concluded that no significant differences were observed between the conditions with and without oxygen addition or that the addition of oxygen resulted in less DNA damage. For the influence of the electrode configuration, no significant differences were observed or the use of the DBD electrode resulted in less DNA damage than observed while using the SBD electrode. Finally, for the discharge power, no significant differences were observed or less DNA damage was observed while using the highest value.

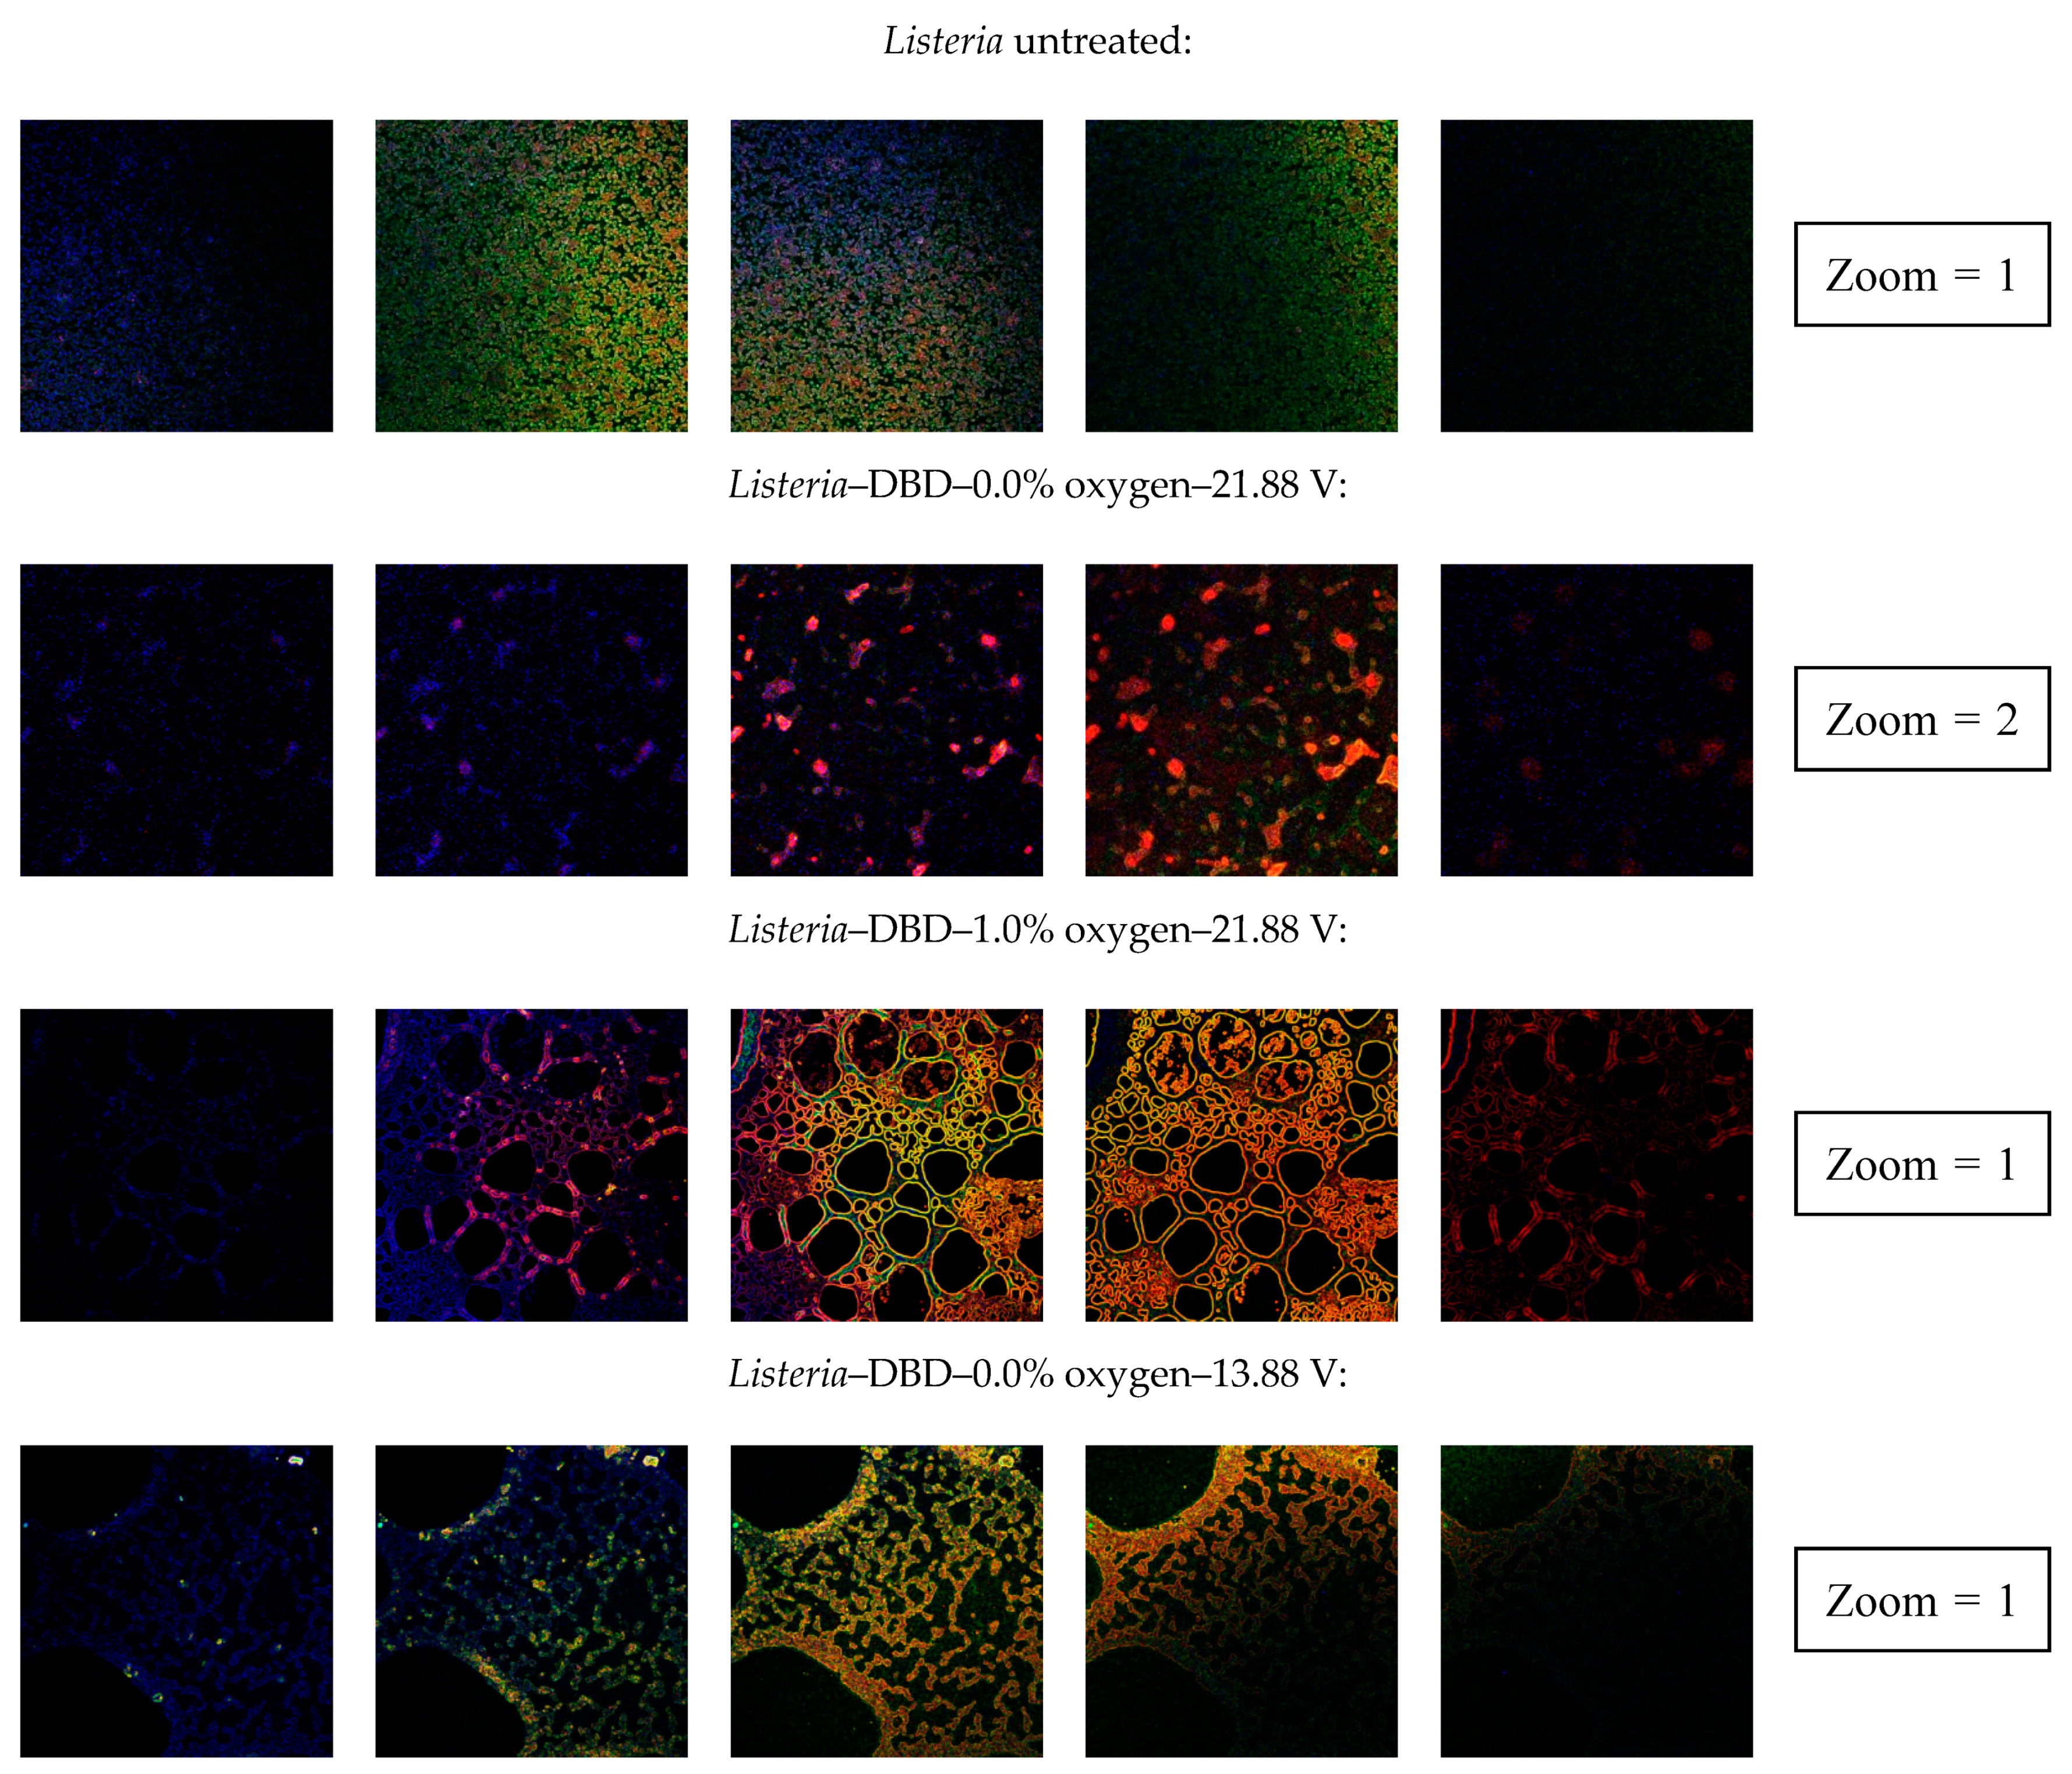
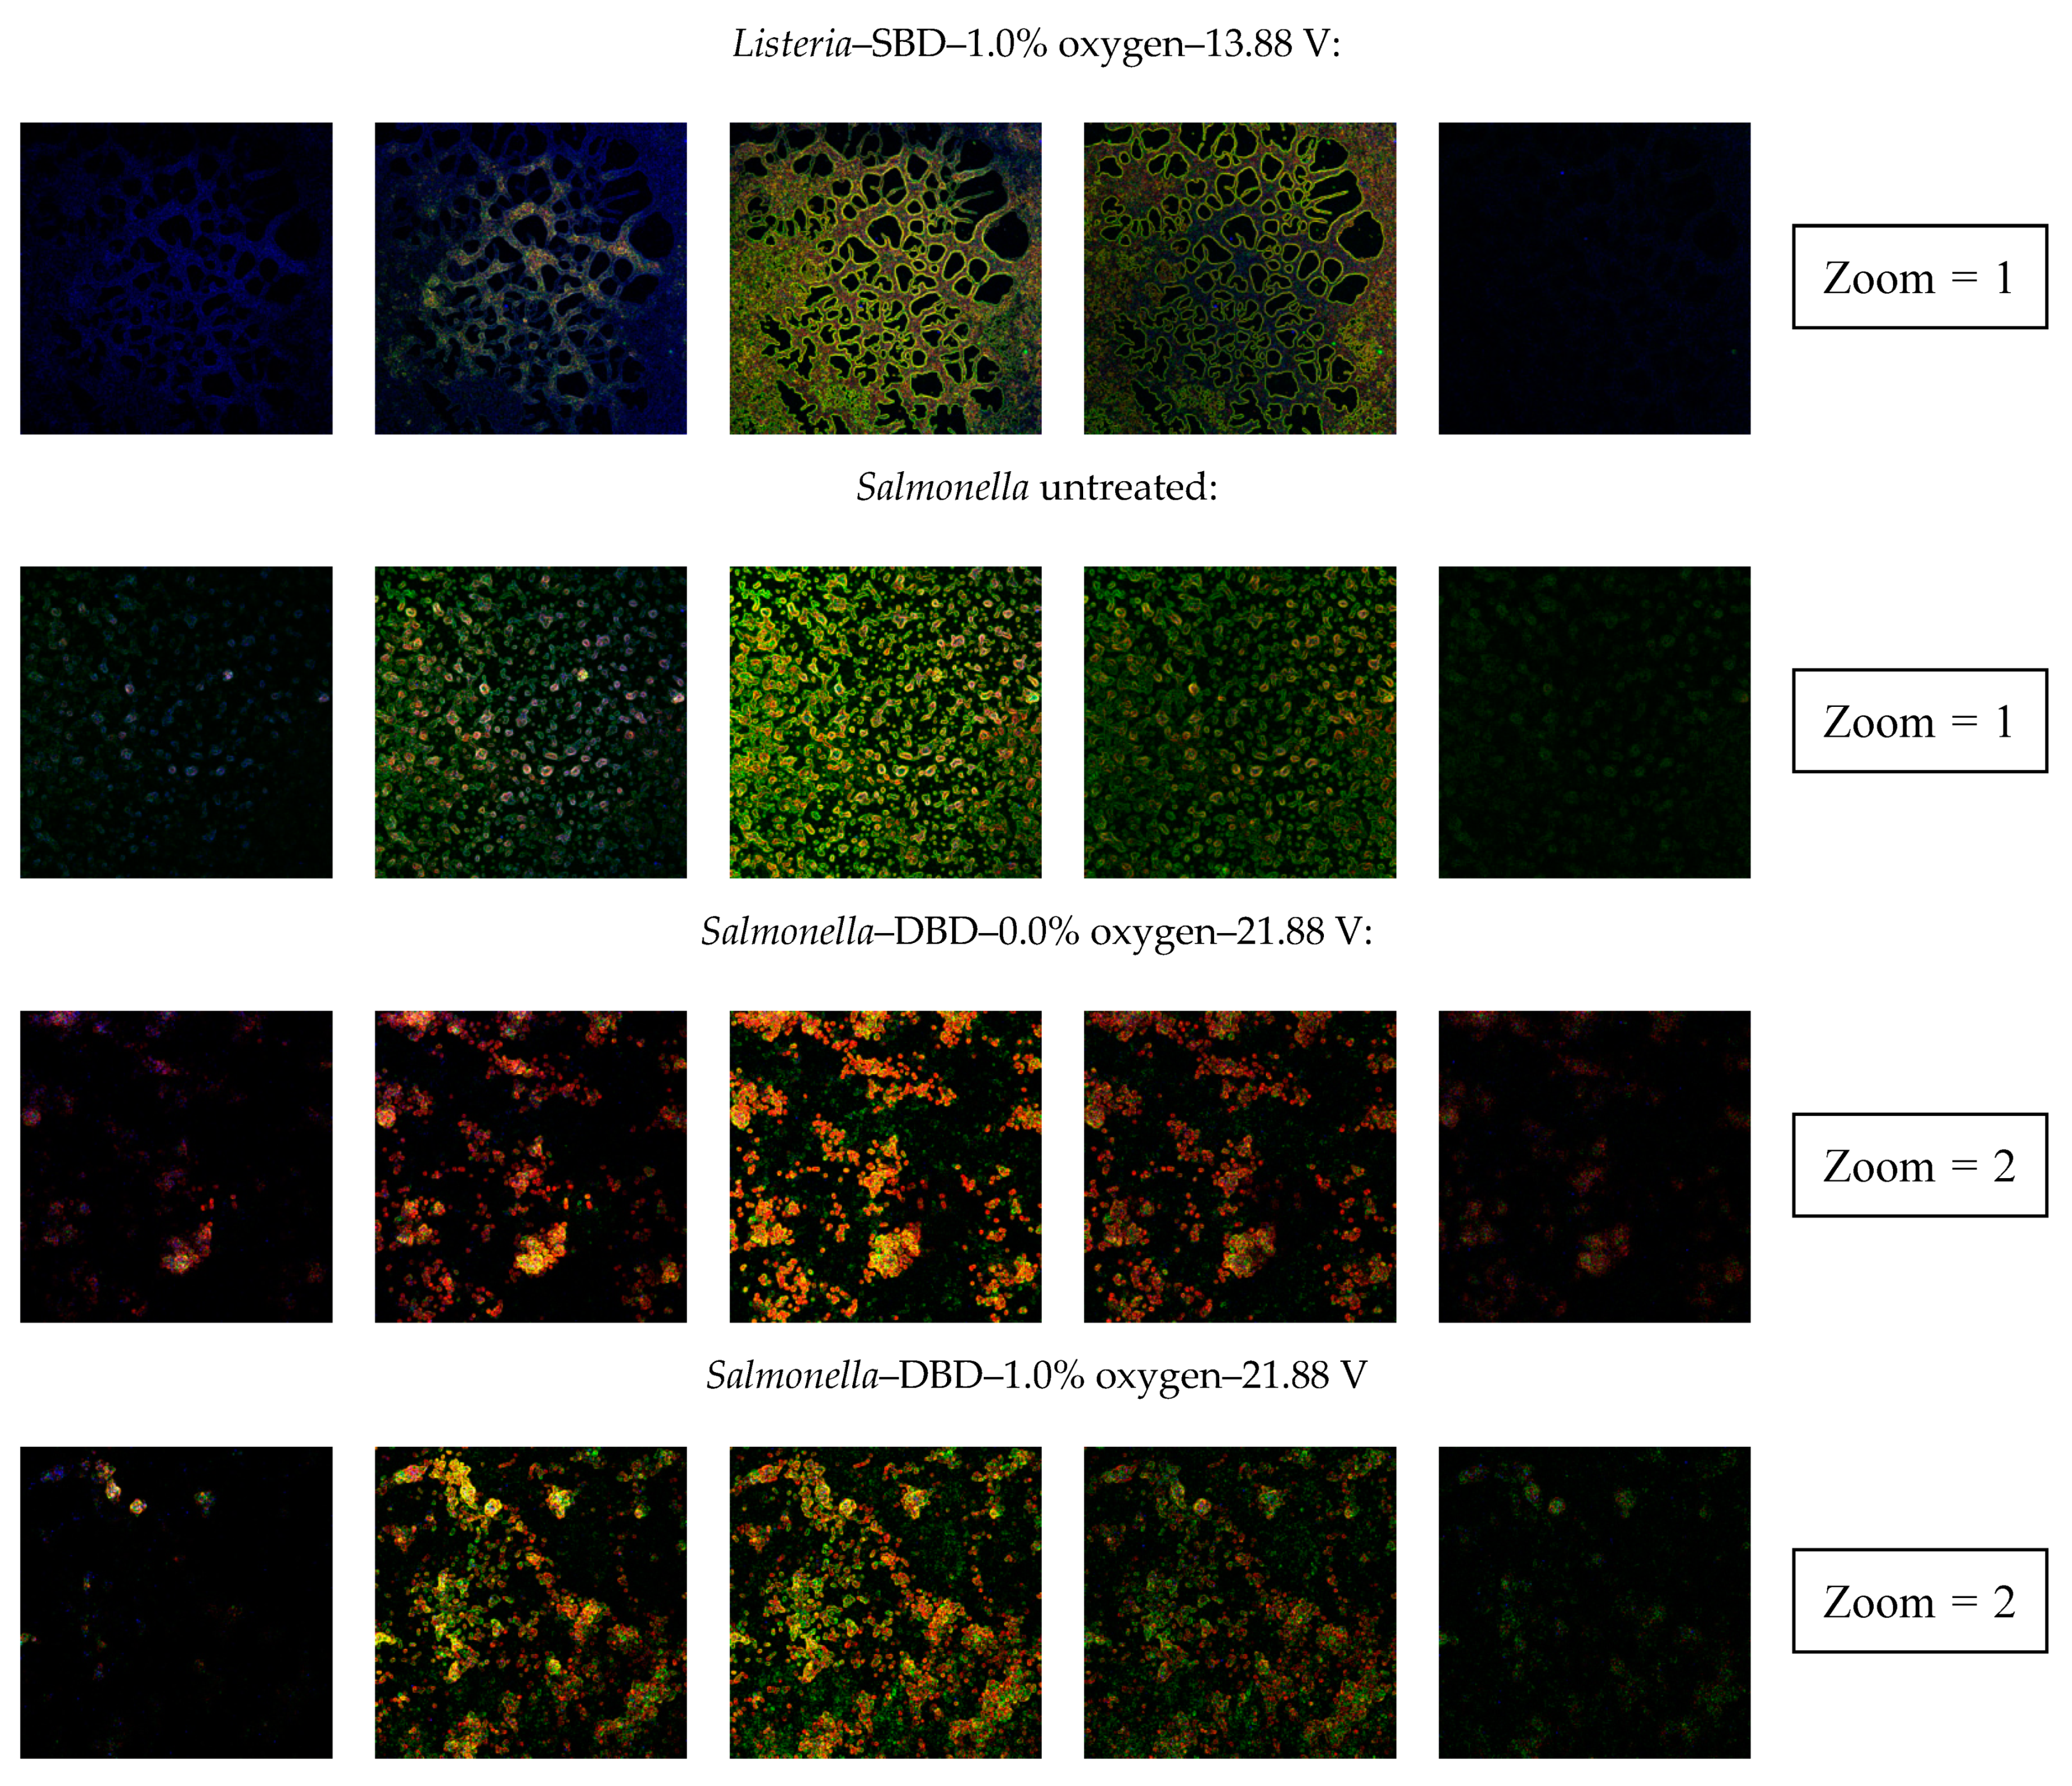
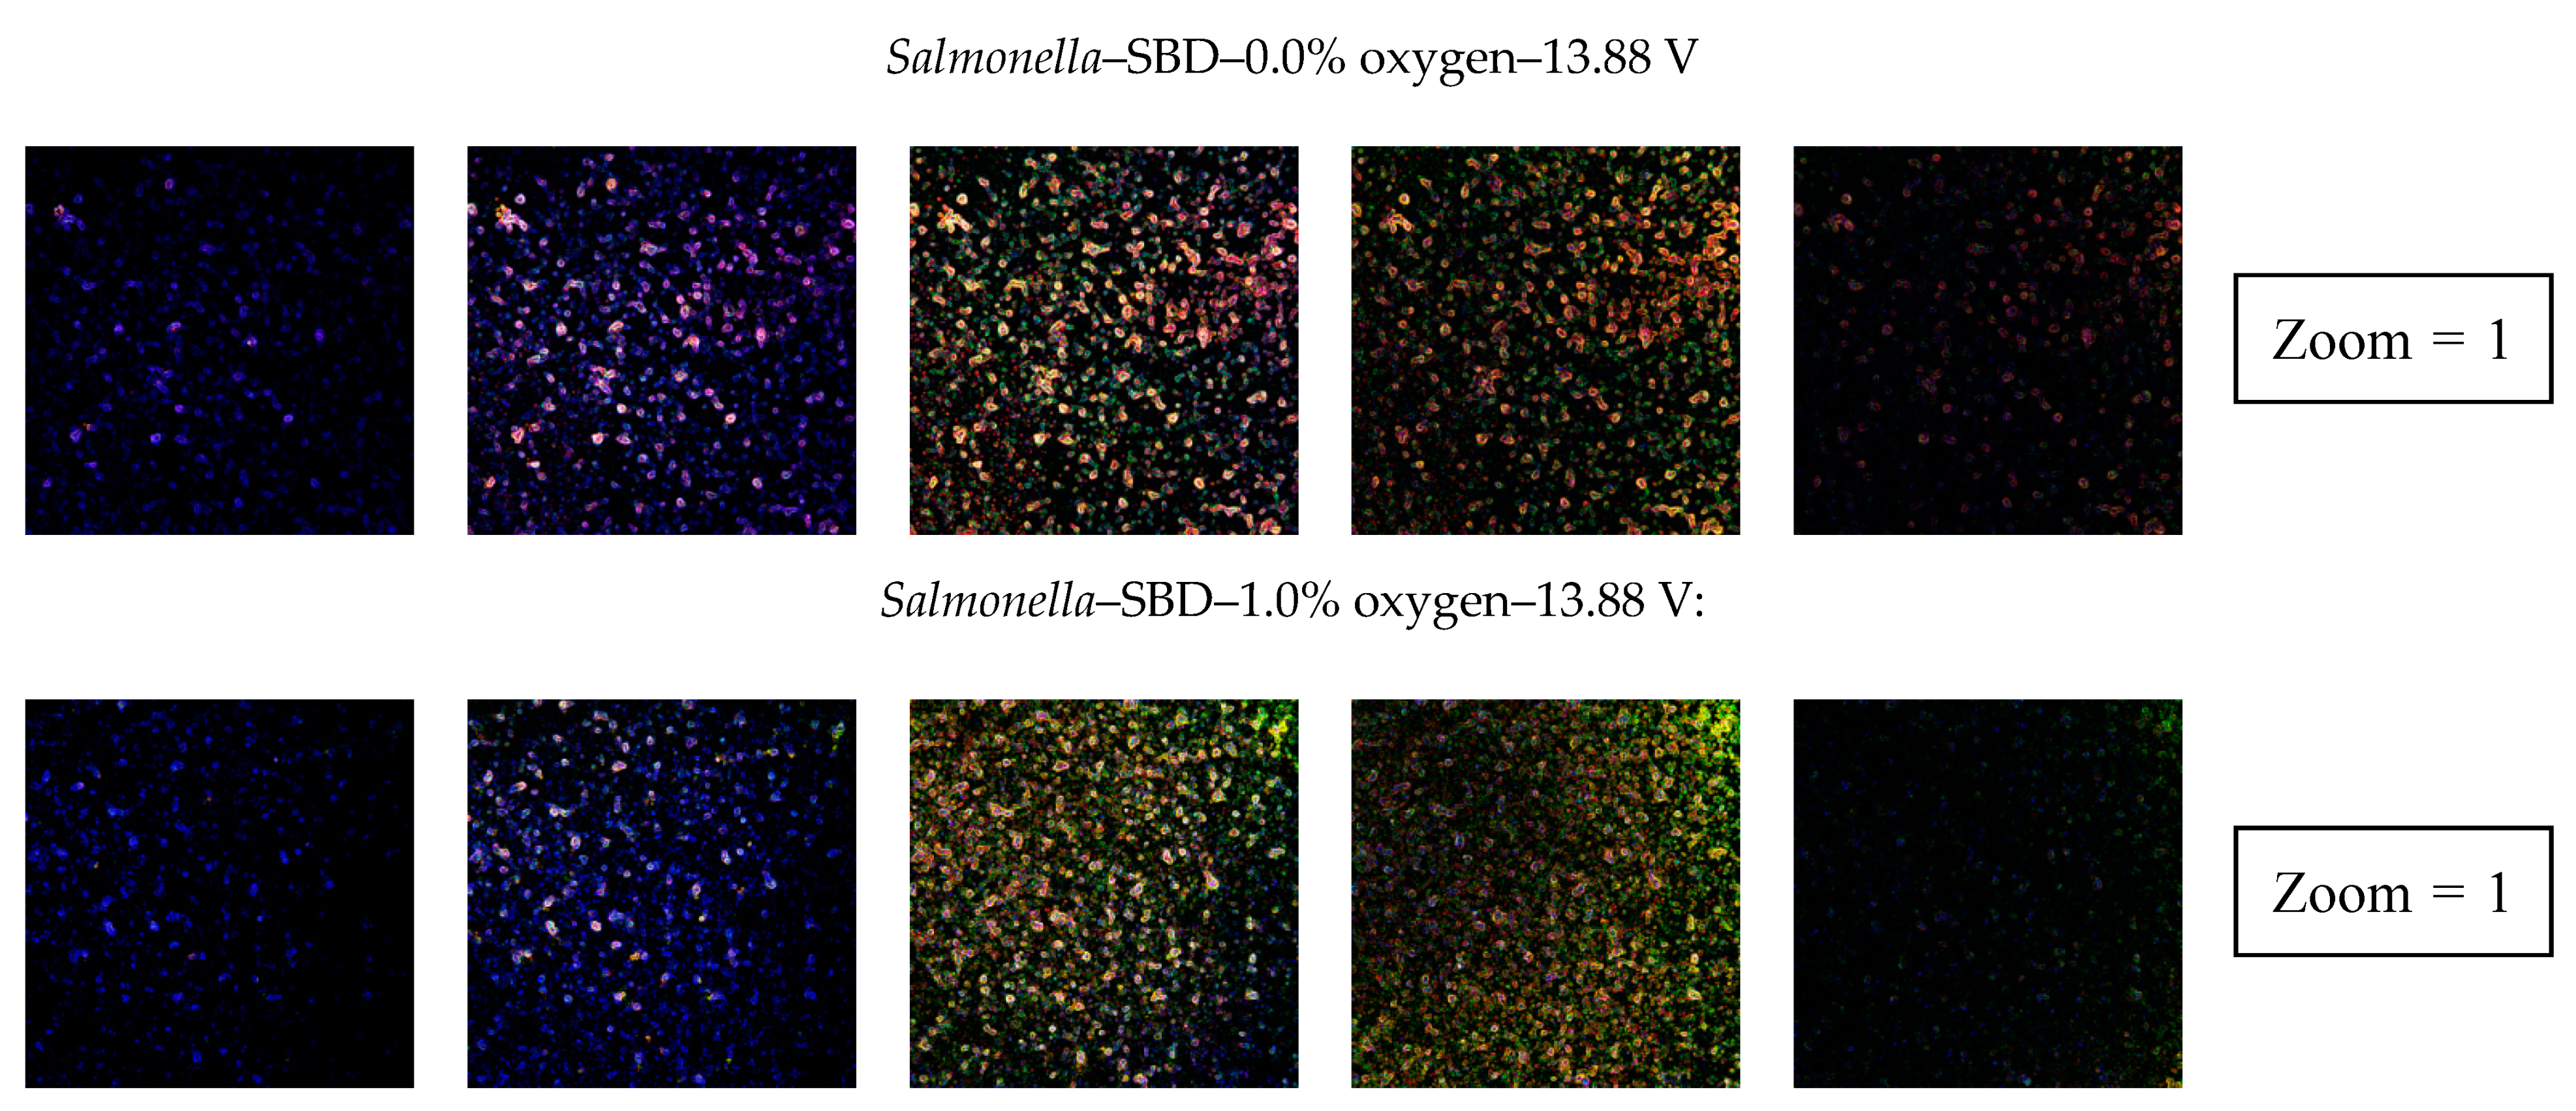
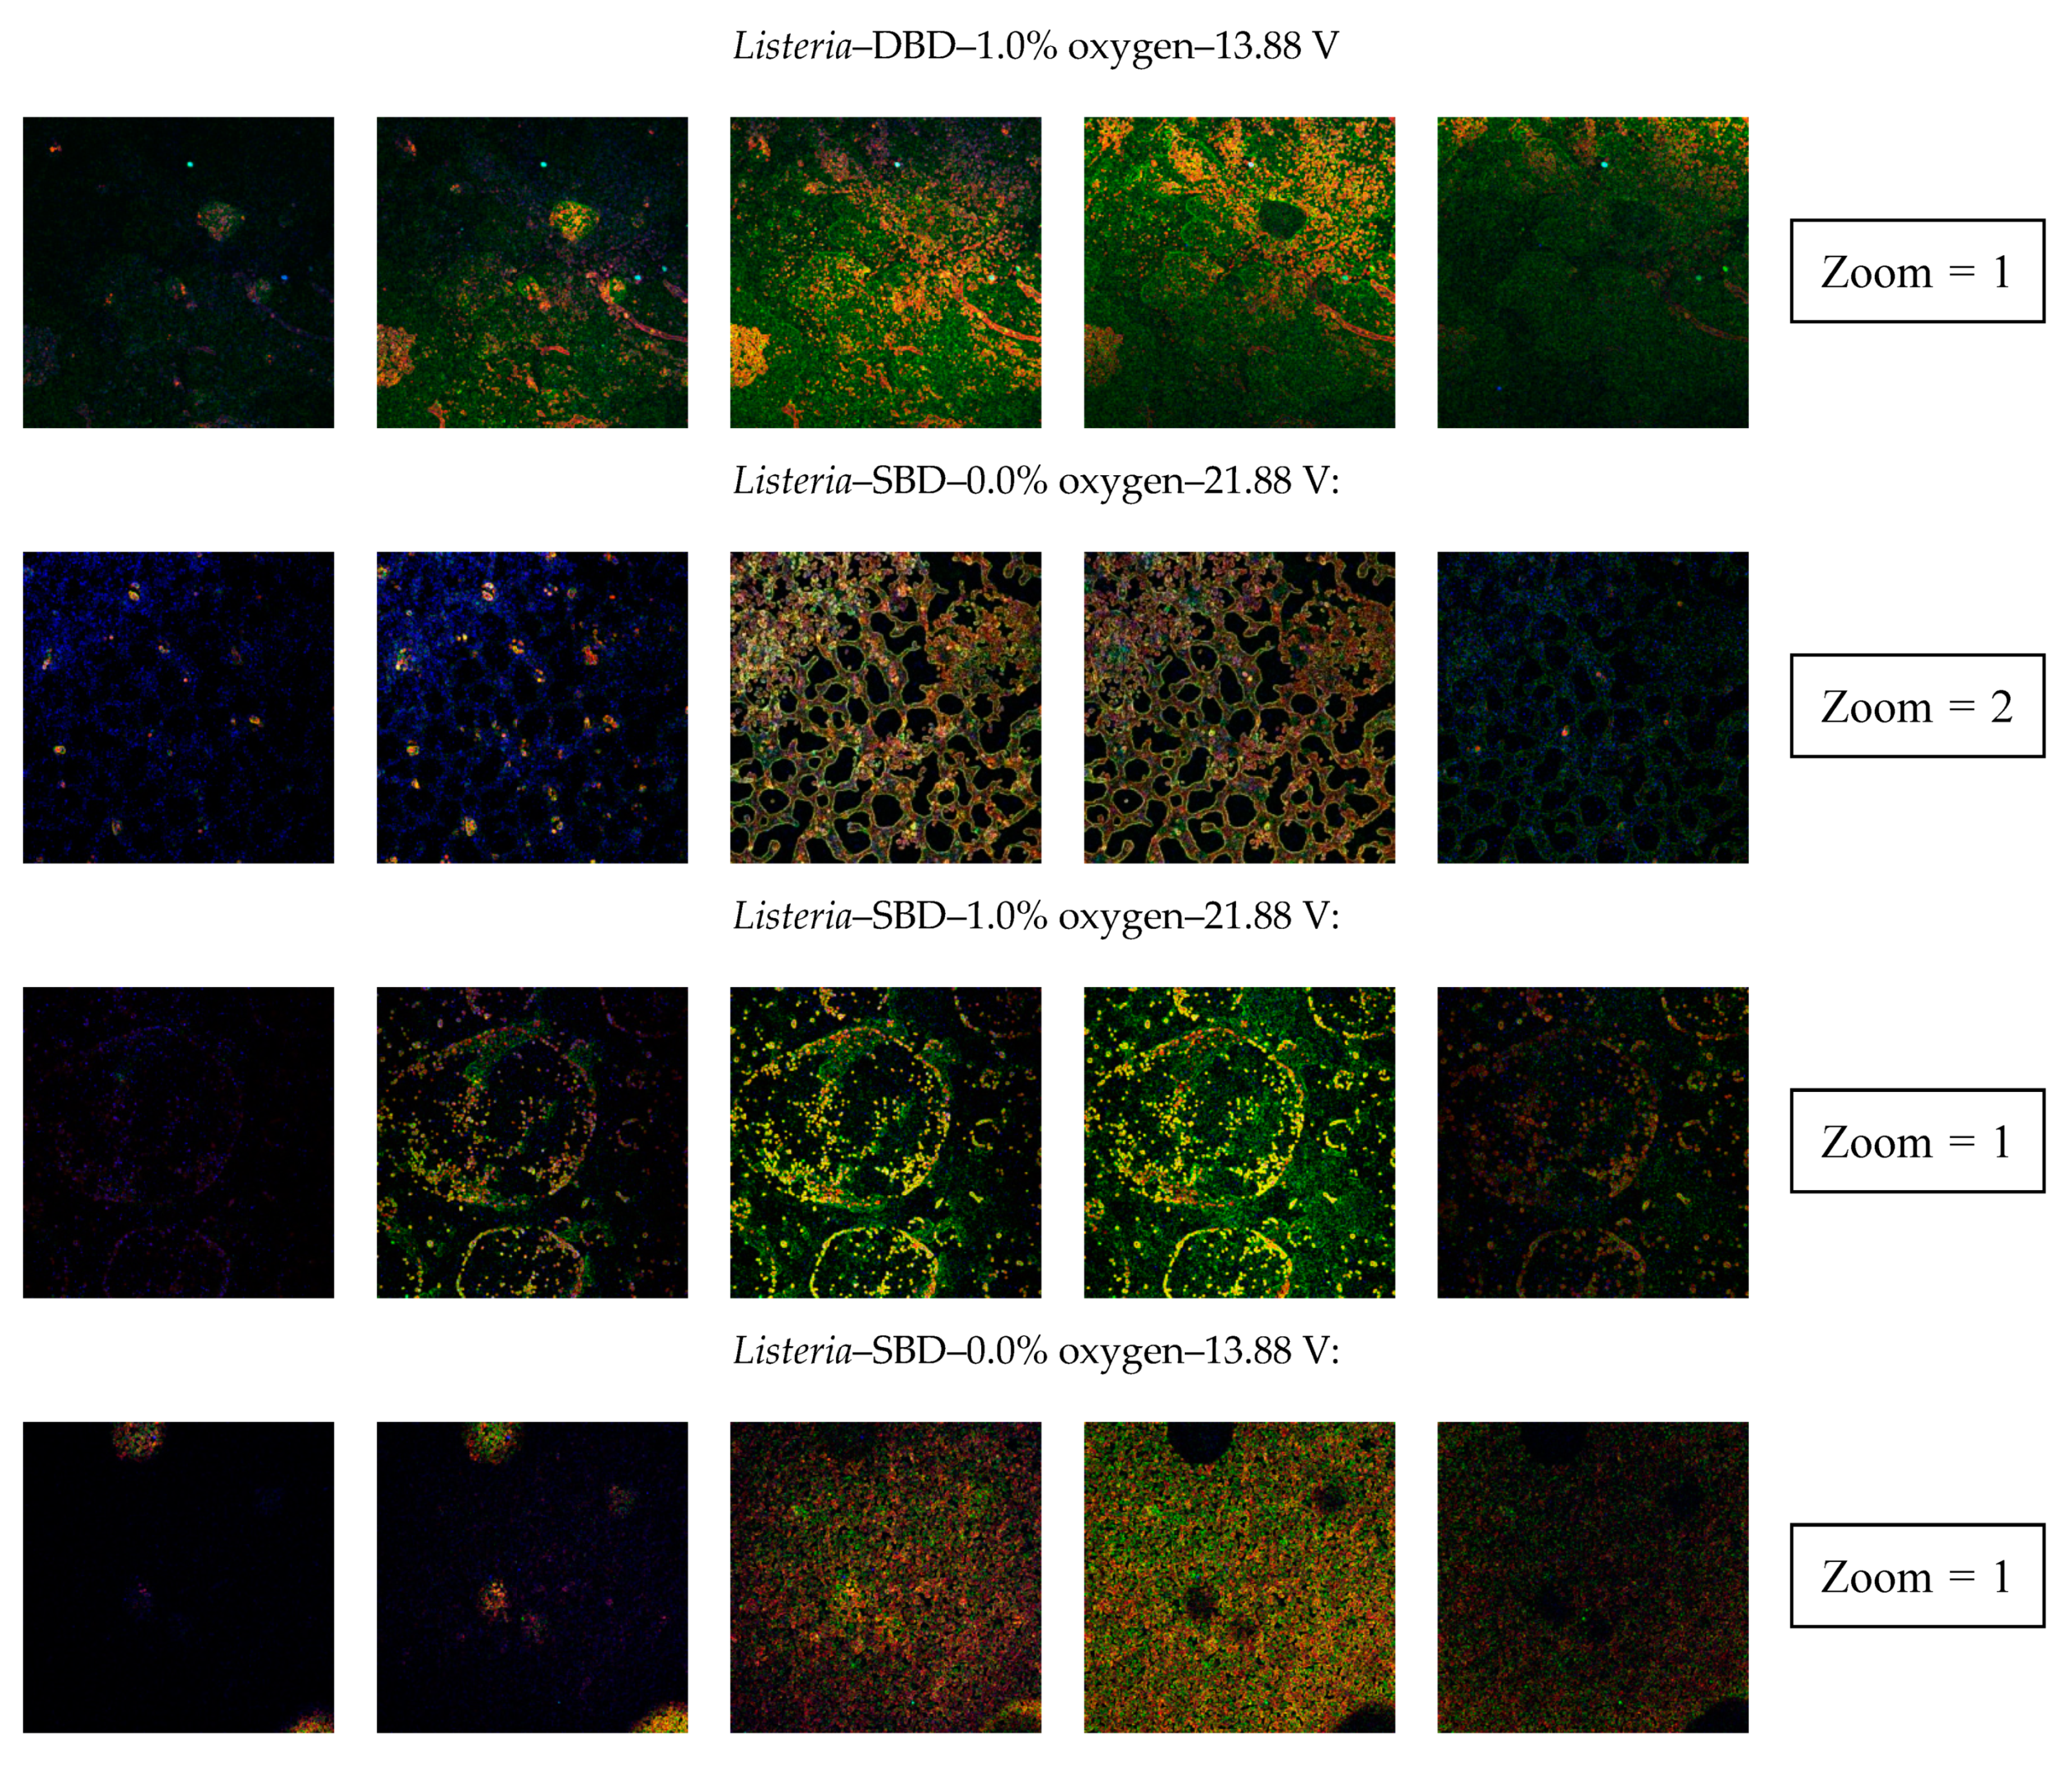
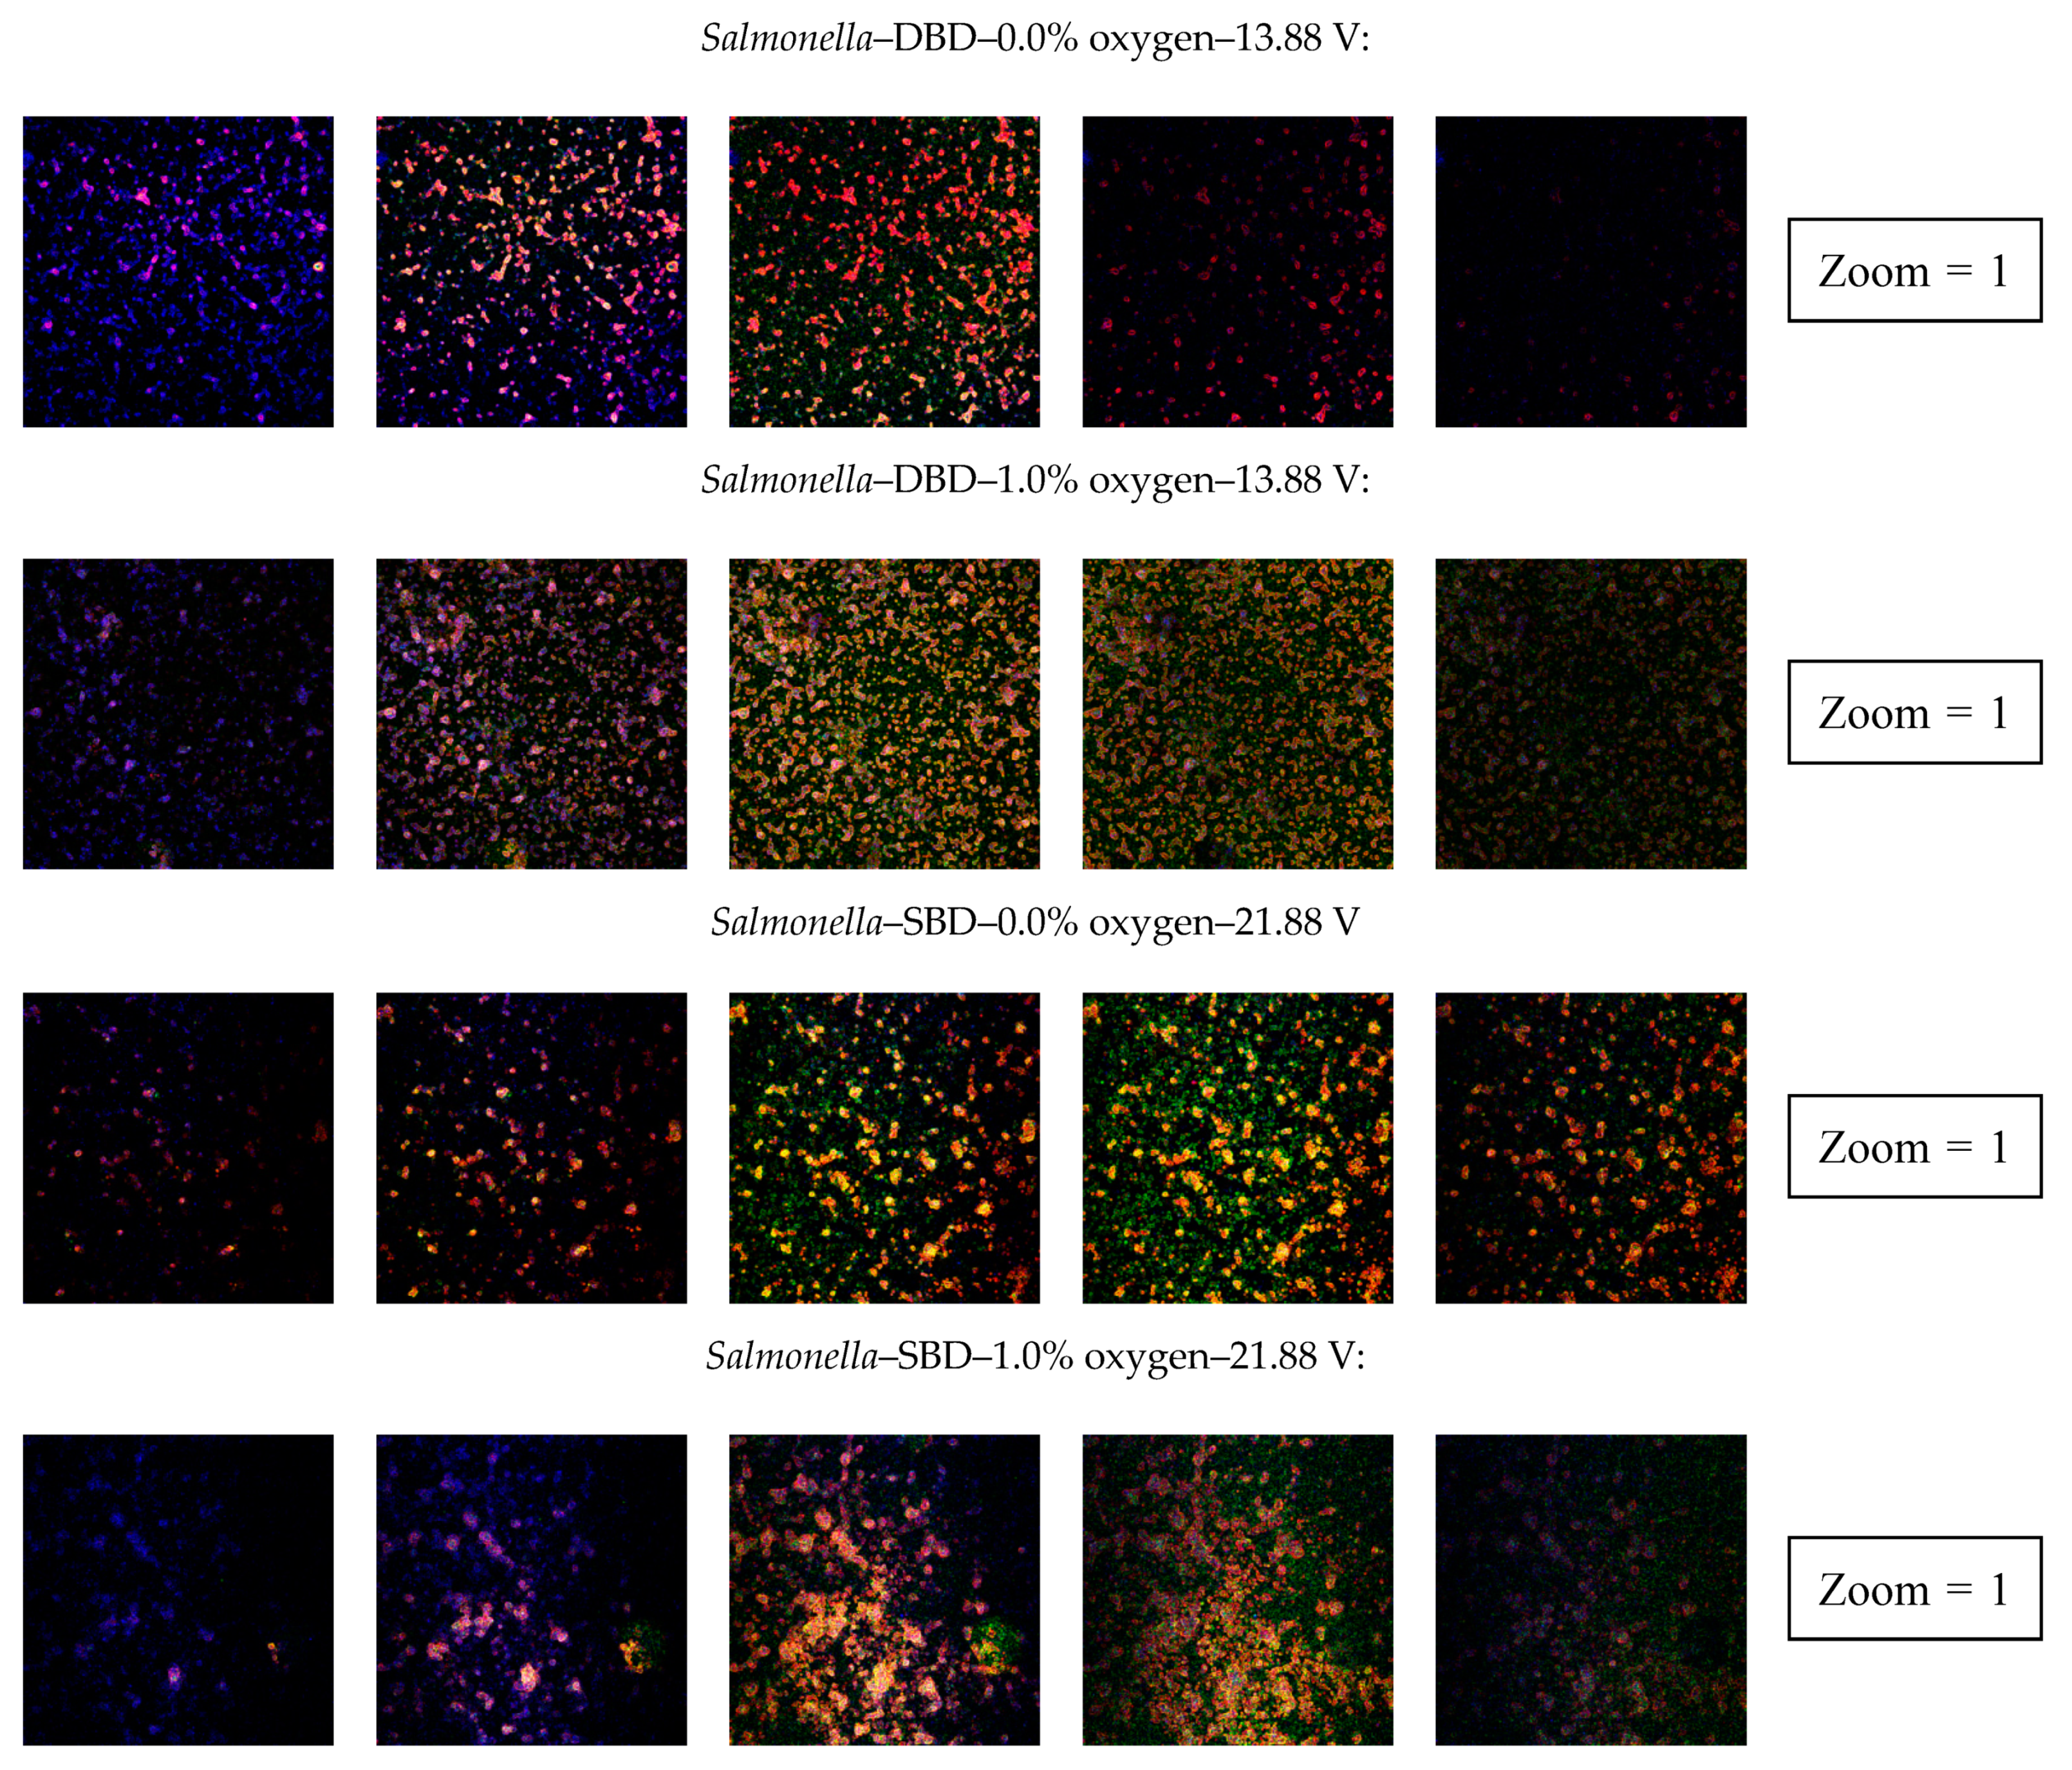
3.2.4. Confocal Laser Scanning Microscopy (CLSM)

Figure 9 provides an overview of the CLSM images obtained following CAP treatment of the two model biofilms using each possible combination of plasma characteristics. 2D-images at different depths of the biofilms were provided to examine the ability of the generated CAP species to penetrate into the deeper layers of the model biofilms (from left to right: top layers to deeper layers). Moreover, these 2D-images can be used as well to (i) comment on possible changes in the integrity of the cell membranes and (ii) examine if the CAP treatment has an effect on the biofilm structure.
.
First of all, it is important to mention that the untreated control biofilms already contained a significant amount of dead/damaged (red) cells. This has been observed before in the study of Govaert et al. [26] and this was deemed to be the consequence of the applied biofilm formation conditions resulting in (sub-lethal) injury of the cells. The intensity of the dead/damaged (red) cells, however, increases following CAP treatment of the model biofilms, indicating that the number of viable cells can be significantly reduced following CAP treatment and/or that this treatment was able to cause damage to the membrane of the cells. Moreover, for all examined CAP treatment conditions, cell damage/injury was observed into the deeper layers of the biofilms. As a result, it can be concluded that the inhibition of CAP species to penetrate into the model biofilms is rather limited. Secondly, regarding the influence of the plasma characteristics on the ability of the CAP species to penetrate into the model biofilms, no major conclusions can be drawn based on the obtained CLSM images since cell death/damage was observed in each layer of the biofilms and for each combination of plasma characteristics. Further research will be required to analyze this in detail, e.g., by means of diffusion measurements. Finally, it appears that some treatment conditions resulted in the formation of holes into the Listeria monocytogenes biofilms, indicating that the matrix of this model biofilm can be damaged by means of CAP treatment and/or that the cells show some kind of motility reaction upon exposure to CAP.

4. Discussion

4.1. Quantification of the Generated (Reactive) CAP Species

4.1.1. Detection of the Generation of UV Light

The experiment with the UV-TEC strips (Figure 2) indicated that only one CAP treatment condition resulted in a significant exposure to UV light, i.e., when the DBD electrode was used at the highest discharge power and when oxygen was added to the helium gas flow. For all other examined combinations of plasma characteristics, no UV photons (250–420 nm) were detected by means of the UV-TEC strips. This will be further discussed in Section 4.2.1.

4.1.2. Generation of ROS/RNS

As mentioned before (Section 3.1.2, Figure 3), H2O2 was only detected in the CAP treated water for some of the examined combinations of plasma characteristics, i.e., for DBD-0.0% (v/v)-21.88 V and DBD-1.0% (v/v)-21.88 V. It was therefore concluded that the influence of the plasma characteristics on the formation of H2O2 was rather limited. Previous studies (e.g., [21,36]) indicated that the generation of ROS such as H2O2 was especially influenced by the gas composition, with the highest concentration measured when the feed gas contained oxygen. Within the presented study, however, the opposite trend was observed while applying the DBD electrode at the highest input voltage. Few possible explanations can be given for this observed phenomenon. First of all, it should be mentioned that the input voltage of 21.88 V resulted in the highest dissipated plasma power when no oxygen was added to the gas flow (Table 1). Consequently, this stronger plasma can result in a more efficient generation of CAP species which serve as a precursor for the generation of H2O2. One of these precursors is the hydroxyl radical, which can be generated in the presence of water vapor originating from the treated water (or from the biofilm samples) [37]. Secondly, when no oxygen is added to the gas flow, the quenching effect of the gas is comparatively low.
Hence, the (limited) amount of generated ROS originating from impurities from the environment and the presence of water vapor can still reach the sample at sufficiently high concentrations. The high amounts of generated ROS in the presence of oxygen are, on the other hand, more vulnerable to quenching. As a result, their higher generation rate is (partially) nullified [38]. Thirdly, the absence of H2O2 molecules following 10 min of CAP treatment does not necessarily mean that this species was not formed over the course of the treatment since H2O2 can further react with other molecules to form other reactive CAP species. As an example, H2O2 can react with nitrite to form nitrate and peroxynitrite at acidic conditions [39,40]. The presence of nitrate for some treatment conditions (Figure 3) can (partially) confirm this hypothesis. In future studies, it could be of interest to examine the formation of H2O2 as function of the CAP treatment time. Finally, the small water volume served as a model for the biofilm, which in reality contains a high variety of components such as proteins, polysaccharides, extracellular DNA, water, and nutrients. The complexity of the biofilms will therefore also have an effect on the generation of certain ROS by, for example, serving as an oxygen scavenger [41]. In future research, the complexity of the water model could be increased by adding some proteins, polysaccharides, and eDNA, provided that the composition of the biofilm matrix is fully known.
Based on Figure 5, it was concluded that the intracellular ROS concentration (significantly) increased when oxygen was added to the gas flow. This means that the oxygen level of the gas flow has an influence on the concentration and/or the type of generated (intra- and extracellular) ROS species. The latter is of high importance as this can have an influence on their ability to penetrate into the biofilm matrix and to interact with the biofilm-associated cells and the EPS matrix. The research of Duan et al. [42], for example, reported that only 5% of the generated ROS species was able to penetrate a tissue with a thickness of 500 µM. Within the presented study, the obtained CLSM images (Figure 9) indicated that all examined treatment conditions resulted in cell death in the deeper biofilm layers. However, this cell damage can also be the result of other reactive species (e.g., RNS). Regarding the effect of the electrode configuration on the intracellular ROS concentration, it can be concluded that the DBD electrode configuration often resulted in significantly higher values in comparison to the SBD electrode. This can also be a consequence of the generally higher dissipated power values resulting in a more efficient generation of different CAP species [17]. In addition, when the SBD electrode configuration is applied, most reactive (short-living) species recombine before they reach the sample. Therefore, fewer species are able to diffuse into the biofilm matrix to eventually interact with the biofilm-associated cells [19,43]. The effect of the discharge power on the intracellular ROS concentration was not very pronounced as this effect was influenced by the oxygen level and the applied electrode configuration. Finally, it was generally observed that the CAP treatment had a more pronounced effect on the intracellular ROS concentration of the biofilm-associated Salmonella Typhimurium cells than for the corresponding Listeria monocytogenes cells. This can be the result of the difference in biofilm matrix composition, allowing different ROS species to reach the biofilm-associated cells [41], and/or by the Gram type of the cells. It has been reported before that the composition of the cell wall of bacterial cells can have an effect on the ability of CAP species to penetrate into the cells. The thick peptidoglycan layer of Gram-positive cells (such as Listeria monocytogenes) still allows the penetration of ROS species, but the diffusion rate is lower as compared to Gram negative cells (such as Salmonella Typhimurium) with a much thinner peptidoglycan layer [44].
The presence of nitrite and/or nitrate in the CAP treated water (Figure 3) indicates that RNS are generated in the gas phase at certain combinations of plasma characteristics since the generation of nitrite and nitrate is the result of nitric oxide (NO) that diffuses into the water [27]. This NO can be generated due to impurities from (i) the environment and/or (ii) the applied helium and oxygen gas. As mentioned before, no clear correlation was observed between the oxygen level of the gas flow and the generation of nitrite. It would be expected, however, that the highest concentrations would be obtained without the addition of oxygen since this resulted in the highest dissipated plasma power (Table 1) and because dissociation of N2 requires a sufficiently high amount of energy [45]. For the influence of the electrode configuration and the discharge power, this correlation between the dissipated plasma power and the generation of nitrite can indeed be confirmed for most examined treatment combinations. For the influence of the plasma characteristics on the formation of nitrate, again higher concentrations were obtained at the highest dissipated plasma power, i.e., when no oxygen was added to the gas flow, when the DBD electrode was applied, and when the highest discharge power was used. However, similar as for the detection of H2O2, a low concentration of nitrite/nitrate following 10 min of CAP treatment does not necessarily mean that no nitrite/nitrate (and other RNS species) was formed over the course of the treatment (0–10 min). Previous studies indicated that the nitrite concentration first gradually increases as function of the CAP treatment time to decrease again to a relatively low concentration [46,47]. As mentioned before, the decrease in nitrite is, amongst others, the result of its reaction with hydrogen peroxide (at acidic conditions) to form nitrate and peroxynitrite [39,40]. Therefore, the study of Hojnik et al. [46] observed as well that the nitrate concentration increased as function of the CAP treatment time. Though, other pathways can be involved as well for the increase/decrease of nitrite/nitrate at a prolonged CAP treatment time. In order to comment on the effect of the plasma characteristics on the generation of RNS, more research will be required to (i) examine the formation of nitrite/nitrate as function of the treatment time and (ii) to assess if other (short-living) RNS were generated as well.
The pH value of the CAP treated water (Figure 4), which is linked to the generation of ROS and RNS, is also an important factor to be considered. For three examined CAP treatment conditions, i.e., DBD-0.0% (v/v) oxygen-21.88 V, DBD-1.0% (v/v) oxygen-21.88 V, and DBD-0.0% (v/v) oxygen-13.88 V, the pH values ranged between 2.6 and 3.9. As mentioned in the previous paragraph, this low pH value most likely contributed to the generation of certain lethal CAP species such as peroxynitrite. However, literature indicated that the pH drop itself cannot have been sufficient to (significantly) contribute to the inactivation of the biofilm-associated cells. Listeria monocytogenes (planktonic) cells can grow until a pH level of 4.2, while up to 72% of the cells proved to survive pH 3 for 20 min [48,49,50]. For Salmonella spp., on the other hand, (planktonic) cells can grow until a pH level of 3.6, while these cells proved to survive pH values up to 2.5 for several hours [49,51,52]. Nevertheless, the low pH value can result in an additional stress factor for the cells, eventually leading to cell death due to synergistic effects with ROS, RNS, and/or UV photons [53]. However, it should be taken into account that the actual drop in pH inside a biofilm might not be as pronounced as for the small volume of water tested, since the biofilm environment is buffered, and other reactions might occur due to the presence of the cells and the biofilm matrix. Regarding the influence of the plasma characteristics on the pH of the CAP treated water, it was concluded that the oxygen level of the gas flow did not result in significant differences. For the electrode configuration, it was observed that generally lower pH values were reached when the DBD configuration was used. This can be explained based on (i) the generally higher dissipated plasma power resulting in a more effective generation of reactive species (Table 1) and (ii) the mode of exposure. Using the DBD electrode, the water (and the biofilm sample) was directly exposed to the generated CAP species, meaning that a high number of reactive species was able to interact with or diffuse into the water [19,43]. The significantly lower pH values at the highest power discharge (using the DBD electrode) can again be explained based on the higher dissipated plasma power.

4.2. Effect of the Generated (Reactive) CAP Species on the Biofilms

4.2.1. Impact of the Generated UV Light

Despite the lack of photon detection for most examined combinations of plasma characteristics using the UV-TEC strips (Figure 2), often no significant differences were observed between the log-reduction values obtained with and without the implementation of the quartz disc (Figure 6). Especially for the Listeria monocytogenes model biofilms, this was observed for six out of eight examined treatment conditions. As a result, it can be concluded that this biofilm forming species was more vulnerable to inactivation by UV light and/or that the UV photons can more easily reach the biofilm-associated Listeria monocytogenes cells. The latter can originate from the difference in thickness between the Listeria monocytogenes (approximately 15 µm) and Salmonella Typhimurium (approximately 25 µm) model biofilms [26]. However, one should be careful with the interpretation of the log-reduction results since (i) the standard deviations for Listeria monocytogenes were quite high for some combinations of plasma characteristics and (ii) the average Listeria monocytogenes log-reduction values without the implementation of the quartz disc were often 1.5 log10 (CFU/cm2) higher than the corresponding values obtained with implementation of the quartz disc. Therefore, the contribution of UV light to the bactericidal effect of CAP was deemed to be only minor.
The contradictory results observed in Figure 2 and Figure 6 can possibly be explained based on the specifications of the applied UV-TEC strips. These strips can detect UV photons with a wavelength ranging between 250 and 420 nm, while the lethal wavelengths predominantly range between 200 and 280 nm (UV-C light) with a maximum absorption wavelength of DNA, the main target of UV photons (see Section 4.2.3), around 260 nm [19,54,55]. Consequently, UV photons emitted within the range of 200–250 nm were not detected by the applied UV-TEC strips. However, previous optical emission spectroscopy (OES) measurements performed within the team [56] indicated that the use of helium and oxygen as feeding gas barely resulted in the generation of photons with a wavelength below 300 nm. Similarly, the research of Maisch et al. [57], using an air-based surface micro-discharge plasma set-up for inactivation of Deinococcus radiodurans planktonic cells, indicated that mainly UV-A (320–420 nm) photons were generated. Another possible explanation for these contradictory results can be that the sensitivity of the applied UV-TEC strips was not high enough to detect the UV photons with wavelengths higher than 300 nm. If these were generated, but not detected, biofilm-associated cells could also have been inactivated by these specific UV photons. For biofilms developed by P. fluorescence and S. epidermidis, for example, treatment by LED light with a wavelength of 400 nm resulted in a significant reduction of the viable cell density, although only following more than 2 h of treatment [58]. It should be mentioned, however, that the intensity of this light treatment was much higher than the intensity of the UV photons possibly generated during CAP treatment. In combination with the very short treatment time, it is thus very unlikely that any of these UV photons resulted in a reduction of the viable Listeria monocytogenes and Salmonella Typhimurium cell density. Within the study of Maisch et al. [57], it was indeed observed that the UV-A component of the plasma was not able to inactivate the Deinococcus radiodurans planktonic cells due to the low irradiation dose (<25 nW/cm2). Finally, the study of Ghimire et al. [59], using an argon-based plasma jet, indicated that the generation of UV photons during CAP treatment resulted in the indirect generation of H2O2 in deionized water. Therefore, the observed log-reduction results were potentially not the result of the direct interaction of UV photons with the biofilm-associated cells, but a result of the in-situ generation of RONS such as H2O2. More research is, however, still required to examine in detail the cause of the log-reductions obtained with implementation of the quartz disc.
Although the study of Lerouge et al. [21] indicated that the type and intensity of the emitted UV light depends on the applied plasma characteristics, this study indicated that the examined plasma characteristics (i.e., gas composition, electrode configuration, and discharge power) only had a minor influence on the log-reduction values obtained with the implementation of the quartz disc. Therefore, it can be concluded that an alteration of the CAP treatment conditions favoring the generation of UV photons will not result in a major improvement of the CAP inactivation efficacy for biofilms.

4.2.2. Membrane Integrity

As mentioned before, CAP treatment resulted in DNA leakage (Figure 7) for both biofilm forming species and for almost all examined combinations of plasma characteristics. As a consequence, it can be concluded that CAP treatment has an effect on the membrane of the biofilm-associated cells. Based on previously discussed results (Section 4.1), this can be attributed to the generation of (intracellular) ROS, the drop in pH, and the formation of RNS. In literature, it has been reported that ROS can interact with the peptidoglycan of the cell wall and with the lipopolysaccharides and phospholipids present in the (outer) cell membranes [28]. The lipids can be oxidized and C-C, C-O, and C-N bonds within the peptidoglycan structure can be destroyed due to the presence of ROS such as OH and O [14]. The drop in pH, on the other hand, can result in cell leakage due to the neutralization of the net negative charge of the bacterial cell wall [60]. The leakage of intracellular DNA was, however, often higher when no oxygen was added to the gas flow. This can originate from the higher dissipated plasma power and the lower quenching rate of the reactive species. However, it can indicate that other reactive species such as RNS can be involved as well. This is in agreement with the results observed for the nitrite and nitrate concentrations, i.e., higher total concentrations were often measured following 10 min of CAP treatment when no oxygen was added to the gas flow, which might be similar for all other (unmeasured) RNS species. However, these results should be interpreted with caution as the nitrite/nitrate concentration can change as a function of the CAP treatment time. Regarding the influence of the electrode configuration, higher absorbance values were often observed when the DBD electrode was applied. This higher membrane damage can originate from (i) the higher amount of (intracellular) ROS, (ii) the higher total amount of nitrite and nitrate, and (iii) the lower pH value. Moreover, it indicates too that charged particles can contribute to the observed membrane damage since these charged species can only reach the biofilm samples when a direct treatment is applied [61]. Finally, for the influence of the power discharge, more membrane damage can be obtained at the highest value, which is in agreement with previous studies investigating the influence of the plasma power on CAP’s inactivation efficacy (e.g., [28]). This increase in membrane damage (Figure 7) can be correlated to a higher concentration of nitrite + nitrate (Figure 3) and a high drop in pH (Figure 4). However, there is no clear correlation between the increased membrane damage and the generation of (intracellular) ROS (Figure 5).
Compared to the Salmonella Typhimurium biofilms, a slightly higher increase in absorbance was observed for the Listeria monocytogenes biofilms, which indicates that the latter cells are more vulnerable to membrane damage. In literature, the opposite trend has been observed. The study of Mai-Prochnow et al. [14] reported that the CAP efficacy was directly correlated to the thickness of the bacterial cell wall. Gram positive bacteria, with a thick peptidoglycan layer, showed the highest resistance both for planktonic cells and biofilms. Similar, the study of Han et al. [28] reported that Gram-negative (planktonic) cells were mainly inactivated due to cell leakage and low-level DNA damage, while Gram-positive (planktonic) cells were killed due to intracellular damage and little envelope damage. The contradictory results observed within the presented study can originate from a difference in (i) applied treatment characteristics and/or (ii) (biofilm forming) bacterial species. The latter is of high importance since the composition of the biofilm matrix, and the ability of the CAP species to penetrate into the biofilm, depends on the biofilm forming species [62]. Moreover, the research of Mai-Prochnow et al. [14] concluded that, within the group of Gram-positive cells, no correlation was observed between the thickness of the cell wall and the CAP inactivation efficacy. Therefore, it was presumed that the presence of cell appendices can play a role as well.

4.2.3. DNA Damage

For both model biofilms, DNA damage (Figure 8) was observed for most of the treatment conditions. Therefore, it can be concluded that the intracellular DNA is one of the main targets of the generated CAP species. Among others, DNA damage has been reported to be the result of the generation of UV photons. Especially UV-C light, ranging between 200 and 280 nm, can result in cross-linking of neighbouring pyrimidine nucleoside bases, which eventually affects DNA transcription and replication [43,54,63]. Although previous studies reported that the power density of UV light during CAP treatment is generally too low (i.e., <50 µW/cm2) to contribute to CAP’s bactericidal effect, the results of this study (Figure 6) indicated that the UV photons did in fact contribute to the obtained log-reductions values for some treatment conditions. Nevertheless, as previously mentioned, more research will be required to examine whether UV photons were indeed generated during CAP treatment. The measured ROS (Figure 3 and Figure 5) and RNS (Figure 3), can also have contributed to the DNA damage observed following CAP treatment since these species can diffuse into the cell and cause damage to the DNA by oxidizing the nucleic acids [8]. Regarding the influence of the plasma characteristics on the ability of CAP to cause DNA damage, it was concluded that the addition of oxygen resulted in less DNA damage for some treatment conditions. This cannot be directly linked to the lower generation of certain CAP species and/or the measured pH values. The SBD electrode was favored over the DBD electrode and a lower discharge power was more effective. Nevertheless, it was again not possible to link these observations to the observed concentrations of ROS/RNS and the measured pH values. Further research is therefore still required.
Generally, more DNA damage was observed for the Listeria monocytogenes biofilm-associated cells than for the corresponding Salmonella Typhimurium cells. This can partially be explained based on the limited thickness of the former model biofilm, allowing more UV photons, if any generated at all, to interact with the cells. Nevertheless, other factors can be involved as well, e.g., the ability of the ROS and RNS to penetrate into the cells and/or the ability of the biofilm-associated cells to repair damage to their DNA.
As mentioned in Section 2.5.3, the currently applied detection method can only be used to examine whether CAP treatment can damage dsDNA when this damage results in the generation of ssDNA within the biofilm-associated cells. For future research, fragmentation of dsDNA following CAP treatment can be examined as well, e.g., by means of gel electrophoreses and subsequent staining with SYBR Green I.

4.2.4. Penetration of CAP Species into the Biofilms and Their Effect on the Biofilm Structure

As mentioned in Section 3.2.4, all examined combinations of plasma characteristics were able to cause cell death/damage into the deeper layers of the model biofilms. Therefore, no correlation was observed between the individual plasma characteristics and the ability of the generated CAP species to penetrate into the biofilm matrix. For the Listeria monocytogenes biofilms, some CAP treatment conditions did not only result in inactivation of the biofilm-associated cells, but also in an etching effect, i.e., relatively large holes were created within the biofilm structure. Previous studies indeed indicated that some CAP species are able to interact with the EPS matrix [14,23,41,64]. The research of Gilmore et al. [41] reported that the presence of NO within the gas phase can result in a disruption of the biofilm matrix with dead and living cells being dispersed into the environment. However, in the research of Traba and Liang [64], etching of the biofilm resulted in a decreased biomass following CAP treatment. As this was not de case for the model biofilms used within the presented research [65], the holes within the Listeria monocytogenes biofilms cannot be the result of some parts of the biofilms being dispersed, but rather of their contraction. Nevertheless, more research will be required to examine this phenomenon in detail.

4.3. Summary

To summarize the main findings of this study, Table 2 has been included to indicate for each specific combination of plasma characteristics which reactive plasma species were generated. More specifically, it was indicated if these conditions resulted in the generation of UV photons, H2O2, nitrite, and nitrate, and/or a drop in pH. In Table 3, on the other hand, it was included for both biofilm forming species if the lethal effect of CAP was (partially) due to (i) the generation of intracellular ROS, (ii) the presence of UV light, (iii) leakage of the membrane, and/or (iv) DNA damage. For the presence of UV light, this was indicated as ‘yes’ if the log-reduction values with implementation of the quartz disc were higher than 1 log10(CFU/cm2), which is the detection limit of the applied enumeration method. For all other attributes, ‘yes’ was indicated if the values were significantly different from the untreated control. Finally, it was also included if CAP treatment resulted in an increased porosity of the biofilms.

5. Conclusions

Based on previous discussion using a helium-based plasma set-up for the inactivation of single-species Listeria monocytogenes and Salmonella Typhimurium model biofilms, it can be concluded that more membrane damage can be obtained when (i) no oxygen is added to the gas flow, (ii) a direct treatment is applied, and (iii) the discharge power increases. On the other hand, more DNA damage can be obtained when (i) no oxygen is added to the gas flow, (ii) an indirect treatment is applied, and (ii) the discharge power decreases. As the overall log-reduction values (see Govaert et al. [17]) were higher when no oxygen was added to the gas flow while using the highest discharge power and the DBD electrode, it can be concluded that membrane damage has a higher contribution to the bactericidal effect of CAP for biofilm-associated cells than damage to the (intracellular) DNA. Nevertheless, more research is still required to specifically examine which species are responsible for this observed phenomenon. In addition, the effect of CAP on the intracellular macromolecules (e.g., enzymes) should also be examined in future research.

Author Contributions

Individual contributions of each of the authors to the research are the following: conceptualization, M.G., C.S. and J.F.M.V.I.; methodology, M.G. and C.S.; software, M.G.; validation, M.G. and C.S.; formal analysis, M.G. and C.S.; investigation, M.G.; resources, J.L.W. and J.F.M.V.I.; data curation, M.G.; writing—original draft preparation, M.G.; writing—review and editing, M.G., C.S., J.L.W. and J.F.M.V.I.; visualization, M.G.; supervision, M.G., C.S. and J.F.M.V.I.; project administration, M.G.; funding acquisition, J.F.M.V.I. All authors have read and agreed to the published version of the manuscript.

Funding

This research was funded by the KU Leuven Research Council, project number C24/18/046 and the Fund for Scientific Research-Flanders, project number G.0863.18.

Conflicts of Interest

The authors declare no conflict of interest.

References

  1. Bakke, R.; Trulear, M.G.; Robinson, J.A.; Characklis, W.G. Activity of Pseudomonas aeruginosa in biofilms: Steady state. Biotechnol. Bioeng. 1984, 26, 1418–1424. [Google Scholar] [CrossRef] [PubMed]
  2. Costerton, J.W.; Cheng, K.J.; Geesey, G.G.; Ladd, T.I.; Nickel, J.C.; Dasgupta, M.; Marrie, T.J. Bacterial biofilms in nature and disease. Annu. Rev. Microbiol. 1987, 41, 435–464. [Google Scholar] [CrossRef] [PubMed]
  3. Kumar, C.G.; Anand, S.K. Significance of microbial biofilms in food industry: A review. Int. J. Food Microbiol. 1998, 42, 9–27. [Google Scholar] [CrossRef]
  4. Jefferson, K.K. What drives bacteria to produce a biofilm? FEMS Microbiol. Lett. 2004, 236, 163–173. [Google Scholar] [CrossRef] [PubMed]
  5. Garrett, T.R.; Bhakoo, M.; Zhang, Z. Bacterial adhesion and biofilms on surfaces. Prog. Nat. Sci-Mater. 2008, 18, 1049–1056. [Google Scholar] [CrossRef]
  6. Giaouris, E.; Heir, E.; Hébraud, M.; Chorianopoulos, N.; Langsrud, S.; Møretrø, T.; Habimana, O.; Desvaux, M.; Renier, S.; Nychas, G.-J. Attachment and biofilm formation by foodborne bacteria in meat processing environments: Causes, implications, role of bacterial interactions and control by alternative novel methods. Meat Sci. 2014, 97, 298–309. [Google Scholar] [CrossRef]
  7. Tendero, C.; Tixier, C.; Tristant, P.; Desmaison, J.; Leprince, P. Atmospheric pressure plasmas: A review. Spectrochim. Acta Part B 2006, 61, 2–30. [Google Scholar] [CrossRef]
  8. Misra, N.N.; Tiwari, B.K.; Raghavarao, K.S.M.S.; Cullen, P.J. Nonthermal Plasma Inactivation of Food-Borne Pathogens. Food Eng. Rev. 2011, 3, 159–170. [Google Scholar] [CrossRef] [Green Version]
  9. Banu, M.S.; Sasikala, P.; Dhanapal, A.; Kavitha, V.; Yazhini, G.; Rajamani, L. Cold plasma as a novel food processing technology. IFSET 2012, 4, 803–818. [Google Scholar]
  10. Fernández, A.; Thompson, A. The inactivation of Salmonella by cold atmospheric plasma treatment. Food Res. Int. 2012, 45, 678–684. [Google Scholar] [CrossRef]
  11. Patil, S.; Bourke, P.; Cullen, P.J. Principles of Nonthermal Plasma Decontamination. In Cold Plasma in Food and Agriculture—Fundamentals and Applications; Misra, N.N., Schlüter, O.K., Cullen, P.J., Eds.; Academic Press: Cambridge, MA, USA; Elsevier Inc.: London, UK, 2016; pp. 143–178. [Google Scholar]
  12. Vleugels, M.; Shama, G.; Deng, X.T.; Greenacre, E.; Brocklehurst, T.; Kong, M.G. Atmospheric Plasma Inactivation of Biofilm-Forming Bacteria for Food Safety Control. IEEE Trans. Plasma Sci. 2005, 33, 824–828. [Google Scholar] [CrossRef] [Green Version]
  13. Niemira, B.A.; Boyd, G.; Sites, J. Cold Plasma Rapid Decontamination of Food Contact Surfaces Contaminated With Salmonella Biofilms. J. Food Sci. 2014, 79, M917–M922. [Google Scholar] [CrossRef] [PubMed]
  14. Ziuzina, D.; Han, L.; Cullen, P.J.; Bourke, P. Cold plasma inactivation of internalised bacteria and biofilms for Salmonella enterica serovar Typhimurium, Listeria monocytogenes and Escherichia coli. Int. J. Food Microbiol. 2015, 210, 53–61. [Google Scholar] [CrossRef] [PubMed] [Green Version]
  15. Govaert, M.; Smet, C.; Baka, M.; Ećimović, B.; Walsh, J.L.; Van Impe, J. Resistance of L. monocytogenes and S. Typhimurium towards Cold Atmospheric Plasma as function of biofilm age. Appl. Sci. 2018, 8, 2702. [Google Scholar] [CrossRef] [Green Version]
  16. Niemira, B.A.; Boyd, G.; Sites, J. Cold Plasma Inactivation of Escherichia coli O17:H7 Biofilms. Front. Sust. Food Syst. 2018, 2, 47. [Google Scholar] [CrossRef] [Green Version]
  17. Govaert, M.; Smet, C.; Vergauwen, L.; Ećimović, B.; Walsh, J.L.; Baka, M.; Van Impe, J. Influence of plasma characteristics on the efficacy of Cold Atmospheric Plasma (CAP) for inactivation of Listeria monocytogenes and Salmonella Typhimurium biofilms. IFSET 2019, 52, 376–386. [Google Scholar] [CrossRef]
  18. Laroussi, M.; Leipold, F. Evaluation of the roles of reactive species, heat, and UV radiation in the inactivation of bacterial cells by air plasmas at atmospheric pressure. Int. J. Mass Spectrom. 2004, 233, 81–86. [Google Scholar] [CrossRef]
  19. Surowsky, B.; Schlüter, O.; Knorr, D. Interactions of Non-Thermal Atmospheric Pressure Plasma with Solid and Liquid Food Systems: A Review. Food Eng. Rev. 2015, 7, 82–108. [Google Scholar] [CrossRef]
  20. Puligundla, P.; Mok, C. Potential applications of nonthermal plasmas against biofilm-associated micro-organisms in vitro. J. Appl. Microbiol. 2017, 122, 1134–1148. [Google Scholar] [CrossRef] [Green Version]
  21. Lerouge, S.; Wertheimer, M.R.; Yahia, L. Plasma Sterilization: A Review of Parameters, Mechanisms, and Limitations. Plasmas Polym. 2001, 6, 175–188. [Google Scholar] [CrossRef]
  22. Rød, S.K.; Hansen, F.; Leipold, F.; Knøchel, S. Cold atmospheric pressure plasma treatment of ready-to-eat meat: Inactivation of Listeria innocua and changes in product quality. Food Microbiol. 2012, 30, 233–238. [Google Scholar] [CrossRef] [PubMed]
  23. Bourke, P.; Ziuzina, D.; Han, L.; Cullen, P.J.; Gilmore, B.F. Microbiological interactions with cold plasma. J. Appl. Microbiol. 2017, 123, 308–324. [Google Scholar] [CrossRef] [PubMed] [Green Version]
  24. Lambert, R.J.W.; Johnston, M.D. The effect of interfering substances on the disinfection process: A mathematical model. J. Appl. Microbiol. 2001, 91, 548–555. [Google Scholar] [CrossRef] [PubMed] [Green Version]
  25. BCCM. Belgian Co-ordinated Collections of Micro-organisms. Available online: http://bccm.belspo.be/ (accessed on 10 January 2017).
  26. Govaert, M.; Smet, C.; Baka, M.; Janssens, T.; Van Impe, J. Influence of incubation conditions on the formation of model biofilms by Listeria monocytogenes and Salmonella Typhimurium on abiotic surfaces. J. Appl. Microbiol. 2018, 125, 1890–1990. [Google Scholar] [CrossRef]
  27. Lu, P.; Boehm, D.; Bourke, P.; Cullen, P.J. Achieving reactive species specificity within plasma-activated water through selective generation using air spark and glow discharges. Plasma Process. Polym. 2017, 14, 1600207. [Google Scholar] [CrossRef] [Green Version]
  28. Han, L.; Patil, S.; Boehm, D.; Milosavljević, V.; Cullen, P.J.; Bourke, P. Mechanisms of Inactivation by High-Voltage Atmospheric Cold Plasma Differ for Escherichia coli and Staphylococcus aureus. Appl. Environ. Microbiol. 2015, 82, 450–458. [Google Scholar] [CrossRef] [Green Version]
  29. Herrmann, H.W.; Henins, I.; Park, J.; Selwyn, G.S. Decontamination of chemical and biological warfare (CBW) agents using an atmospheric pressure plasma jet (APPJ). Phys. Plasmas 1999, 6, 2284–2289. [Google Scholar] [CrossRef] [Green Version]
  30. Mendis, D.A.; Rosenberg, M.; Azam, F. A note on the possible electrostatic disruption of bacteria. IEEE Trans. Plasma Sci. 2000, 28, 1304–1306. [Google Scholar] [CrossRef]
  31. Hong, Y.F.; Kang, J.G.; Lee, H.-Y.; Uhm, H.S.; Moon, E.; Park, Y.H. Sterilization effect of atmospheric plasma on Escherichia coli and Bacillus subtilis endospores. Lett. Appl. Microbiol. 2009, 48, 33–37. [Google Scholar] [CrossRef]
  32. Qiagen. DNeasy Blood & Tissue Handbook. Qiagen, 2006. Available online: https://www.qiagen.com/us/resources/resourcedetail?id=6b09dfb8-6319-464d-996c-79e8c7045a50&lang=en (accessed on 5 January 2020).
  33. Stewart, P.S.; Murga, R.; Srinivasan, R.; de Beer, D. Biofilm structural heterogeneity visualized by three microscopic methods. Water Res. 1995, 29, 2006–2009. [Google Scholar] [CrossRef]
  34. Boulos, L.; Prévost, M.; Barbeau, B.; Coallier, J.; Desjardins, R. LIVE/DEAD® BacLight™: Application of a new rapid staining method for direct enumeration of viable and total bacteria in drinking water. J. Microbiol. Meth. 1999, 37, 77–86. [Google Scholar] [CrossRef]
  35. Philips, J.; Rabaey, K.; Lovley, D.R.; Vargas, M. Biofilm Formation by Clostridium Ijungdahlii Is Induced by Sodium Chloride Stress: Experimental Evaluation and Transcriptome Analysis. PLoS ONE 2017, 12, e0170406. [Google Scholar] [CrossRef]
  36. Murakami, T.; Niemi, K.; Gans, T.; O’Connell, D.; Graham, W.G. Afterglow chemistry of atmospheric-pressure helium–oxygen plasmas with humid air impurity. Plasma Sources Sci. Technol. 2014, 23, 025005. [Google Scholar] [CrossRef]
  37. Boxhammer, V.; Morfill, G.E.; Jokipii, J.R.; Shimizu, T.; Klämpfl, T.; Li, Y.-F.; Köritzer, J.; Schlegel, J.; Zimmermann, J.L. Bactericidal action of cold atmospheric plasma in solution. New J. Phys. 2012, 14, 113042. [Google Scholar] [CrossRef]
  38. Govaert, M.; Smet, C.; Graeffe, A.; Walsh, J.L.; Van Impe, J. Inactivation of L. monocytogenes and S. typhimurium biofilms by means of an air-based Cold Atmospheric Plasma (CAP) system. Foods 2020, 9, 157. [Google Scholar] [CrossRef] [Green Version]
  39. Lukes, P.; Dolezalova, E.; Sisrova, I.; Clupek, M. Aqueous-phase chemistry and bactericidal effects from an air discharge plasma in contact with water: Evidence for the formation of peroxynitrite through a pseudo-second-order post-discharge reaction of H2O2 and HNO2. Plasma Sources Sci. Technol. 2014, 23, 015019. [Google Scholar] [CrossRef]
  40. Chauvin, J.; Judée, F.; Yousfi, M.; Vicendo, P.; Merbahi, N. Analysis of reactive oxygen and nitrogen species generated in three liquid media by low temperature helium plasma jet. Sci. Rep. 2017, 7, 4562. [Google Scholar] [CrossRef]
  41. Gilmore, B.; Flynn, P.B.; O’Brien, S.; Hickok, N.; Freeman, T.; Bourke, P. Cold Plasma for Biofilm Control: Opportunities and Challenges. Trends Biotechnol. 2018, 36, 627–638. [Google Scholar] [CrossRef]
  42. Duan, J.; Lu, X.; He, G. On the penetration depth of reactive oxygen and nitrogen species generated by a plasma jet through real biological tissue. Phys. Plasmas 2017, 24, 073506. [Google Scholar] [CrossRef]
  43. Laroussi, M. Low Temperature Plasma-Based Sterilization: Overview and State-of-the-Art. Plasma Process. Polym. 2005, 2, 391–400. [Google Scholar] [CrossRef]
  44. Mai-Prochnow, A.; Clauson, M.; Hong, J.; Murphy, A.B. Gram positive and Gram negative bacteria differ in their sensitivity to cold plasma. Sci. Rep. 2016, 6, 38610. [Google Scholar] [CrossRef] [PubMed] [Green Version]
  45. Whitehead, J.C. The Chemistry of Cold Plasma. In Cold Plasma in Food and Agriculture—Fundamentals and Applications; Misra, N.N., Schlüter, O.K., Cullen, P.J., Eds.; Academic Press: Cambridge, MA, USA, 2016; pp. 53–81. [Google Scholar]
  46. Hojnik, N.; Modic, M.; Ni, Y.; Filipič, G.; Cvelbar, U.; Walsh, J.L. Effective Fungal Spore Inactivation with an Environmentally Friendly Approach Based on Atmospheric Pressure Air Plasma. Environ. Sci. Technol. 2019, 53, 1893–1904. [Google Scholar] [CrossRef] [PubMed]
  47. Judée, F.; Simon, S.; Bailly, C.; Dufour, T. Plasma-activation of tap water using DBD for agronomy applications: Identification and quantification of long lifetime chemical species production/consumption mechanisms. Water Res. 2018, 133, 47–59. [Google Scholar] [CrossRef] [PubMed] [Green Version]
  48. Barker, C.; Park, S.F. Sensitization of Listeria monocytogenes to Low pH, Organic Acids, and Osmotic Stress by Ethanol. Appl. Environ. Microbiol. 2001, 67, 1594–1600. [Google Scholar] [CrossRef] [Green Version]
  49. Marriott, N.G.; Gravani, R.B. Principles of Food Sanitation, 5th ed.; Springer: New York, NY, USA, 2006. [Google Scholar]
  50. Food Safety Authority of Ireland. Listeria Monocytogenes Factsheet. Available online: https://www.fsai.ie/search-results.html?searchString=Listeria (accessed on 10 January 2019).
  51. Lawrence, E. How Salmonella survive the stomach. Nature 1998. [Google Scholar] [CrossRef]
  52. Albrecht, J.A. Salmonella. Institute of Agriculture and Natural Resources. Available online: https://food.unl.edu/salmonella (accessed on 10 January 2019).
  53. Zhang, Q.; Ma, R.; Tian, Y.; Su, B.; Wang, K.; Yu, S.; Zhang, J.; Fang, J. Sterilization Efficiency of a Novel Electrochemical Disinfectant against Staphylococcus aureus. Environ. Sci. Technol. 2016, 50, 3184–3192. [Google Scholar] [CrossRef]
  54. Caminiti, I.M.; Palgan, I.; Muñoz, A.; Noci, F.; Whyte, P.; Morgan, D.J.; Cronin, D.A.; Lyng, J.G. The Effect of Ultraviolet Light on Microbial Inactivation and Quality Attributes of Apple Juice. Food Bioprocess Technol. 2010, 5, 680–686. [Google Scholar] [CrossRef]
  55. BMG Labtech. UV Absorbance DNA Quantification. BMG Labtech. Available online: http://www.bmglabtech.com/uv-absorbance-dna-quantification (accessed on 2 March 2020).
  56. Smet, C.; Baka, M.; Dickenson, A.; Walsh, J.L.; Valdramidis, V.P.; Van Impe, J. Antimicrobial efficacy of cold atmospheric plasma for different intrinsic and extrinsic parameters. Plasma Process. Polym. 2017, 15, e1700048. [Google Scholar] [CrossRef]
  57. Maisch, T.; Shimizu, T.; Mitra, A.; Heinlin, J.; Karrer, S.; Li, Y.F.; Morfill, G.; Zimmermann, J.L. Contact-free cold atmospheric plasma treatment of Deinococcus radiodurans. J. Ind. Microbiol. Biotechnol. 2012, 39, 1367–1375. [Google Scholar] [CrossRef]
  58. Angarano, V.; Smet, C.; Akkermans, S.; Watt, C.; Chieffe, A.; Van Impe, J.F.M. Impact of LED light on Pseudomonas fluorescens and Staphylococcus epidermidis biofilms. In Proceedings of the FOODSIM 2020, Ghent, Belgium, 5–9 April 2020; Van Impe, J., Polanska, M., Eds.; EUROSIS-ETI: Ostend, Belgium, 2020. in press. [Google Scholar]
  59. Ghimire, B.; Szili, E.J.; Lamichhane, P.; Short, R.D.; Sup Lim, J.; Attri, P.; Masur, K.; Weltmann, K.-D.; Hong, S.-H.; Ha Choi, E. The role of UV photolysis and molecular transport in the generation of reactive species in a tissue model with a cold atmospheric pressure plasma jet. Appl. Phys. Lett. 2019, 114, 093701. [Google Scholar] [CrossRef] [Green Version]
  60. Stoffels, E.; Sakiyama, Y.; Graves, D.B. Cold Atmospheric Plasma: Charged Species and their Interactions with Cells and Tissues. IEEE Trans. Plasma Sci. 2008, 36, 1441–1457. [Google Scholar] [CrossRef]
  61. Laroussi, M. Low-temperature plasma for medicine? IEEE Trans. Plasma Sci. 2009, 37, 714–725. [Google Scholar] [CrossRef]
  62. Ciofu, O.; Tolker-Nielsen, T. Antibiotic Tolerance and Resistance in Biofilms. In Biofilms Infections; Bjarnsholt, T., Jensen, P.Ø., Moser, C., Høiby, N., Eds.; Springer: New York, NY, USA, 2011; pp. 215–229. [Google Scholar]
  63. Harm, W. Biological Effects of Ultraviolet Radiation; Cambridge University Press: Cambridge, UK, 1980. [Google Scholar]
  64. Traba, C.; Liang, J.F. Susceptibility of Staphylococcus aureus biofilms to reactive discharge gases. Biofouling 2011, 27, 763–772. [Google Scholar] [CrossRef] [PubMed] [Green Version]
  65. Govaert, M.; Smet, C.; Verheyen, D.; Walsh, J.L.; Van Impe, J. Combined effect of Cold Atmospheric Plasma and hydrogen peroxide treatment on mature Listeria monocytogenes and Salmonella Typhimurium biofilms. Front. Microbiol. 2019, 10, 2674. [Google Scholar] [CrossRef] [PubMed] [Green Version]
Figure 1. Schematic representation and photographic image of the DBD and SBD electrode configurations used within this study.
Applsci 10 03198 g001
Figure 2. Generation of UV light monitored using UV-TEC strips (n = 1). All UV-TEC strips, apart from the control, were exposed to CAP for 10 min using each possible combination of plasma characteristics. Afterwards, the color of the (un)treated strips was compared with the provided color scale bars, with each color corresponding to a certain UV intensity (5 = 5 mJ/cm2 and 10 = 10 mJ/cm2).
Applsci 10 03198 g002
Figure 3. H2O2, nitrite, and nitrate concentrations (µM) obtained following CAP treatment of 500 µL of sterile water using each possible combination of plasma characteristics (n = 3). Significant differences between all examined conditions (ANOVA test 1) have been indicated by means of a different small letter, with ‘a’ bearing the lowest value. The influence of the oxygen level (ANOVA tests 2–5), the electrode configuration (ANOVA tests 6–9), and the discharge power (ANOVA tests 10–13) on the chemical composition have been indicated as well by means of a different small letter, with ‘a’ again bearing the lowest value.
Applsci 10 03198 g003
Figure 4. pH values (-) obtained following CAP treatment of 500 µL of sterile water using each possible combination of plasma characteristics (n = 3). Significant differences between all examined conditions (ANOVA test 1), including the untreated control, have been indicated by means of a different small letter, with ‘a’ bearing the lowest value. The influence of the oxygen level (ANOVA tests 2–5), the electrode configuration (ANOVA tests 6–9), and the discharge power (ANOVA tests 10–13) on the pH of the CAP treated water have been indicated as well by means of a different small letter, with ‘a’ again bearing the lowest value.
Applsci 10 03198 g004
Figure 5. Fluorescence measurements (-) obtained following CAP and DCFH2-DA treatment of the Listeria monocytogenes and Salmonella Typhimurium model biofilms (n = 3). For each species, significant differences between all examined conditions (ANOVA test 1), including the untreated control, have been indicated by means of a different small letter, with ‘a’ bearing the lowest value. The influence of the oxygen level (ANOVA tests 2–5), the electrode configuration (ANOVA tests 6–9), and the discharge power (ANOVA tests 10–13) have been indicated as well by means of a different small letter, with ‘a’ again bearing the lowest value. Separate ANOVA tests were performed for each biofilm forming species.
Applsci 10 03198 g005
Figure 6. Log-reductions (log10(CFU/cm2)) obtained following CAP treatment of the model biofilms using each possible combination of plasma characteristics (n = 2). Log-reductions with quartz disc were compared with those previously obtained without quartz disc [17] to comment on the contribution of UV light to the inactivation efficacy of the CAP treatment. Significant differences between the log-reductions obtained with and without quartz disc while applying the same treatment conditions (ANOVA tests 1–8) have been indicated by means of a different small letter, with ‘a’ bearing the lowest value. ANOVA tests 9–12, 13–16, and 17–20 were, respectively, performed to examine whether the oxygen level, the electrode configuration, and the discharge power had a significant influence on the log-reduction values obtained with implementation of the quartz disc. For each of these tests, one plasma characteristic was altered while keeping the other characteristics constant. Significant differences were again indicated by means of a different small letter, with ‘a’ again bearing the lowest value. Moreover, separate ANOVA tests were performed for each biofilm forming species.
Applsci 10 03198 g006
Figure 7. Absorbance measurements (-) obtained following CAP treatment of the Listeria monocytogenes and Salmonella Typhimurium model biofilms (n = 3). Significant differences between all examined conditions (ANOVA test 1), including the untreated control, have been indicated by means of a different small letter, with ‘a’ bearing the lowest value. The influence of the oxygen level (ANOVA tests 2–5), the electrode configuration (ANOVA tests 6–9), and the discharge power (ANOVA tests 10–13) have been indicated as well by means of a different small letter, with ‘a’ again bearing the lowest value. Separate ANOVA tests were again performed for each biofilm forming species.
Applsci 10 03198 g007
Figure 8. Fluorescence measurements (-) obtained following interaction of SYBR Green I with the CAP treated and digested Listeria monocytogenes and Salmonella Typhimurium biofilm-associated cells (n = 3). Significant differences between all examined conditions (ANOVA test 1), including the untreated control, have been indicated by means of a different small letter, with ‘a’ bearing the lowest value. The influence of the oxygen level (ANOVA tests 2–5), the electrode configuration (ANOVA tests 6–9), and the discharge power (ANOVA tests 10–13) have been indicated as well by means of a different small letter, with ‘a’ again bearing the lowest value. Separate ANOVA tests were again performed for each biofilm forming species.
Applsci 10 03198 g008
Figure 9. Two-dimensional CLSM images taken at different depths of the (CAP treated) model biofilms, with images from left to right going from the top to the bottom layers of the biofilm (n = 1). Images have been provided for both biofilm forming species and for each examined combination of plasma characteristics (i.e., DBD/SBD, He + 0/1% (v/v) oxygen, and 13.88/21.88 V input voltage). CAP treated and control biofilms were always stained with a mixture of calcofluor white (EPS, blue emission), SYTO9 (living cells, green emission), and propidium iodide (dead/damaged cells, red emission) prior to the visualization step. Depending on the viability of the biofilm-associated cells and the presence of EPS components within a specific biofilm layer, this resulted in two-dimensional images with different staining patterns.
Applsci 10 03198 g009aApplsci 10 03198 g009bApplsci 10 03198 g009cApplsci 10 03198 g009dApplsci 10 03198 g009e
Table 1. Monitored output voltages (kV) and dissipated power (W) values as function of the applied CAP treatment conditions (i.e., electrode configuration, oxygen level of the gas flow, and discharge power/input voltage).
Electrode-Oxygen Level % (v/v)Discharge Power/Input VoltagePeak-to-Peak Output Voltage (kV)Dissipated Power (W)
DBD-0%13.884.5 ± 0.22.6 ± 0.1
21.886.4 ± 0.07.0 ± 0.3
DBD-1%13.886.3 ± 0.11.9 ± 0.2
21.887.8 ± 0.15.9 ± 0.2
SBD-0%13.882.4 ± 0.11.6 ± 0.0
21.883.5 ± 0.13.2 ± 0.1
SBD-1%13.882.8 ± 0.11.9 ± 0.0
21.883.9 ± 0.13.8 ± 0.1
Table 2. Summary table indicating whether the different combinations of plasma characteristics resulted in the generation of UV photons, H2O2, nitrite, and nitrate, and/or a drop in pH.
DBD-0%-21.88 VDBD-1%-21.88 VDBD-0%-13.88 VDBD-1%-13.88 VSBD-0%-21.88 VSBD-1%-21.88 VSBD-0%-13.88 VSBD-1%-13.88 V
UV photons detected using UV-TEC stripsNoYesNoNoNoNoNoNo
H2O2YesYesNoNoNoNoNoNo
NitriteYesYesYesYesYesYesYesYes
NitrateYesYesYesYesNoNoYesNo
pH dropYesYesYesYesYesYesNoNo
Table 3. Summary table indicating whether the CAP inactivation mechanism for both biofilm forming species was (partially) due to (i) the generation of intracellular ROS, (ii) the presence of UV light, (iii) leakage of the membrane, and/or (iv) DNA damage. In addition, it was also indicated whether CAP treatment resulted in an increased porosity of the biofilms.
Listeria monocytogenes
DBD-0%-21.88 VDBD-1%-21.88 VDBD-0%-13.88 VDBD-1%-13.88 VSBD-0%-21.88 VSBD-1%-21.88 VSBD-0%-13.88 VSBD-1%-13.88 V
Intracellular ROSNoYesYesYesNoYesNoNo
Log-reductions due to UV light (>1 log10 (CFU/cm2))YesYesNoNoNoNoYesYes
Membrane damageYesYesYesYesYesYesYesNo
DNA damageNoYesYesNoYesYesYesNo
Clear indication of an increased porosityNoYesYesNoYesNoNoYes
Salmonella Typhimurium
DBD-0%-21.88 VDBD-1%-21.88 VDBD-0%-13.88 VDBD-1%-13.88 VSBD-0%-21.88 VSBD-1%-21.88 VSBD-0%-13.88 VSBD-1%-13.88 V
Intracellular ROSYesYesYesYesNoYesYesYes
Log-reductions due to UV light
(>1 log10 (CFU/cm2))
YesYesNoYesNoNoNoNo
Membrane damageYesYesYesYesYesYesYesYes
DNA damageNoNoYesYesYesYesYesYes
Clear indication of an increased porosityNoNoNoNoNoNoNoNo

