Article

Measurements of N2, CO2, Ar, O2 and Air Pressure Broadening Coefficients of the HCl P(5) Line in the 1–0 Band Using an Interband Cascade Laser

Physikalisch-Technische Bundesanstalt, Bundesallee 100, D-38116 Braunschweig, Germany
*
Authors to whom correspondence should be addressed.
Appl. Sci. 2021, 11(11), 5190; https://doi.org/10.3390/app11115190
Submission received: 30 April 2021 / Revised: 27 May 2021 / Accepted: 1 June 2021 / Published: 3 June 2021

Abstract

:
We determine the CO2, N2, Ar, O2 and air pressure broadening coefficients of the H35Cl P(5) absorption line at 2775.77 cm−1 in the fundamental (1←0) band using a newly developed direct tunable diode laser absorption spectroscopy (dTDLAS)-based spectrometer employing a mid-IR interband cascade laser (ICL). For the first time, a reliable and consistent set of five different foreign pressure broadening coefficients for the same HCl P(5) line has been measured by a consistent metrological approach covering pressures from 100 to 600 hPa at temperatures of 294 and 295 K. The relative uncertainties of the stated CO2, N2, Ar, O2 and Air pressure broadening coefficients are in 1–3% range. The results are compared to previously available literature data—two broadening coefficients have been improved in accuracy and two have been determined for the first time in the sub 1000 hPa pressure range.

1. Introduction

Hydrogen chloride (HCl) is a harmful gas which is released to the atmosphere, e.g., from fossil fuel power plants or waste incinerators. It is also a process gas in many industries such as the electronic or textile industry. Industrial processes are often large-scale point sources with gas abatement systems which can be optimized to reduce the emissions. In the EU, HCl emissions from the industry are covered by Industrial Emissions Directive 2010/75/EU. The HCl emission measurement, as described in EN-standard 1911: 2010, does not fully extend down to concentration levels consistent with the increasingly stringent Emission Limit Values (ELVs) that will come into force [1]. The EMPIR project IMPRESS2 [2] is carrying out technical development work as well as underpinning spectroscopy in support of improved, and metrology backed monitoring and enforcing of ELVs in future European legislation for key air pollutants (i.e., HCl) and regulating emissions (i.e., HCl should be less than 1 µmol/mol).
The chlorine present in the fuels of combustion and gasification plants, appears in the slag [3] in biomass gasifiers but can also react to gas phase HCl. HCl, as a highly corrosive gas, influences the choice of the steel quality of the gasifier body material as well as the subsequent gas cleaning system to increase the plant lifetime, which is leading to considerable additional costs [4]. The content of HCl in the syngas of the biomass gasification must remain at ppb (10−9 mol/mol, amount fraction) level in order to avoid catalyst poisoning [5]. Fast, non-invasive, highly sensitive and accurate HCl monitoring in the gasification process is important for active process control and optimization [6] and for ensuring staying below the legal emission values.
Airborne molecular contamination (AMC) is a kind of chemical contamination in form of gases, vapors or aerosols that has adverse effects on products, processes or instruments in clean room manufacturing environments. The International Technology Roadmap for Semiconductors (ITRS) has made efforts to tighten specification for AMCs [7]. For example, the requirement of Cl concentration in the wafer environment should be below 0.24 nmol/mol of gas phase Cl concentration, as the acid gas HCl creates metal corrosion problems throughout fabrication [8] and can be critical to later damage the normal functionality of integrated circuits. AMC monitoring, and therefore reduction, has a direct financial benefit, through higher product yields and better process reproducibility from site to site. Within the EMPIR MetAMC2 project [9], optical techniques will be developed for trace level HCl detection in cleanrooms.
Chemical reactions involving halogen radical species, such as chlorine, significantly influence the composition of the Earth’s atmosphere. These species also play important roles in many atmospheric processes including the formation and destruction of ozone [10]. Chlorine also mainly comes from chlorofluorocarbons (CFC) and other refrigerants which are inert in the lower atmosphere and are then broken up and converted in to HCl in the upper atmosphere by the UV radiation. HCl is one of the important reservoir species for active halogens and the dominant gas phase contributor to the overall chlorine inventory in the lower atmosphere, as shown in the study of composite chlorine emissions [11]. Typical HCl concentrations are in the range of hundreds of ppt in remote marine environments, increasing to several ppb in coastal urban areas [11,12,13]. There is a strong need for highly sensitive measurement techniques for HCl due to estimations of HCl production varying considerably and challenging existing measurement methods.
The knowledge of accurate spectral line parameters (such as pressure broadening coefficients) of HCl [14,15,16] is important and required for HCl measurements in atmospheric remote sensing, biomass gasification process, semiconductor manufactory cleanroom and precision industrial emission monitoring application. Recently, advances in solid-state laser technologies have provided alternative Mid-IR light sources and enabled access to the strongest HCl transitions in the fundamental band [17], which are about 50 times stronger than at the 1.7 µm HCl first overtone band which we have previously studied [18,19]. As such, we were motivated to develop an optimized Mid-IR absorption diagnostic for HCl [20]. This study focuses on the HCl P(5) transition line in the 1–0 band, which is optimal for HCl measurements in hot flue gases, as it is spectrally well isolated from water and CO2. Our measurements provide a reliable, consistent and thus unique set of five pressure broadening coefficients for the major air or flue gas constituents (HCl-CO2, N2, Ar, O2 and Air) which are all obtained using the same setup and data evaluation method.

2. Methods and Experiment

2.1. Methodology

In order to accurately quantify the foreign pressure broadening coefficients of the HCl transition line in Mid-IR range, the widely used technique, direct tunable diode laser absorption spectroscopy (dTDLAS) [21,22], has been employed. For dTDLAS, the intensity of a monochromatic continuously tunable laser source transmitted through a gaseous sample is given by the “extended” Beer–Lambert law [23]:
I ( λ ) = E ( t ) + I 0 ( λ ) · T ( t ) · e x p [ S ( T ) · g ( λ λ 0 ) · n · L ]
with the background emission E(t) at time t, initial laser intensity I0(λ), and the spectrally broadband transmission losses T(t) which are synchronously derived from the individual raw signals and absorption profiles. The exponential term embraces the absorption line strength S(T) at gas temperature T, the area normalized (integrated area = 1) line shape function g(λλ0) (centered at the wavelength λ0), the absorber number density n and the optical path length L. The absorbance spectrum can be computed using the following equation:
α ( λ , t ) = ln ( I ( λ ) E ( t ) I 0 ( λ ) · T ( t ) ) = S ( T ) · g ( λ λ 0 ) · n · L
The Voigt function can be used to model the lineshape of the absorbance spectrum in Equation (2), which considers the combined effects of Doppler and collisional broadening on the spectral line. These effects are characterized by the Doppler broadening full width at half maximum (FWHM), ΔvD, and the collisional-broadening FWHM, ΔvL, given by
Δ v D = v 0 8 k B T ln 2 M c 2
Δ v L = 2 · p · γ self · x + 2 · p · γ foreign · ( 1 x )
where, M is the molecular mass of the absorbing species, c is the speed of light, kB is Boltzmann constant, p is the total pressure, x is the HCl amount fraction, the coefficients γself and γforeign are the self and foreign broadening coefficients, which are dependent also on the gas temperature T. Normally, Doppler broadening is calculated directly using Equation (3), and thus, does not have to be fitted, as the gas temperature is measured in the experiment. Note that the broadening coefficients (γself, γforeign) calculated using Equation (4) from the measurements are the corresponding values at an experimental temperature T, and have not been converted to the reference temperature T0 = 296 K, which is used in HITRAN [24]. For converting the broadening coefficients to a certain temperature, the self- and foreign-temperature dependence coefficients (nself and nforeign) are needed, which are often determined with relatively high uncertainties in the 10 to 20% range. Typical values for nself and nforeign are between 0.4 and 0.9.

2.2. Experimental Details

The experimental setup of the spectrometer for the determination of the HCl pressure broadening coefficients is shown in Figure 1. A similar setup was used in our previous thermal boundary layer effects study [20]. A 3.6 µm interband cascade laser (ICL) (Nanoplus GmbH) is used to scan across the P5 HCl absorption line in the HCl 1–0 fundamental band. In order to perform spectrometric measurements, the wavelength of the laser was swept at 138.9 Hz across the transition line by means of a linear saw-tooth-shaped current ramp which was generated by a function generator (Agilent, 33220A). The laser injection current is supplied by a low-noise laser current driver (Thorlabs, LDC8002), while the laser temperature is stabilized by a Peltier-element operated by a Peltier driver (Thorlabs TEC8020). The laser beam was directed through a 77.4 cm long single pass gas cell which was made of stainless steel and was equipped with Brewster-angled plane-parallel sapphire windows and then focused onto a photovoltaic photodetector (VIGO, PVI-4TE-5). The inner surface of the gas cell was passivated by a commercial SilcoNert 2000 coating (Silcotek Corporation). The detector signal was sampled with 18 bit resolution at 600 kHz by a DAQ (National Instruments, PXI-6289). For gas pressure measurements, a pressure sensor (MKS Baratron) was used. A Pt100 resistor inserted into the gas cell measured the gas temperature. Measured pressures and temperatures were traceable to the SI via PTB’s national pressure and temperature standards.
The measurements used high-quality premade HCl/CO2 (110 ± 5 µmol/mol HCl in CO2, HCl purity 5.5, CO2 purity 5.3, Linde GmbH) and HCl/N2 (500 ± 30 µmol/mol HCl in N2, HCl purity 5.5, N2 purity 6.0, Linde GmbH) gas mixtures for HCl-CO2 and HCl-N2 pressure broadening coefficients, respectively. All other pressure broadening coefficients (HCl-Ar, HCl-O2 and HCl-Air) were measured by first “coating“ the cell walls with HCl by filling it with premix HCl gas mixture, then quickly replacing the premix gas with pure matrix gases Ar (purity 5.0, Linde GmbH), O2 (purity 5.0, Linde GmbH), or synthetic air (N2:O2 = 80:20, 1% uncertainty of the ratio, O2 purity 5.0, N2 purity 5.0, Linde GmbH) and taking advantage of the delayed HCl desorption from the gas cell inner walls into the pure matrix gas.

3. Results and Discussion

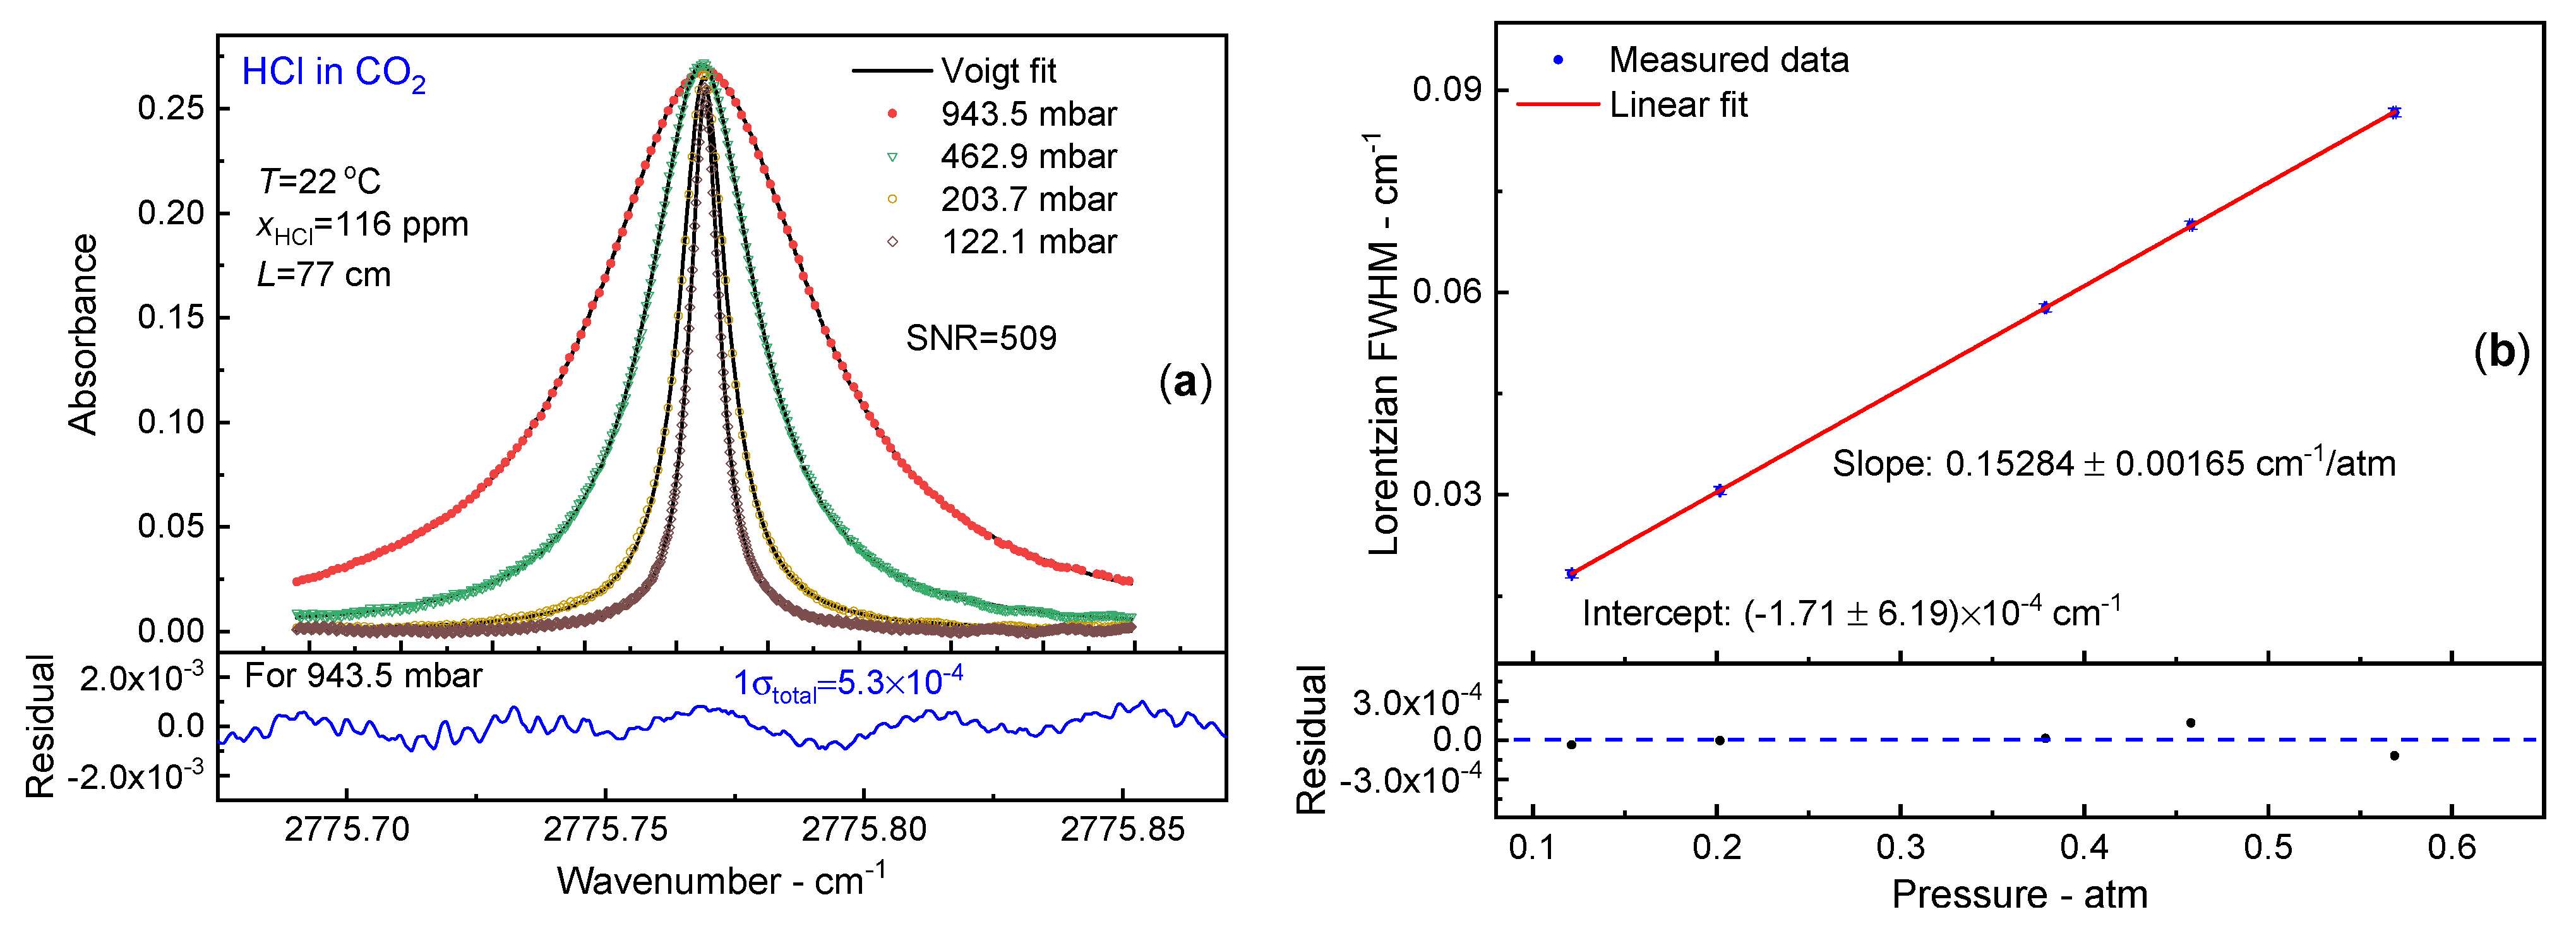
3.1. CO2 Broadening Coefficient

In order to derive the HCl-CO2 broadening coefficient, a customized Linde HCl/CO2 gas mixture (110 ± 5 µmol/mol HCl in CO2) was employed. The gas pressure in the cell was regulated by the gas cell outlet valve and the exhaust pump. The previously evacuated cell was filled with the HCl/CO2 gas mixture at a steady flow rate of 200 sccm set via a mass flow controller.
Figure 2a shows a subset of the measured line profiles for the HCl/CO2 gas mixture at different pressures. The measured laser intensity was averaged over 10 scans and fitted with a third order polynomial for the baseline and the Voigt model using a non-linear Levenberg–Marquart algorithm for the absorption profile. Note that, within the spectral fitting window, we analyzed HCl neighboring lines effects on this P5 line at 700 mbar, the overall contribution of HCl neighboring lines is around 0.01% as P5 line center, and up to 0.2% at the edges of the fitting window with the absorbance of about 5 × 10⁻⁵, so that in this paper, only one HCl line was used to fit the measured spectra. CO2 (pure, 100%) lines absorption (OD, optical density) within the fitting range is less than 5 × 10⁻⁵. The residual between measured and fitted data shown below in Figure 2a is depicted for pressure of 943.5 mbar. Typical average residuals were around (1σ) 5 × 10⁻⁴ optical density, which corresponds to a good signal-to-noise-ratio (SNR) of 509. To clearly discriminate the pressure-broadening effect, the Gaussian width was calculated in all our experiments using the measured temperature in the gas cell according to Equation (3). The line width progression at different pressures was used to extract the pressure broadening coefficient γforeign. The pressure measurements were associated with an 0.1–0.15 mbar uncertainty (k = 1) according to PTB’s national pressure standard. The pressure uncertainty was taken into account for the linear regression in Figure 2b. The standard deviation (1σ) of the line width results (more than 200 measurements) at each pressure point together with the wavenumber scale (laser tuning) uncertainty was used as the y- error bar. The respective Lorentzian widths shows very good linearity with pressures as required by Equation (4) (second term only, as the self-broadening contribution is less than 0.04%) with an intercept of (1.71 ± 6.19) × 10−4 cm−1. Thus, we determined a HCl-CO2 broadening coefficient of γCO2 = 76.42(83) × 10−3 cm−1/atm at 295 K.

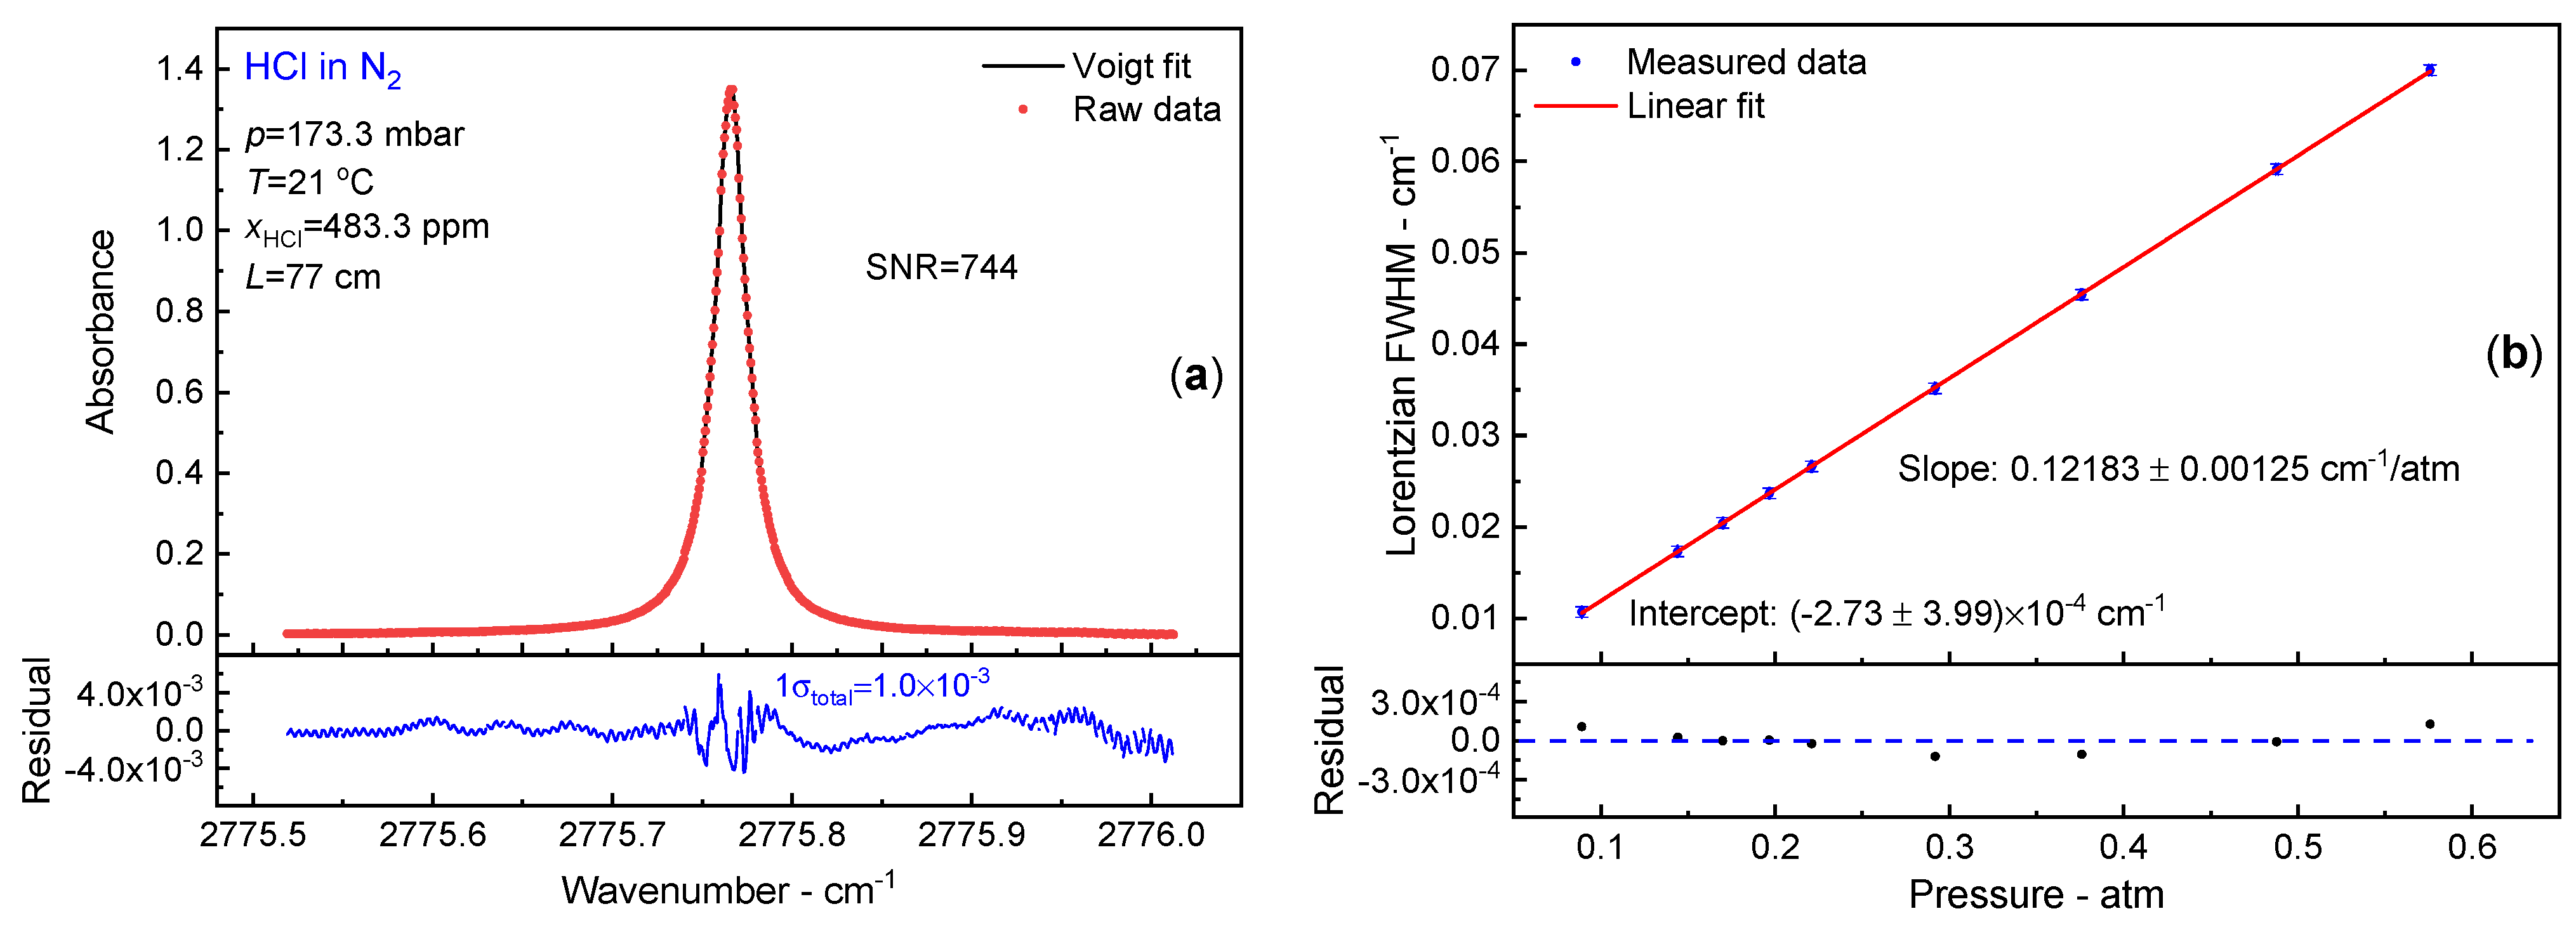
3.2. N2 Broadening Coefficient

In a similar way to the previous experiment, an HCl/N2 gas mixture with 500 ± 30 µmol/mol HCl in N2 was employed to determine the N2 broadening coefficient. The HCl-N2 broadening measurements were performed in a flow mode, the cell was filled with the HCl/N2 gas mixture at a steady flow rate of 200 sccm. As example, Figure 3a shows a measured absorption spectrum at the pressure of 173 mbar. The measured spectrum was averaged for 10 scans and fitted by the Voigt profile. Typical average residuals were around (1σ) 1 × 10⁻³ optical density, which corresponds to a SNR of 744. Comparing to other foreign broadening measurements, here the HCl-N2 broadening coefficient was interfered with the self-broadening contribution in Equation (4) (first term) which was subtracted due to the relative high concentration of HCl. Using the self-broadening coefficient of 0.223 cm−1/atm from HITRAN [20]. The respective Lorentzian widths show very good linearity with pressures with an intercept of (2.73 ± 3.99) × 10−4 cm−1. The measured HCl-N2 broadening coefficient is γN2 = 60.92 (63) × 10−3 cm−1/atm at 294 K.

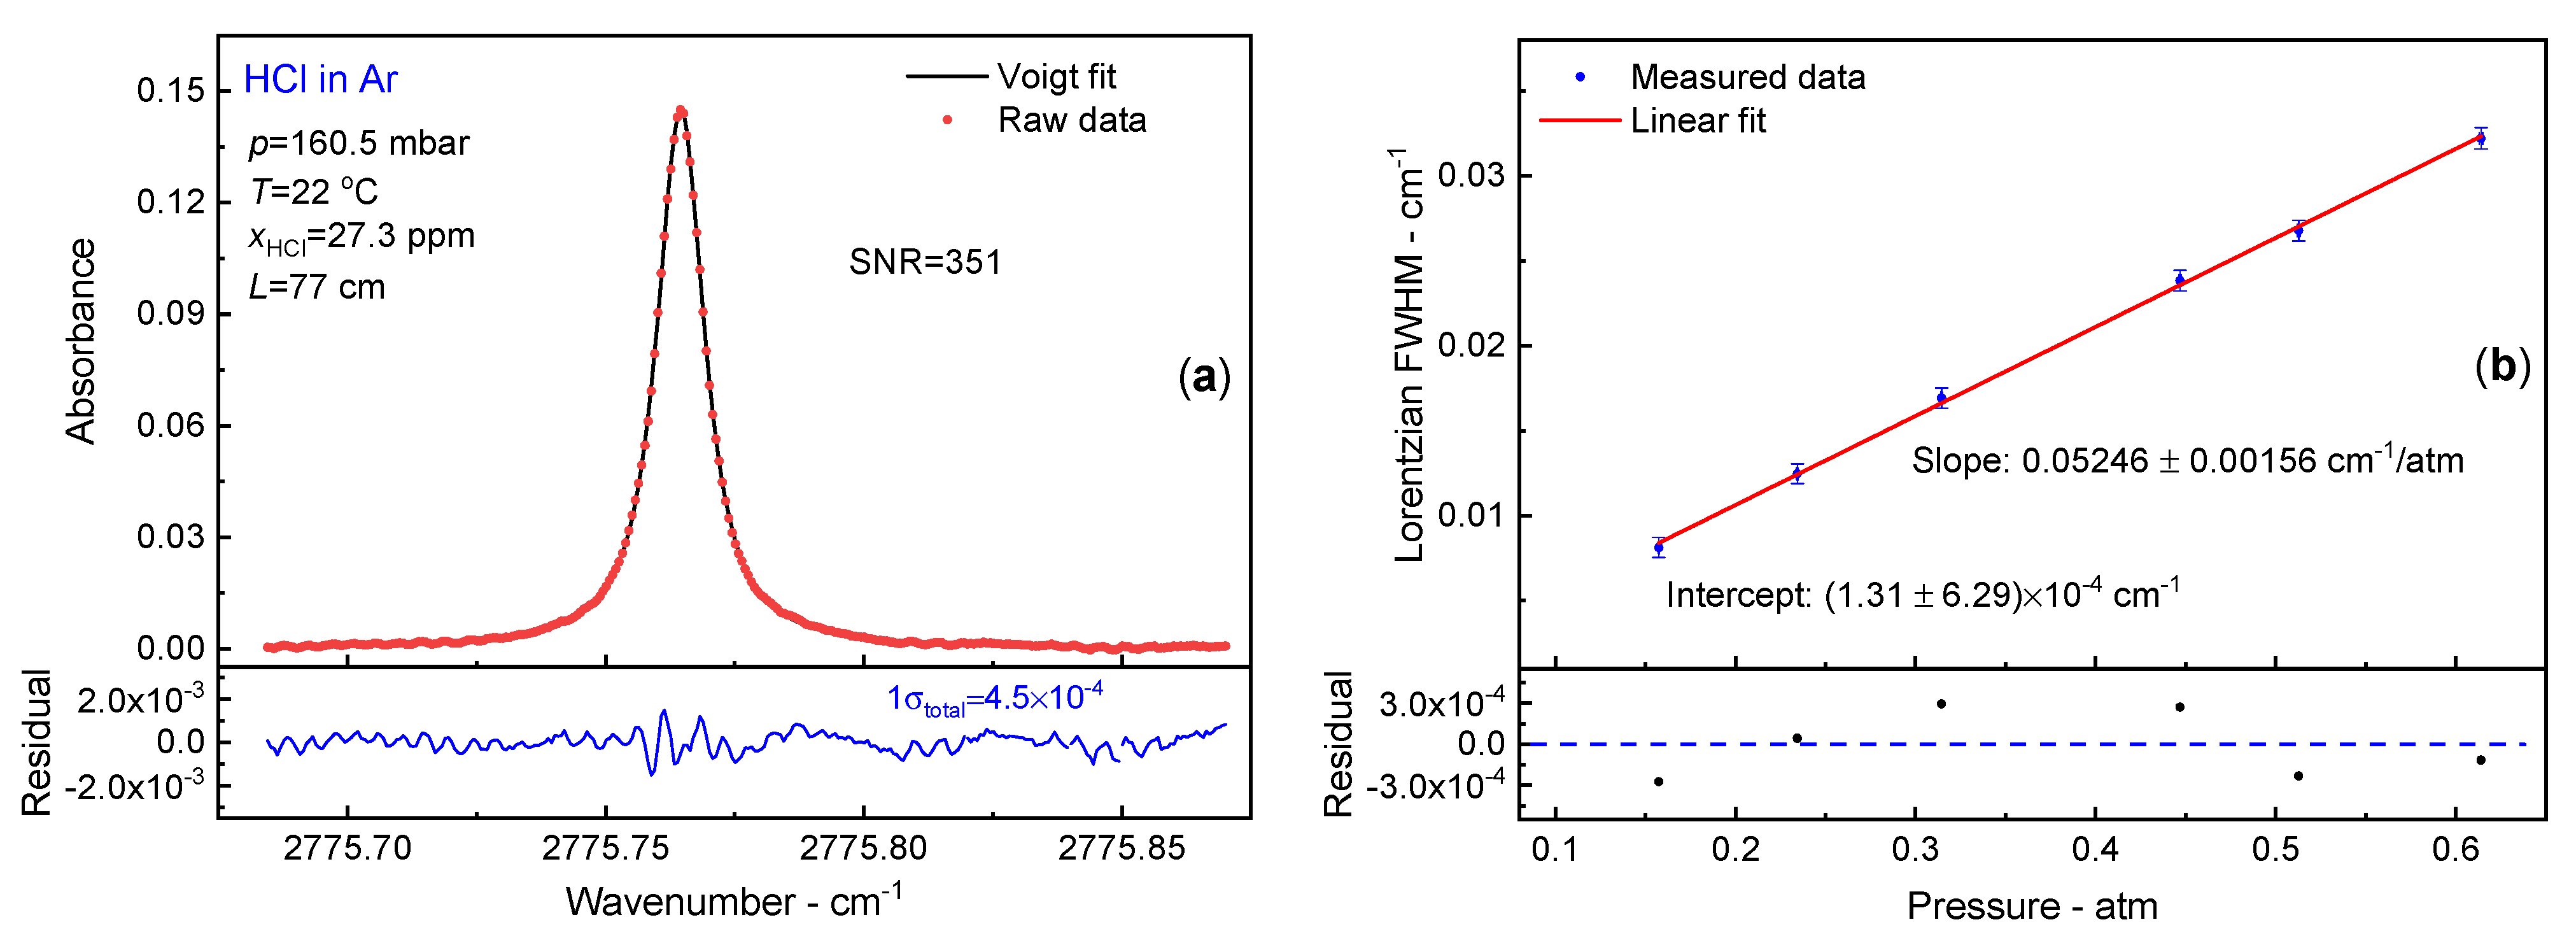
3.3. Ar Broadening Coefficient

The HCl gas molecule is not only reactive but also very sticky, similar as NH3. As we have shown in our previous study [20], the system equilibrium condition can only be reached after passivation. Actually, during this passivation process, HCl molecules stick to the inner surface of the system, while those molecules came into the gas flow again during the evacuation process. We made use of this property of the HCl molecule for foreign broadening coefficients’ measurements.
After flushing the cell with HCl/N2 gas mixture for about an hour to passivate the system, the cell was evacuated using a chemistry vacuum pump to the lowest possible pressure to minimize the HCl self-and N2-broadening effects. Due to the degassing effect, HCl molecules were released from the inner surface. After the evacuation process, pure Ar was filled into the gas cell to a certain pressure. Therefore, in the cell, there were trace HCl (tens of ppm level, but sufficient to measure) and buffer gas Ar.
The HCl-Ar broadening measurements were carried out after those processes. The spectrum treatment was the same as for CO2 and N2 broadening measurements in Section 3.1 and Section 3.2. Figure 4a shows the measured HCl absorption spectrum in Ar (160.5 mbar, 22 °C), the fitting residuals were around (1σ) 4.5 × 10⁻⁴ (optical density), which corresponds to a SNR of 351 for the spectrum of 27.3 ppm HCl in Ar. The measured Lorentzian widths under different pressures are shown in Figure 4b, the linear fit has an intercept of (1.31 ± 6.29) × 10−4 cm−1. The measured HCl-Ar broadening coefficient from the linear fit slope is γAr = 26.23(78) × 10−3 cm−1/atm at 295 K.

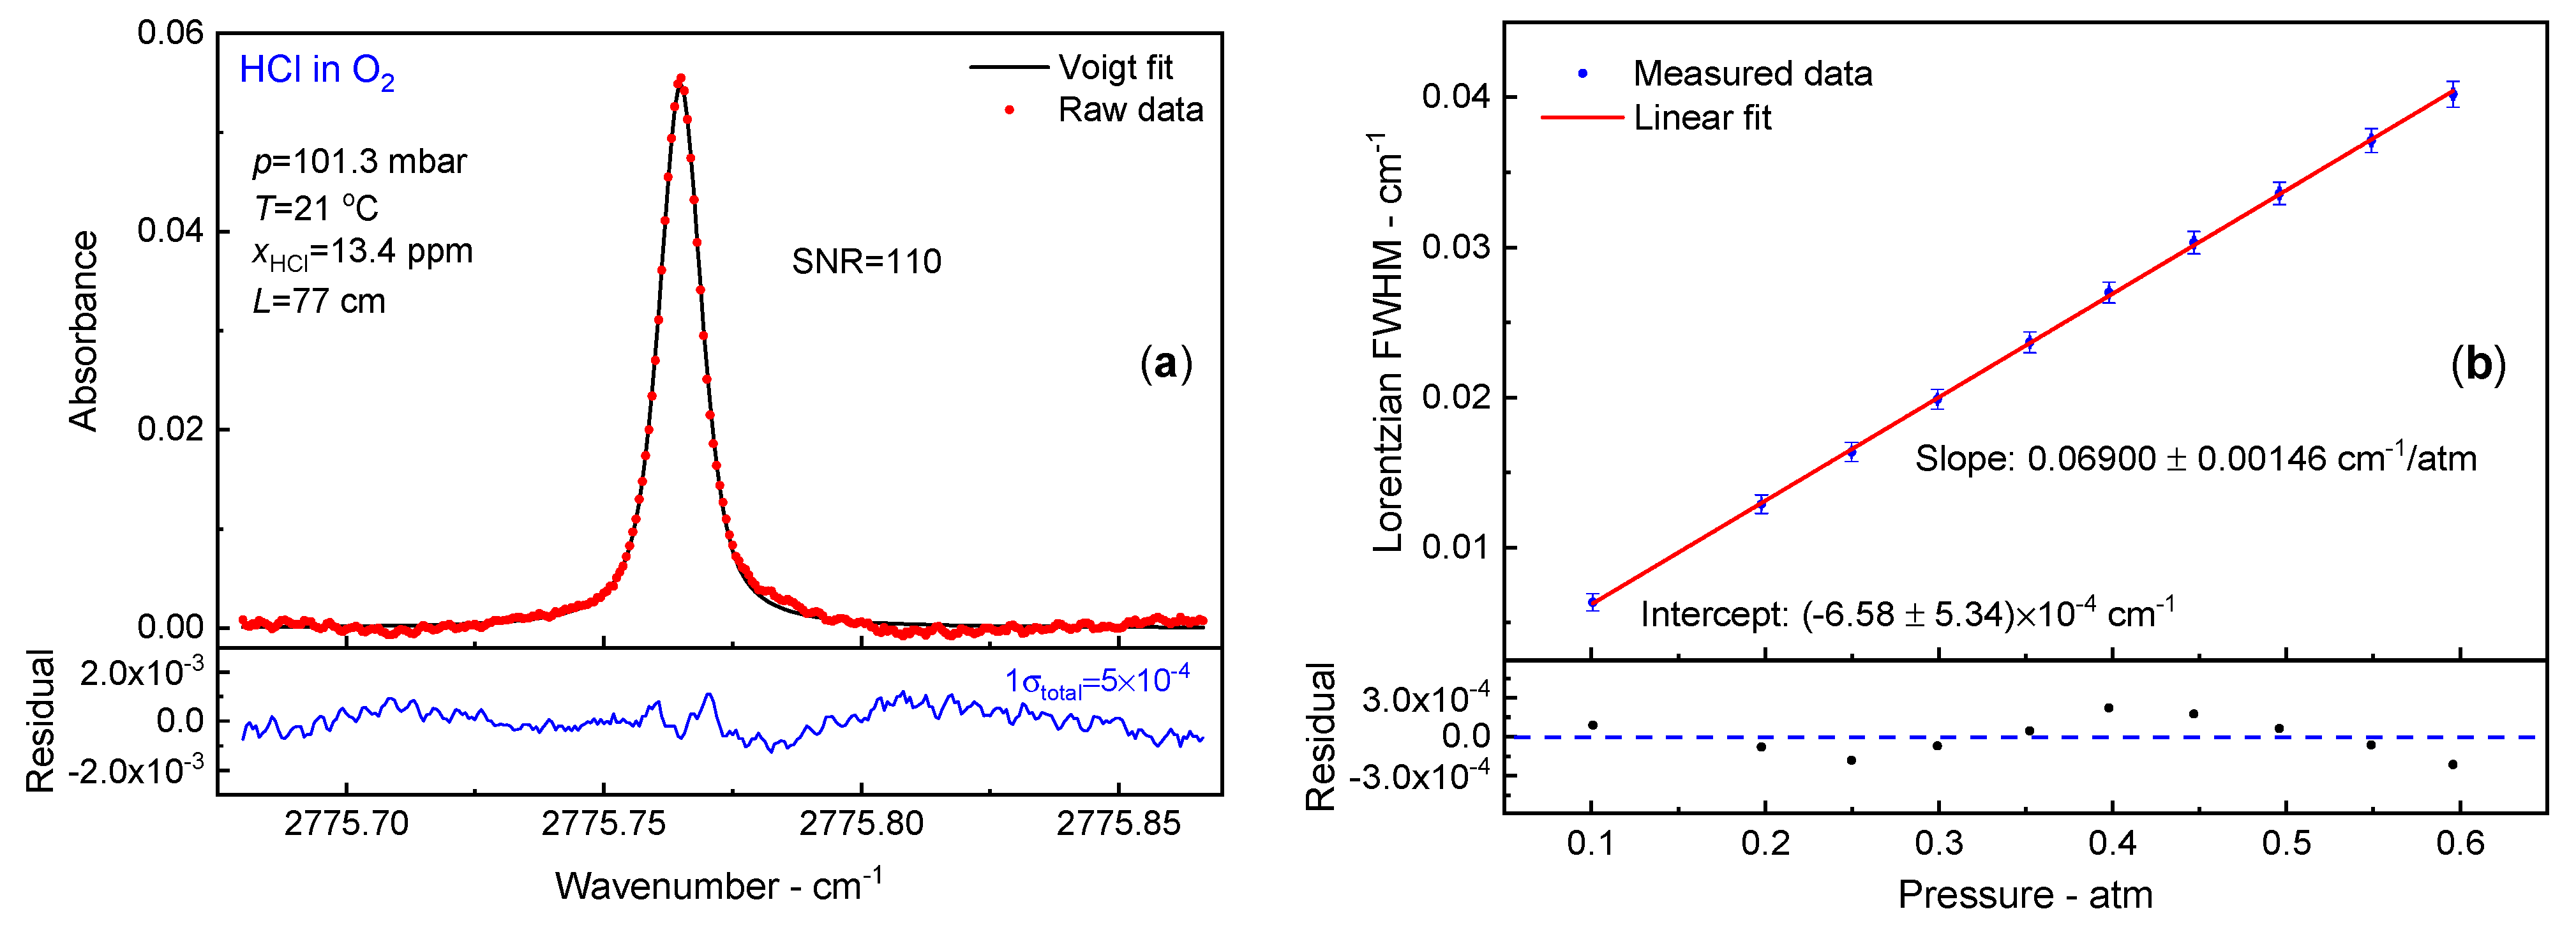
3.4. O2 Broadening Coefficient

The HCl-O2 broadening measurement procedure was the same as for the HCl-Ar broadening experiment, the buffer gas used here was pure O2. As an example, Figure 5a shows a measured absorption spectrum of HCl in O2 at the total pressure of 101.3 mbar. The measured spectrum was averaged for 10 scans and fitted by the Voigt profile. Typical average residuals (optical density) were around (1σ) 5 × 10⁻⁴, which corresponds to a SNR = 110 for the spectrum of 13.4 µmol/mol HCl. The measured HCl-O2 broadening coefficient is γO2 = 34.50(73) × 10−3 cm−1/atm at 294 K according to the slope of the linear regression of the Lorentzian widths versus pressures, with an intercept of (6.58 ± 5.34) × 10−4 cm−1.

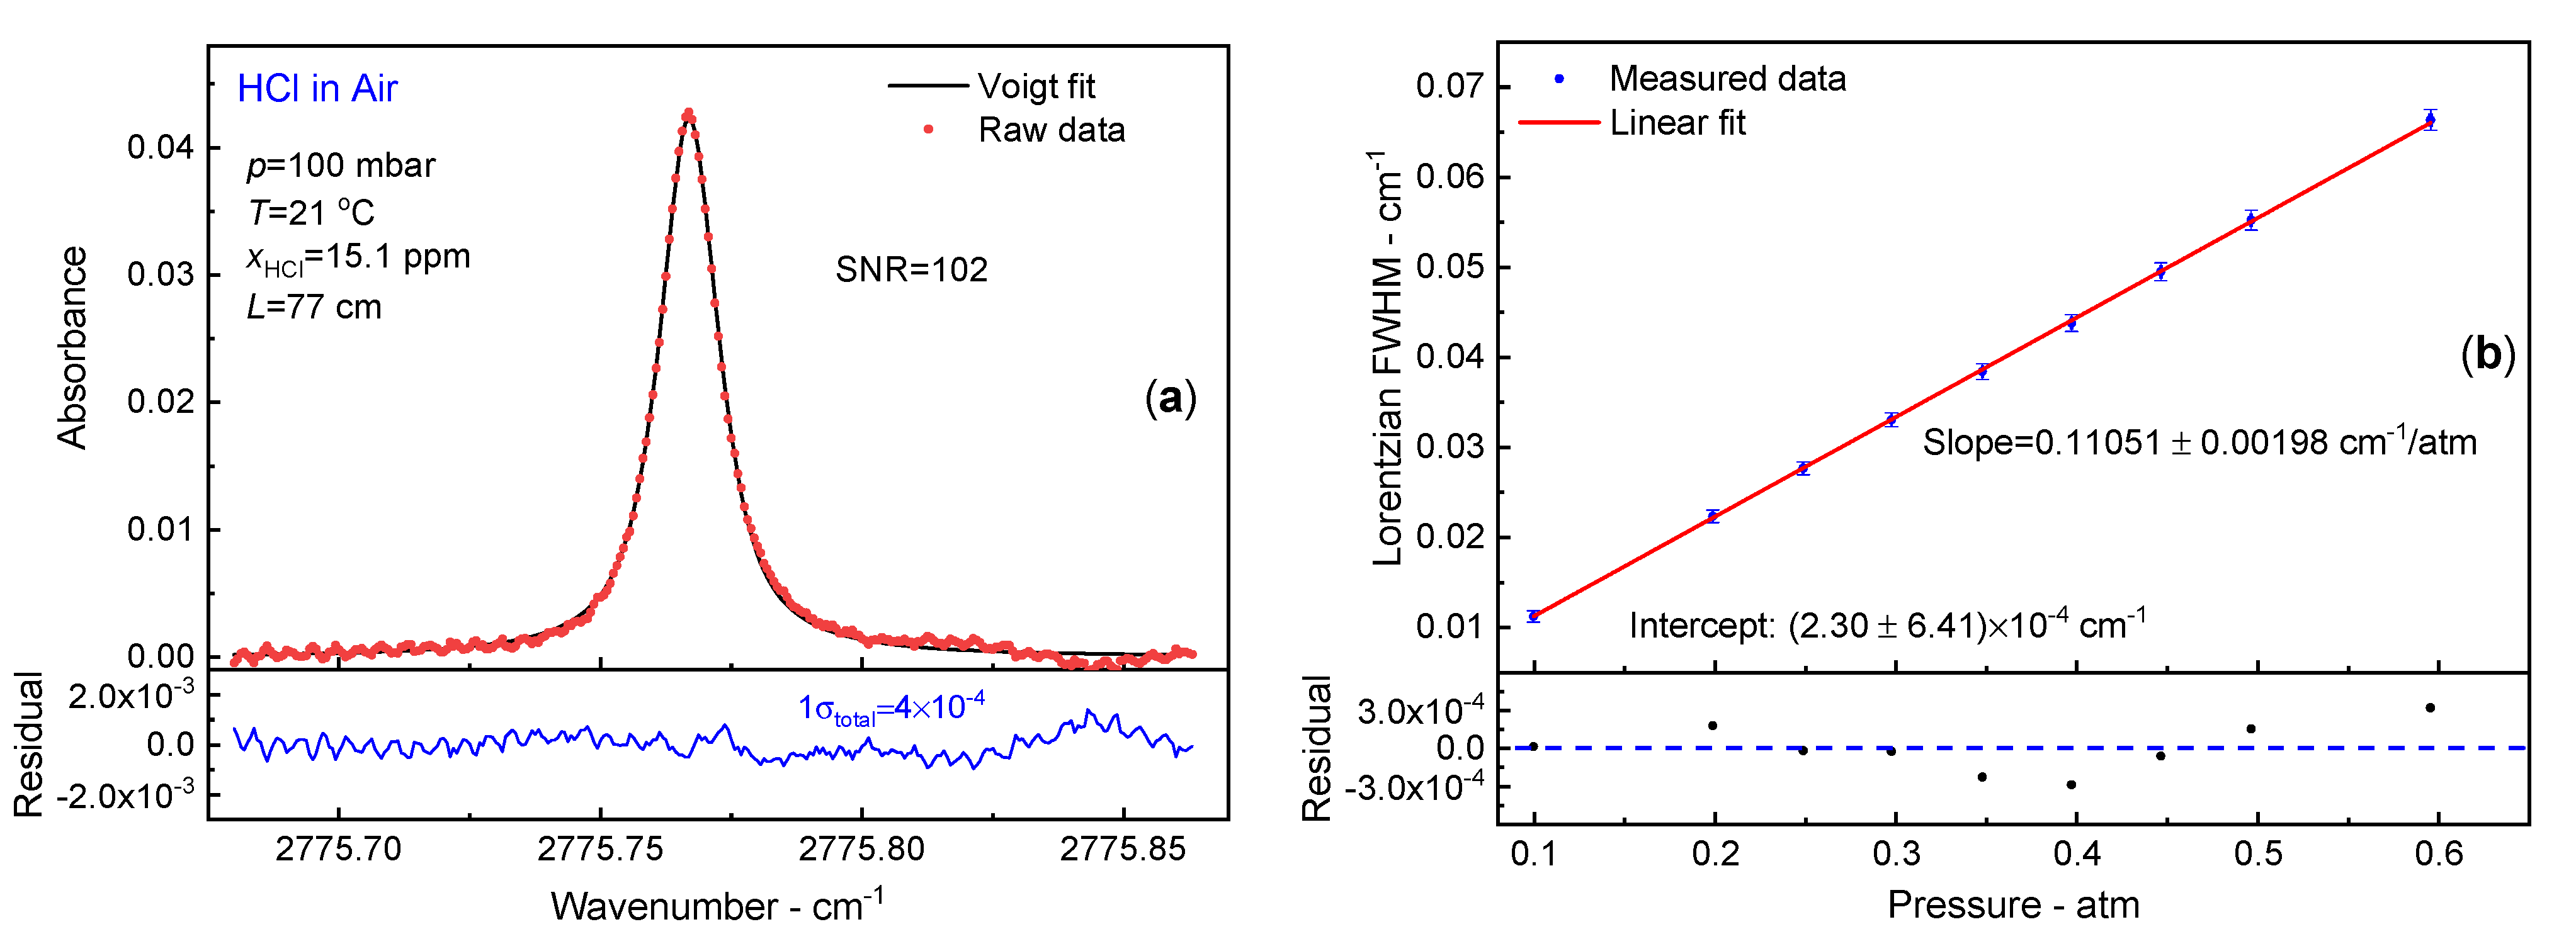
3.5. Air Broadening Coefficien

For the measurement of HCl-Air broadening coefficients, the same procedure as for the HCl-Ar and HCl-O2 broadening coefficient determinations was employed by using the HCl desorption effect from cell inner surface after evacuation. Synthetic Air (N2:O2 = 80:20, 1% uncertainty of the ratio) was filled into the vacuum cell for HCl-Air broadening measurements.
Figure 6a shows the measured HCl absorption spectrum at a pressure of 100 mbar. The measured spectrum was averaged for 10 scans and fitted by the Voigt profile. For this 15.1 µmol/mol HCl spectrum, the SNR is 102 as the residuals were around (1σ) 4 × 10⁻⁴ (optical density). The respective Lorentzian widths show very good linearity with pressures with an intercept of (2.30 ± 6.41) × 10−4 cm−1. The experiments yielded a HCl-Air broadening coefficient γN2 = 55.26(99) × 10−3 cm−1/atm at 294 K.

3.6. Comparison with Literature Values

We summarize our results in Table 1 together with the literature values of the HCl (1←0) P5 line from various published papers. The tabulated broadening coefficients were also shown in Figure 7, together with the relative difference to this study comparing foreign broadening coefficients. Note that the term uncertainty is interpreted very differently between different literature data and the definitions are not explained in some papers; thus, the uncertainty quoted from the literature data have only a limited comparability. The column (to the right) in Table 1 shows the scaled results at 296 K for both this work and the literature data using the P5 line temperature dependance coefficients: nair = 0.46, nCO2 = 0.75 from HITRAN, while for the other three (nN2, nO2, nAr) the default value n = 0.5 were used.
For HCl-CO2 broadening coefficient, the relative difference of the value shown in Ref. [25] to this study is 2.4% as shown in Figure 7. However, our present study still agrees with the literature value within the measurement uncertainty but with improved uncertainty. The measured HCl-N2 broadening coefficient shows a very good agreement with the literature value in Ref [26].
For the HCl-Ar broadening coefficient there is a significant deviation of about 12% compared to the measured results in Ref [27]. Possible reasons might be the different pressure range of the experiment, a high pressure range (10–50 bar) was used in their experiments, while in comparison with the calculated value in Ref [27], the deviation is 2.4%, which shows an agreement with our result within the measurement uncertainty. The “room temperature” mentioned in the publication was not specified, so it might not be 294 K.
For the O2 induced pressure broadening coefficient, the relative difference is 7.5% to Ref [28], and 3.2% to Ref [29] in which the uncertainty was not mentioned. While in those two references, the measurement temperature wase 298 K, which was 4 K higher than our measurement. Additionally, the pressure ranges were higher than ours—2–11 atm in Ref [28], up to 5 atm in Ref [29].
The deviation of HCl-Air broadening coefficient is 1.8% between our result and Ref [26] with 1K temperature difference. Comparing with the measured value in Ref [28] (2–11 atm, 298 K), the deviation is about 5.2%. If using the HCl-N2 broadening coefficient in Ref [30] and HCl-O2 broadening coefficient in Ref [28], as those two broadening coefficients were measured by same authors, based on N2:O2 = 80:20 (as mentioned in Ref [28]) the calculated HCl-Air broadening coefficient at 298 K is 53.74 cm−1/atm which is about 2.6% relative difference to their measured result in Ref [28], while, in our study, the calculated HCl-Air broadening coefficient based our measured HCl-O2 and HCl-N2 results (N2:O2 = 80:20) is 55.64 ± 0.30 cm−1/atm which agrees very well (0.7% deviation) with the measured value within the measurement uncertainty.
The literature data for foreign broadening coefficients of HCl in Table 1 are conveniently divided into two groups according to experimental pressures, i.e., group I for low pressure (<1 atm) and group II for high pressure (1–12 atm). Interestingly, our results agree well with the literature values from the same group I [24,25], but differ from values in group II [26,27,28,29,30] beyond experimental uncertainties. More precisely, for O2 and air-induced broadenings, the percentage differences plotted in Figure 7 are roughly proportional to the highest pressure adopted in the linear regression analysis.
A recent study by Tran et al. [18] revealed a so-called super-Lorentzian line shape for HCl diluted in high density argon gas matrices. Such super-Lorentzian effects cause the Lorentzian widths of Ar-broadened HCl transitions to increase with the distance to line center. The authors explained the origin of this non-conventional line shape at the far wings using classical molecular dynamics simulations (CMDS) based on an ab initio intermolecular potential surface of the HCl-Ar system. Their simulated spectra using CDMS resemble high pressure experimental spectra at the far wings of the spectral lines.
It is easily understood that without anticipating the proper line shape model suggested by Tran et al. which involves three Lorentzian function with different time constant and amplitude, one would deduce the broadening coefficients that differ from the true value at such high-pressure regimes. The clear discrepancy between the group I and group II results shown in Figure 7 coincide with the theory of Tran et al. Yet, more experimental and theoretical studies (e.g., ab initio intermolecular potential surfaces of the HCl-O2 and HCl-N2 systems) are needed to underpin our observations.

4. Conclusions

We report CO2, N2, Ar, O2 and air-induced pressure broadening coefficients of the HCl P(5) line of the 1←0 band at 2775.7 cm−1 measured with a newly developed, highly sensitive Mid-IR ICL-based dTDLAS spectrometer. The measurements were performed in the pressure range of 100–600 mbar which is important for analytical instruments with a reduced measurement pressure to enhance chemical selectivity. Based on well-established TDLAS system in our group, and traceably calibrated pressure and temperature sensors, our results provide a new reliable and fully consistent set of experimental broadening parameters for the HCl P(5) (1←0) line for five matrix gases obtained within the same instrument and evaluation process. Compared to the existing literature data several discrepancies were found and discussed. The relative accuracy of pressure broadening coefficients have been improved for HCl-CO2 and HCl-Ar in comparison with the data from the literature. The newly measured HCl-O2 and HCl-Air broadening coefficients have better consistency than the literature values. For HCl-Ar and HCl-O2 broadening coefficients, data were only available from measured high pressures; this work’s “low pressure” data is new. HCl-Ar, HCl-O2 and HCl-Air broadening coefficients reveal systematic effects of super Lorentzian behavior for coefficients determined at higher pressures. Our novel results are therefore important for the development of analytical HCl instrumentation in all industrial and energy gas applications particularly in combustion emission monitoring, and will be very useful spectroscopic measurements where absorption line has to be fitted.

Author Contributions

Conceptualization, Z.Q., O.W. and V.E. Experiment realization and data collection, Z.Q. Data evaluation and discussion, all authors. All authors have read and agreed to the published version of the manuscript.

Funding

This research was partially funded by the IMPRESS2 (16ENV08) and the MetAMC2 (17IND09) projects. These projects have received funding from the EMPIR programme co-financed by the Participating States and from the European Union’s Horizon 2020 research and innovation programme.

Institutional Review Board Statement

Not applicable.

Informed Consent Statement

Not applicable.

Acknowledgments

The authors would like to thank Kai-Oliver Krauß for his help of building the gas manifold.

Conflicts of Interest

The authors declare no conflict of interest.

References

  1. Thierry, L.; Ferrería de laFuente, J.F.; Neuwahl, F.; Canova, M.; Pinasseau, A.; Jankov, I.; Brinkmann, T.; Roudier, S.; Sancho, L.D. BAT Reference Document for Large Combustion Plants. Industrial Emissions Directive 2010/75/EU (Integrated PollutionPrevention and Control); Publications Office of the European Union: Luxembourg, 2016; ISBN 9789279743030. [Google Scholar] [CrossRef]
  2. EMPIR Project: IMPRESS2. Available online: http://empir.npl.co.uk/impress/ (accessed on 25 April 2021).
  3. Abdoulmoumine, N.; Adhikari, S.; Kulkarni, A.; Chattanathan, S. A review on biomass gasification syngas cleanup. Appl. Energy 2015, 155, 294–307. [Google Scholar] [CrossRef]
  4. Bjoroey, O.; Haugholt, K.H.; Jaeger, T. Diode laser spectroscopy of gaseous HCl. Quantum Electron. 1996, 26, 1090–1092. [Google Scholar] [CrossRef]
  5. Leibold, H.; Hornung, A.; Seifert, H. HTHP syngas cleaning concept of two stage biomass gasification for FT synthesis. Powder Technol. 2008, 180, 265–270. [Google Scholar] [CrossRef]
  6. Ortwein, P.; Woiwode, W.; Fleck, S.; Eberhard, M.; Kolb, T.; Wagner, S.; Gisi, M.; Ebert, V. Absolute diode laser-based in situ detection of HCl in gasification processes. Exp. Fluids 2010, 49, 961–968. [Google Scholar] [CrossRef]
  7. International Technology Roadmap for Semiconductors. Available online: http://www.itrs2.net/itrs-reports.html (accessed on 25 April 2021).
  8. Wu, B.J.; Bai, H.; Lin, I.K.; Liu, S.S. Al-Cu pattern wafer study on metal corrosion due to chloride ion contaminants. IEEE Trans. Semicond. Manuf. 2010, 23, 553–558. [Google Scholar] [CrossRef]
  9. EMPIR Project: MetAMC2. Available online: http://empir.npl.co.uk/metamcii/ (accessed on 25 April 2021).
  10. Molina, M.J.; Rowland, F.S. Stratospheric sink of chlorofluoromrthanes: Chlorine atom-catalyzed destruction of ozone. Nature 1974, 249, 810. [Google Scholar] [CrossRef]
  11. Keene, W.C.; Khalil, M.A.K.; Erickson, D.J.; McCulloch, A.; Graedel, T.E.; Lobert, J.M.; Aucott, M.L.; Gong, S.L.; Harper, D.B.; Kleiman, G.; et al. Composite global emissions of reactive chlorine from anthropogenic and natural sources: Reactive chlorine emissions inventory. J. Geophys. Res. Atmos. 1999, 104, 8429–8440. [Google Scholar] [CrossRef] [Green Version]
  12. Kim, S.; Huey, L.G.; Stickel, R.E.; Pierce, R.B.; Chen, G.; Avery, M.A.; Dibb, J.E.; Diskin, G.S.; Sachse, G.W.; McNaughton, C.S.; et al. Airborne measurements of HCl from the marine boundary layer to the lower stratosphere over the North Pacific Ocean during INTEX-B. Atmos. Chem. Phys. Discuss. 2008, 8, 3563–3595. [Google Scholar] [CrossRef] [Green Version]
  13. Keene, W.C.; Stutz, J.; Pszenny, A.A.P.; Maben, J.R.; Fischer, E.V.; Smith, A.M.; von Glasow, R.; Pechtl, S.; Sive, B.C.; Varner, R.K. Inorganic chlorine and bromine in coastal New England air during summer. J. Geophys. Res. Atmos. 2007, 112, 1–15. [Google Scholar] [CrossRef] [Green Version]
  14. Li, G.; Serdyukov, A.; Gisi, M.; Werhahn, O.; Ebert, V. FTIR-based measurements of self-broadening and self-shift coefficients as well as line strength in the first overtone band of HCl at 1.76μM. J. Quant. Spectrosc. Radiat. Transf. 2015, 165, 76–87. [Google Scholar] [CrossRef]
  15. Li, G.; Domanskaya, A.V.; Tran, H.; Gisi, M.; Ebert, V. Broadening and shift coefficients for the (2 ← 0) overtone band of HCl (1.76 µm) induced by exhaust gases CO and CO2. J. Quant. Spectrosc. Radiat. Transf. 2017, 203, 434–439. [Google Scholar] [CrossRef]
  16. Ortwein, P.; Woiwode, W.; Wagner, S.; Gisi, M.; Ebert, V. Laser-based measurements of line strength, self- and pressure-broadening coefficients of the H35Cl R(3) absorption line in the first overtone region for pressures up to 1 MPa. Appl. Phys. B 2010, 100, 341–347. [Google Scholar] [CrossRef]
  17. Nwaboh, J.A.; Meuzelaar, H.; Liu, J.; Persijn, S.; Li, J.; Van Der Veen, A.M.H.; Chatellier, N.; Papin, A.; Qu, Z.; Werhahn, O.; et al. Accurate analysis of HCl in biomethane using laser absorption spectroscopy and ion-exchange chromatography. Analyst 2021, 146, 1402–1413. [Google Scholar] [CrossRef]
  18. Domanskaya, A.V.; Li, G.; Tran, H.; Gisi, M.; Ebert, V. Collision-induced line parameters for the (2 ← 0) overtone band of HCl (1.76 µm) in binary mixtures with H2 and CH4. J. Quant. Spectrosc. Radiat. Transf. 2017, 199, 71–76. [Google Scholar] [CrossRef]
  19. Tran, H.; Li, G.; Ebert, V.; Hartmann, J.-M. Super-and sub-Lorentzian effects in the Ar-broadened line wings of HCl gas. J. Chem. Phys. 2017, 146, 194305. [Google Scholar] [CrossRef] [Green Version]
  20. Qu, Z.; Nwaboh, J.; Werhahn, O.; Ebert, V. Towards a dTDLAS-Based Spectrometer for Absolute HCl Measurements in Combustion Flue Gases and a Better Evaluation of Thermal Boundary Layer Effects-of-sight measurements HCl measurement Spatial heterogeneity Thermal boundary layer. Flow Turbul. Combust. 2021, 106, 533–546. [Google Scholar] [CrossRef]
  21. Ebert, V.; Wolfrum, J. Absorption Spectroscopy. In Optical Measurements—Techniques and Applications, (Heat and Mass Transfer), 2nd ed.; Mayinger, F., Feldmann, O., Eds.; Springer: Heidelberg, Germany, 2001. [Google Scholar]
  22. Qu, Z.; Steinvall, E.; Ghorbani, R.; Schmidt, F.M. Tunable Diode Laser Atomic Absorption Spectroscopy for Detection of Potassium under Optically Thick Conditions. Anal. Chem. 2016, 88, 3754–3760. [Google Scholar] [CrossRef] [Green Version]
  23. Schulz, C.; Dreizler, A.; Ebert, V.; Wolfrum, J. Combustion Diagnostics. In Springer Handbook of Experimental Fluid Dynamics, 1st ed.; Tropea, C., Foss, J., Yarin, A., Eds.; Springer: Berlin/Heidelberg, Germany, 2007; ISBN 9783662491621. [Google Scholar]
  24. Rothman, L.S.; Gordon, I.E.; Babikov, Y.; Barbe, A.; Chris Benner, D.; Bernath, P.F.; Birk, M.; Bizzocchi, L.; Boudon, V.; Brown, L.R.; et al. The HITRAN2012 molecular spectroscopic database. J. Quant. Spectrosc. Radiat. Transf. 2013, 130, 4–50. [Google Scholar] [CrossRef] [Green Version]
  25. Tudorie, M.; Földes, T.; Vandaele, A.C.; Vander Auwera, J. CO2 pressure broadening and shift coefficients for the 1-0 band of HCl and DCl. J. Quant. Spectrosc. Radiat. Transf. 2012, 113, 1092–1101. [Google Scholar] [CrossRef]
  26. Pine, A.S.; Looney, J.P. N2 and air broadening in the fundamental bands of HF and HCl. J. Mol. Spectrosc. 1987, 122, 41–55. [Google Scholar] [CrossRef]
  27. Boulet, C.; Flaud, P.M.; Hartmann, J.M. Infrared line collisional parameters of HCl in argon, beyond the impact approximation: Measurements and classical path calculations. J. Chem. Phys. 2004, 120, 11053–11061. [Google Scholar] [CrossRef]
  28. Asfin, R.E.; Domanskaya, A.V.; Maul, C. Broadening and shifting coefficients of rotation-vibrational lines in the fundamental and first overtone bands of HCl and HBr induced by oxygen and air. J. Quant. Spectrosc. Radiat. Transf. 2013, 130, 296–303. [Google Scholar] [CrossRef]
  29. Houdeau, J.P.; Larvor, M.; Haeusler, C. Etude basse temprature des largeurs et des dplacements des raies rovibrationnelles de la bande fondamentale de H35Cl comprim par N2, O2, D2 et H2. Can. J. Phys. 1980, 58, 318–324. [Google Scholar] [CrossRef]
  30. Asfin, R.E.; Domanskaya, A.V.; Maul, C.; Bulanin, M.O. Nitrogen-induced broadening and shift coefficients of rotation-vibrational lines in the fundamental and first overtone bands of HCl and HBr. J. Mol. Spectrosc. 2012, 282, 9–13. [Google Scholar] [CrossRef]
  31. Houdeau, J.P.; Larvor, M.; Haeusler, C. Widths and shifts of H35Cl lines in the fundamental band induced by argon and xenon at low temperatures. J. Quant. Spectrosc. Radiat. Transf. 1976, 16, 457–465. [Google Scholar] [CrossRef]
Figure 1. Experimental setup of the spectrometer for measuring the pressure broadening coefficients, P-sensor: pressure sensor; PD: photodetector; FG: function generator; DAQ: data acquisition card.
Applsci 11 05190 g001
Figure 2. (a) Measured CO2-broadened HCl absorption spectra at different pressures. The fitting residual is depicted for the spectrum at 943.5 mbar; (b) Measured CO2 induced pressure broadening with a linear fitting model. The residual between fit and data is shown below.
Applsci 11 05190 g002
Figure 3. (a) Measured N2-broadened HCl absorption spectra at 173.3 mbar, and the fitting residual; (b) Measured N2 induced pressure broadening with a linear fitting model. The residual between fit and data is shown below.
Applsci 11 05190 g003
Figure 4. (a) Measured Ar-broadened HCl absorption spectra at 160.5 mbar and the fitting residual; (b) Measured Ar induced pressure broadening with a linear fitting model. The residual between fit and data is shown below.
Applsci 11 05190 g004
Figure 5. (a) Measured O2-broadened HCl absorption spectra in O2 at 101.3 mbar and the fitting residual; (b) Measured O2 induced pressure broadening with a linear fitting model. The residual between fit and data is shown below.
Applsci 11 05190 g005
Figure 6. (a) Measured HCl absorption spectra in O2 at 101.3 mbar and the fitting residual; (b) Measured O2 induced pressure broadening with a linear fitting model. The residual between fit and data is shown below.
Applsci 11 05190 g006
Figure 7. Comparison of our results with data from the literature, y-axis: percentage difference using present study as a reference. Red up-pointing triangle: data from literature measured in low pressure group, Blue down-pointing triangle: data from literature measured in high pressure group.
Applsci 11 05190 g007
Table 1. Comparison of our results with data from the literature for the foreign broadening coefficients of HCl P(5) (1←0) absorption line with CO2, N2, Ar, O2 and Air.
This WorkReferencesScaled to 296 K
(This Work/References)
γCO2/103 cm−1/atm76.42 ± 0.8374.2 ± 2.2 [25] 76.23/74.2 [24]
Pressure/atm0.1–0.60.2–0.93
Temperature/K295296
Relative uncertainty1.09%3%
γN2/103 cm−1/atm60.92 ± 0.6360.9 ± 0.5 [26]59.2 ± 0.3 [30]60.71/60.8 [25], 59.4 [26]
Pressure/atm0.1–0.60.026–0.27≤11
Temperature/K294295298
Relative uncertainty1.03%0.8%0.5%
γAr/103 cm−1/atm26.23 ± 0.7829.4 ± 2 (meas.) 25.6 (cal.) [27]27.8 [31]26.19/27.89 [28]
Pressure/atm0.1–0.610–503–5
Temperature /K295Room T298
Relative uncertainty2.97%6.8%
γO2/103 cm−1/atm34.50 ± 0.7331.9 ± 0.3 [28]33.4 [29]34.38/32.01 [29], 33.51 [30]
Pressure/atm0.1–0.62–11≤5
Temperature/K294298298
Relative uncertainty2.12%0.9%
γAir/103 cm−1/atm55.26 ± 0.9952.4 ± 0.5 [28]54.1 ± 0.3 [26]55.09/52.56 [29], 54.02 [25]
Pressure/atm0.1–0.62–110.026–0.27
Temperature/K294298295
Relative uncertainty1.79%1%0.6%
Publisher’s Note: MDPI stays neutral with regard to jurisdictional claims in published maps and institutional affiliations.

