
A Dual-Gas Sensor Using Photoacoustic Spectroscopy Based on a Single Acoustic Resonator

1
Centre for Optical and Electromagnetic Research, National Engineering Research Center for Optical Instruments, Zhejiang Provincial Key Laboratory for Sensing Technologies, College of Optical Science and Engineering, Zhejiang University, Hangzhou 310058, China
2
Ningbo Research Institute, Zhejiang University, Ningbo 315100, China
3
School of Information Science and Engineering, NingboTech University, Ningbo 315100, China
*
Authors to whom correspondence should be addressed.
Appl. Sci. 2021, 11(11), 5224; https://doi.org/10.3390/app11115224
Submission received: 7 April 2021
/
Revised: 31 May 2021
/
Accepted: 1 June 2021
/
Published: 4 June 2021
(This article belongs to the Special Issue Diode Laser Spectroscopy – Robust Sensing for Environmental and Industrial Applications)
Abstract
:A dual-gas photoacoustic spectroscopy (PAS) sensor based on wavelength modulation spectroscopy (WMS) was developed and experimentally demonstrated. Distributed feedback (DFB) laser diodes, emitting at 1512 and 1653 nm, were utilized as the excitation sources for the simultaneous measurement of NH3 and CH4, respectively. The PAS signal was excited by modulating the DFB laser at the first longitudinal resonant frequency of a cylindrical acoustic resonator. Absorption lines for NH3 and CH4 were simultaneously recorded during one frequency scan of the DFB lasers without using any optical switch. The interference of NH3 and CH4 on each other was investigated for accurate detection. The limits of detection (LoDs) of the PAS sensor for NH3 and CH4 for an integration time of 100 s were determined to be 0.1 and 0.3 ppm, respectively. The present PAS sensor provides a new scheme for multi-gas analysis with the advantages of cost-effectiveness, a simple structure and multi-wavelength operation.
1. Introduction
Multi-gas analysis sensors have attracted considerable attention in recent years due to their significant applications in various fields of industry and science, such as environmental monitoring [1,2], atmospheric research [3], medical diagnosis [4,5] and industrial process control [6]. Various types of optical absorption spectroscopy—including photoacoustic spectroscopy [7,8], tunable diode laser-absorption spectroscopy (TDLAS) [9,10,11,12,13] (that could also be combined with other hyperspectral imaging methods [14]) and cavity-enhanced absorption spectroscopy (CEAS) [15]—are commonly used for trace gas analysis due to their advantages of noninvasive direct measurement and high sensitivity.
Multi-gas analysis using optical absorption spectroscopy requires either a broadband source (such as a light-emitting diode (LED)) [16], or widely tunable laser sources [17,18] or a combined scheme using multi-laser sources for scanning the different absorption lines of gas species. An LED as a broadband light source is usually used in cavity-enhanced absorption spectroscopy for multi-species detection. Wu et al. reported a transportable incoherent broadband CEAS instrument involving LED from 355 to 375 nm as a light source to realize a continuous measurement of HONO and NO2 with an LoD of 0.6 and 2 ppbv, respectively [16]. Yu et al. used an external-cavity quantum-cascade laser in a broadband range of 1225–1285 cm−1 for the simultaneous measurement of CH4, N2O, HDO and H2O with an LoD of 2.2 ppbv, 1.43 ppbv, 3.92 ppbv and 1.77 ppmv, respectively, based on wavelength modulation spectroscopy [19]. For coupling different narrow lasers as light sources, Jiang et al. reported a multi-gas TDLAS sensor equipped with an optic switch to alternatively measure methane, ethyne, ethene and ethane using four DFB lasers emitting at 1653.72, 1530.37, 1620.04 and 1679.06 nm [20]. For quartz-enhanced photoacoustic spectroscopy (QEPAS), Wu et al. proposed a dual-gas QEPAS sensor based on two distributed feedback (DFB) lasers emitting at 1528.59 and 1368.60 nm as excitation sources, which are focused at two different positions between the quartz tuning fork prongs to excite two resonant modes for realizing simultaneous measurement of C2H2 and H2O [21]. However, each technique has its own limitations for field measurement. The CEAS method is based on a high-finesse optical cavity that is composed of two relatively expensive high-reflectivity dielectric mirrors. The effective wavelength band of the CEAS method is limited by the spectrum band of the highly reflective dielectric mirrors [22]. In QEPAS, its measurement accuracy is easily affected by the beam quality [23]. The instrument performance of TDLAS highly depends on the background signal (not a zero-background approach) [24], and its measurement sensitivity is limited by the optical length in the optical cell (typically as a multi-pass cell).
Photoacoustic spectroscopy (PAS) using a microphone is a well-established method for trace gas analysis because of its simplicity and wide dynamic range [25]. Photoacoustic spectroscopy relies on the generation of the acoustic wave by converting light energy into thermal energy [26]. The thermal wave variation results in an acoustic signal. An acoustic resonator is usually used to amplify the acoustic signal that is conventionally measured by a microphone [8,27]. Photoacoustic spectroscopy is a zero-background approach [28]. It is suitable for all broadband light sources. For realizing multi-gas analysis, several acoustic resonators or a mid-infrared broadband source are used in the PAS approach. Besson et al. developed a multi-gas PA sensor based on three longitudinal acoustic resonators for the measurement of three trace gases of H2O at 1368.6 nm, CH4 at 1651.0 nm and HCl at 1737.9 nm [7]. Chen et al. reported a multi-gas PA analyzer using a mid-infrared broadband source and an optical wheel, installing several optical filters for selecting different absorption lines of several gases for detecting CO, CO2, CH4, C2H6, C2H4 and H2O gas [3].
In this paper, we present a compact wavelength modulation photoacoustic spectroscopy for the simultaneous measurement of CH4 and NH3 based on a single acoustic resonator using two DFB lasers emitting at 1512 and 1653 nm. Normally, multi-gas detection using several DFB lasers in the PAS approach is achieved by using several acoustic resonators [7], broadband source sensors [18] and an optical switch [7,20]. The motivation of our work is to simplify the system structure of optical absorption spectroscopy for multi-gas analysis. The developed compact PA spectroscopy has the advantage of simple structure (one resonator without using any optical switch) and broadband characteristics when combining two DFB lasers at different wavelengths. The performance of the developed instrument was evaluated for simultaneous detection of CH4 and NH3.
2. Materials and Methods
2.1. Measurement Principle
In a wavelength modulation photoacoustic spectroscopy (WMPAS) system, the modulation of the injection current in a DFB laser results in the simultaneous modulation of optical power (intensity modulation) and laser frequency (wavelength modulation). The laser wavelength is scanned through the absorption line using a slow current ramp [29]. The laser intensity is modulated using a sine signal at frequency fmod, which is the nth resonant frequency in the PA cell. The modulated laser wavelength and intensity are expressed as follows [29,30]:
where υ(t) is the laser frequency, υc(t) is the central frequency of modulation, Δυ is the frequency modulation amplitude, I0(t) is the light intensity, Ic(t) is the light intensity at the central frequency, ΔI is the intensity modulation amplitude, ω is the modulation angle frequency ω = 2πfmod and Δφ is the phase difference between the laser intensity and the optical frequency.
Photoacoustic spectroscopy is based on the absorption of light by the molecules of the target species. The fundamental theory governing absorption spectroscopy is based on the well-known Beer–Lambert law. Upon Fourier expansion of the Beer–Lambert law, the following first harmonic signal of the PA signal is used for determining the target gas concentration, expressed as follows [30]:
where M is the microphone sensitivity, C is the gas concentration, F is the response constant of the PAS cell, Ψ is the phase difference between the driving signal and the laser amplitude modulation and H1(υ, υ0) is the first harmonic magnitude derived from the Fourier cosine series expansion of the gas absorption. The photoacoustic signal is proportional to the excitation optical power [31], and thus, the PA signal using the first harmonic (intensity modulation frequency) signal is higher than that using the second harmonic signal.
2.2. System Setup
Figure 1 shows the schematic of our PAS instrument. The PAS instrument consists of two power-modulated light sources, an in-house-developed resonant PA cell to convert the light absorbed by trace gases to an acoustic signal, and a signal processing module. Two intensity-modulated DFB laser diodes emitting at around 1512 (SWLD-151220S22-02, Sichuan Tengzhong Light Technology, Chengdu, China) and 1653 nm (SWLD-165317S22-02, Sichuan Zhiguang Photonics Technology, Chengdu, China) were utilized as light sources for the simultaneous detection of ammonia and methane, respectively. The two lasers were fiber-coupled with SM fiber pigtail and mounted on butterfly clamp mountings (BF14-S, Sichuan Tengzhong Light Technology, Chengdu, China). Two fiber collimators (F280APC, Thorlabs, Newton, MA, USA) with a focal length of 18.75 mm were used to reshape the laser beam for passing through the PA cell. The two laser beams were coupled together with a dichroic filter (3007010677, Union Optic, Wuhan, China). The DFB laser was powered by a laser controller (LDC202C, Thorlabs, Newton, MA, USA) with a current from 90 to 150 mA and a temperature of 22 °C. The wavelength of DFB laser 1 (around 1512 nm) was tuned from 1511.9 to 1512.3 nm when varying the current from 90 to 130 mA (center current: 110 mA; current scan amplitude: −20 to 20 mA), and the wavelength of DFB laser 2 (around 1653 nm) was tuned from 1653.6 to 1654.3 nm when varying the current 110 to 150 mA (center current: 130 mA; current scan amplitude: −20 to 20 mA), as shown in Figure 2a. The wavelength tuning of the DFB lasers with varying currents was measured by an optical spectrum analyzer (AQ6317, ANDO Electric, Tokyo, Japan). To ensure that the main absorption features were free from spectral interference, the scanning ranges were enlarged. The selected absorption lines of NH3 and CH4 at 1512.24 and 1653.72 nm were located at two sides of a period of the current scan, as shown in Figure 2. After the frequency scan of DFB 2 for the absorption line of CH4 as shown in Figure 2b, the absorption line of NH3 in Figure 2c was recorded. Therefore, through one simultaneous scan of the wavelengths of the two DFB lasers, the PAS signals of NH3 and CH4 were obtained (as shown in Figure 2d) without using any optical switch or time delay device. The driving current signal of the excitation laser was composed of a sawtooth wave signal and a high-frequency sine signal, which were added and programmed in a LabVIEW-controlled data acquisition (DAQ) card (USB 6211, Austin, NI, USA). The sawtooth wave signal was utilized to scan the wavelength for covering the absorption peak, while the sine signal was used to modulate the lasers for the lock-in amplifier. To simplify the system structure, only one DAQ card was used to control the DFB lasers. Without any optical switch or time delay device, two gases were detected simultaneously. The sampling rate of DAQ was 50 kHz. A longer integration time of the lock-in amplifier was required to enlarge the SNR of the PA signals. Therefore, the scan frequency was 0.05 Hz. The modulation frequency of the sine signal was identical to the resonant frequency of the PA cell for amplifying the acoustic signal. A reference square with the same frequency of the sine signal was also generated by the DAQ card for the lock-in amplifier (7270DSP, AMETEK, Berwyn, IL, USA) to demodulate the PA signal. The modulation amplitude was 160 mV. Mass flow controllers (MFCs) were used to configure different concentrations of gases.
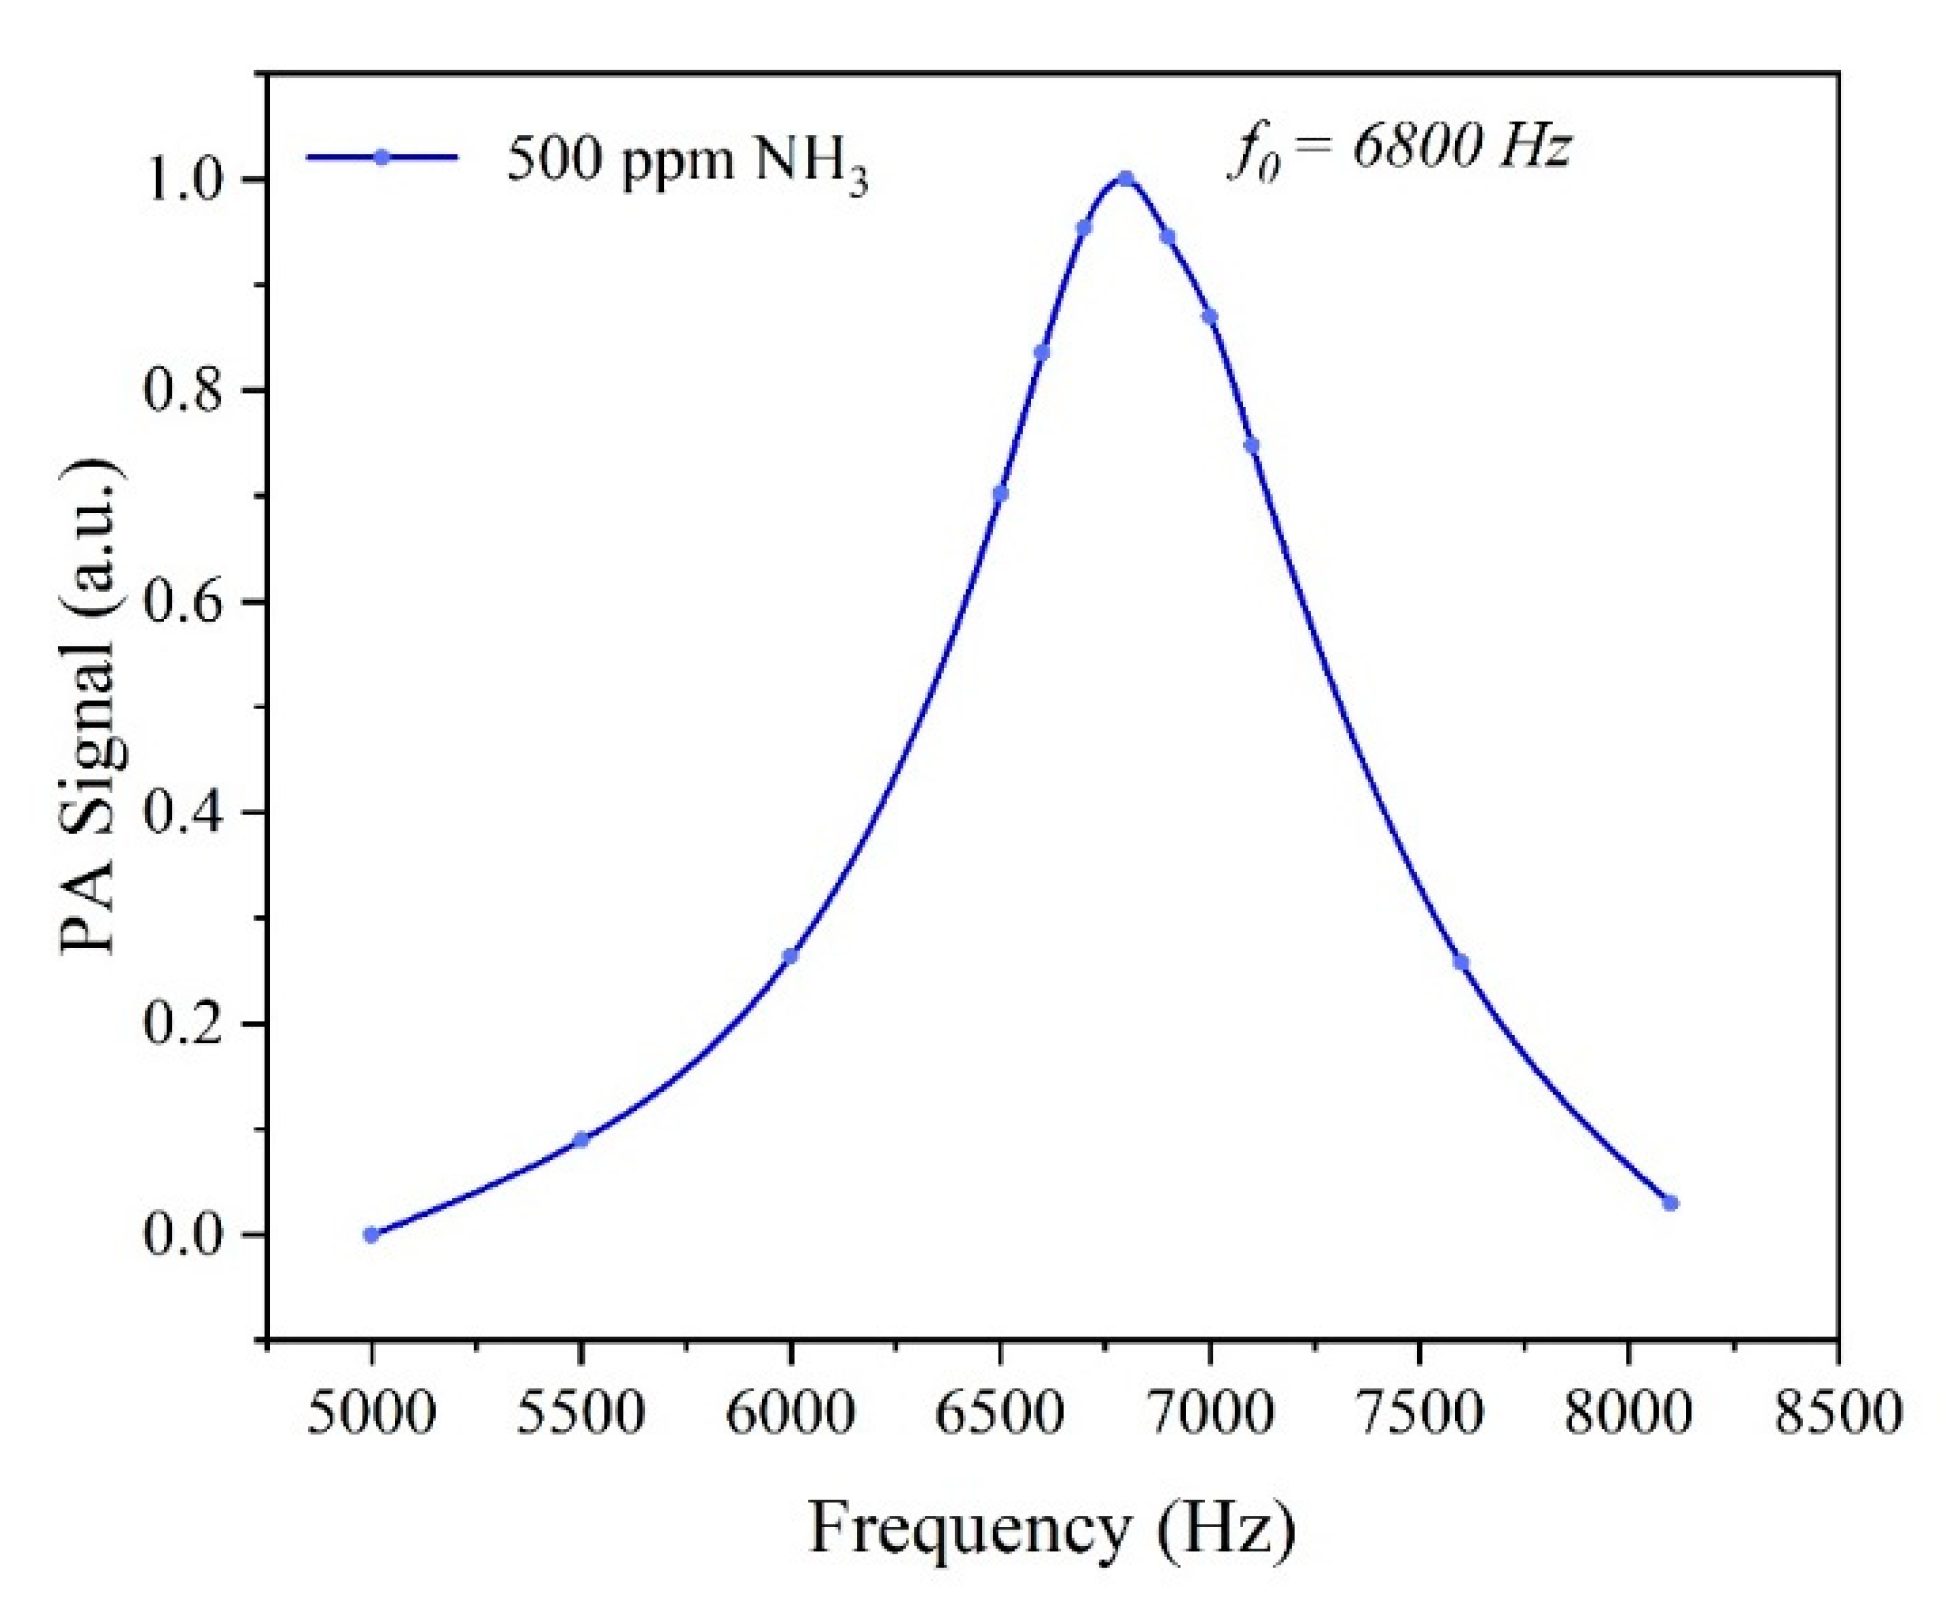
The PA cell consisted of a cylindrical resonator and two buffer volumes. The PA cell was made of stainless steel 304, without coatings. The resonant cylinder was used as an acoustic resonator with a first longitudinal acoustic resonant frequency of 6800 Hz. The two buffer volumes at each extreme side of the PA cell were able to minimize the noise resulting from sample flow [32]. The PA cell was sealed by two CaF2 windows with a high optical transmission of >90% from 180 nm to 8 µm. Eight electret microphones (FG-2332-P07, Knowles, Itasca, IL, USA) were placed in the middle of the acoustic resonator to detect the PA signal. PA signals from the eight microphones were first summed up and then filtered by a homemade noise-reduction band-pass filter. After pre-amplification, the PA signal was connected to the lock-in amplifier and sampled with an NI data acquisition card. A laptop was used to perform the data processing and display the results via LabVIEW software. The properties of the PA cell were reflected by measuring its first longitudinal resonance. Before the acquisition of PAS, it was imperative to confirm the value of the fundamental vibration frequency of the PA cell. A certified 500 ppm NH3/N2 gas mixture was used to select the best frequency. Figure 3 shows the normalized frequency response curves of the PA cell, indicating the first longitudinal resonance of the PA cell at the resonance frequency of . Hence, the modulation frequency of the sine signal was 6800 Hz.
2.3. Selection of Absorption Lines
Infrared bands including mid-infrared and near-infrared are commonly used for gas sensing. Near-infrared laser sources are more widely used in gas sensing due to their advantages of low cost and increased reliability and operation at room temperature compared with mid-infrared laser sources. However, trace gases in the mid-infrared spectrum have stronger absorption than those in the near-infrared band. DFB lasers emitting at 1512.24 and 1653.72 nm were selected in this compact PA instrument for measuring NH3 and CH4. For accurate NH3 and CH4 detection, potential spectral interference from other abundant atmospheric species (such as H2O and CO2) was also taken into account. Figure 4a shows the simulation of absorption of 400 ppm CO2, 20,000 ppm H2O, 10 ppm NH3 and 10 ppm CH4 around 1512 nm with a temperature of 300 K, air pressure of 1 atm and absorption path length of 100 cm. Figure 4b shows the simulation of absorption of 400 ppm CO2, 20,000 ppm H2O and 1 ppm CH4 around 1653 nm, where the absorbance of NH3 is zero. According to the HITRAN database, NH3 and CH4 have almost no interference with each other’s absorption in the tuning wavelength regions of the DFB lasers [33].
3. Results
3.1. Calibration of CH4 and NH3
The PA instrument’s response to different NH3 and CH4 concentrations was evaluated. CH4 and NH3 concentrations ranging from 20 to 500 ppm were generated by diluting a reference concentration of CH4 (100 ppm) and NH3 (500 ppm) with nitrogen for calibration. Amounts of 20–100 ppm CH4 were used for the calibration of CH4, and 100–500 ppm NH3 was used for the calibration of NH3.
For CH4 detection, the DFB laser was tuned to the center of the CH4 absorption line at approximately 1653.8 nm (120 mA, 20 °C). A sawtooth signal (20 s in period, 800 mV in amplitude) was used to carry out the DFB wavelength scan. A 6.8-kilohertz sinusoidal signal (160 mV in amplitude) was added with the sawtooth signal to modulate the light amplitude for generating the PA signal. The value of 800 mV for the sawtooth signal was chosen to ensure that the scanning wavelengths of the two lasers covered the absorption peaks of both gases. A sinusoidal signal of 160 mV was chosen by investigating the dependence of the PA signals on the amplitude of the sinusoidal signal, as shown in Figure 5a. Figure 5a shows that the PA signal improved little with a modulation amplitude ranging from 160 to 250 mV, and that laser lifetime can benefit from the low modulation amplitude of 160 mV. Figure 5b shows the first harmonic photoacoustic signal of 20, 40, 60, 80 and 100 ppm CH4 in nitrogen in the left region. Figure 6a shows the linear dependence of peak–peak PA signals on different CH4 concentrations with a regression coefficient R2 = 0.99.
Regarding the NH3 measurement, the DFB laser was tuned to the center of the NH3 absorption line at around 1511.7 nm (120 mA, 20 °C) with a sawtooth signal of 800 mV in amplitude and a modulation sine signal of 160 mV in amplitude. The first harmonic PA signal of NH3 at 500 ppm was recorded in the right region in Figure 5b. A good linear correlation of the peak–peak PA signals on different NH3 concentrations was obtained with R2 = 0.99, as shown in Figure 6b.
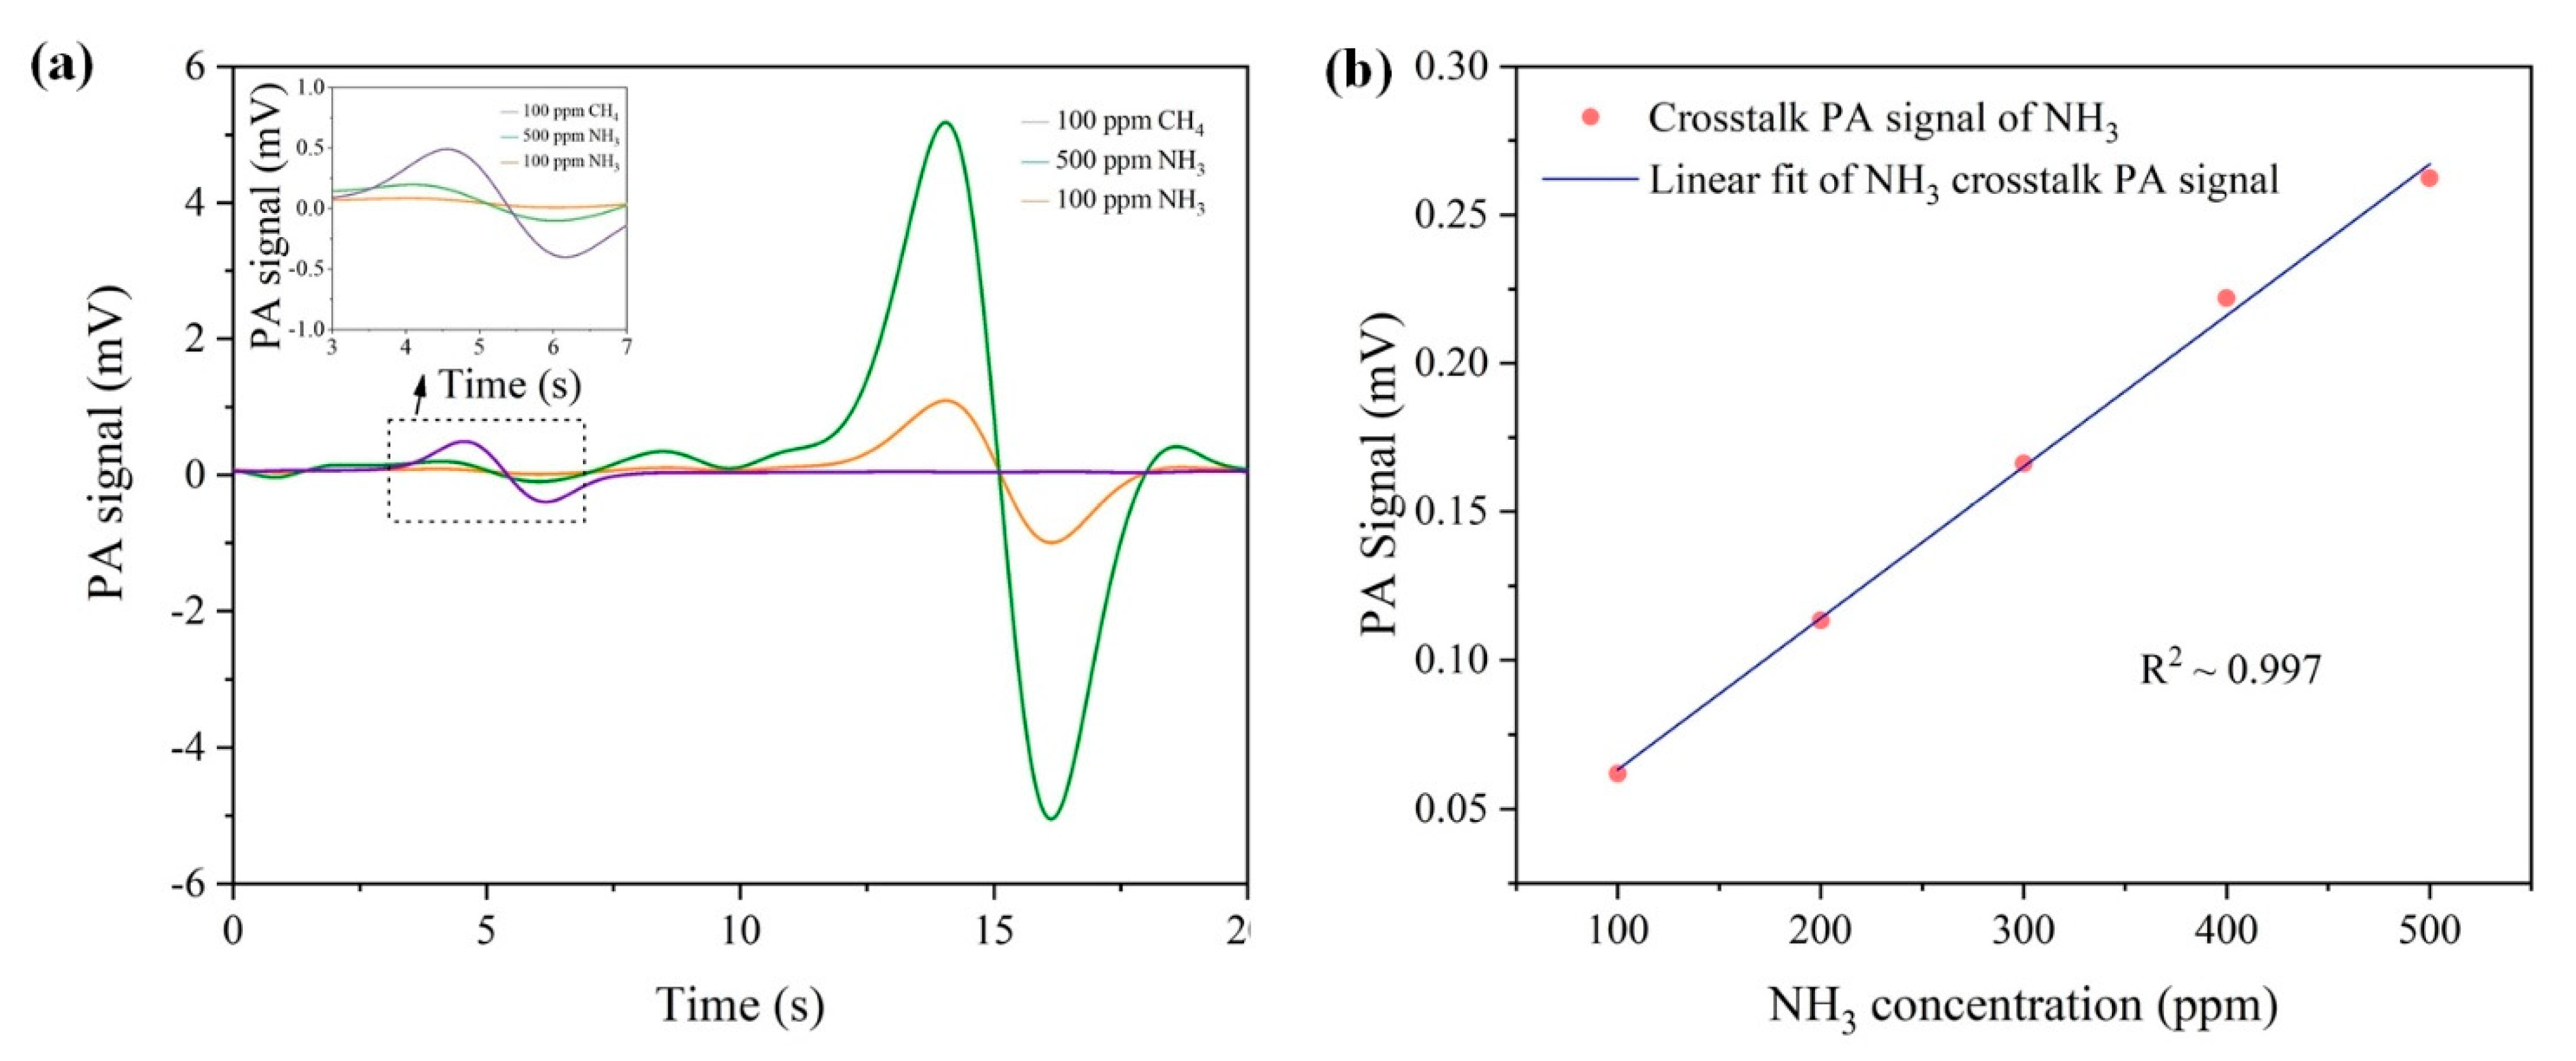
Figure 7a shows the two spectra of CH4 and NH3, which indicate that NH3 affected the measurement of CH4 in the first half of the PA spectrum. In contrast, methane had no influence on the NH3 signal. In order to eliminate this interference, the overlapped signal needed to be calibrated to obtain the average signal value of different NH3 concentrations. As shown in Figure 7b, the PA signals brought in by NH3 at different concentrations were plotted. The R-squared value obtained by linear fitting reached 0.997, which indicates that the interference signal is linearly related to the NH3 concentration. Therefore, by first demodulating the concentration of NH3, the interference signal that affects the CH4 PA signal was obtained by calculation, and this part of the methane signal was subtracted in order to accurately retrieve the CH4 concentration.
3.2. Simultaneous Measurement of CH4 and NH3
The performance of the PA instrument was evaluated for simultaneous measurement of CH4 and NH3, especially the potential interference from NH3 and CH4 on each other. The interference between NH3 and CH4 was observed through altering the concentrations of CH4 and NH3 that were controlled by MFCs. The input channel of the PA cell was composed of channels A and B, which always had identical flow rates, leading to a constant CH4 concentration in the PA cell. Meanwhile, channel B for NH3 was connected to two MFCs, which controlled the flow rates of channels 1 and 2 for NH3 and N2, respectively. The NH3 concentration in the PA cell could be altered by changing the flow rate in channels 1 and 2.
For investigating the interference of NH3 in CH4 measurement, a constant CH4 concentration of 50 ppm was generated with the same flow rate of 0.15 L/min in channels A and B. Different NH3 concentrations of 50, 100, 180 and 220 ppm were obtained by changing the flow rate in channels 2 and 3. Figure 8a shows the measured CH4 concentrations with different NH3 concentrations. The dashed line presents the fluctuation of the measured CH4 concentration without taking into account the interference of NH3, while the retrieved CH4 concentration remains constant after eliminating the NH3 interference as mentioned in Section 2.3.
Figure 8a shows the CH4 interference in the measurement of NH3 by recording the fluctuation of NH3 concentration through altering the CH4 concentration. As shown in Figure 8b, the measured NH3 concentration is constant across different CH4 concentrations, which shows that different CH4 concentrations cannot affect the measurement of NH3.
3.3. Instrument Performance: Allan Deviation, Accuracy, Precision and Uncertainty
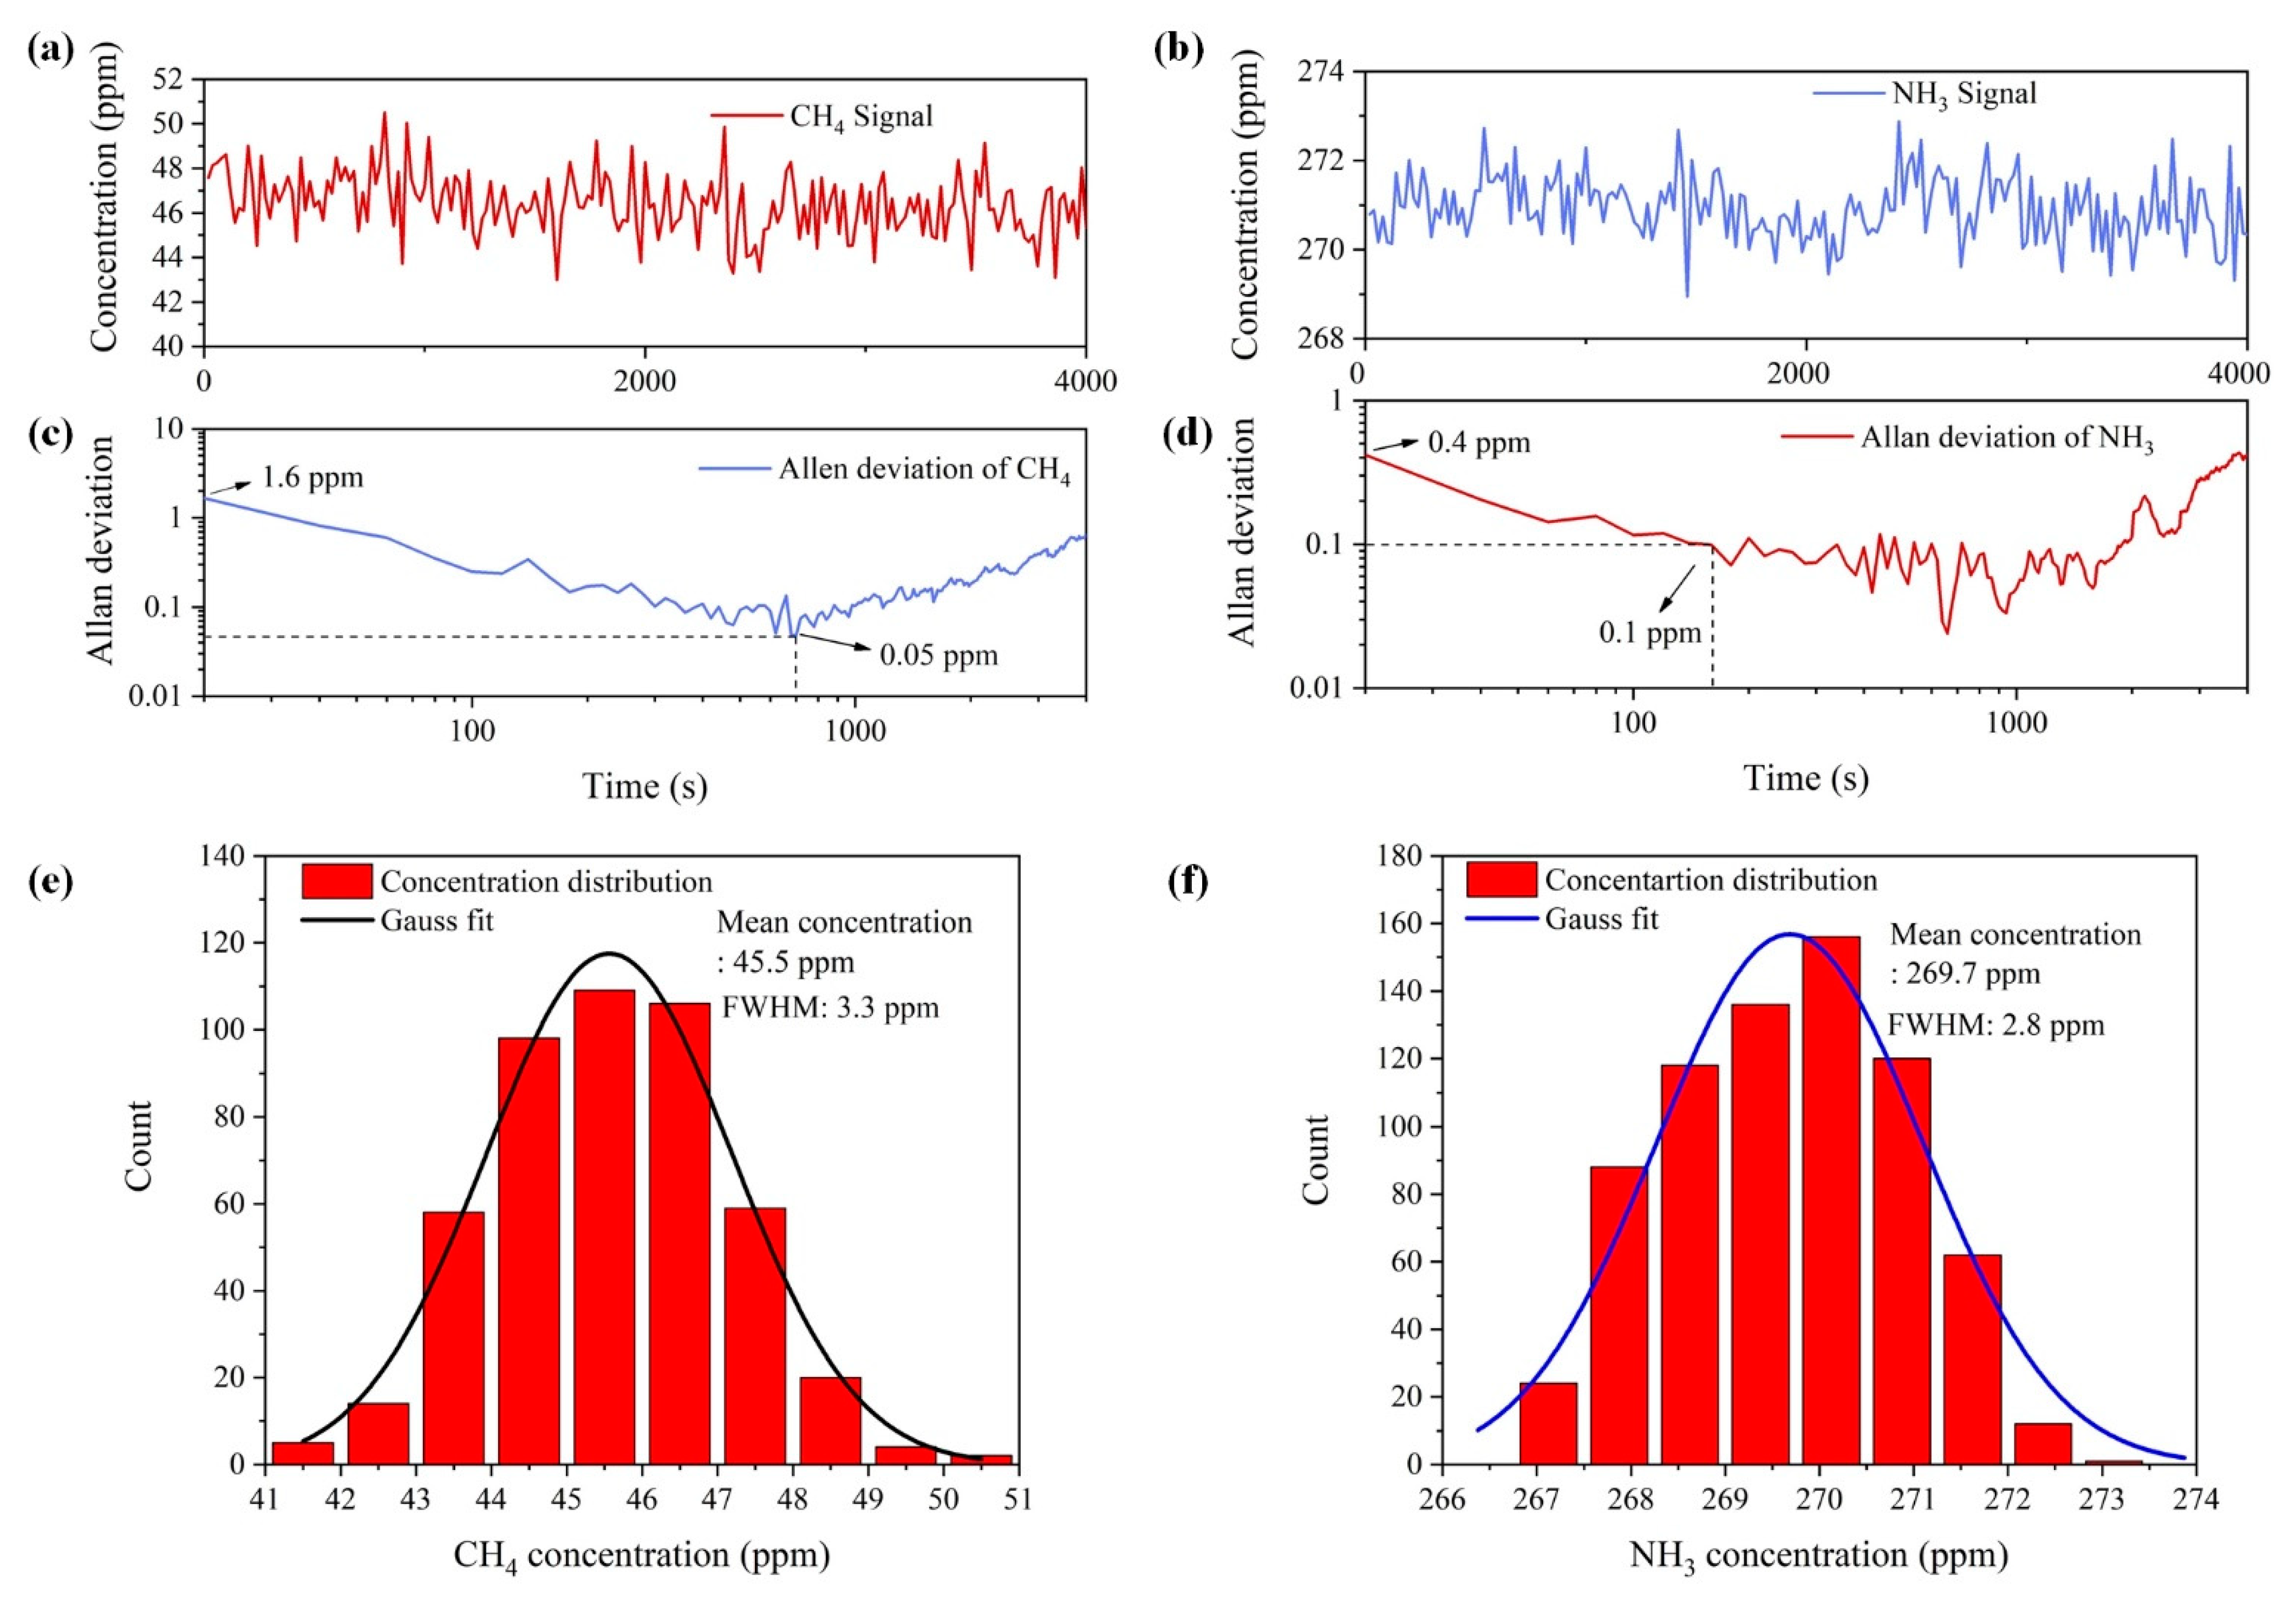
The Allan–Werle variance method was utilized to evaluate the long-term stability of the instrument with a constant concentration of 46 ppm of CH4 and 270 ppm of NH3 in the PAS cell. Figure 9a,b show the continuous measurement of CH4 and NH3 for 4000 s with a time interval of 20 s, respectively. Figure 9c,d plot the Allan deviation of the estimated concentration versus the average time, which indicates an optimum performance of the PAS instrument: minimum Allan deviations (0.05 ppm) are obtained with an optimum averaging time of 700 s for CH4 and 0.1 ppm with an integration time of 160 s for NH3.
Figure 9e,f show the distribution histogram of the retrieved CH4 and NH3 concentrations with a concentration of 46 ppm for CH4 and 270 ppm for NH3 in the PAS cell, accompanied with Gaussian profile fits. The value of the mean concentration of CH4 (Figure 9e) obtained was 45.5 ppm, which results in a measurement accuracy of 0.5 ppm, while the measurement precision was deduced to be 3.3 ppm (with an average time of 20 s) from the full width half maximum (FWHM) of the fitted Gaussian profile. For NH3 detection, a measurement accuracy of 0.3 ppm and a precision of 2.8 ppm were achieved from the mean concentration of 269.7 ppm and the FWHM of the fitted Gaussian profile in Figure 9f. The relative measurement uncertainty was determined by the ratio between the standard deviation and the mean value of concentration. Figure 9a shows that the standard deviation and the mean value of concentration for CH4 were 1.5 and 44.5 ppm, respectively. For the NH3 measurement in Figure 9b, the standard deviation and the mean value of concentration were 1.2 and 169.7 ppm, respectively. Thus, the relative measurement uncertainties of CH4 and NH3 were determined to be 3.3% (1.5 ppm/44.5 ppm) and 0.4% (1.2 ppm/169.7 ppm), respectively. The limit of detection (LoD) of the instrument was determined by the standard deviation of the background signal. By averaging five times of PAS signals, which indicates an integration time of 100 seconds, the standard deviations of background signals of NH3 and CH4 were found to be 0.3 and 0.1 ppm, respectively.
4. Conclusions
In this paper, we proposed a PAS-based dual-gas detection method, which combines two DFB lasers at different far wavelengths. By adjusting the current and temperature of the two DFB lasers, the absorption lines of NH3 and CH4 were recorded on the left and right halves of one periodic current scan. Since the generated acoustic waves are indistinguishable for the microphone due to the light absorption of different gases, the two gases can be distinguished by time discrimination. In this way, an identical current signal was used to control the two DFB lasers. The experiments showed that the linearity of methane and ammonia can both reach 0.999, and the detection limit can reach 0.3 and 0.1 ppm, respectively, in an integration time of 100 s. According to the American Conference of Industrial Hygienists, the maximum permissible exposure limit of NH3 is 25 ppm. Thus, the NH3 limit of detection (LoD) of 0.1 ppm for our PAS sensor is sufficient for this industrial application. The portable PAS instrument is suitable for detecting gas leakage in the chemical industry and environmental protection. In the case of a tight power budget, to avoid the 3dB loss of the power combiner for the two laser beams at 1512 and 1653 nm, the beam splitter shown in Figure 1 can be replaced with a WDM (wavelength division multiplexer) device [34].
Author Contributions
Y.J. and G.W. designed/modified the experimental setup. Y.J. and T.Z. performed the experiments and analyzed the data. T.Z. wrote the software. Y.J. and G.W. wrote the manuscript. S.H. supervised the work and finalized the manuscript. All authors have read and agreed to the published version of the manuscript.
Funding
This research was funded by the Key Research and Development Program of Zhejiang Province (grant number 2021C03178), NingboTech University (grant number 1141257B20200538), the Ningbo Science and Technology Plan Project-Key Core Technology Emergency Tackling Plan Project(2020G012), the Zhejiang University NGICS Platform and the National Natural Science Foundation of China (11621101).
Institutional Review Board Statement
Not applicable.
Informed Consent Statement
Not applicable.
Data Availability Statement
The data underlying the results presented in this paper are not publicly available at this time but may be obtained from the authors upon reasonable request.
Acknowledgments
The authors are grateful to Xiang Chen, Zhanpeng Xu, Fangmei Li and Lihui Wang for valuable discussion and help.
Conflicts of Interest
The authors declare no conflict of interest.
References
- Cao, Y.; Sanchez, N.P.; Jiang, W.; Griffin, R.J.; Xie, F.; Hughes, L.C.; Zah, C.-E.; Tittel, F.K. Simultaneous atmospheric nitrous oxide, methane and water vapor detection with a single continuous wave quantum cascade laser. Opt. Express 2015, 23, 2121–2132. [Google Scholar] [CrossRef] [PubMed] [Green Version]
- He, S.; Xu, Z.; Jiang, Y.; Ji, J.; Forsberg, E.; Li, Y. Classification, identification and growth stage estimation of microalgae based on transmission hyperspectral microscopic imaging and machine learning. Opt. Express 2020, 28, 30686–30700. [Google Scholar] [CrossRef]
- Chen, K.; Liu, S.; Zhang, B.; Gong, Z.; Chen, Y.; Zhang, M.; Deng, H.; Guo, M.; Ma, F.; Zhu, F.; et al. Highly sensitive photoacoustic multi-gas analyzer combined with mid-infrared broadband source and near-infrared laser. Opt. Lasers Eng. 2020, 124, 105844. [Google Scholar] [CrossRef]
- Hanf, S.; Keiner, R.; Yan, D.; Popp, J.; Frosch, T. Fiber-enhanced raman multigas spectroscopy: A versatile tool for environmental gas sensing and breath analysis. Anal. Chem. 2014, 86, 5278–5285. [Google Scholar] [CrossRef] [PubMed]
- Xu, Z.; Jiang, Y.; He, S. Multi-mode microscopic hyperspectral imager for the sensing of biological samples. Appl. Sci. 2020, 10, 4876. [Google Scholar] [CrossRef]
- Selvaraj, R.; Vasa, N.J.; Nagendra, S.M.S.; Sm, S.N. Off-resonance photoacoustic spectroscopy technique for multi-gas sensing in biogas plants. Anal. Chem. 2019, 91, 14239–14246. [Google Scholar] [CrossRef]
- Besson, J.-P.; Schilt, S.; Thévenaz, L. Sub-ppm multi-gas photoacoustic sensor. Spectrochim. Acta Part A Mol. Biomol. Spectrosc. 2006, 63, 899–904. [Google Scholar] [CrossRef] [Green Version]
- Wang, G.; Kulinski, P.; Hubert, P.; Deguine, A.; Petitprez, D.; Crumeyrolle, S.; Fertein, E.; Deboudt, K.; Flament, P.; Sigrist, M.W.; et al. Filter-free light absorption measurement of volcanic ashes and ambient particulate matter using multi-wavelength photoacoustic spectroscopy. Prog. Electromagn. Res. 2019, 166, 59–74. [Google Scholar] [CrossRef] [Green Version]
- Dong, L.; Tittel, F.K.; Li, C.; Sanchez, N.P.; Wu, H.; Zheng, C.; Yu, Y.; Sampaolo, A.; Griffin, R.J. Compact TDLAS based sensor design using interband cascade lasers for mid-IR trace gas sensing. Opt. Express 2016, 24, A528–A535. [Google Scholar] [CrossRef]
- Köhring, M.; Huang, S.; Jahjah, M.; Jiang, W.; Ren, W.; Willer, U.; Caneba, C.; Yang, L.; Nagrath, D.; Schade, W.; et al. QCL-based TDLAS sensor for detection of NO toward emission measurements from ovarian cancer cells. Appl. Phys. A 2014, 117, 445–451. [Google Scholar] [CrossRef]
- Zhang, T.; Lou, X.; Xu, L.; He, S. Elemental mercury sensing by synchronously sweeping two multimode diode lasers. Appl. Opt. 2020, 59, 3360–3368. [Google Scholar] [CrossRef]
- Lin, H.; Lou, X.; Zhong, W.; He, S. Continuous monitoring of elemental mercury employing low-cost multimode diode lasers. Meas. Sci. Technol. 2015, 26, 085501. [Google Scholar] [CrossRef]
- Lin, H.; Gao, F.; Ding, Y.; Yan, C.; He, S. Methane detection using scattering material as the gas cell. Appl. Opt. 2016, 55, 8030. [Google Scholar] [CrossRef] [PubMed]
- Yao, X.; Li, S.; He, S. Dual-mode hyperspectral bio-imager with a conjugated camera for quick object-selection and focusing. Prog. Electromagn. Res. 2020, 168, 133–143. [Google Scholar] [CrossRef]
- Barbero, A.; Blouzon, C.; Savarino, J.; Caillon, N.; Dommergue, A.; Grilli, R. A compact incoherent broadband cavity-enhanced absorption spectrometer for trace detection of nitrogen oxides, iodine oxide and glyoxal at levels below parts per billion for field applications. Atmos. Meas. Tech. 2020, 13, 4317–4331. [Google Scholar] [CrossRef]
- Wu, T.; Zha, Q.; Chen, W.; Xu, Z.; Wang, T.; He, X. Development and deployment of a cavity enhanced UV-LED spectrometer for measurements of atmospheric HONO and NO2 in Hong Kong. Atmos. Environ. 2014, 95, 544–551. [Google Scholar] [CrossRef]
- Bayrakli, I. Tunable double-mode sensor for multi-gas detection based on the external-cavity diode laser. Appl. Opt. 2018, 57, 4039–4042. [Google Scholar] [CrossRef]
- Ye, W.; Li, C.; Zheng, C.; Sanchez, N.P.; Gluszek, A.K.; Hudzikowski, A.J.; Dong, L.; Griffin, R.J.; Tittel, F.K. Mid-infrared dual-gas sensor for simultaneous detection of methane and ethane using a single continuous-wave interband cascade laser. Opt. Express 2016, 24, 16973–16985. [Google Scholar] [CrossRef] [PubMed]
- Yu, Y.; Sanchez, N.P.; Griffin, R.J.; Tittel, F.K. CW EC-QCL-based sensor for simultaneous detection of H2O, HDO, N2O and CH4 using multi-pass absorption spectroscopy. Opt. Express 2016, 24, 10391–10401. [Google Scholar] [CrossRef] [PubMed] [Green Version]
- Jiang, J.; Wang, Z.; Han, X.; Zhang, C.; Ma, G.; Li, C.; Luo, Y. Multi-gas detection in power transformer oil based on tunable diode laser absorption spectrum. IEEE Trans. Dielectr. Electr. Insul. 2019, 26, 153–161. [Google Scholar] [CrossRef]
- Wu, H.; Yin, X.; Dong, L.; Pei, K.; Sampaolo, A.; Patimisco, P.; Zheng, H.; Ma, W.; Zhang, L.; Yin, W.; et al. Simultaneous dual-gas QEPAS detection based on a fundamental and overtone combined vibration of quartz tuning fork. Appl. Phys. Lett. 2017, 110, 121104. [Google Scholar] [CrossRef] [Green Version]
- Ma, H.; Sun, M.; Zhan, S.; Zhang, Q.; Zha, S.; Wang, G.; Liu, K.; Yi, M.; Cao, Z. Compact dual-gas sensor for simultaneous measurement of atmospheric methane, and water vapor using a 3.38 μm antimonide-distributed feedback laser diode. Spectrochim. Acta Part A Mol. Biomol. Spectrosc. 2020, 226, 117605. [Google Scholar] [CrossRef] [PubMed]
- Zheng, H.; Lin, H.; Dong, L.; Huang, Z.; Gu, X.; Tang, J.; Dong, L.; Zhu, W.; Yu, J.; Chen, Z. Quartz-enhanced photothermal-acoustic spectroscopy for trace gas analysis. Appl. Sci. 2019, 9, 4021. [Google Scholar] [CrossRef] [Green Version]
- Li, J.; Yu, B.; Zhao, W.; Chen, W. A review of signal enhancement and noise reduction techniques for tunable diode laser absorption spectroscopy. Appl. Spectrosc. Rev. 2014, 49, 666–691. [Google Scholar] [CrossRef]
- Besson, J.-P.; Schilt, S.; Thévenaz, L. Multi-gas sensing based on photoacoustic spectroscopy using tunable laser diodes. Spectrochim. Acta Part A Mol. Biomol. Spectrosc. 2004, 60, 3449–3456. [Google Scholar] [CrossRef]
- Choi, H.; Yeom, J.-Y.; Ryu, J.-M. Development of a multiwavelength visible-range-supported opto–ultrasound instrument using a light-emitting diode and ultrasound transducer. Sensors 2018, 18, 3324. [Google Scholar] [CrossRef] [PubMed] [Green Version]
- Pitre, L.; Sparasci, F.; Truong, D.; Guillou, A.; Risegari, L.; Himbert, M.E. Measurement of the boltzmann constant kB using a quasi-spherical acoustic resonator. Int. J. Thermophys. 2011, 32, 1825–1886. [Google Scholar] [CrossRef] [Green Version]
- Koskinen, V.; Fonsen, J.; Roth, K.; Kauppinen, J. Progress in cantilever enhanced photoacoustic spectroscopy. Vib. Spectrosc. 2008, 48, 16–21. [Google Scholar] [CrossRef]
- Schilt, S.; Tevenaz, L. Wavelength Modulation Photoacoustic Spectroscopy: Theoretical Description and Experimental Results. Infrared Phys. Technol. 2006, 48, 154–162. [Google Scholar] [CrossRef]
- Wang, Z.L.; Tian, C.W.; Liu, Q.; Chang, J.; Zhang, Q.D.; Zhu, C.G. Wavelength Modulation Technique-Based Photoacoustic Spectroscopy for Multipoint Gas Sensing. Appl. Opt. 2018, 57, 2909–2914. [Google Scholar] [CrossRef]
- Yin, X.K.; Dong, L.; Wu, H.P.; Zheng, H.D.; Ma, W.G.; Zhang, L.; Yin, W.B.; Jia, S.T. Sub-Ppb Nitrogen Dioxide Detection with a Large Linear Dynamic Range by Use of a Differential Photoacoustic Cell and a 3.5 W Blue Multimode Diode Laser. Sens. Actuator B Chem. 2017, 247, 329–335. [Google Scholar] [CrossRef] [Green Version]
- Pan, Y.; Dong, L.; Yin, X.; Wu, H. Compact and highly sensitive NO2 photoacoustic sensor for environmental monitoring. Molecules 2020, 25, 1201. [Google Scholar] [CrossRef] [PubMed] [Green Version]
- Gordon, I.E.; Rothman, L.S.; Hill, C.; Kochanov, R.V.; Tan, Y.; Bernath, P.F.; Birk, M.; Boudon, V.; Campargue, A.; Chance, K.V.; et al. The Hitran2016 Molecular Spectroscopic Database. J. Quant. Spectrosc. Radiat. Transf. 2017, 203, 3–69. [Google Scholar] [CrossRef]
- He, S.; Liu, K. On the possibility of a perfect power combiner. Prog. Electromagn. Res. 2017, 158, 1–6. [Google Scholar] [CrossRef] [Green Version]
Figure 1.
Schematic of the PA instrument. FC: fiber collimator. BS: beam splitter. CW1, CW2: CaF2 window. DFB: distributed feedback laser diode. Mic: electret microphone. DAQ card: data acquisition card.
Figure 1.
Schematic of the PA instrument. FC: fiber collimator. BS: beam splitter. CW1, CW2: CaF2 window. DFB: distributed feedback laser diode. Mic: electret microphone. DAQ card: data acquisition card.
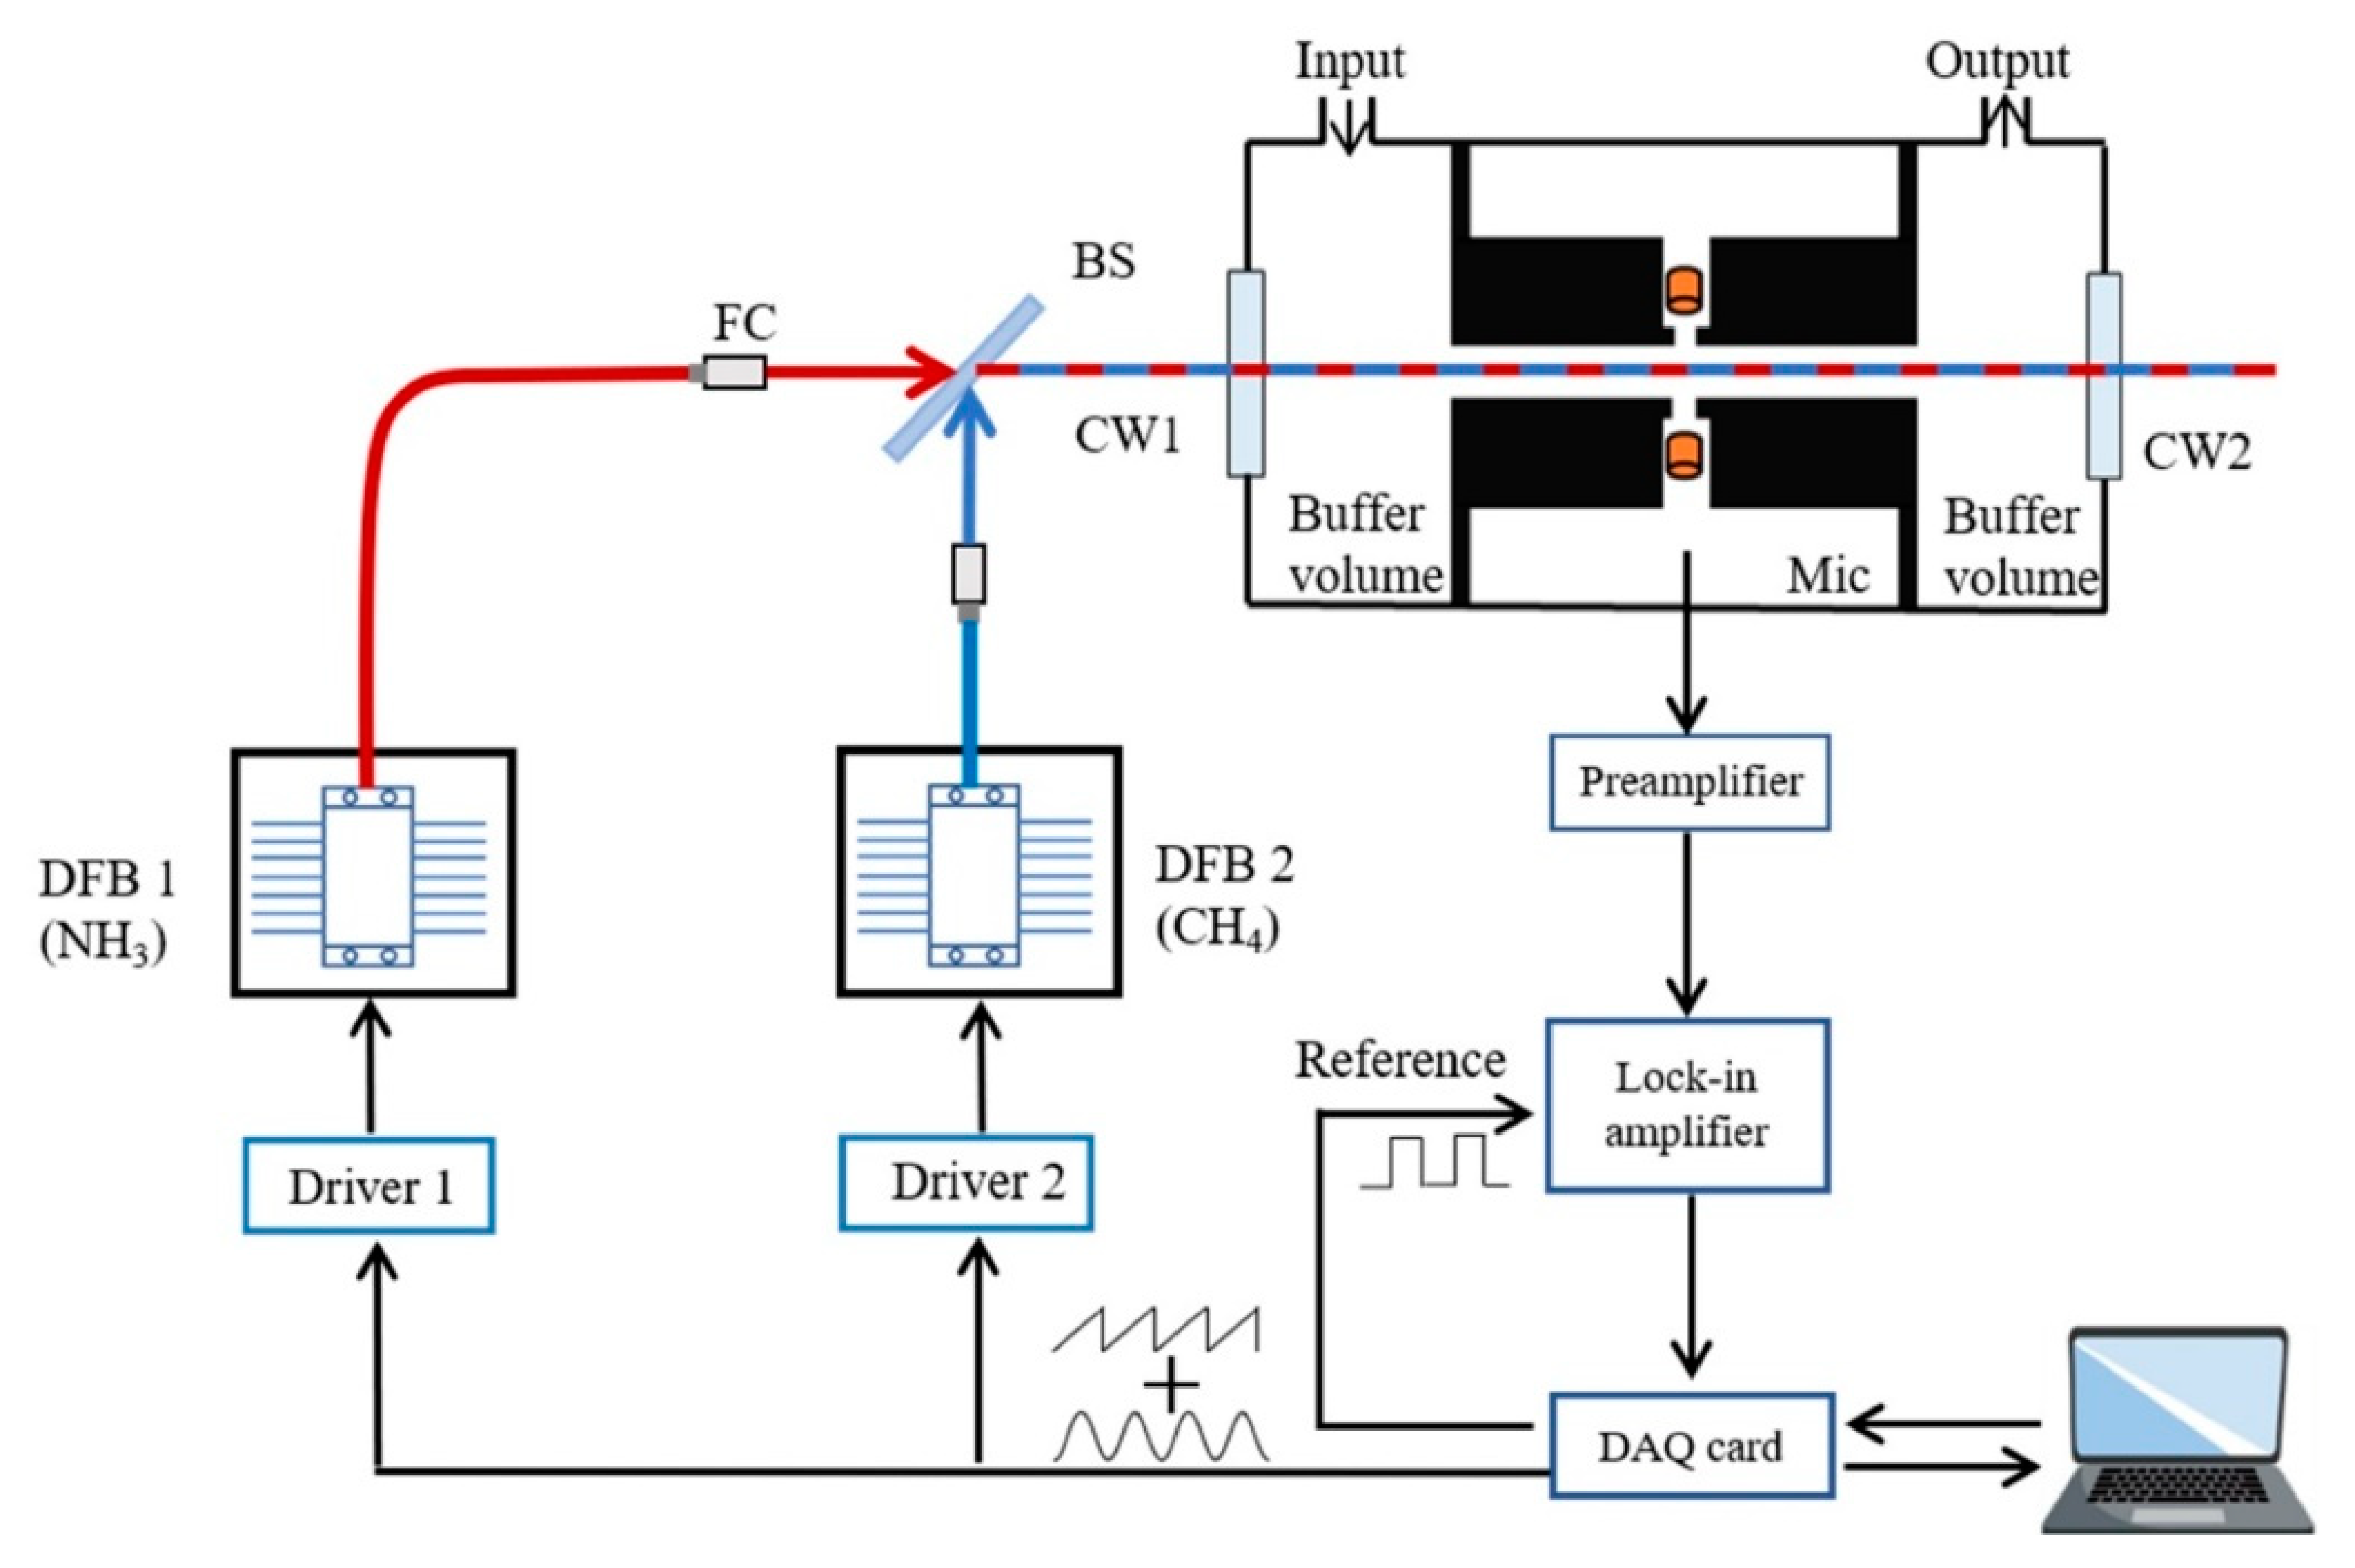
Figure 2.
(a) Plot of the relationships of time and wavelength of lasers during one frequency scan. (b) First harmonic signal of 100 ppm NH3 during one frequency scan. (c) First harmonic signal of 80 ppm CH4 during one frequency scan. (d) Simultaneous recording of the PAS of 60 ppm CH4 and 50 ppm NH3. All measurements were taken at room temperature (around 300 K) and one standard atmosphere (atm).
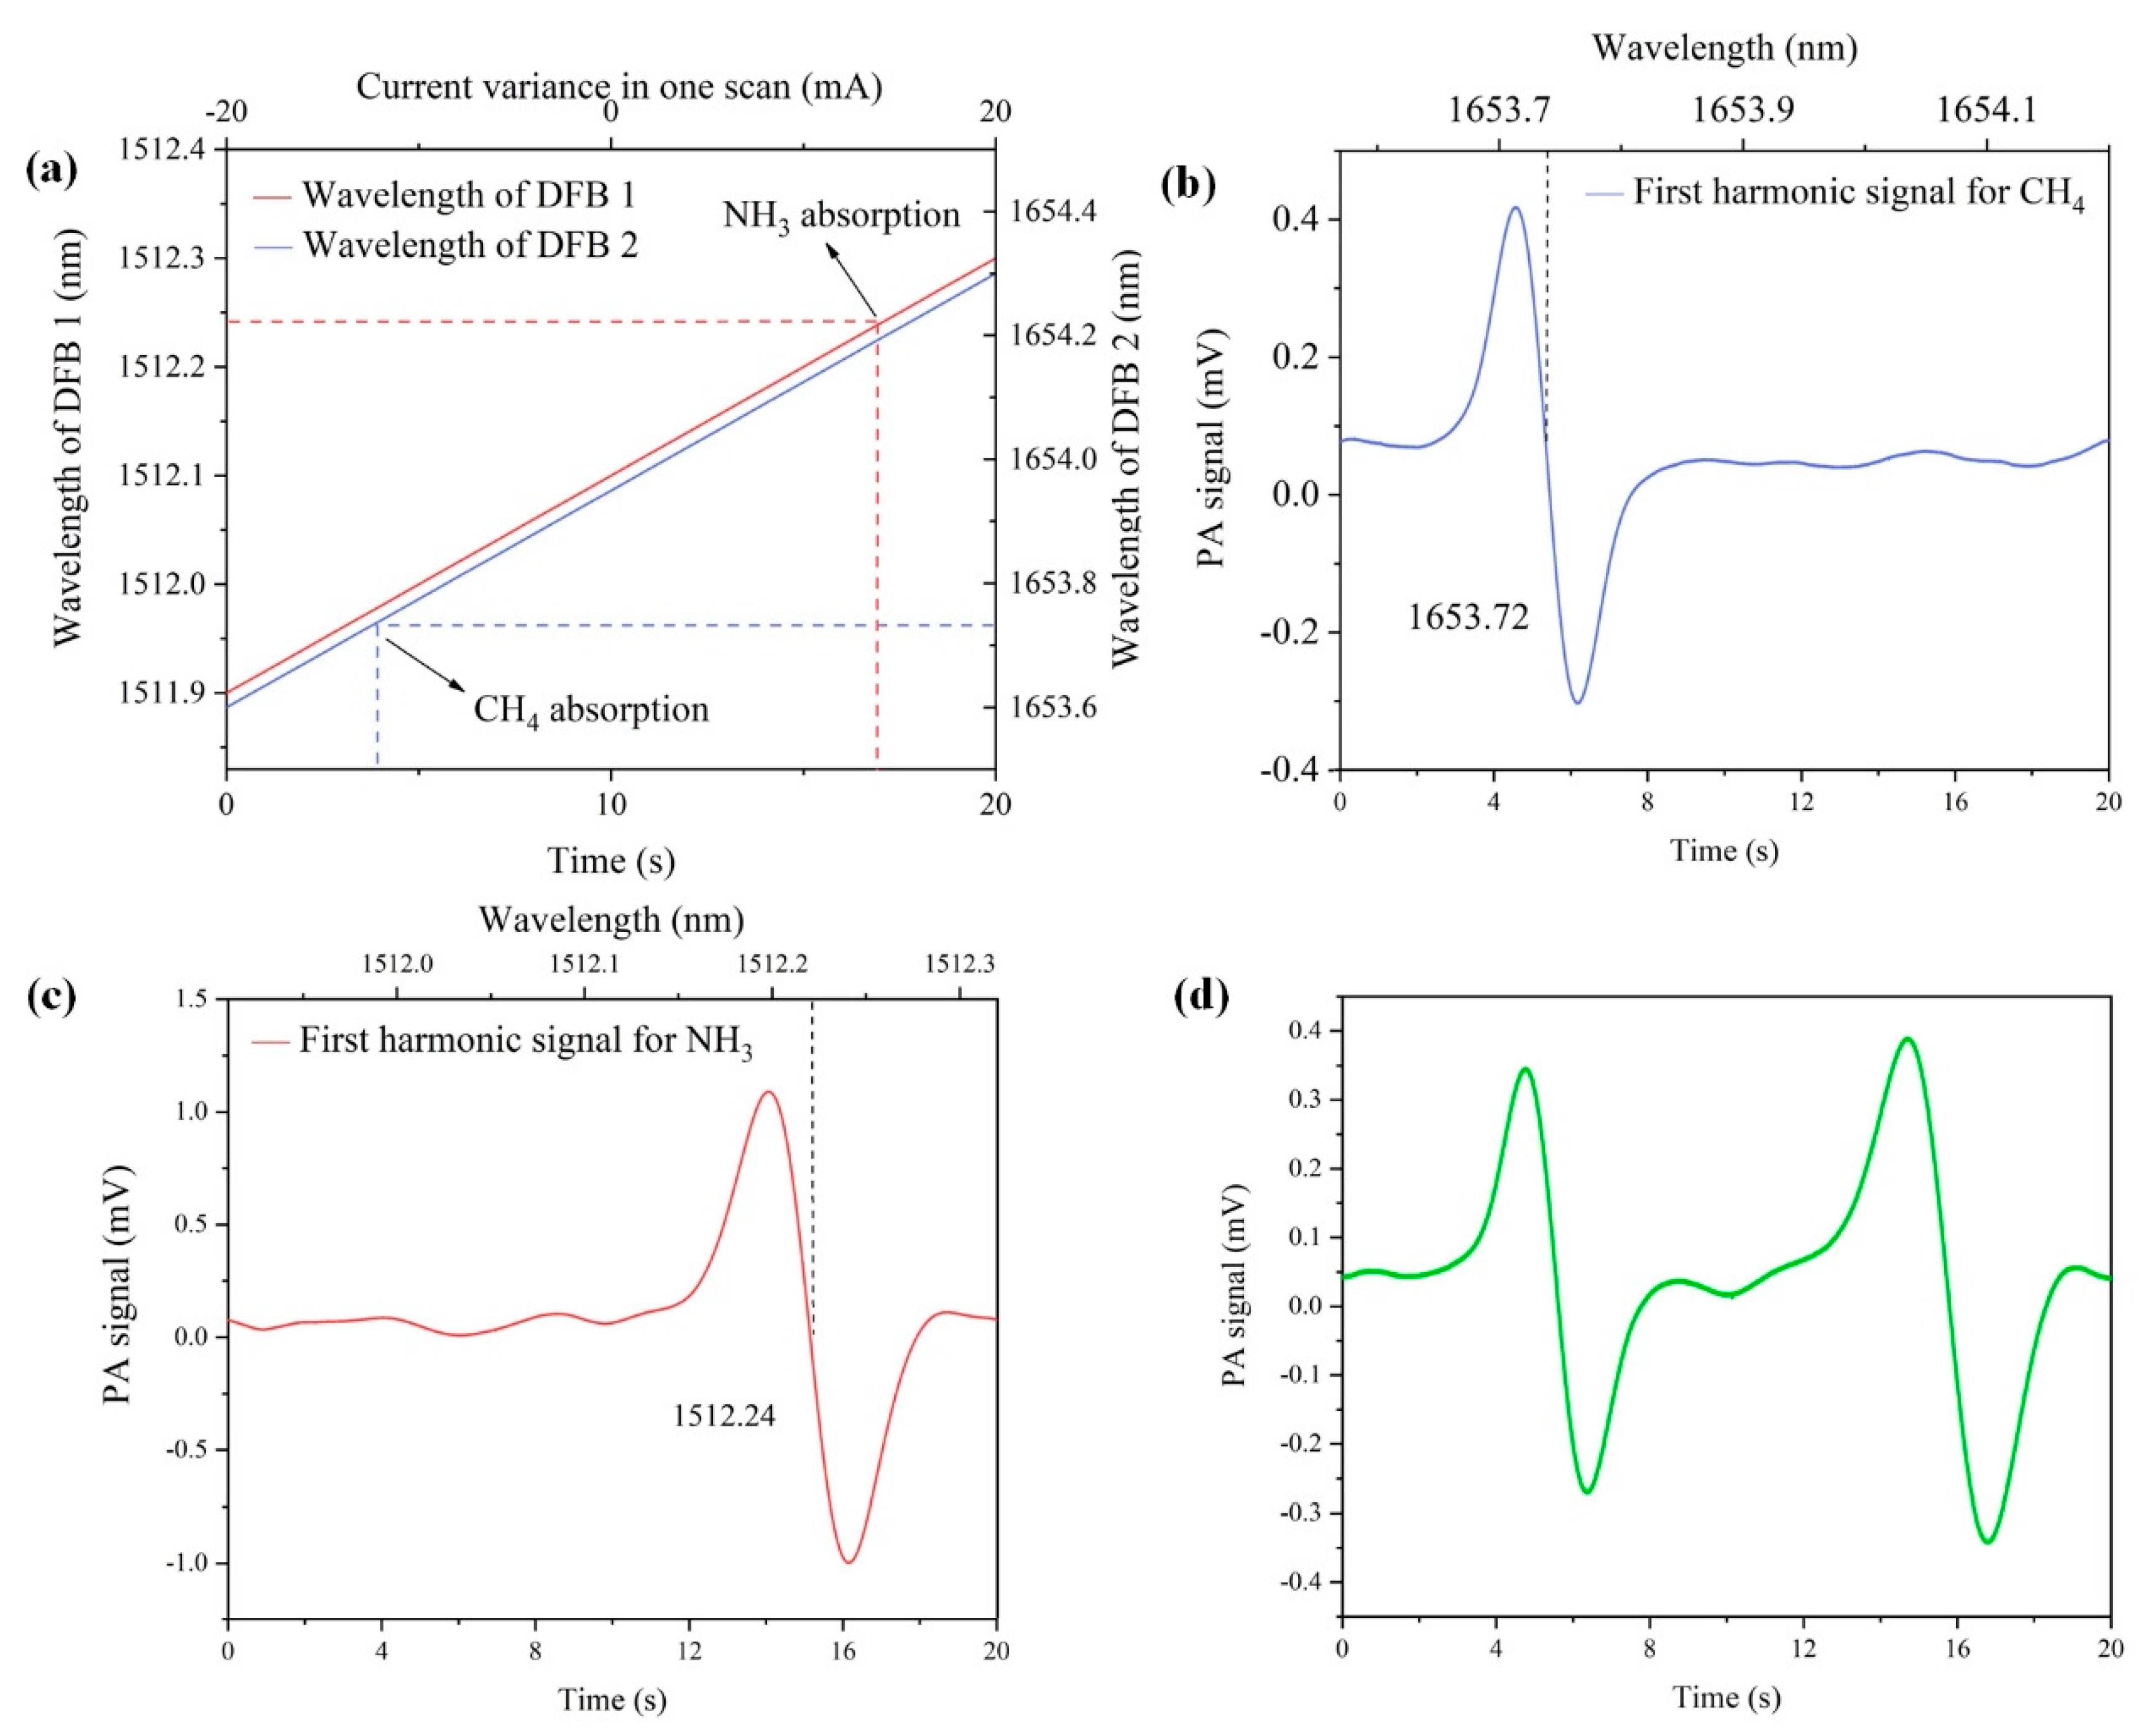
Figure 3.
Frequency response curves of the PA cell with the first longitudinal resonance.
Figure 4.
(a) Simulated absorption lines of NH3 and CH4 around 1512 nm. (b) Simulated absorption lines of CH4 around 1653 nm.
Figure 4.
(a) Simulated absorption lines of NH3 and CH4 around 1512 nm. (b) Simulated absorption lines of CH4 around 1653 nm.
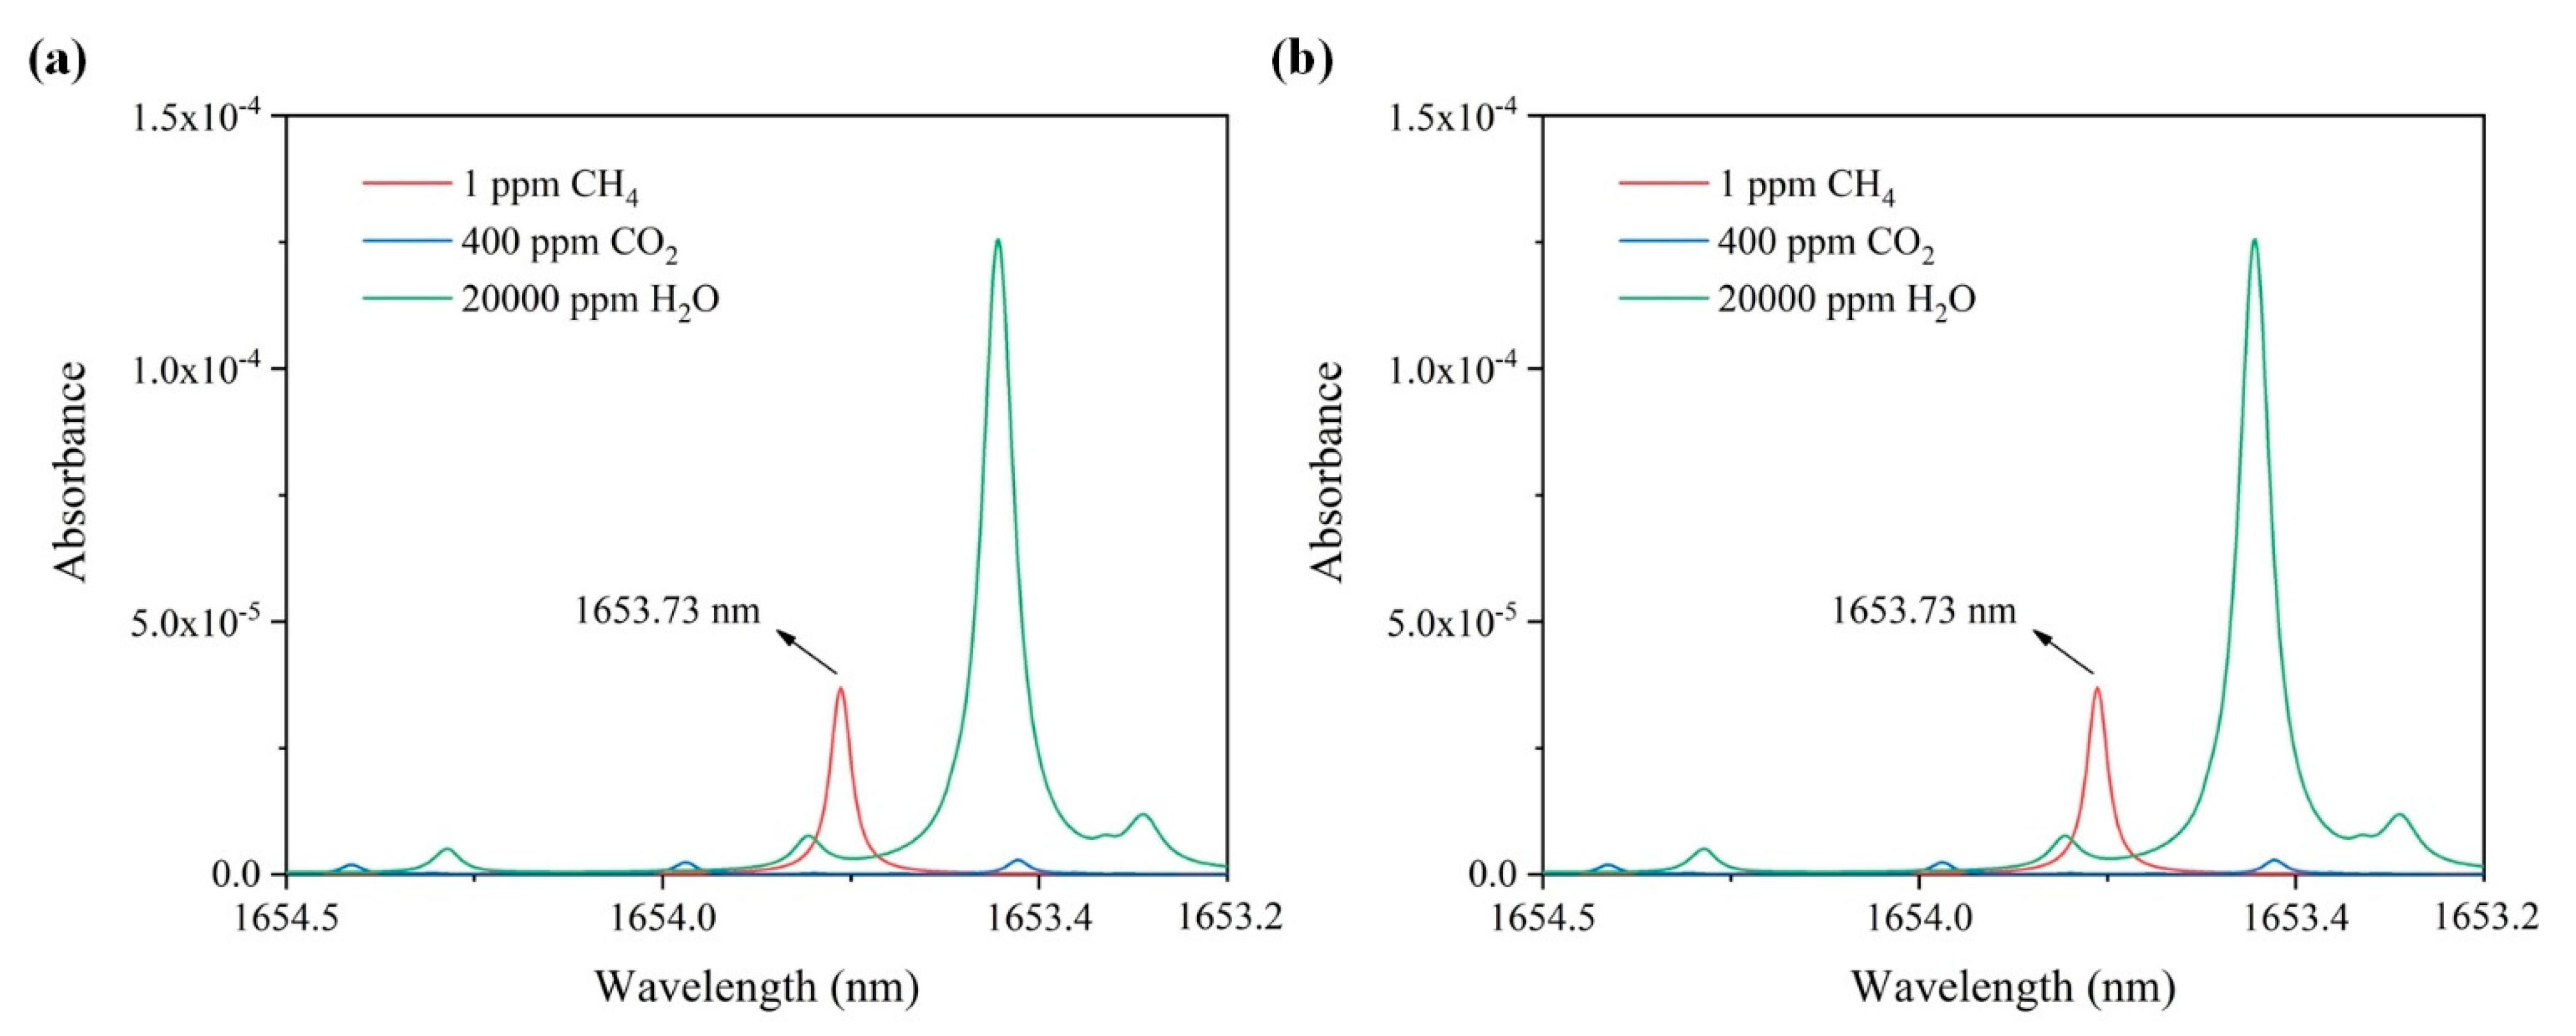
Figure 5.
(a) PA signals of different amplitudes of the sinusoidal signal. (b) First harmonic PA signals of CH4 concentrations varying from 20 to 100 ppm in the left region and NH3 concentrations varying from 100 to 500 ppm in the right region.
Figure 5.
(a) PA signals of different amplitudes of the sinusoidal signal. (b) First harmonic PA signals of CH4 concentrations varying from 20 to 100 ppm in the left region and NH3 concentrations varying from 100 to 500 ppm in the right region.

Figure 6.
Calibration of CH4 and NH3: (a) Response linearity of CH4 at different concentrations. (b) Response linearity of NH3 at different concentrations.
Figure 6.
Calibration of CH4 and NH3: (a) Response linearity of CH4 at different concentrations. (b) Response linearity of NH3 at different concentrations.
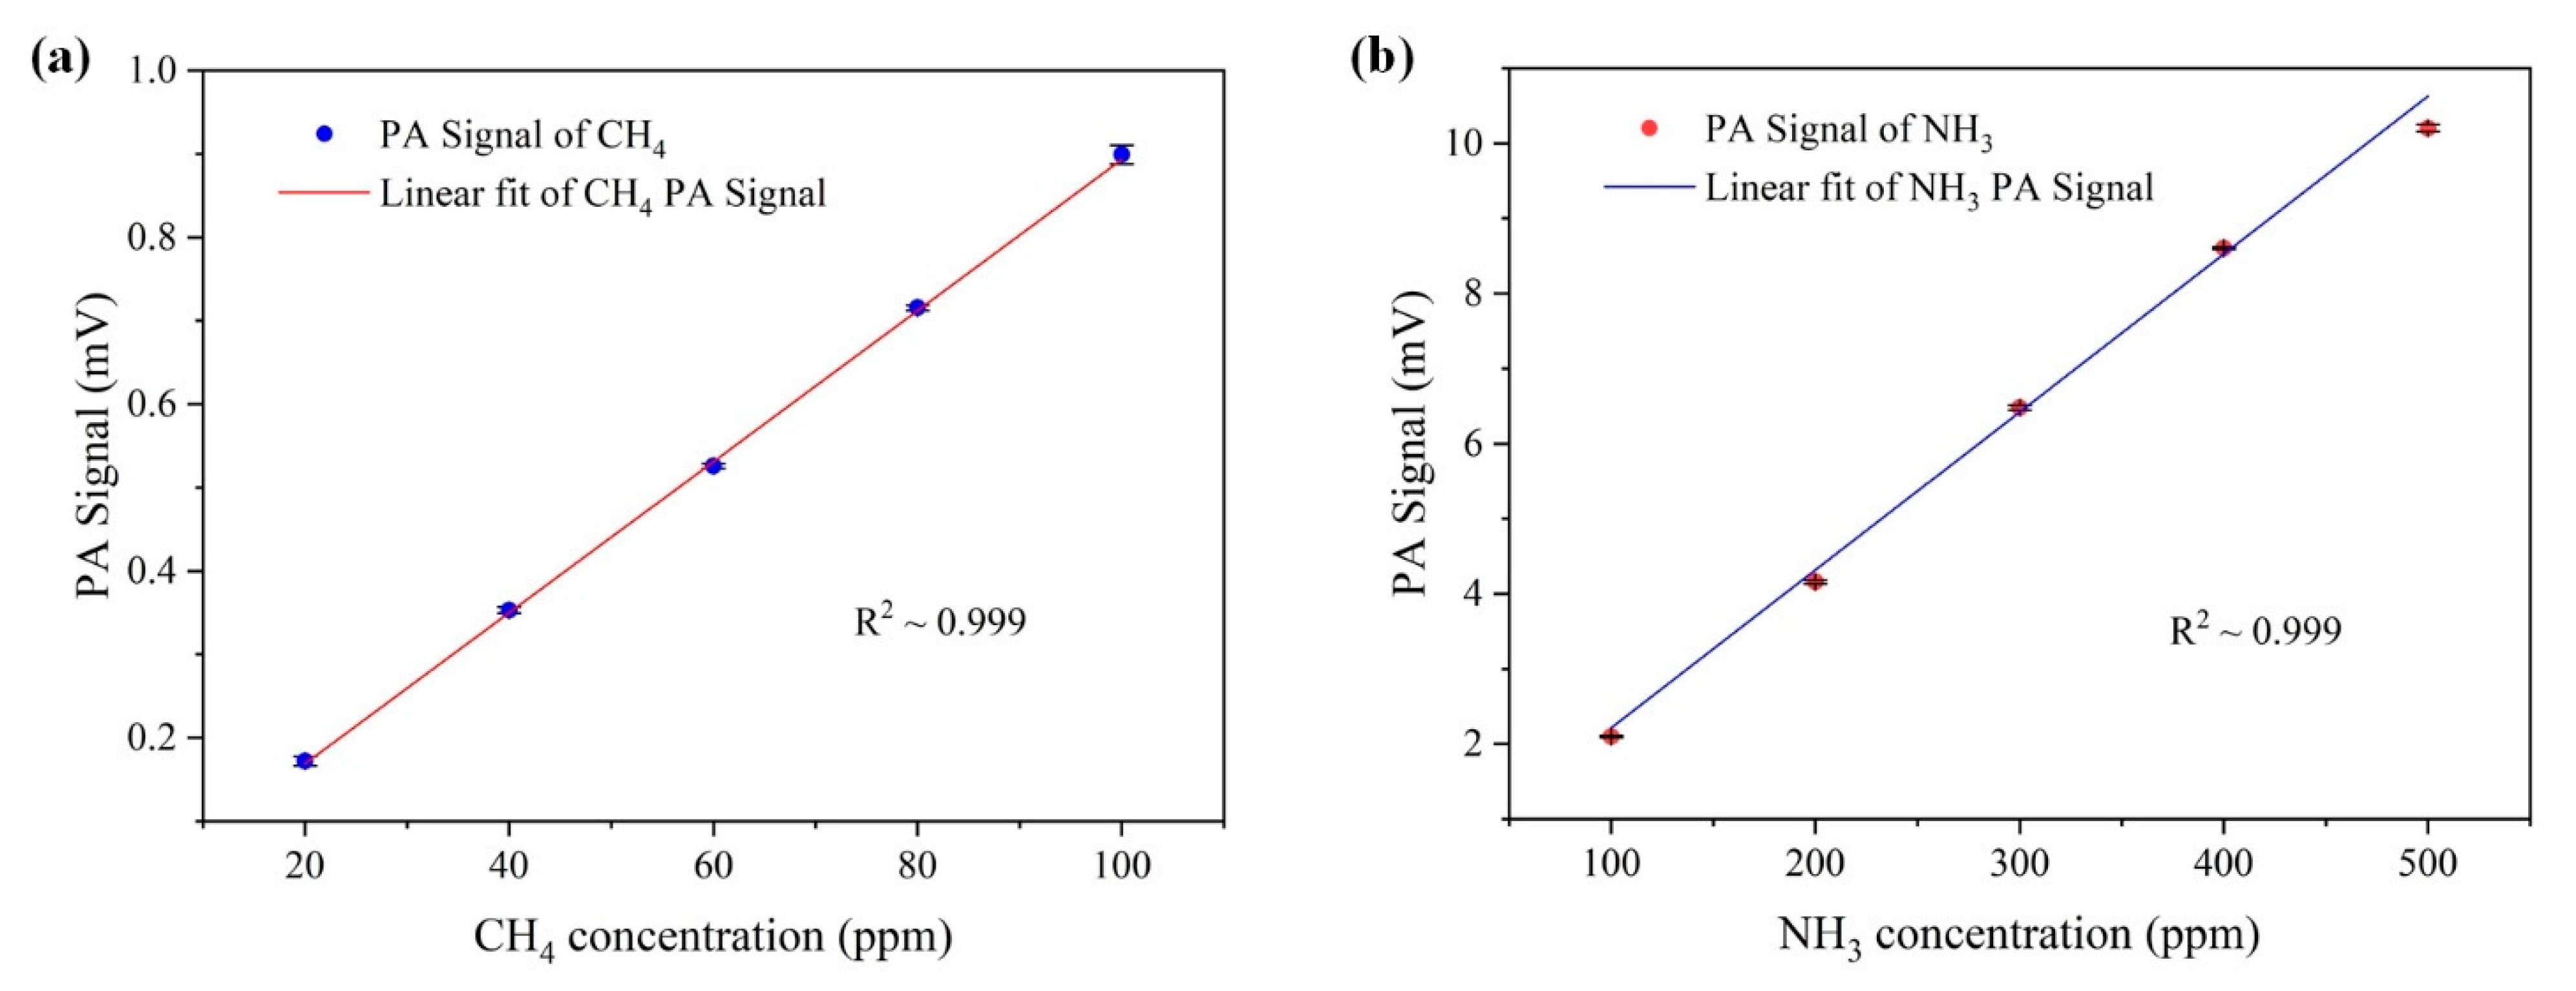
Figure 7.
(a) Combination of NH3 and CH4 PAS under one scan cycle of DFB laser diodes. The purple line is 100 ppm CH4 without NH3 detected by DFB 2, while the green line and yellow line mark the PA spectrum of NH3 without CH4 detected by DFB 1. (b) Response linearity of the crosstalk signal induced by NH3 at different concentrations.
Figure 8.
Simultaneous measurement: (a) Plot of fluctuating concentration of NH3 while CH4 remains constant. The dashed blue line is obtained without eliminating the crosstalk of NH3. The blue line is obtained after elimination. (b) Plot of fluctuating concentration of CH4 while NH3 stays constant.
Figure 8.
Simultaneous measurement: (a) Plot of fluctuating concentration of NH3 while CH4 remains constant. The dashed blue line is obtained without eliminating the crosstalk of NH3. The blue line is obtained after elimination. (b) Plot of fluctuating concentration of CH4 while NH3 stays constant.
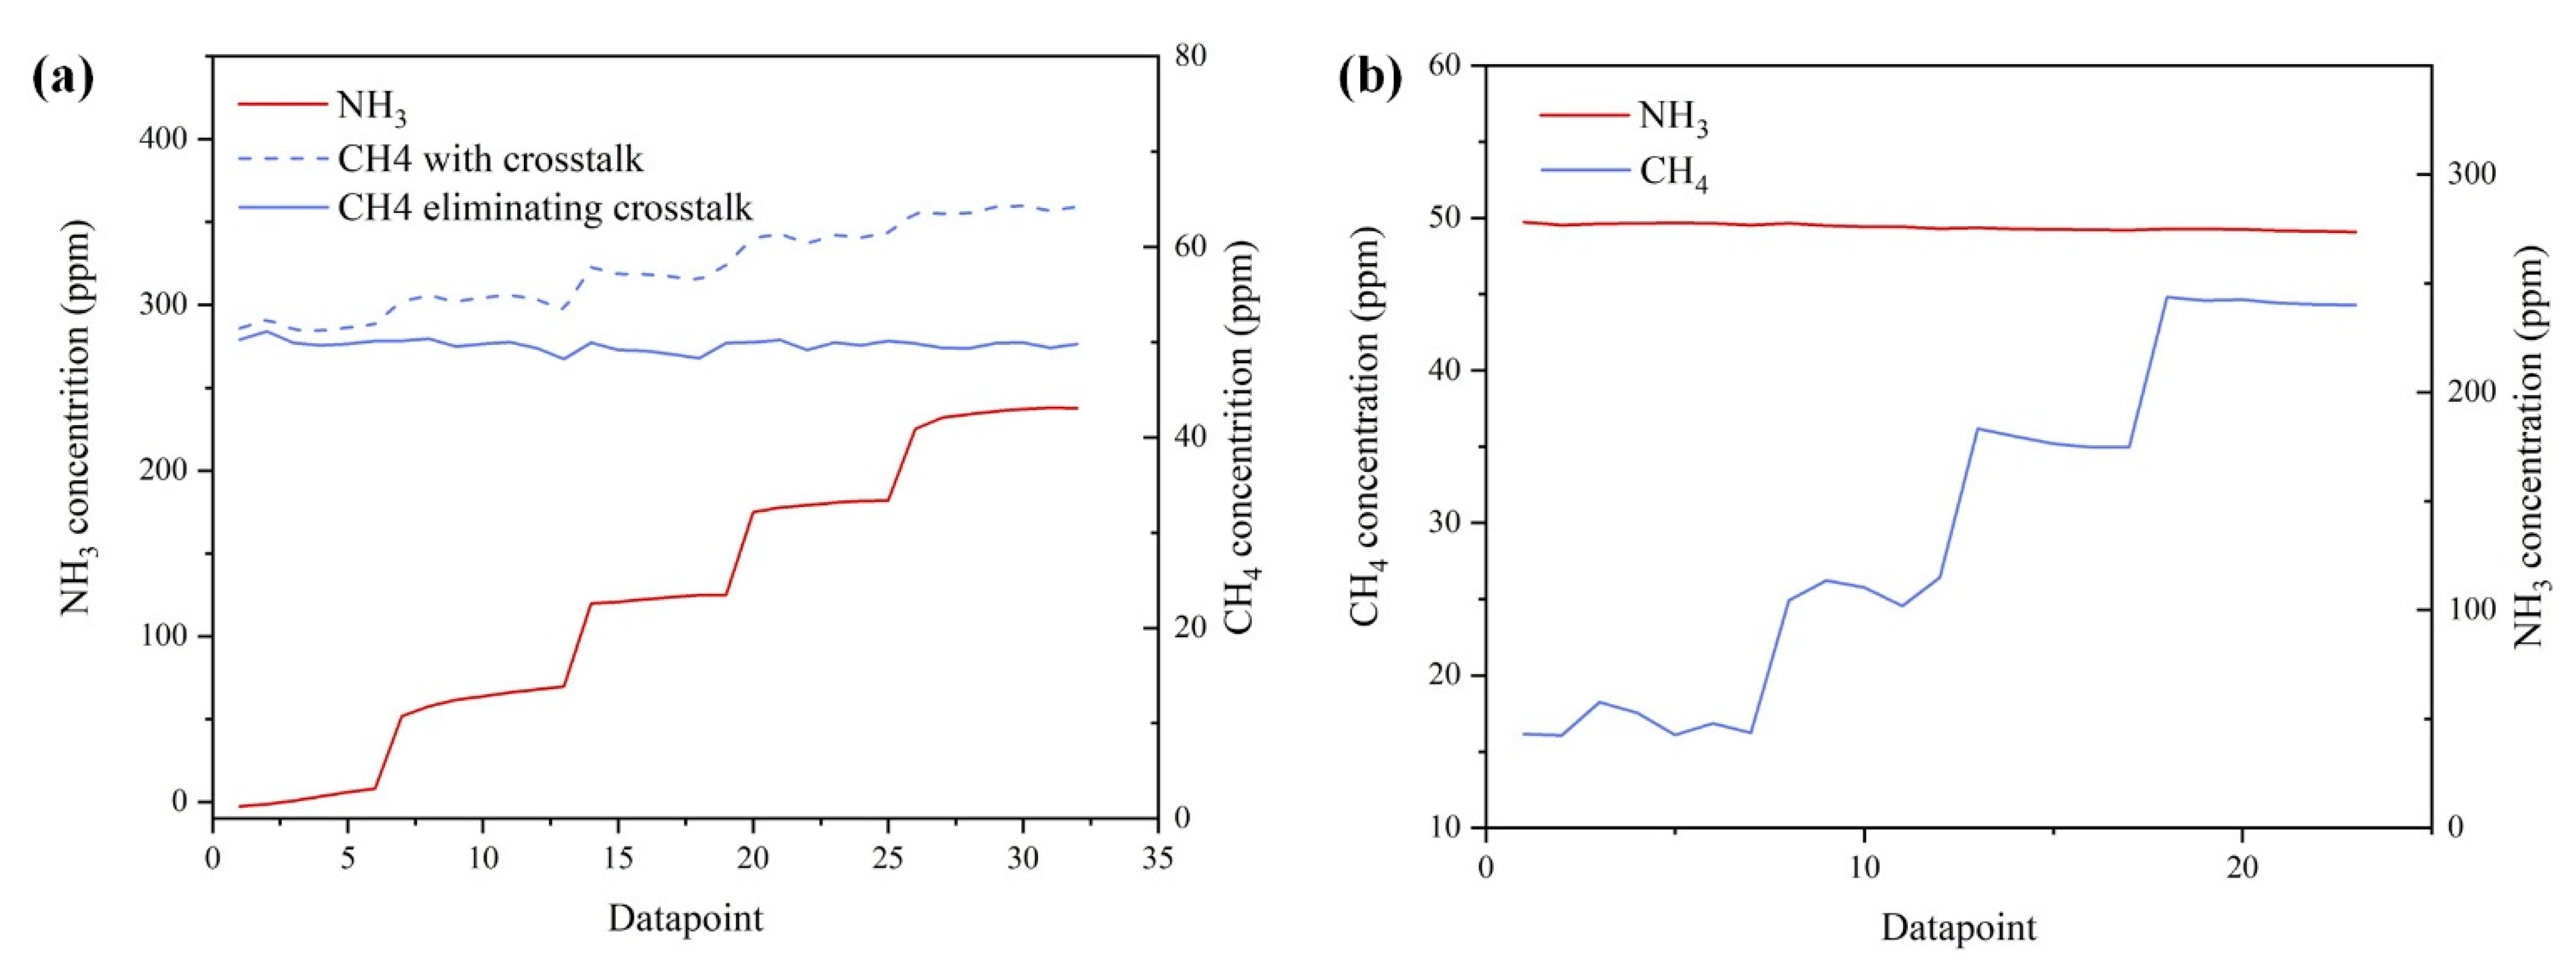
Figure 9.
(a) Continuous measurement of CH4 for 4000 s. (b) Continuous measurement of NH3 for 4000 s. (c) Allan deviation plots of CH4 as a function of integration time. (d) Allan deviation plots of NH3 as a function of integration time. (e) Concentration distribution of the retrieved CH4 with a concentration of 46 ppm with Gaussian profile fit. (f) Concentration distribution of the retrieved NH3 with a concentration of 270 ppm with Gaussian profile fit.
Publisher’s Note: MDPI stays neutral with regard to jurisdictional claims in published maps and institutional affiliations. |
© 2021 by the authors. Licensee MDPI, Basel, Switzerland. This article is an open access article distributed under the terms and conditions of the Creative Commons Attribution (CC BY) license (https://creativecommons.org/licenses/by/4.0/).
Share and Cite
MDPI and ACS Style
Jiang, Y.; Zhang, T.; Wang, G.; He, S. A Dual-Gas Sensor Using Photoacoustic Spectroscopy Based on a Single Acoustic Resonator. Appl. Sci. 2021, 11, 5224. https://doi.org/10.3390/app11115224
AMA Style
Jiang Y, Zhang T, Wang G, He S. A Dual-Gas Sensor Using Photoacoustic Spectroscopy Based on a Single Acoustic Resonator. Applied Sciences. 2021; 11(11):5224. https://doi.org/10.3390/app11115224
Chicago/Turabian StyleJiang, Yiming, Tie Zhang, Gaoxuan Wang, and Sailing He. 2021. "A Dual-Gas Sensor Using Photoacoustic Spectroscopy Based on a Single Acoustic Resonator" Applied Sciences 11, no. 11: 5224. https://doi.org/10.3390/app11115224
Note that from the first issue of 2016, this journal uses article numbers instead of page numbers. See further details here.