
Investigating the Micro/Macro-Texture Performance of Roller-Compacted Concrete Pavement under Simulated Traffic Abrasion


1
Department of Civil Engineering, Shahid Rajaee Teacher Training University, Tehran 16785-163, Iran
2
Department of Structural, Geotechnical and Building Engineering, Politecnico di Torino, 10129 Turin, Italy
*
Authors to whom correspondence should be addressed.
Appl. Sci. 2021, 11(12), 5704; https://doi.org/10.3390/app11125704
Submission received: 22 May 2021
/
Revised: 13 June 2021
/
Accepted: 16 June 2021
/
Published: 19 June 2021
(This article belongs to the Collection Nondestructive Testing (NDT))
Abstract
:Since the roller-compacted concrete pavement (RCCP) is almost smooth due to roller vibrations in the construction process, the lack of macro-texture prevents it from being used as a final surface. This study has made efforts to improve the RCCP by proposing different scenarios to create new micro-/macro-texture surfaces and investigate their durability and skid resistance under traffic abrasion conditions. To prepare the micro-texture, eight RCCP specimens were cast using various 50–50% mixing proportions, and each of them alone in the form of siliceous and calcareous fine aggregates (natural and manufactured). For the macro-texture, each specimen was textured using such methods as seeding (three cases), stamping (two cases), and brooming (two cases). Since the durable texture should withstand the abrasive traffic flow, the RCCP-surface abrasion resistance was measured by the simulation method proposed in ASTM C944, and their skid resistance was evaluated by measuring the British pendulum test according to ASTM E303 before and after abrasion. The results showed that abrasion resistance of RCCP samples to changes in mixing design and skid resistance to changes in macro-texture have significant changes. In addition, different siliceous-calcareous sand combinations not only made the concrete mix more economical but also improved its performance in case of abrasion and skid resistance. The more was the manufactured sand proportion, the higher the fracture rate was and, hence, the abrasion resistance. Different macro-textures created on RCCP specimens generally showed acceptable skid resistance. In this regard, stamping had the highest mean texture depth (MTD) as well as BPN, and seeding had the lowest.
1. Introduction
The roller-compacted concrete pavement (RCCP) is more cost-effective than the conventional type (PCC) due to its construction simplicity and less expensive than the asphalt pavement. However, the main problem preventing it from being extensively used as pavement in direct contact with traffic, especially in high-speed roads, is frictional (and sometimes low abrasion) resistance due to the lack of proper and durable texture. Rollers smooth the RCCP surface, omit the macro-texture, and increase the hydroplaning and accident potential. However, for a satisfactory riding quality, the pavement surface should maintain its proper texture and skid resistance which, according to ACI, is affected by both the concrete micro-texture (provided by the fine aggregate type/hardness) and the macro-texture (formed on freshly placed or cut in hardened concrete [1]). Macro-textures provide mechanical resistance against skidding, while micro ones highly affect the frictional resistance against the vehicle tires [2]; both are essential for safe driving on concrete pavements.
The texture of the concrete pavement surface should not only provide adequate friction, especially in wet conditions but also minimize the tire-pavement interaction noise. This surface can have longitudinally oriented texture (e.g., longitudinal tining, brooming, grooving, turf drag, diamond grinding, and NGCS), transversely oriented textures (e.g., transverse tining, brooming, and grooving), or textures with no particular orientation (e.g., porous concrete and exposed aggregate finishes) [3].
When experiencing severe rubbing action from vehicles’ wheels, concrete pavements need to maintain adequate texture to have a high skid resistance for proper vehicular control [3]. For a rigid pavement, this resistance is the capacity to resist the rubbing-/cutting-/sliding [4,5]. Factors affecting it for the rigid pavement micro-texture are the concrete compressive strength, aggregate type/properties, cement content, W/C ratio, and curing conditions [6,7,8,9,10,11,12], and those affecting that of the surface macro-texture are shape, depth, density per unit pavement surface area, and direction [13,14].
The micro-texture abrasion resistance is generally related to the concrete compressive strength, hardness, and type of fine aggregates; harder aggregates resist wear better than softer ones [15]. To provide proper skid resistance on pavements, at least 25% by mass of fine aggregates should be siliceous [16]. Sadegzadeh et al. studied the relationship between the concrete surface microstructure and abrasion resistance and showed that the latter depends largely on the surface zone pore structure and microhardness [17]. The strength at any point of the transition zone depends on the volume and size of the existing voids, and siliceous aggregates and limestone can reduce this size when calcium silicate and carboaluminate hydrates are formed, respectively [18]. Many studies have reported that adding low amounts of high siliceous additives such as silica fume, fly ash, and so on can improve the concrete compressive strength and abrasion resistance [4,6,19,20]. The CCAA (Cement Concrete & Aggregates Australia) research has shown that the abrasion resistance depends on the compressive strength but is independent of the sand used [21]. Beixing et al. showed that increasing the limestone micro-fines from 4.3% to 20% by mass of the manufactured sand would improve the abrasion resistance. They concluded that the latter is improved in the PCC (Portland cement concrete) when the surface roughness is increased and the crushing value and Los Angeles abrasion value of sand particles are reduced; they did not find any evident relation regarding the siliceous content of sand [22]. As regards the abrasion resistance [22], most studies are now carried out on limestone manufactured sand and are seemingly gathering proper information by investigating different combinations of natural/manufactured siliceous/calcareous sands.
The European Concrete Pavement Association states that roller concrete pavement is not suitable for high-speed roads due to the smoothness of the surface due to roller work, and for high-speed roads, it is necessary to use asphalt surface to create skid resistance and smoothness. The thickness of the asphalt surface should be enough to reduce the potential for reflective cracking. To reduce the risk of reflective cracking and less joint activity, it is suggested to create fresh joints in freshly poured concrete at intervals of up to three meters during the compaction process. However, the use of special high-compaction pavers will make it impossible [23].
Rasmussen has comprehensive studies on the appropriate time of texturing, different types of macro-textures, and the performance of each [24]. He found there is no clear relationship between the type of macro-textures and skid resistance.
Skid resistance increases with increasing texture, which is often separated into micro-texture and macro-texture. The fine and coarse aggregates and the quality of their failure under the load imposed by the traffic affect the micro-texture of the pavement. The finer the molecular structure of the aggregates, the more likely they are to be polished. In fine materials, the lower the amounts of silica, the higher the amount of insoluble carbonate coarse aggregate is often used to address polishing [3].
Studies have shown that the more brittle and rougher, the finer the material, the better the polishing than aggregates with coarse structures but the lower the workability [25,26,27]. Ping et al. expressed that the skid resistance of an asphalt mixture was affected by many factors, including the abrasion resistance index and shape index of the aggregate [28]. The best granular materials to create suitable skid resistance are actually a combination of hard and abrasion-resistant aggregates with softer ones. This combination can provide the best output to achieve long-term skid resistance [29]. In another study by Komaragiri et al., the surface friction of concrete pavement and the role of different materials were investigated. A total of 48 material combinations and two macro-textures formation methods were tested as part of this study. Three sources of aggregate, such as silica, hard and soft limestone, were used, and samples were abraded with the National Asphalt Technology Center (NCAT) traffic flow simulator. The results show that the friction loss decreases with increasing silica content. However, some trends were minor, and in some cases, silica aggregates lost more friction. There have been numerous cases where carbonate-siliceous pavement surfaces perform better than siliceous concrete pavement surfaces [30].
Since macro-textures are very effective in water drainage and reduce the hydroplaning potential, an effort was made in this study to design and implement seeding, stamping, and brooming textures on RCC specimens to create proper macro-texture on RCCP surface, based on the possible changes in the common construction process.
Since both friction and noise are functions of texture and the latter changes over time, a proper texture should withstand both the initial and long-term performance qualities. In addition, since both micro-and macro-texture durability properties are critical for all concrete pavements, this research is not only aimed to provide some information on the effects of the lithology, shape, and hardness of different sands as well as the impacts of different macro-and surface textures on the abrasion resistance of the RCCP but also simulate new macro-texture to improve its durability under the traffic abrasion. Enough abrasion resistance will help proper skid resistance and enables RCC pavement to be nature-friendly and used in high-speed roads without an asphalt overlay. Investigation of skid resistance of different micro/macro-textures is another aspect of this study that will help to decrease RCCP weaknesses for using this cost-effective and beneficial type of pavement in the real world for high-speed roadways.
2. Materials and Methods
2.1. Materials and Mixtures
This research has used four different-lithology manufactured/natural sands (2 siliceous, 2 calcareous) from different mines and mixed them together on a 50/50 basis to prepare 8 mix designs. To determine the lithology, wet chemical analyses were performed according to ASTM C114-7 and ISIRI1692 [31]; results (SiO2 and CaO) are listed in Table 1.
Manufactured sands are fine aggregates produced by crushing rock deposits. They are generally more angular and have a rougher surface texture than natural sand particles.
Table 2 shows the results of the wet chemical analyses [32] of Delijan Type I-425 ordinary Portland cement (OPC) used in the present experimental investigations. Table 3 presents the physical properties based on ASTM C 204, 187-16, and 191-19 [33,34,35], and Table 4 lists the mechanical properties of the cement based on ASTM C109-20b [36].
The RCC mix was prepared according to the ACI 211 3R-02 method [37] developed for no-slump concretes, and the aggregates’ maximum nominal size was limited to 19 mm (based on PCA and ACI 325.10R-95 [38,39]) to limit segregation and surface striping under the traffic load. In the RCCP mix, workability was measured with the VeBe apparatus, and its acceptable range was 30–40 s. Since the macro-texture implementation on the RCCP surface highly depends on the volume of the cement paste and RCC workability, the VeBe time in this study was kept constant for all 8-mix designs, and other RCC specifications (mixture grading in Figure 1, mixing quality, and curing conditions) were also kept unchanged according to standard protocols [37,40,41].
Since the lithology, shape, and hardness of coarse aggregates were constant for all mixes, they were named based on the sand lithology and angularity; Ca for calcareous, Si for siliceous, N for naturally mined, and C for crushed (broken, manufactured). For mixes made of two sand types, their percentages were shown after the abbreviations (e.g., Ca50NSi50C means 50% natural calcium and 50% manufactured silica sands combine with each other).
Table 5 lists the mix proportions and material quantities; the cement content was 320 kg/m3 constant for different RCC mixes, and the water content was so set that the VeBe could be approximately constant for different mixes.
2.2. Specimen Preparation and Texturing
To prepare the specimens, concrete was poured into 15 cm cubic molds for a final height of about 10 cm and vibrated for the VeBe time determined for each mix design by applying the appropriate overhead.
Seeding, stamping, and brooming were the macro-textures designed and implemented on RCC specimens in this study. For the stamping texture (Figure 2), a patterned drum roller can be used, in the last roller pass, to move on the wet RCC pavement in the opposite direction (rear gear) and stamp a pattern, but prior to this, a heavy pneumatic tire roller can go up the mortar, pass the surface and thicken it to enhance the stamping quality; this is an innovative idea originated from field experience.
In the lab, this type of macro-texture has been created on the RCC samples’ surface by using metal mesh between concrete and surcharge plate during the vibrating time (VeBe).
For the seeding macro-texture (Figure 3), the technique used to create texture on rolled asphalt pavements can be used with a slight change in the RCCP aggregate size. Experience has shown that passing several heavy pneumatic tire rollers will thicken the cement mortar on the RCCP surface. Under such conditions, spreading SSD chips and compacting with a vibrating roller can seed the aggregates on the RCCP surface, resulting in a macro-texture similar to no particular orientation commonly used in the PCC.
To seed the chips on RCC samples’ surface in the lab, the chips have been added to the surface after two-thirds of the VeBe time has passed. In this regard, the VeBe apparatus stop and chips speeded uniformly on the surface, and the surcharge plate was added to stud the chips in cement mortar in the remaining one-third VeBe time.
The method currently practiced for the brooming texture on the RCCP (Figure 4) is the technique [42] where the concrete surface is moistened with a special liquid hardener, after the rolling is completed (because the RCC surface is very rough and dry), and polished with a trowel to thicken the cement mortar on the RCCP surface for the texture to be created with a broom or burlap drag transversely or lengthwise.
After compaction of the RCC samples, this type of macro-texture has been created by brushing the RCC surface by wire brush and extracting the mortar between the aggregate in one or two ways direction.
The RCC samples are cast in 20 × 20 cm cubic molds and compacted by adding the proper surcharge and vibrating in Vebe time on the standard vibrating table. Table 6 presents different macro-textures after being implemented on the RCC specimens’ surface in the lab according to described procedures presented before.
2.3. Tests Performed
After casting and implementing macro-textures on the concrete pavement, the specimens were cured for 28 days (ASTM C192 [41]) and tested for abrasion resistance based on ASTM C 944 used successfully in the quality control of concrete highways/bridges subject to traffic [43].
This test was performed with a chucked drill capable of holding and rotating the abrading cutter (Figure 5) at a speed of 200 rpm and exerting a constant force of 98 N.
In the abrasion test, a normal load was applied to the specimen and rubbed the concrete surface for 400 rounds. After each period, the specimen was removed from the device, and its surface was cleaned with a soft brush. The pre- and post-abrasion measuring of the tested specimens with 0.1 g scales determined the concrete mass worn out with this standard method. The test was performed two more times, and the mass loss was recorded for each step; obviously, the less was the worn mass, the more was the concrete surface abrasion resistance.
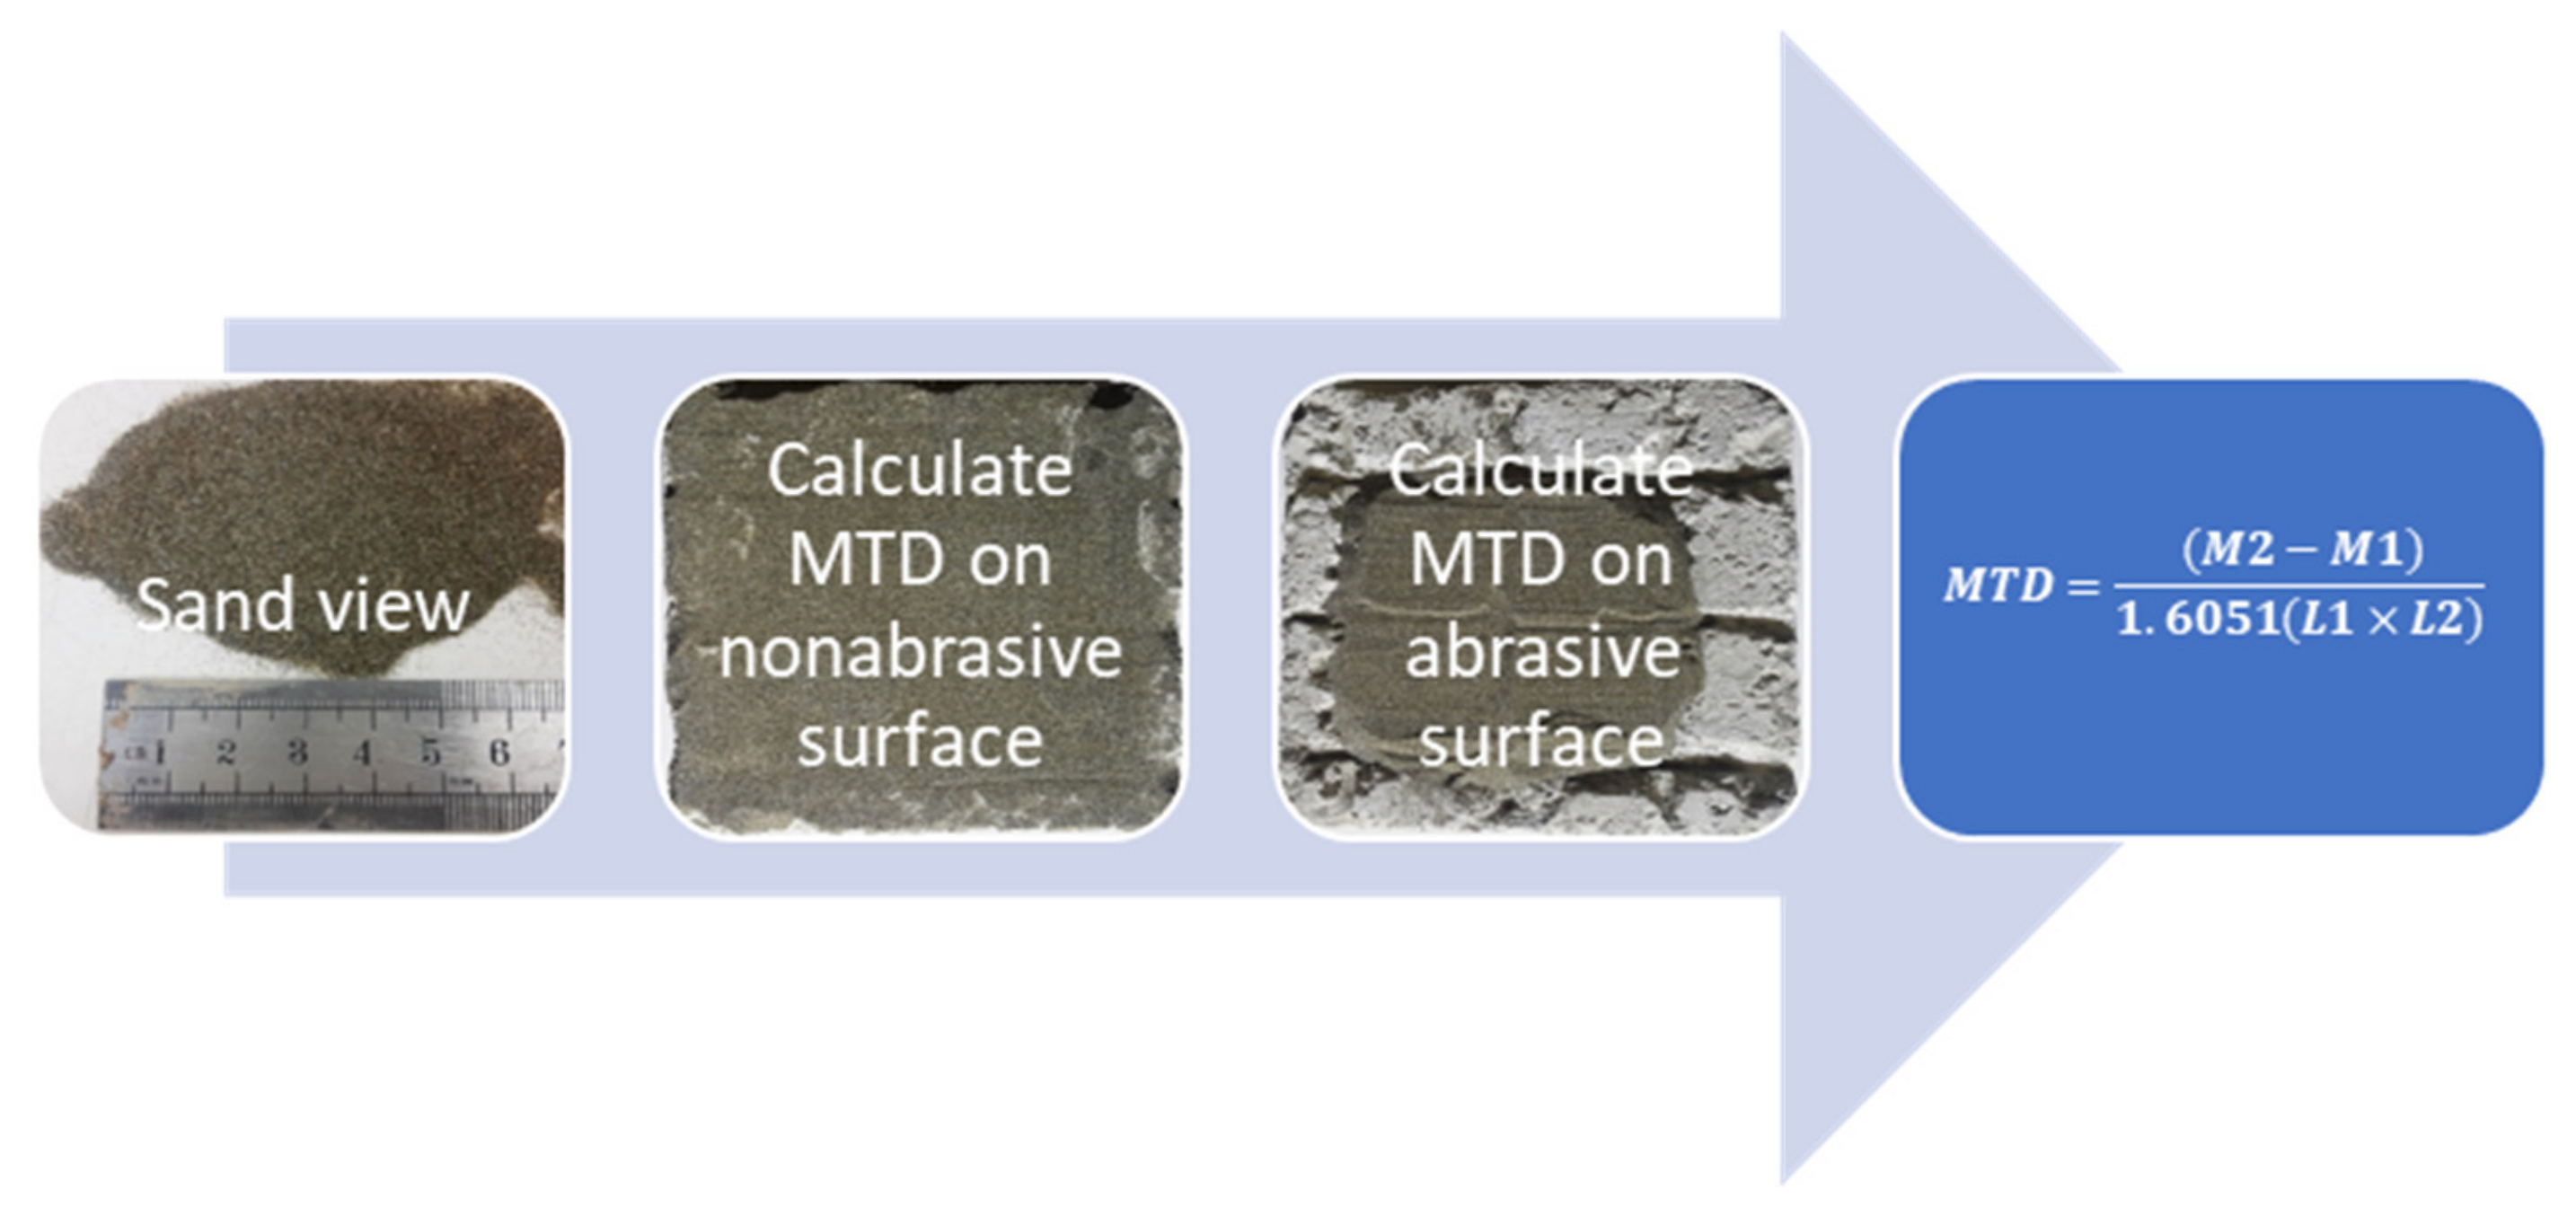
After abrasion, the texture depth was measured by the sand (volumetric) patch method (ASTM-E 965 [44]), where a constant volume of sand (or glass spheres) is carefully spread with a flat disk over the test location in a circular motion until the disk touches the material surface [45]. The result of this test is the average surface layer depth or mean texture depth (MTD) that helps us have information about the macro-textures’ abrasive or nonabrasive depth. The sand size used in this study was a maximum of 0.2 mm, and its bulk density was 1.6051 gr/cm3, but due to some specimen size limitations, some changes were made in the standard MTD measurement method, the steps of which, based on the equation presented in step 4, are described in Figure 6; here, M2 is the concrete mass covered by sand, M1 is the specimen’s concrete mass and L1 and L2 are dimensions of the sand spread over the specimen.
In the end, to investigate different micro/macro-textures effect on skid resistance before and after abrasion test, the British pendulum number (BPN) of different textures are examined according to ASTM E303 in wet condition as it present in Figure 7.
3. Results and Discussion
This section first investigates the density and mechanical properties (flexural and compressive strength) of the concrete mix and then evaluates the durability of different concrete surface macro-textures by simulating the wearing traffic loads passing over the pavement according to ASTM C944. The abrasion resistance of different mixes was inspected visually by checking the effects of different mixing proportions versus different macro-textures and measured based on the mass lost with MTD during the abrasion test.
3.1. Density
Figure 8 shows the bulk density of the mixes, Ca50CSi50C, which is made by combining same-ratio crushed calcareous and siliceous sands, shows the highest mass density, but Ca100N has the lowest; the less porous is the mixture, the higher is its density. The min-max density difference is about 55 kg/m3, equivalent to 2% of the average density of the mix designs. A mixture density-specimen strength (presented next) comparison shows that an increase in the former increases the compressive and flexural strengths.
3.2. Compressive and Flexural Strengths
Figure 9 shows the compressive and flexural strengths of different mix designs based on ASTM C 39 [38] and ASTM C 78-2002 [39], for which two standard 15 × 30 cm cylindrical and 10 × 10 × 50 cm prismatic specimens were cast, cured for 28-days, and averaged for the final result; Si100C shows the highest compressive and flexural strength while Ca100N shows the lowest. A comparison of mix designs containing silica sand reveals that specimens made of manufactured sand have higher compressive and flexural strengths than those made of natural sands; for the calcareous sand, the trend is the same. Hence, it can be concluded that mixing siliceous and calcareous sands will increase the compressive and flexural strengths, and the increase is much greater than that produced by each type of sand alone. The point worth noting in comparing the compressive strength variations of specimens containing mixed sands with those containing homogeneous sands is that when several sand types are combined, the strength reduction is less, concluding that mixed-sand specimens are less dependent on the sands’ crushing rate.
3.3. Visual Inspection
Since the macro-texture helps reduce hydroplaning, it not only plays a key role in wet-condition friction characteristics of the pavement surface, especially at higher vehicle speeds but is also a pavement surface feature with the highest impact on the tire-pavement noise, splash, and spray [13]. The texture type (brooming, stamping, seeding) and its design/construction details (width, depth, groove spacing, pattern randomness, texture orientation, etc.) highly affect the pavement noise and safety. The pavement surface visual inspection shows that textures are either positive (e.g., all types of seeding and two-way brooming that extract the inter-aggregates mortar) or negative (e.g., all types of stamping and one-way brooming). Figure 9 presents the abrasive and nonabrasive part of the macro-texture on RCC specimens. Since all grooves in the negative macro-texture are under the concrete surface level, they are abraded from both the groove edge as well as the inter-grooves concrete surface. Seemingly, big stamping has better abrasion resistance, guides water better, and prevents hydroplaning due to its higher groove depth. Contrarily, since grooves in the small stamping are dispersed uniformly on the surface, they have a higher density per unit surface and, therefore, have more MTD and damp more noise pollution.
Figure 10 shows that seeding textures are much weaker against abrasion, have more wear, and lose more seeded chip aggregates, maybe because all the aggregates added to the specimen surface are submerged in the cement mortar and act relatively weak in the paste-aggregate adhesion phase. As shown, chips 1.19–2.38 mm in size, in the small seeding texture, are fully immersed in the cement paste and do not create a significant macro-texture, but those 4.75–9.5 mm in size, in the big seeding texture, are generally worn out due to insufficient penetration depth in the cement paste. However, it is worth noting that removing aggregates does not mean a reduced surface roughness because the specimens’ pre- and post-abrasion observations have shown that when aggregates were removed from the concrete surface, the latter had a suitable negative macro-texture again because the previously aggregate-filled points were emptied causing the macro-texture to be regenerated; same was the case with the two-way brooming macro-texture. Among all seeding macro-textures, the medium one (2.38–4.75 mm chip size) had the highest adhesion to the cement paste and the least aggregate loss and provided proper durability against abrasion.
3.4. Abrasion Resistance Versus Different Mix Proportions
Figure 11 shows two small and big stamping macro-textures (Figure 11a) and MTD of the abrasion area versus different mixing proportions (Figure 11b). Comparing different mixing proportions with different sand lithology shows that the presence of the manufactured silica sand in each mixture can highly increase the abrasion resistance; so does combining natural and manufactured sands with different siliceous and calcareous lithology, but the increase in the combined form is more than that of the mixture of each sand type except for the one with the manufactured silica.
As regards different mixing proportions and the abrasion resistance, results of all three stages for both small and big stamping macro-textures show that there is almost no significant difference between the two. Low aggregate-hardness surfaces (e.g., limestone) that wear out more easily than the siliceous material have more potential for an MTD increase. Results in Figure 11 show that natural and manufactured calcareous sands, respectively, can create the highest MTD in this type of macro-texture.
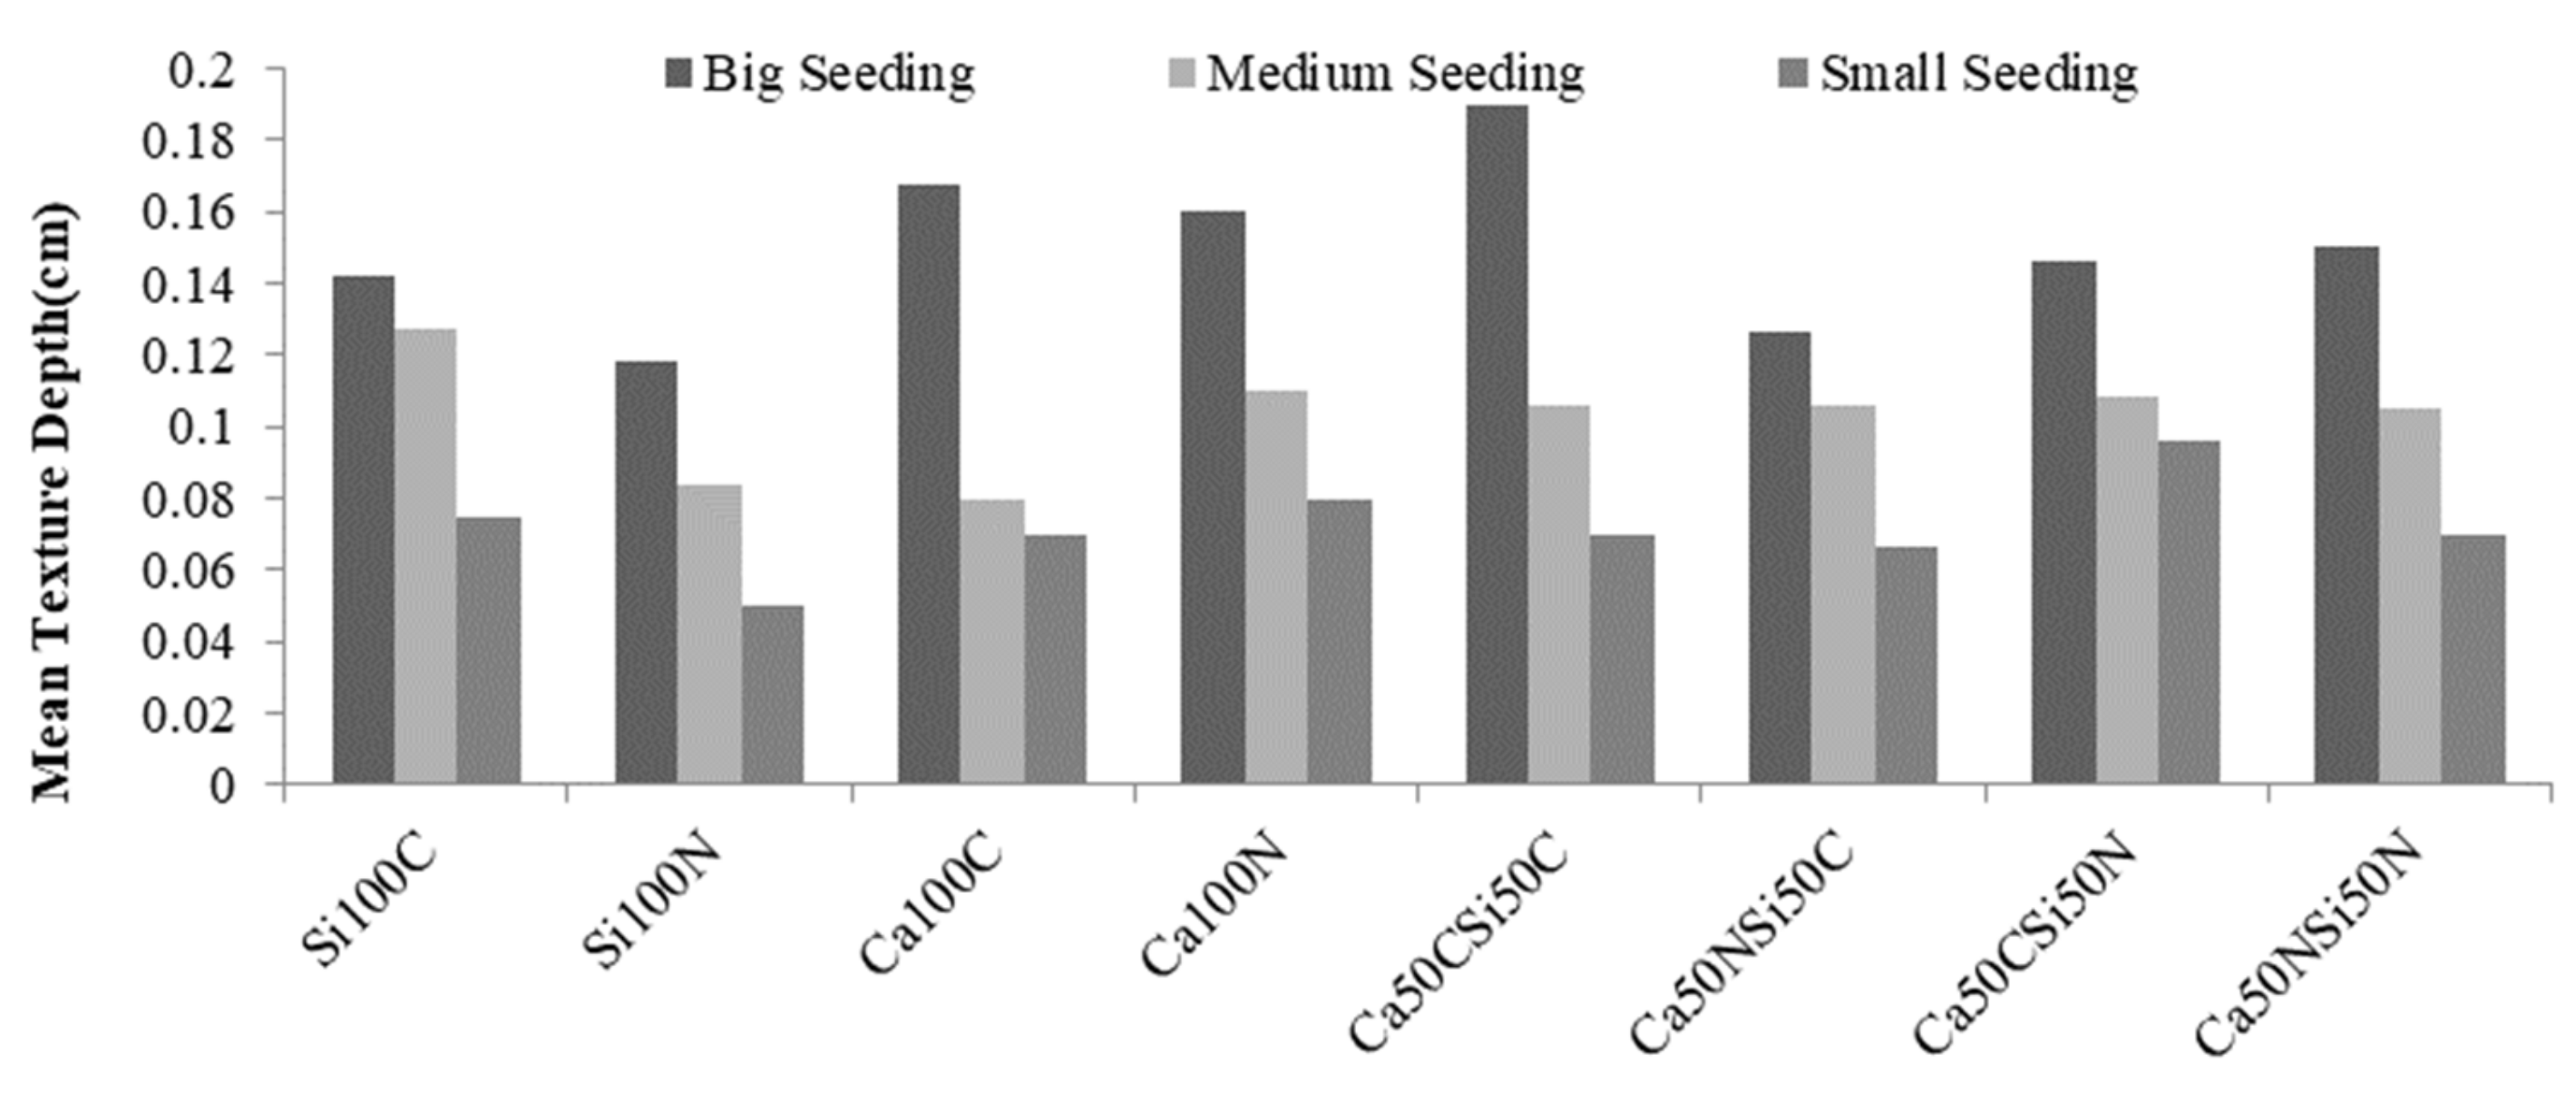
Figure 12 shows the abrasion test results for concrete surfaces with different seeding macro-textures, and Figure 13 depicts the measured MTDs. As shown, small (1.19–2.38 mm) and medium (2.39–4.75 mm) seeding textures do not differ significantly but generally have more wearing resistance than big seeding macro-textures for all different mixing proportions.
The mass lost in the first abrasion period is more than that of the other two indicating that most aggregates seeded on the cement mortar are separated in early abrasion periods. Results show that mixtures containing manufactured silica sand or mixed sand have a higher abrasion resistance than others.
In Figure 13, there is no clear trend among MTDs for different mixing proportions due to the stochastic nature of these macro-textures and the regeneration mechanism of the new ones after aggregates seeded on the concrete surface exit. However, due to the roughness of the newly created macro-texture, the MTDs measured on the texture with larger aggregates is greater than that of the surface with smaller ones.
Figure 14 shows the abrasion (weight loss) of different single- and two-way brooming macro-textures (Figure 14a) and MTDs of different mix proportions (Figure 14b). As shown, their abrasion resistances do not differ significantly, and major changes are related to different mixtures; those containing manufactured silica sand have the least mass loss followed by those with combined sands. According to the results, abrasion in each period decreases at almost a constant rate, and the two-way brooming has more MTDs than its rival (one-way) because since the texture of the former is brushed on both sides, more paste is emptied between the aggregates and, hence, more empty space is created on the concrete surface causing more MTDs. The MTD data investigation of different mixtures shows that those containing manufactured silica sand or a combination of different sands have higher MTDs. In fact, in the brooming of macro-textures with exposed aggregates, the higher is the abrasion resistance, the less is the wear, and, hence, the higher is the depth of the exposed aggregates that resulted in more MTDs.
3.5. Durability Analyses of Different Mixtures
Results have shown that among all different specimens, except macro-textures, the weakest abrasion resistance belongs to the mixture containing the most common sand, namely natural calcareous sand, the low angularity of which causes the weakest mortar strength. However, as the total aggregate hardness and sand angularity increase with a decrease in the calcareous sand and an increase in the siliceous sand, the sand-to-cement paste adhesion increases resulting in an increase in the abrasion resistance. Therefore, the mixing proportion is very important to construct a durable RCCP surface.
Considering the price of the natural and manufactured sands and approximately similar abrasion resistance of RCC specimens containing them, using natural calcareous sand can be more appropriate than the manufactured one to achieve an optimal mixing proportion when dealing with the stamping macro-texture. Moreover, since the compressive and abrasion resistance of concrete made with natural and manufactured silica sand highly differ, using the latter is more justified to have a durable RCCP surface when dealing with the brooming macro-texture. However, a mixture of both (either manufactured or natural) can benefit the RCCP (optimize the price and durability) because their prices are highly different due to the higher hardness of the silica sand and more crusher depreciation.
3.6. Abrasion Resistance Versus Different Macro-Textures
Figure 15 shows the cumulative abrasion results for different similar micro/macro-texture mixes to study their abrasion resistance. Statistical analysis of variance (one-way ANOVA) shows this resistance has not significantly different for different approximately similar macro-textures; it is the lowest for the big seeding because of the extraction and separation of weakly bonded 4.75–9.5 mm seeded aggregates from the low-thick cement paste on the RCC surface. Contrarily, it has a significant difference for all mixtures, so that mix containing manufactured silica sand is a suitable candidate when durable high abrasion resistance micro-textures are desired. The next mix with high abrasion resistance has been made with a combination of manufactured silica/calcareous sand.
Figure 16 compares MTD results of different mixing proportions and different macro-textures; although changes in the mass loss due to abrasion may not well indicate which macro-texture can be affected, results show that the best one is the small stamping and the worst is the small seeding. Enough MTD on the surface texturing is crucial to provide adequate surface friction to meet the safety requirements, particularly under wet conditions, and reduce hydroplaning potential, splash and spray that scan highly reduce the visibility. Nevertheless, excess MTD will affect other functional issues such as the tire-pavement noise pollution and rolling resistance that increases fuel consumption. Hence, it can be concluded that the friction-noise trade-off and optimum MTD determination to enhance the RCCP efficiency should be considered as vital necessities. Based on NCHRP-634 [46], high levels of friction can be achieved with the ground, grooved, and tined textures, especially if the good-quality aggregate is used in the concrete mix; however, it can become inadequate if less than 0.8 mm-MTD polish-susceptible aggregates are used at the time of construction [46] (Minnesota Astroturf Texture [47] suggests MTDs ≥ 1 mm). Although the literature does not clearly specify the MTD and noise thresholds, there are facts that help find the proper texture. Newcomb et al. [48] believe that negative textures have better acoustical performance than positive ones. Since investigations of different macro-texture properties, especially their average depth, show that many of them have depths in the range of 0.2–1.4 mm [46,47,49], this study has used MTDs in the range of 0.8–1.5 mm to select the proper macro-texture (Figure 16).
Effective micro-textures generally provide adequate surface friction on dry pavement surfaces at all speeds and on wet surfaces only at slower speeds, whereas macro-textures typically provide adequate friction on wet pavement surfaces at high speeds [50]. To have wearing-/polishing-resistant concretes, micro-textures are usually generated by fine aggregates, 25% of which (minimum) should be siliceous [51]; therefore, the combined sand mixture is preferable.
Results in Figure 16 show that the negative macro-texture mixes made by combined sand (natural/manufactured and siliceous/calcareous) with MTDs in the range of 0.8–1.5 mm such as big stamping and one-way brooming are proper candidates to achieve durable RCCP surfaces. In addition, all mixes with big and medium seeding macro-textures approximately approved the MTD thresholds.
3.7. Skid Resistance
The BPN results for different fine aggregates to investigate the effect of micro-texture on RCCP skid resistance, as well as the effect of different macro-textures, before and after abrasion test are presented In Figure 17. The hypothesis is that the BPN is dependent only on surface micro-texture and represents low-speed friction [52]. The results of this study appeared different and show that the BPNs are more related to macro-textures. Based on the results of the two-way analysis of variance, different macro and micro-textures do not interact with each other, which means that in principle, two-way analysis of variance is not necessary to analyze the data, and each texture could be analyzed independently by one-way ANOVA analysis.
The statistical analysis of two sets of BPN data before and after the abrasion test reveals that, based on the assumption of the level of 5 percent error, H0 is not accepted. In this case, the significant difference between these two sets is available, and the abrasion has a significant effect on the reduction in skid resistance. The difference between data averages is approximately 10 percent of initial specimens’ BPN.
One-way analysis of variance on each of the data sets of different micro/macro-textures separately to investigate significant differences in each data set reveal that changes in skid resistance in the form of BPN before and after abrasion is not significant for different micro-textures, while it is significant for different macro-textures. By comparing the percent results with previous studies that have considered micro-textures to be effective in changing the skid resistance, it can be pointed out that changes caused by macro-textures are much more than the values caused by micro-textures, and also the standard variations deal with micro-textures are widely so that the statistical analysis miss out their effects. Regardless of statistical analysis results and only by comparing different BPNs’ mean, it can be claimed that in both before and after abrasion tests, the combination of 50-50 manufactured calcium and natural silica sand (Ca50CSi50N) will create the best performance in terms of skid resistance.
Grouping information using the Tukey method with the 95% confidence level reveals that BPN results categorized in two groups that one of them is consist of two types of brooming as well as small stamping macro-textures that have the best performance in skid resistance both before and after the abrasion test run on RCCP samples. In addition, the small seeding macro-texture has the worst performance. Results of different seeding macro-textures expressed that positive macro-textures may not be a preferred texture because the benefit of fine aggregate micro-texture is lost with washing out of the surface mortar.
Investigation of various studies on the relationship between MTD and BPN [52,53] and comparison with the results of this study showed that there is a strong relationship between the mean values for each type of macro-textures except brooming macro-textures with the average values of BPN. These relationships are plotted in Figure 18 for both before and after the abrasion test samples.
Regardless of brooming macro-textures, the results showed that BPNs range after abrasion; vary approximately between 65 and 75. Analysis has shown that a maximum BPN with considering MTD threshold of maximum 15 mm is 70 that is effectively higher than the minimum threshold (42) expressed in different studies for high-speed roads to prevent accident [52]. In this study, no strong correlation was observed between the amount of abrasive mass with MTD or with the BPN separately. In fact, the mass worn depends on both the micro and macro-texture simultaneously. For example, in the seeding macro-texture, part of the abrasive material is formed from the protruding seeded aggregate in the cement paste, and the other is the part of worn aggregates or cement mortar.
Since simultaneous abrasion of micro and macro textures and their interactions are realistic in the real field, this study was focused on investigating RCC samples’ micro and macro-texture performance simultaneously. Therefore, the authors intend to investigate the abrasion and skid resistance of RCC in the case of each type of textures individually in forthcoming research.
4. Conclusions
This research was aimed to provide information about the effects of various sand types as well as different macro-textures on the abrasion resistance of RCCP by simulating the traffic abrasion. Results, enumerated below, are useful because enough RCCP surface abrasion resistance will help maintain proper skid resistance during its service life and enables to use of this type of pavement without an asphalt overlay in high-speed roads:
In general, since different-size/-shape aggregate combinations had proper interactions that led to better mechanical performance, mixtures made with different sand compositions had higher density and flexural/compressive strength than those made with only one type of sand (except silica mixtures that had the highest density).
Combinations of different types of siliceous and calcareous sands not only economized the concrete mixture but also improved its abrasion resistance and also skid resistance. The higher was the fracture rate of the sand containing more manufactured proportions, the more was the abrasion resistance; this did not apply to cases where only one sand type was used (except manufactured silica sand). In the case of skid resistance, the effect of different sand types on BPN is not statistically significant, but the combination of different sand types is useful when only the average values of BPN are considered.
In general, different macro-textures showed suitable durability against abrasion and had almost the same performance regarding the abraded mass; almost all macro-textures with minimum MTD = 0.8 mm met this criterion even after abrasion. Stamping macro-textures had the highest MTD, and seeding ones had the lowest.
The results show that abrasion reduces the skid resistance of the RCCP samples by about 10%. Statistical studies showed that the skid resistance is completely dependent on the type of macro-texture so that the brooming macro-textures show the highest, and the seeding ones show the lowest skid resistance before and after abrasion.
Regardless of the results of skid resistance of brooming macro macro-textures, a significant relationship can be established between the MTDs of the other macro-textures and BPN. A trade-off between technical and economic conditions concludes that roller compacted concrete pavement with big stamping and one-way brooming macro-textures made of a combination of manufactured calcium and natural silica fine aggregate (Ca50CSi50N) will have suitable performance in terms of abrasion and skid resistance as well as mechanical performance.
Author Contributions
Conceptualization, Data curation, Formal analysis, Funding acquisition, M.A.; Investigation, M.A. and G.L.; Methodology, Project administration, Resources, M.A.; Writing—original draft, M.A.; Writing—review and editing, G.L. All authors have read and agreed to the published version of the manuscript.
Funding
This work was supported by Shahid Rajaee Teacher Training University under contract number 18027.
Institutional Review Board Statement
Not applicable.
Informed Consent Statement
Not applicable.
Conflicts of Interest
The authors declare no conflict of interest.
References
- ACI325.9r. Guide for Construction of Concrete Pavements and Concrete Bases; American Concrete Institute: Farmington Hills, MI, USA, 2015. [Google Scholar]
- Fwa, T.F.; Anupam, K.; Ong, G.P. Relative effectiveness of grooves in tire and pavement for reducing vehicle hydroplaning risk. Transp. Res. Rec. J. Transp. Res. Board 2010, 2155, 73–81. [Google Scholar] [CrossRef]
- Taylor, P.; Van Dam, T.; Sutter, L.; Fick, G. Integrated Materials and Construction Practices for Concrete Pavement: A State-of-the-Practice Manual; Iowa State University: Ames, IA, USA, 2019. [Google Scholar]
- Pranav, S.; Aggarwal, S.; Yang, E.-H.; Sarkar, A.K.; Singh, A.P.; Lahoti, M. Alternative Materials for Wearing Course of Concrete Pavements: A Critical Review. Constr. Build. Mater. 2020, 236, 117609. [Google Scholar] [CrossRef]
- Warudkar, A.; Elavenil, S.; Arunkumar, A. Assessment of abrasion resistance of concrete pavement for durability. Int. J. Civ. Eng. Technol. 2018, 9, 6. [Google Scholar]
- Yuksel, I. Blast-furnace slag. In Waste and Supplementary Cementitious Materials in Concrete: Characterisation, Properties and Applications; Woodhead Publishing: Cambridge, UK, 2018; pp. 361–415. [Google Scholar]
- Li, H.; Zhang, M.-H.; Ou, J.-P. Abrasion resistance of concrete containing nano-particles for pavement. Wear 2006, 260, 1262–1266. [Google Scholar] [CrossRef]
- Zollinger, D. Roller-Compacted Concrete Pavement. FHWA-HIF-16-003. 2016. Available online: https://www.fhwa.dot.gov/pavement/concrete/pubs/hif16003.pdf (accessed on 16 June 2021).
- Harrington, D.; Abdo, F.; Adaska, W.; Hazaree, C. Guide for Roller-Compacted Concrete Pavements; Iowa State University: Ames, IA, USA, 2010. [Google Scholar]
- Rao, S.K.; Sravana, P.; Rao, T.C. Investigating the effect of m-sand on abrasion resistance of roller compacted concrete containing GGBS. Constr. Build. Mater. 2016, 122, 191–201. [Google Scholar] [CrossRef]
- Rao, S.K.; Sravana, P.; Rao, T.C. Investigating the effect of m-sand on abrasion resistance of fly ash roller compacted concrete (FRCC). Constr. Build. Mater. 2016, 118, 352–363. [Google Scholar] [CrossRef]
- Naik, T.R.; Singh, S.S.; Ramme, B.W. Effect of Source of Fly Ash on Abrasion Resistance of Concrete. J. Mater. Civ. Eng. 2002, 14, 417–426. [Google Scholar] [CrossRef] [Green Version]
- Snyder, M.B. Concrete Pavement Texturing. Fed. Highway Administration. FHWA-HIF-17-011. 2019. Available online: https://www.fhwa.dot.gov/pavement/pubs/hif17011.pdf (accessed on 16 June 2021).
- ACPA. Development and Implementation of the Next Generation Concrete Surface; American College Personnel Association: Washington, DC, USA, 2016. [Google Scholar]
- Akers, D.J.; Albright, R.O. ACI 325.9r-15 Guide for Construction of Concrete Pavements; American Concrete Institute: Farmington Hills, MI, USA, 2015. [Google Scholar]
- AASTHO. Guidelines for Skid Resistance Pavement Design; American Association of State Highway and Transportation Officials: Washington, DC, USA, 1976. [Google Scholar]
- Sadegzadeh, M.; Page, C.L.; Kettle, R.J. Surface microstructure and abrasion resistance of concrete. Cem. Concr. Res. 1987, 17, 581–590. [Google Scholar] [CrossRef]
- Mehta, P.K.; Monteiro, P.J.M. CONCRETE Microstructure, Properties and Materials; Mc Graw Hill: New Jork, NJ, USA, 2001. [Google Scholar]
- Muthusamy, K.; Rasid, M.H.; Jokhio, G.; Budiea, A.M.A.; Hussin, M.W.; Mirza, J. Coal bottom ash as sand replacement in concrete: A review. Constr. Build. Mater. 2020, 236, 117507. [Google Scholar] [CrossRef]
- Mehta, A.; Ashish, D.K. Silica fume and waste glass in cement concrete production: A review. J. Build. Eng. 2020, 29, 100888. [Google Scholar] [CrossRef]
- CCAA. Australia, Cement Concrete & Aggregates (CCAA T60) Guide to the Specification and Use of Manufactured Sand in Concrete; Cement Concrete & Aggregates: Mascot, Australia, 2008. [Google Scholar]
- Beixing, L.; Guoju, K.; Mingkai, Z. Influence of manufactured sand characteristics on strength and abrasion resistance of pavement cement concrete. Constr. Build. Mater. 2011, 25, 3849–3853. [Google Scholar]
- EUPAVE. Roller Compacted Concrete: Making Concrete Pavements Available to the Whole Pavement Building Industry; European Concrete Paving Association: Brussels, Belgium, 2020. [Google Scholar]
- Rasmussen, R.O.; Weigand, P.D.; Fick, G.J.; Harrington, D.S. How to Reduce Tire-Pavement Noise Better Practices for Constructing and Texturing Concrete Pavement Surfaces; Iowa State University: Ames, IA, USA, 2012. [Google Scholar]
- Wang, D.; Chen, X.; Oeser, M.; Stanjek, H.; Steinauer, B. Study of micro-texture and skid resistance change of granite slabs during the polishing with the Aachen Polishing Machine. Wear 2014, 1, 11. [Google Scholar] [CrossRef]
- Wang, D.; Liu, P.; Oeser, M.; Stanjek, H.; Kollmann, J. Multi-scale study of the polishing behaviour of quartz and feldspar on road surfacing aggregate. Int. J. Pavement Eng. 2016, 1, 29. [Google Scholar] [CrossRef]
- Ahmadi, A.; Gogheri, M.K.; Adresi, M.; Amoosoltani, E. Laboratory evaluation of roller compacted concrete containing RAP. Adv. Concr. Constr. 2020, 10, 489–498. [Google Scholar]
- Li, P.; Yi, K.; Yu, H.; Xiong, J.; Xu, R. Effect of aggregate properties on long-term skid resistance of asphalt mixture ping. J. Mater. Civ. Eng. 2021, 33, 1. [Google Scholar] [CrossRef]
- Dahir, S.H.M.; College, C.B.; Mullen, W.G. Factors influencing aggregate skid-resistance properties. Highw. Res. Rec. 1971, 136–148. Available online: http://onlinepubs.trb.org/Onlinepubs/hrr/1971/376/376-022.pdf (accessed on 16 June 2021).
- Komaragiri, S.; Amirkhanian, A.; Bhasin, A. Friction and texture retention of concrete pavements. Transp. Res. Rec. 2020, 2674, 457–465. [Google Scholar] [CrossRef]
- ASTMC114–07. Standard Test Methods for Chemical Analysis of Hydraulic Cement; ASTM International: West Conshohocken, PA, USA, 2007. [Google Scholar]
- Wheeler, B. Chemical analysis of portland cement by energy dispersive X-ray fluorescence. Cem. Concr. Aggreg. 1983, 2, 123–127. [Google Scholar]
- ASTMC204-18. Standard Test Methods for Fineness of Hydraulic Cement by Air-Permeability Apparatus; ASTM International: West Conshohocken, PA, USA, 2018. [Google Scholar]
- ASTMC191-19. Standard Test Methods for Time of Setting of Hydraulic Cement by Vicat Needle; ASTM International: West Conshohocken, PA, USA, 2019. [Google Scholar]
- ASTMC187-16. Standard Test Method for Amount of Water Required for Normal Consistency of Hydraulic Cement Paste; ASTM International: West Conshohocken, PA, USA, 2016. [Google Scholar]
- ASTMC109-20b. Standard Test Method for Compressive Strength of Hydraulic Cement Mortars (Using 2-in. or [50 mm] Cube Specimens); ASTM International: West Conshohocken, PA, USA, 2020. [Google Scholar]
- ACI211.3R-02. Guide for Selecting Proportions for No-Slump Concrete Reported by ACI Committee 211; No. Reapproved; American Concrete Institute: Farmington Hills, MI, USA, 2002; Volume 2, pp. 1–26. [Google Scholar]
- ACI325.10R-95. State-of-the-Art Report on Roller-Compacted Concrete Pavements; American Concrete Institute: Farmington Hills, MI, USA, 1995. [Google Scholar]
- PCA. Guide Specification for Construction of Roller-Compacted Concrete Pavements. 2004. Available online: https://www.chaneyenterprises.com/files/productdocs/Guidetorcc.pdf (accessed on 16 June 2021).
- ASTMC1176-05. Standard Practice for Making Roller-Compacted Concrete in Cylinder Molds Using a Vibrating Table; ASTM International: West Conshohocken, PA, USA, 2005. [Google Scholar]
- ASTM:C192/C192M-13. Standard Practice for Making and Curing Concrete Test Specimens in the Laboratory; ASTM International: West Conshohocken, PA, USA, 2013. [Google Scholar]
- NRRA. 2018_ACPA_Quarterly_CCP, ACPA/MoDOT Quarterly Meeting 2018. Available online: https://www.dot.state.mn.us/mnroad/nrra/newsletter/documents/2018_ACPA_Quarterly_CCP_20181107.pdf (accessed on 16 June 2021).
- ASTMC944. Standard Test Method for Abrasion Resistance of Concrete or Mortar Surfaces by the Rotating-Cutter Method; ASTM International: West Conshohocken, PA, USA, 2005. [Google Scholar]
- ASTME965-15(2019). Standard Test Method for Measuring Pavement Macrotexture Depth Using a Volumetric Technique; ASTM International: West Conshohocken, PA, USA, 2019. [Google Scholar]
- Fisco, N.; Sezen, H. Comparison of surface macrotexture measurement methods. J. Civ. Eng. Manag. 2013, 19 (Suppl. S1), S153–S160. [Google Scholar] [CrossRef]
- NCHRP-REPORT-634. Texturing of Concrete Pavements; The National Academies Press: Washington, DC, USA, 2009. [Google Scholar]
- Hall, J.W.; Smith, K.L.; Littleton, P. Texturing of Concrete Pavements Final Report Appendixes A-F. No. 10. 2008. Available online: http://www.trb.org/Main/Blurbs/Texturing_of_Concrete_Pavements_162518.aspx (accessed on 16 June 2021).
- Newcomb, D.; Scofield, L. Quiet pavements raise the roof in europe: Scanning tour reveals European practice for noise mitigation. Sept. Ed. Hot Mix Asph. Technol. 2004, 9, 22–28. [Google Scholar]
- NCHRP-Project-01-43. Guide for Pavement Friction. 2009. Available online: https://www.massenza.ru/wp-content/themes/massenza/downloads/publications/nchrp_w108.pdf (accessed on 16 June 2021).
- Hoerner, T.E.; Smith, K.D.; Larson, R.M.; Swanlund, M.E. Current practice of portland cement concrete pavement texturing. Transp. Res. Rec. J. Transp. Res. Board. 2003, 1860, 178–186. [Google Scholar] [CrossRef]
- Snyder, M.B. Pavement Surface Characteristics: A Synthesis and Guidex; American Concrete Pavement Association: Skokie, IL, USA, 2006. [Google Scholar]
- Ahammed, M.A.; Tighe, S.L. Pavement surface mixture, texture and skid resistance: A factorial analysis. In Airfield and Highway Pavements, Proceedings of the 2008 Airfield and Highway Pavements Conference, Bellevue, WA, USA, 15–18 October 2009; American Society of Civil Engineers: Reston, WI, USA, 2009. [Google Scholar]
- Kamali, M.H.J.; Hassani, A.; Sodagari, J. Investigating the relation among british pendulum number, mean texture depth and asphalt content in hot mix asphalt. J. Rehabil. Civ. Eng. 2020, 8, 87–96. [Google Scholar]
Figure 1.
Different RCC mixture grading.

Figure 2.
Steps of the stamping texture.

Figure 3.
Steps of the seeding macro-texture (the right picture is author-originated).

Figure 4.
Steps of the brooming texture (the picture is author-originated: spaying on RCCP and passing heavy pneumatic tire roller on the RCCP surface).
Figure 4.
Steps of the brooming texture (the picture is author-originated: spaying on RCCP and passing heavy pneumatic tire roller on the RCCP surface).

Figure 5.
ASTM C944 chucked drill at the left and abrading cutter at the right.

Figure 6.
Measuring the MTD on abrasive or nonabrasive RCC samples.

Figure 7.
Investigation of different RCCP micro/macro-textures by British pendulum test setup.

Figure 8.
The bulk density of different mixes.

Figure 9.
The compressive and flexural strength of RCC.

Figure 10.
Visual inspection of different macro-textures.

Figure 11.
Abrasion resistance in form of average mass loss and MTD of stamping macro-textures versus different mix proportions.
Figure 11.
Abrasion resistance in form of average mass loss and MTD of stamping macro-textures versus different mix proportions.

Figure 12.
Abrasion resistance in form of average mass loss of seeding macro textures versus different mix proportions.
Figure 12.
Abrasion resistance in form of average mass loss of seeding macro textures versus different mix proportions.

Figure 13.
MTD in abrasive seeding macro-textures versus different mix proportions.

Figure 14.
Abrasion resistance in form of average mass loss and MTD of brooming macro-textures versus different mix proportions.
Figure 14.
Abrasion resistance in form of average mass loss and MTD of brooming macro-textures versus different mix proportions.

Figure 15.
Comparison of abrasion resistance of different micro/macro-texture.

Figure 16.
The MTD of different mixing proportions and different macro-textures.

Figure 17.
The BPN of different mixing proportions and different macro-textures before and after abrasion test.
Figure 17.
The BPN of different mixing proportions and different macro-textures before and after abrasion test.

Figure 18.
The relationship between BPN and MTD in both before and after abrasion test on RCCP samples.
Figure 18.
The relationship between BPN and MTD in both before and after abrasion test on RCCP samples.


Table 1.
Chemical composition of the sand lithology.
| Sand Type | CaO% | SiO2% | Other Oxides |
|---|---|---|---|
| Natural limestone | 22.3 | 56.4 | 21.3 |
| Manufactured limestone | 21.7 | 58.4 | 19.9 |
| Natural silica | 86.3 | 4.52 | 9.18 |
| Manufactured silica | 79.5 | 7.74 | 12.78 |
Table 2.
Chemical compositions of cement.
| Cement Type | SiO2 | CaO | Fe2O3 | Al2O3 | MgO | SO3 | K2O | Na2O |
|---|---|---|---|---|---|---|---|---|
| Delijan I-425 | 20.4 | 64.01 | 4.28 | 4.58 | 1.09 | 1.74 | 0.74 | 0.54 |
Table 3.
Physical properties of cement.
| Cement Type | Normal Consistency % | Initial Setting Time (min) | Final Setting Time (min) | Blain cm2/gr | Specific Density gr/cm3 |
|---|---|---|---|---|---|
| Delijan I-425 | 23.8 | 115 | 235 | 3385 | 3.08 |
Table 4.
Mechanical properties of cement mortar.
| Cement Type | Compressive Strength of Cement Mortar in Different Days (Kg/cm2) | |||
|---|---|---|---|---|
| Delijan I-425 | 1 | 3 | 7 | 28 |
| 144 | 282 | 375.5 | 470 | |
Table 5.
Mix proportions per one cubic meter of RCC.
| Compositions (Kg per m3) | Code Name | |||||||
|---|---|---|---|---|---|---|---|---|
| Si100N | Ca100N | Si100C | Ca100C | Ca50NSi50N | Ca50CSi50C | Ca50NSi50C | Ca50CSI50N | |
| Coarse Agg. (9.5–19 mm) | 160 | 159 | 162 | 159 | 160 | 164 | 160 | 163 |
| Coarse Agg. (4.75–9.5 mm) | 454 | 453 | 460 | 454 | 454 | 466 | 456 | 465 |
| Sand (0–4.75 mm) | 1272 | 1263 | 1282 | 1264.25 | 633 + 633 | 650 + 650 | 635.5 + 635.5 | 637.5 + 637.5 |
| Water | 144 | 144 | 144 | 144 | 128 | 128 | 144 | 128 |
| Cement | 320 | 320 | 320 | 320 | 320 | 320 | 320 | 320 |
Table 6.
Different macro-textures on RCC.
| Stamping Macro-Textures | |||
| The large stamping size with 4 mm grooving depth | The Small stamping size with 3 mm grooving depth | ||
 |  | ||
| Seeding Macro-Textures | |||
| The Big seeding chip size | The medium seeding chip size | The small seeding chip size | |
 |  |  | |
| Brooming Macro-Textures | |||
| Two-way brooming | One-way brooming | ||
 |  | ||
Publisher’s Note: MDPI stays neutral with regard to jurisdictional claims in published maps and institutional affiliations. |
© 2021 by the authors. Licensee MDPI, Basel, Switzerland. This article is an open access article distributed under the terms and conditions of the Creative Commons Attribution (CC BY) license (https://creativecommons.org/licenses/by/4.0/).
Share and Cite
MDPI and ACS Style
Adresi, M.; Lacidogna, G. Investigating the Micro/Macro-Texture Performance of Roller-Compacted Concrete Pavement under Simulated Traffic Abrasion. Appl. Sci. 2021, 11, 5704. https://doi.org/10.3390/app11125704
AMA Style
Adresi M, Lacidogna G. Investigating the Micro/Macro-Texture Performance of Roller-Compacted Concrete Pavement under Simulated Traffic Abrasion. Applied Sciences. 2021; 11(12):5704. https://doi.org/10.3390/app11125704
Chicago/Turabian StyleAdresi, Mostafa, and Giuseppe Lacidogna. 2021. "Investigating the Micro/Macro-Texture Performance of Roller-Compacted Concrete Pavement under Simulated Traffic Abrasion" Applied Sciences 11, no. 12: 5704. https://doi.org/10.3390/app11125704
Note that from the first issue of 2016, this journal uses article numbers instead of page numbers. See further details here.