
Effect of Unaware Clock Manipulation on Pacing Strategy and Performance in Recreational Athletes

 , ,
, ,
Abstract
:Featured Application
Abstract
1. Introduction
2. Materials and Methods
2.1. Participants
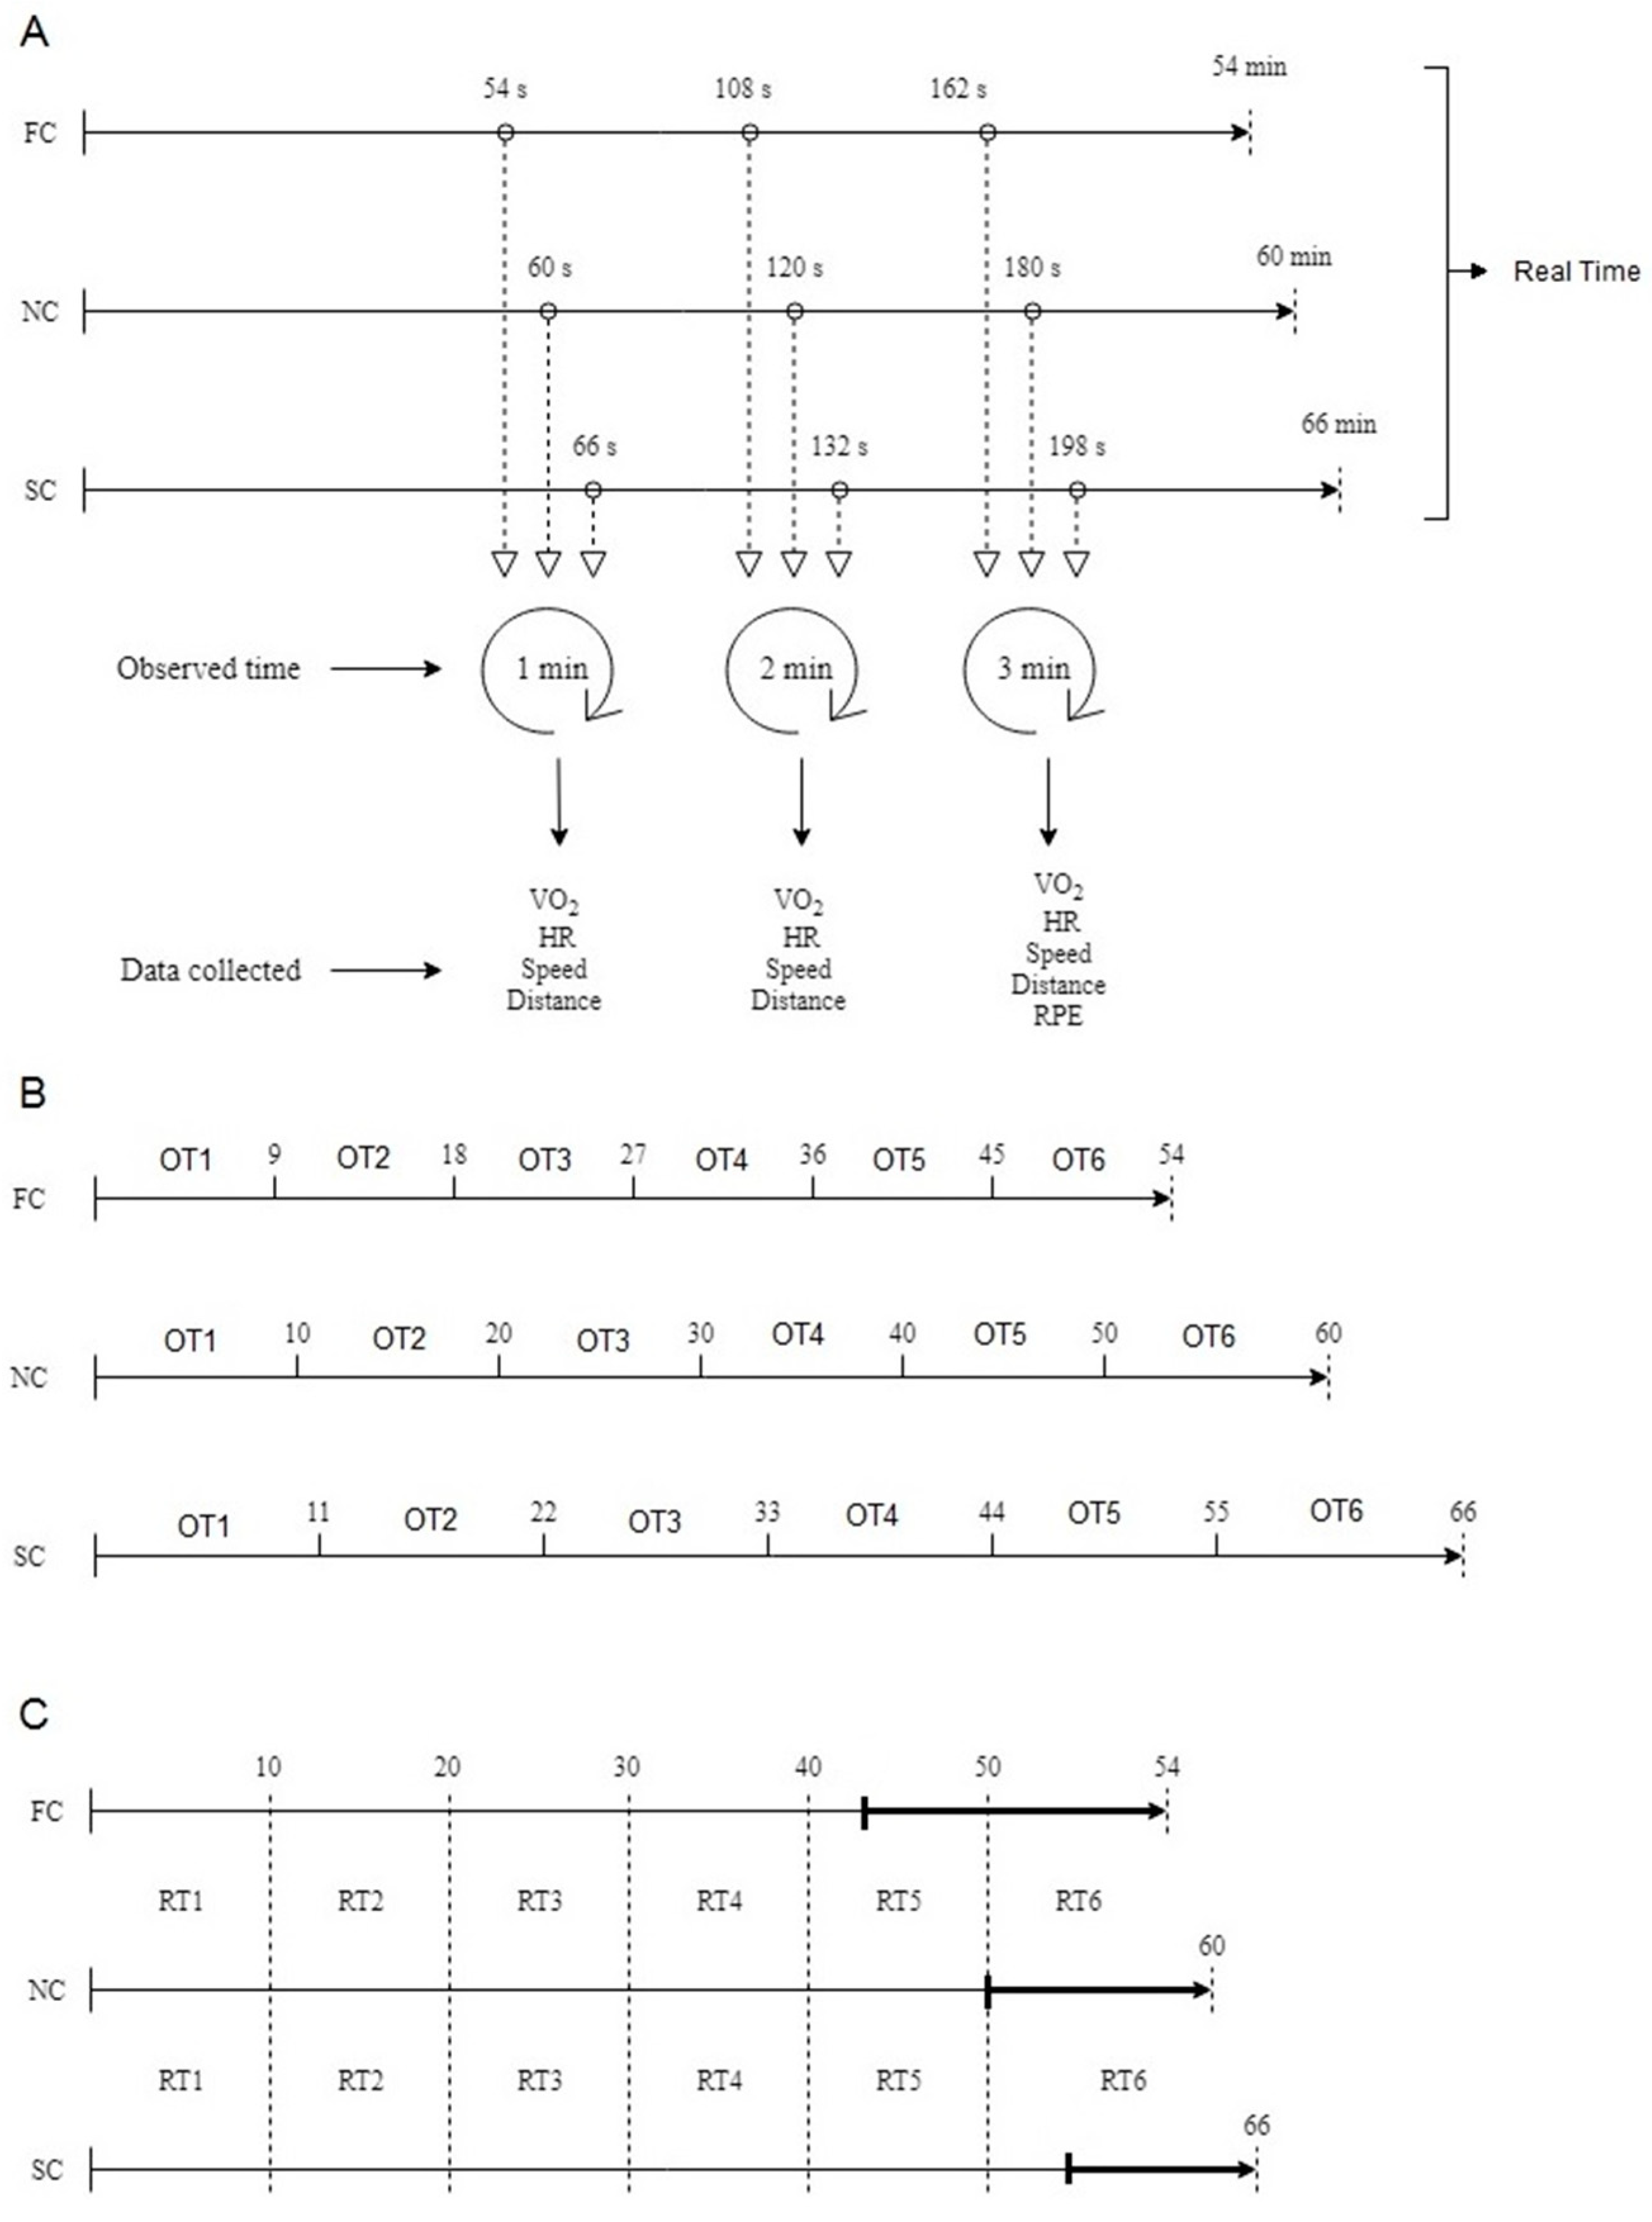
2.2. Overview
2.3. Maximal Aerobic Test Protocol
2.4. 60-Min Run Protocol
2.5. Statistical Analysis
3. Results
3.1. Overall Analysis
3.2. Real Time (RT) Analysis
3.2.1. Distance
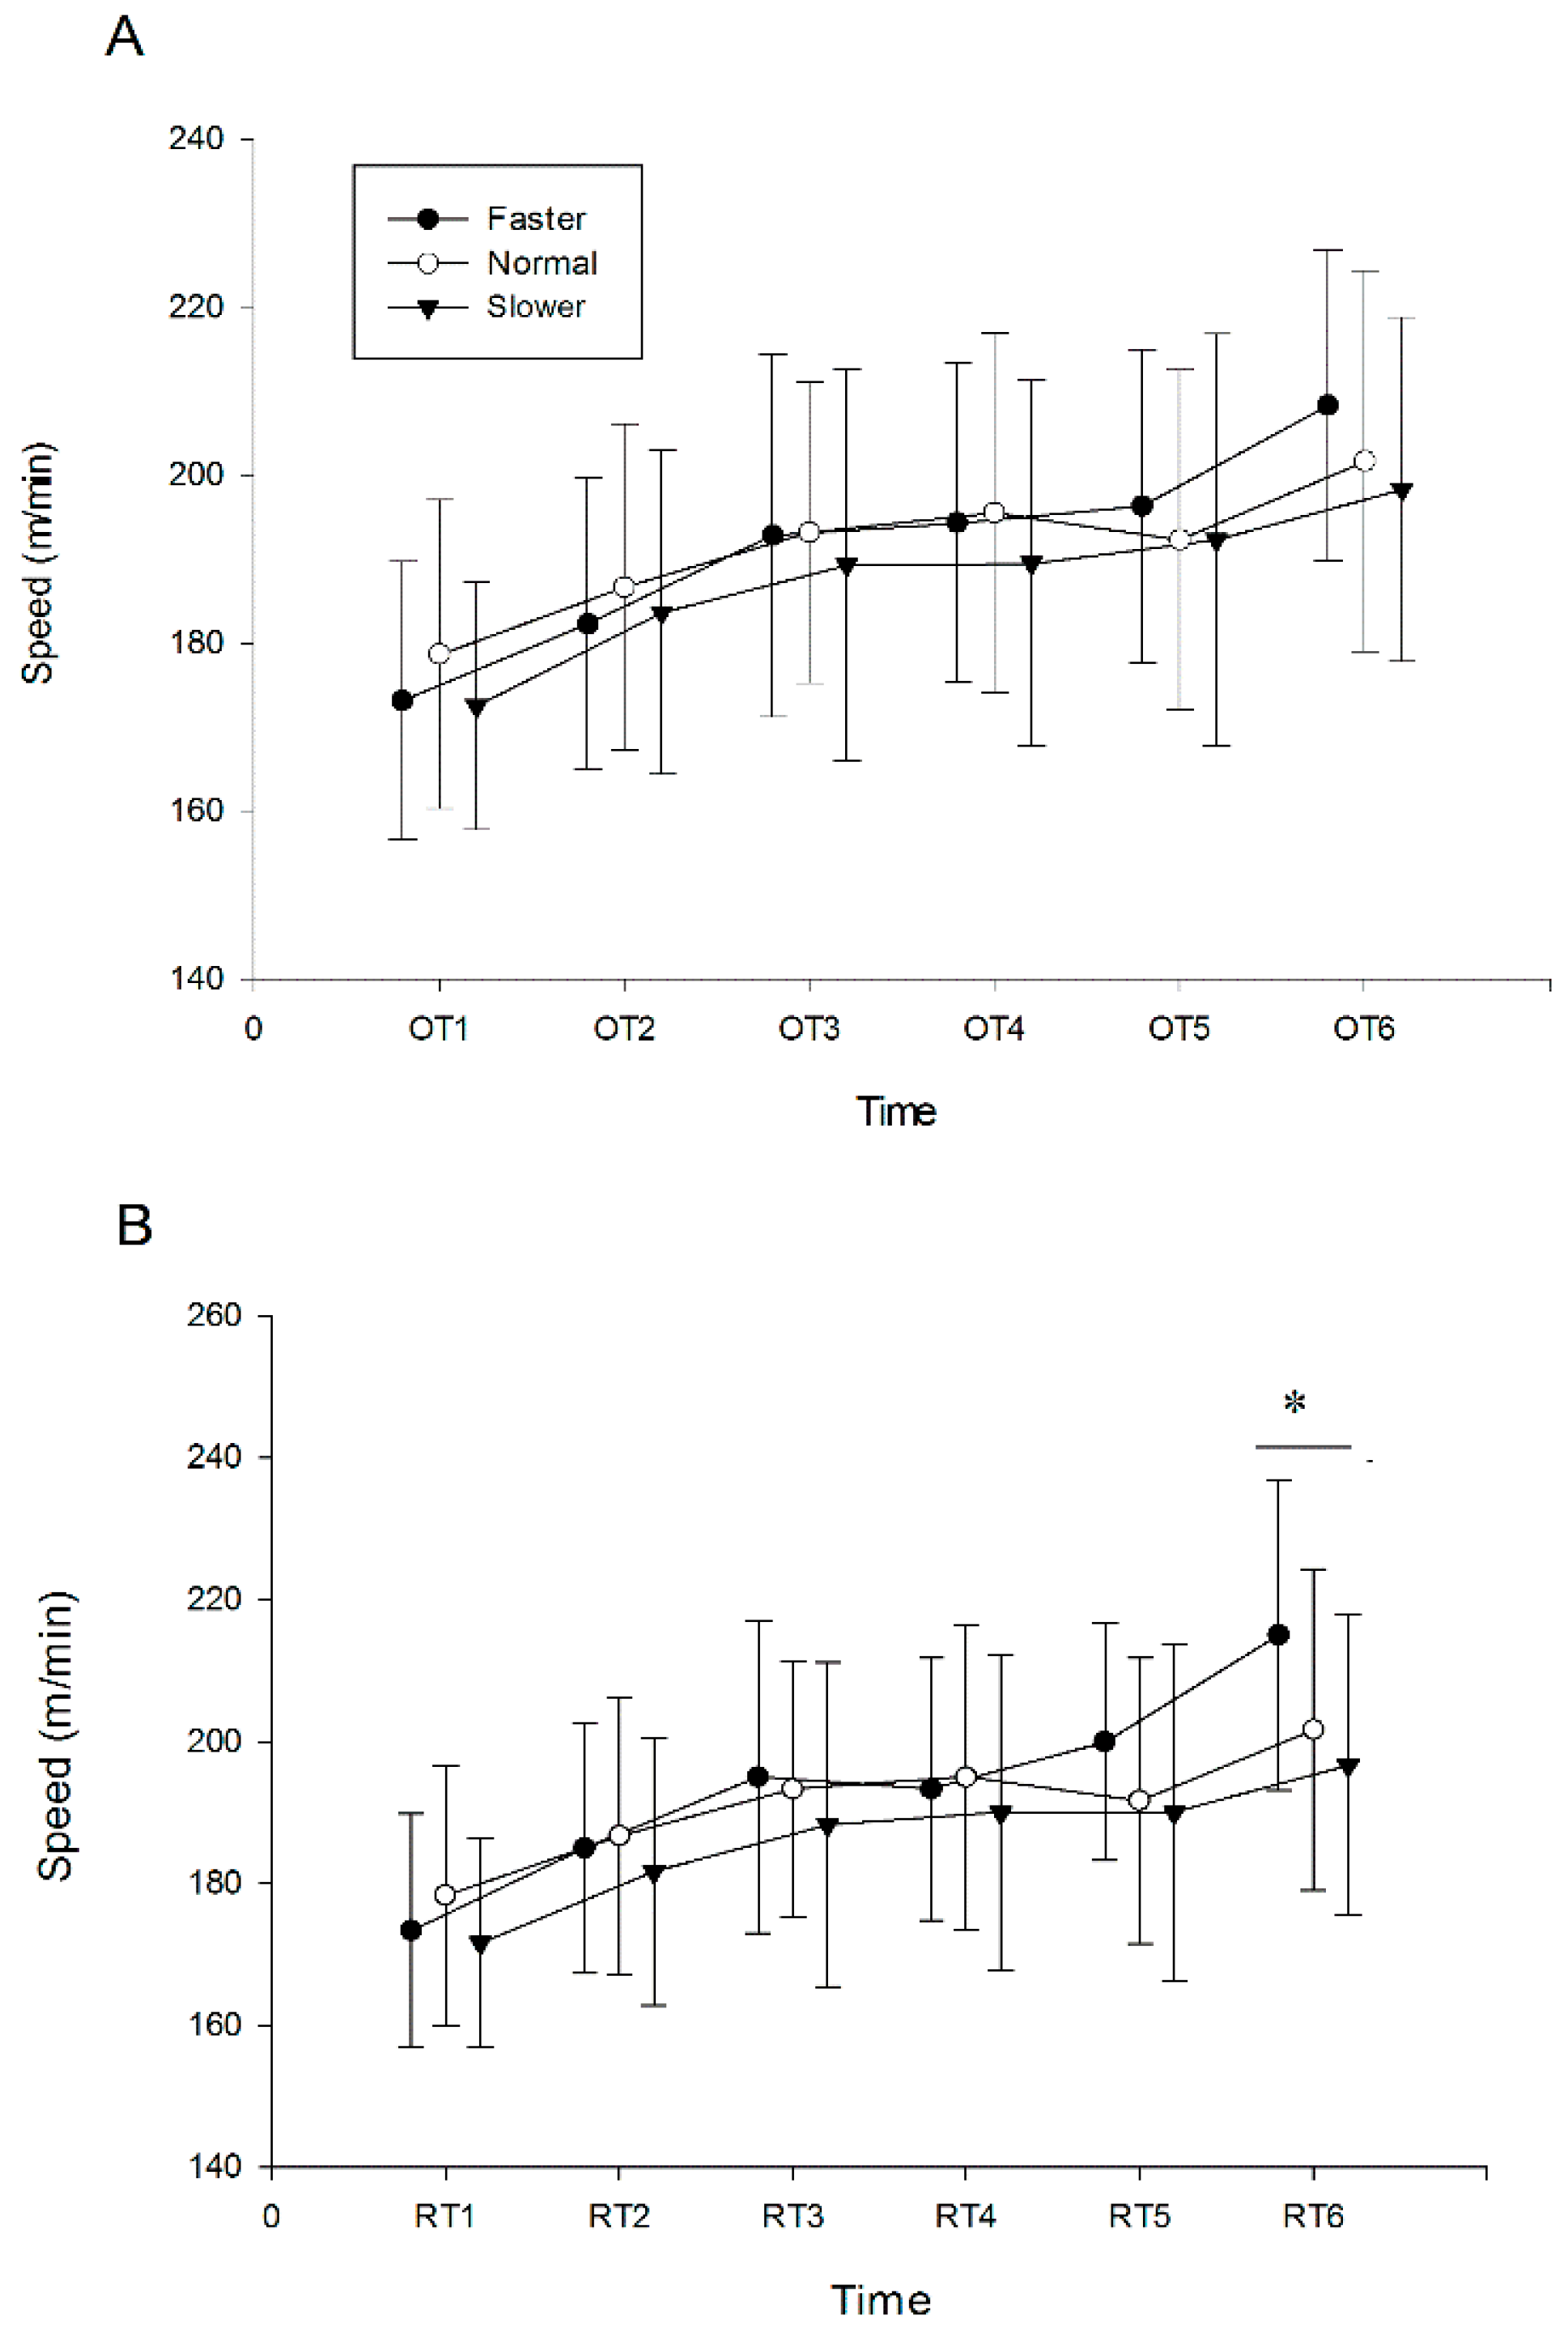
3.2.2. Speed
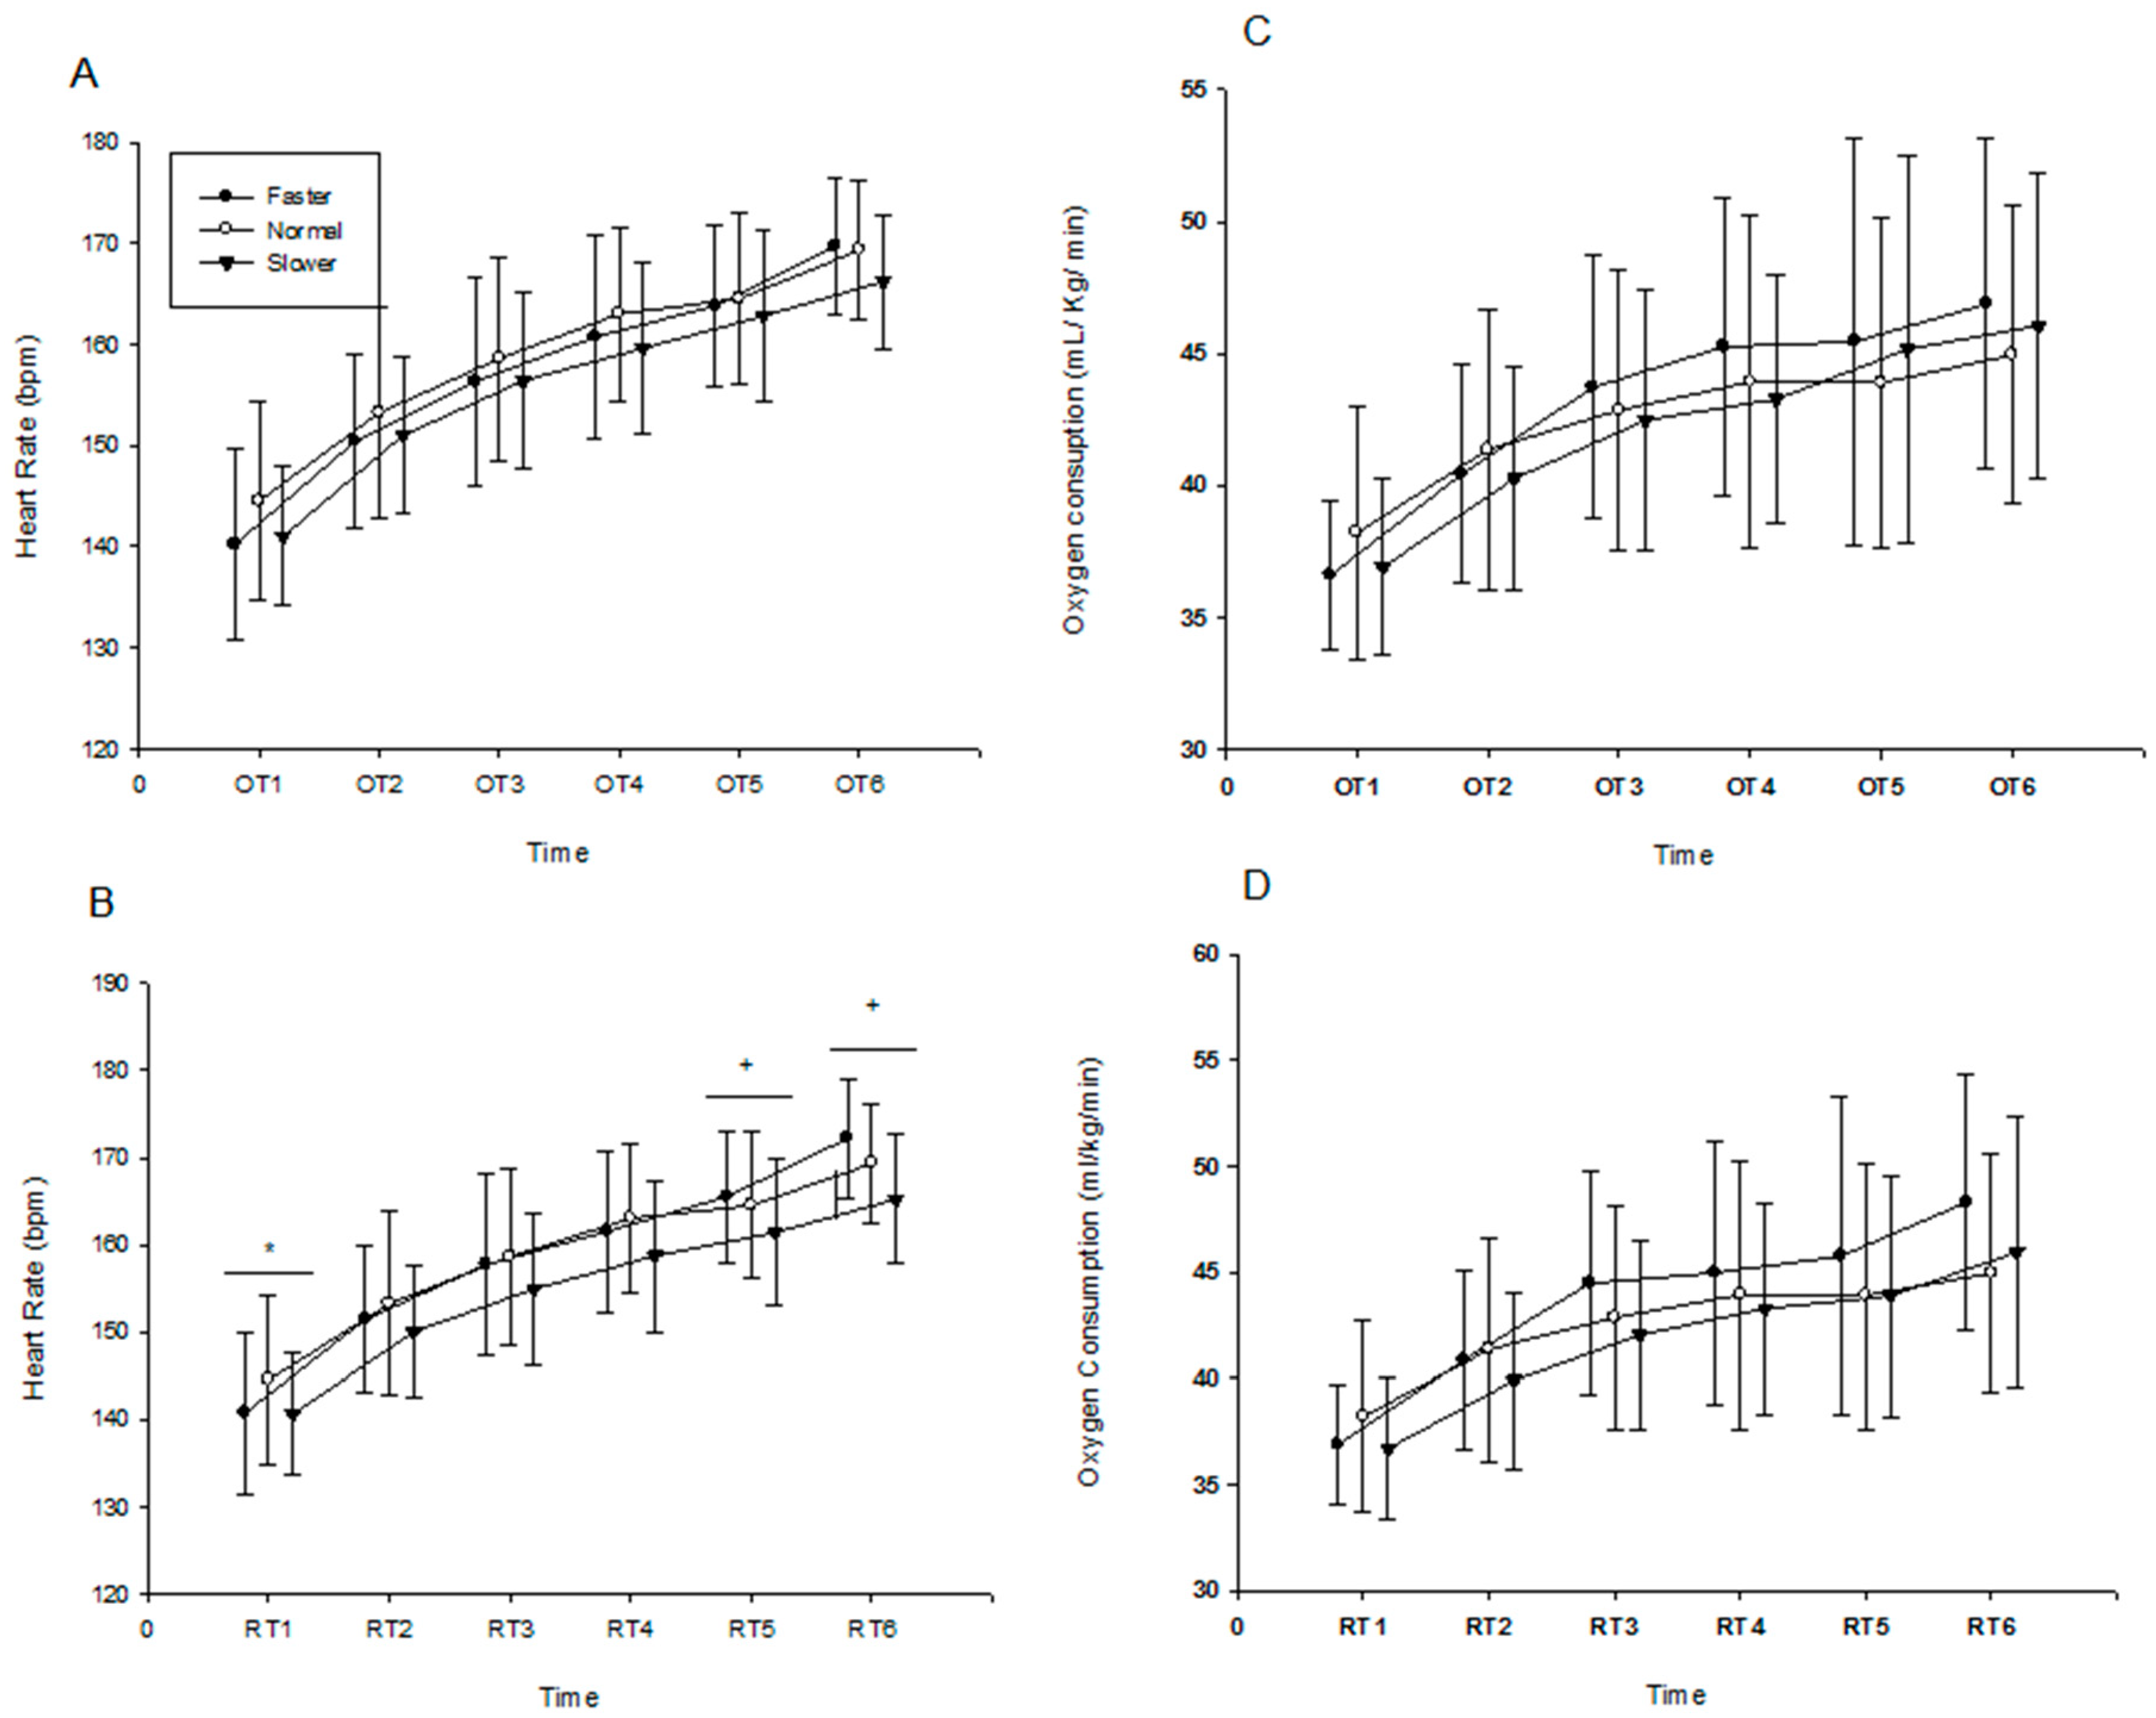
3.2.3. Heart Rate
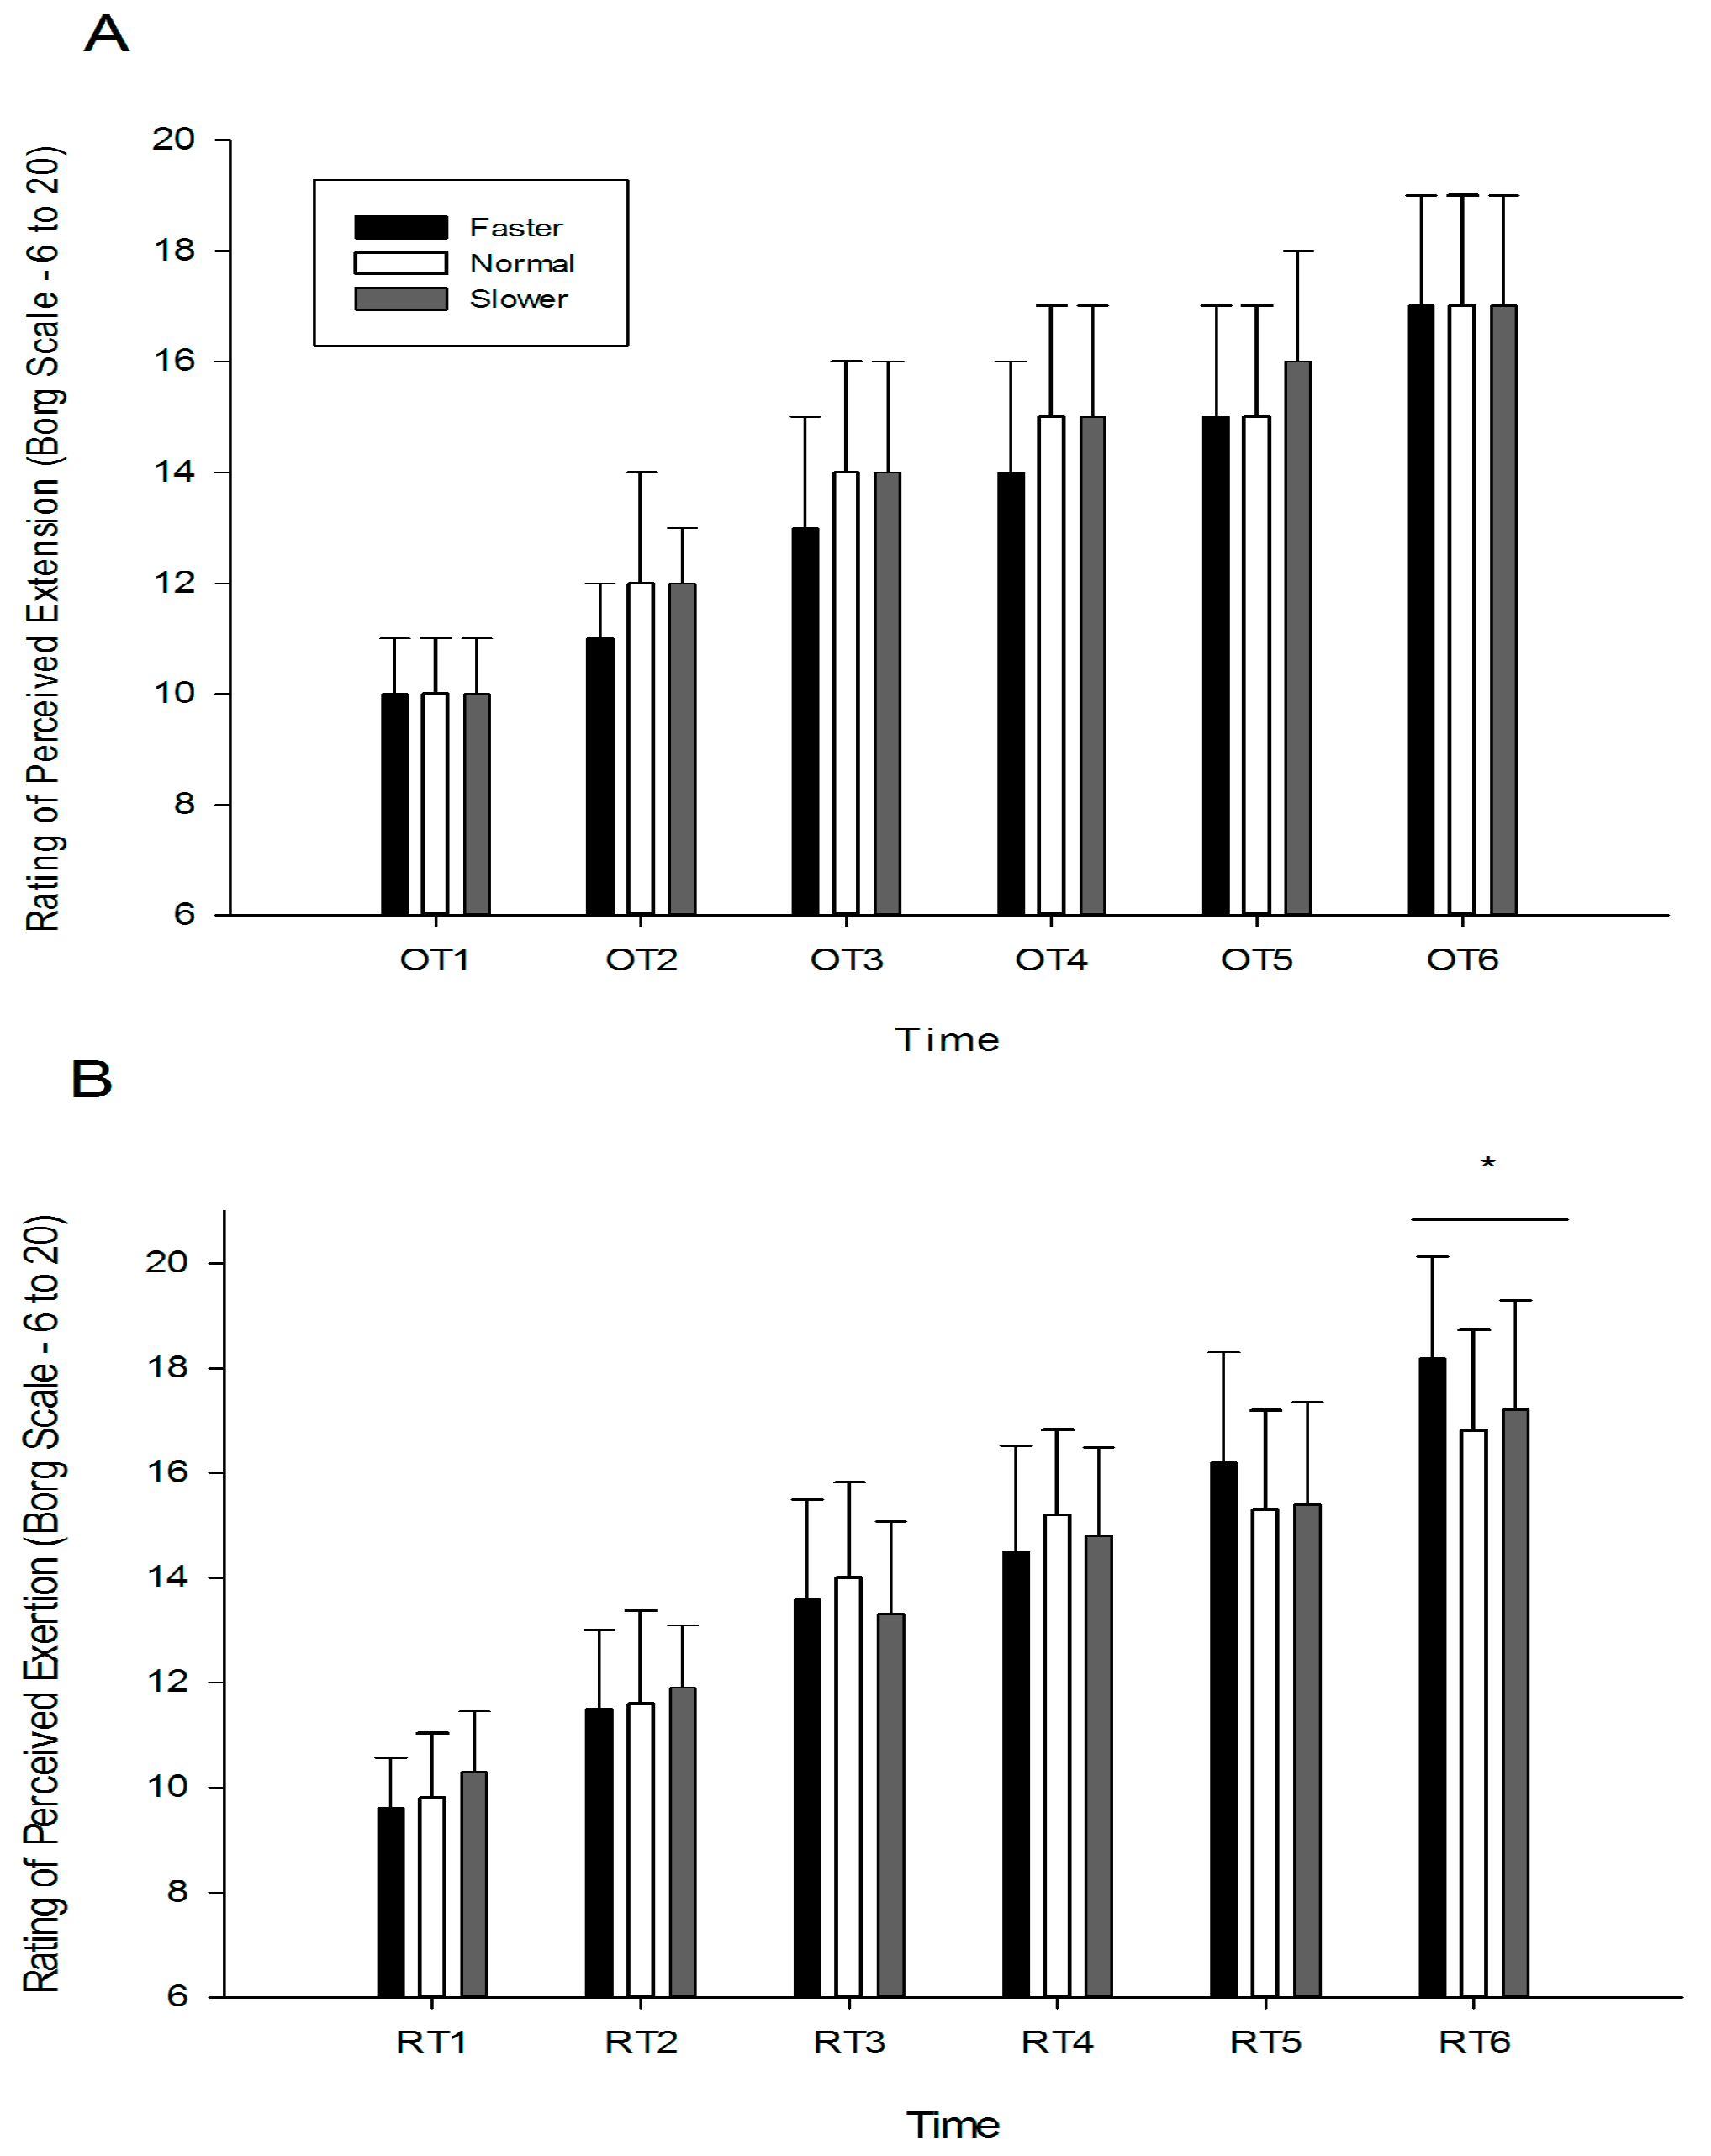
3.2.4. RPE
3.3. Observed Time (OT) Analysis
3.4. Last 10 Min
4. Discussion
4.1. Overall Performance
4.2. Physiological Variables
4.3. Pacing and Performance Based on Observed Time
4.4. Pacing and Performance Based on Real-Time
5. Conclusions
Author Contributions
Funding
Institutional Review Board Statement
Informed Consent Statement
Data Availability Statement
Acknowledgments
Conflicts of Interest
References
- Jones, H.S.; Williams, E.L.; Bridge, C.A.; Marchant, D.; Midgley, A.W.; Micklewright, D.; Mc Naughton, L.R.; Marchant, D. Physiological and Psychological Effects of Deception on Pacing Strategy and Performance: A Review. Sports Med. 2013, 43, 1243–1257. [Google Scholar] [CrossRef] [Green Version]
- Kayser, B. Exercise starts and ends in the brain. Graefe’s Arch. Clin. Exp. Ophthalmol. 2003, 90, 411–419. [Google Scholar] [CrossRef] [Green Version]
- Lambert, E.V.; St Clair Gibson, A.; Noakes, T.D. Complex systems model of fatigue: Integrative homoeostatic control of pe-ripheral physiological systems during exercise in humans. Br. J. Sports Med. 2005, 39, 52–62. [Google Scholar] [CrossRef] [Green Version]
- Noakes, T.D.; Gibson, A.S.C.; Lambert, E. From catastrophe to complexity: A novel model of integrative central neural regulation of effort and fatigue during exercise in humans: Summary and conclusions. Br. J. Sports Med. 2005, 39, 120–124. [Google Scholar] [CrossRef] [PubMed] [Green Version]
- Noakes, T.D. Time to move beyond a brainless exercise physiology: The evidence for complex regulation of human exercise performance. Appl. Physiol. Nutr. Metab. 2011, 36, 23–35. [Google Scholar] [CrossRef] [PubMed]
- St Gibson, A.C.; Lambert, E.V.; Rauch, L.H.G.; Tucker, R.; Baden, D.A.; Foster, C.; Noakes, T.D. The role of information pro-cessing between the brain and peripheral physiological systems in pacing and perception of effort. Sports Med. 2006, 36, 705–722. [Google Scholar] [CrossRef] [PubMed]
- Swart, J.; Lamberts, R.P.; Lambert, M.I.; Lambert, E.V.; Woolrich, R.W.; Johnston, S.; Noakes, T.D. Exercising with reserve: Exercise regulation by perceived exertion in relation to duration of exercise and knowledge of endpoint. Br. J. Sports Med. 2009, 43, 775–781. [Google Scholar] [CrossRef]
- Tucker, R. The anticipatory regulation of performance: The physiological basis for pacing strategies and the development of a perception-based model for exercise performance. Br. J. Sports Med. 2009, 43, 392–400. [Google Scholar] [CrossRef]
- Ulmer, H.V. Concept of an extracellular regulation of muscular metabolic rate during heavy exercise in humans by psycho-physiological feedback. Experientia 1996, 52, 416–420. [Google Scholar] [CrossRef]
- Williams, E.L.; Jones, H.S.; Sparks, S.; Marchant, D.C.; Micklewright, D.; McNaughton, L.R. Deception studies manipulating centrally acting performance modifiers: A review. Med. Sci. Sports Exerc. 2014, 46, 1441–1451. [Google Scholar] [CrossRef] [Green Version]
- Les Ansley, P.J.; Gibson, A.S.C.; Noakes, T.D. Anticipatory pacing strategies during supramaximal exercise lasting longer than 30 s. Med. Sci. Sports Exerc. 2004, 195, 309–314. [Google Scholar] [CrossRef]
- Baden, D.; McLean, T.L.; Tucker, R.; Noakes, T.D.; Gibson, A.S.C. Effect of anticipation during unknown or unexpected exercise duration on rating of perceived exertion, affect, and physiological function * Commentary. Br. J. Sports Med. 2005, 39, 742–746. [Google Scholar] [CrossRef] [Green Version]
- Eston, R.; Stansfield, R.; Westoby, P.; Parfitt, G. Effect of deception and expected exercise duration on psychological and physiological variables during treadmill running and cycling. Psychophysiol. 2012, 49, 462–469. [Google Scholar] [CrossRef]
- Morton, R.H. Deception by manipulating the clock calibration influences cycle ergometer endurance time in males. J. Sci. Med. Sport 2009, 12, 332–337. [Google Scholar] [CrossRef] [PubMed]
- Nikolopoulos, V.; Arkinstall, M.J.; A Hawley, J. Pacing strategy in simulated cycle time-trials is based on perceived rather than actual distance. J. Sci. Med. Sport 2001, 4, 212–219. [Google Scholar] [CrossRef]
- Palmer, G.S.; Backx, K.; Hawley, J.A. Perceived rather than actual distance determines pacing strategy during simulated cy-cling time trials. Med. Sci. Sports Exerc. 1998, 30, 305. [Google Scholar] [CrossRef]
- Paterson, S.; Marino, F.E. Effect of Deception of Distance on Prolonged Cycling Performance. Percept. Mot. Ski. 2004, 98, 1017–1026. [Google Scholar] [CrossRef]
- Thomas, G.; Renfree, A. The effect of secret clock manipulation on 10km cycle time. Int. J. Arts Sci. 2010, 3, 193–202. [Google Scholar]
- Wingfield, G.; Marino, F.E.; Skein, M. Deception of cycling distance on pacing strategies, perceptual responses, and neural activity. Pflügers Arch.-Eur. J. Physiol. 2018, 471, 285–299. [Google Scholar] [CrossRef] [PubMed]
- Wingfield, G.; Marino, F.; Skein, M. The influence of knowledge of performance endpoint on pacing strategies, perception of effort, and neural activity during 30-km cycling time trials. Physiol. Rep. 2018, 6, e13892. [Google Scholar] [CrossRef] [PubMed]
- Mastroianni, G.R.; Zupan, M.F.; Chuba, D.M.; Berger, R.C.; Wile, A.L. Voluntary pacing and energy cost of off-road cycling and running. Appl. Ergon. 2000, 31, 479–485. [Google Scholar] [CrossRef]
- Millet, G.Y.; Lepers, R. Alterations of Neuromuscular Function after Prolonged Running, Cycling and Skiing Exercises. Sports Med. 2004, 34, 105–116. [Google Scholar] [CrossRef] [PubMed]
- Millet, G.P.; Vleck, V.E.; Bentley, D.J. Physiological differences between cycling and running: Lessons from triathletes. Sports Med. 2009, 39, 179–206. [Google Scholar] [CrossRef]
- Midgley, A.W.; McNaughton, L.R.; Jones, A.M. Training to enhance the physiological determinants of long-distance running performance: Can valid recommendations be given to runners and coaches based on current scientific knowledge? Sports Med. 2007, 37, 857–880. [Google Scholar] [CrossRef]
- Tanaka, H.; Monahan, K.D.; Seals, D.R. Age—Predicted Maximal Heart Revisited. J. Am. Coll. Cardiol. 2001, 37, 153–156. [Google Scholar] [CrossRef] [Green Version]
- Åstrand, P.-O. Quantification of exercise capability and evaluation of physical capacity in man. Prog. Cardiovasc. Dis. 1976, 19, 51–67. [Google Scholar] [CrossRef]
- Saltin, B.; Astrand, P.O. Maximal oxygen uptake in athletes. J. Appl. Physiol. 1967, 23, 353–358. [Google Scholar] [CrossRef] [PubMed]
- Beltz, N.M.; Gibson, A.L.; Janot, J.M.; Kravitz, L.; Mermier, C.M.; Dalleck, L.C. Graded Exercise Testing Protocols for the Determination of VO2max: Historical Perspectives, Progress, and Future Considerations. J. Sports Med. 2016, 2016, 3968393. [Google Scholar] [CrossRef] [Green Version]
- Paulucio, D.; Nogueira, F.; Velasques, B.; Ribeiro, P.; Pompeu, F. Day-to-Day Variation of Cardiopulmonary Variables Obtained during an Incremental Cycling Test to Volitional Exhaustion. J. Exerc. Physiol. Online 2015, 18, 81–90. [Google Scholar]
- Howley, E.T.; Bassett, D.R.; Welch, H.G., Jr. Criteria for maximal oxygen uptake: Review and commentary. Med. Sci. Sports Exerc. 1995, 27, 1292–1301. [Google Scholar] [CrossRef]
- Sullivan, G.M.; Feinn, R. Using Effect Size—Or Why the P Value Is Not Enough. J. Grad. Med Educ. 2012, 4, 279–282. [Google Scholar] [CrossRef] [Green Version]
- Tucker, R.; Noakes, T.D. The physiological regulation of pacing strategy during exercise: A critical review. Br. J. Sports Med. 2009, 43, e1. [Google Scholar] [CrossRef] [PubMed]
- Faulkner, J.; Arnold, T.; Eston, R. Effect of accurate and inaccurate distance feedback on performance markers and pacing strategies during running. Scand. J. Med. Sci. Sports 2010, 21, e176–e183. [Google Scholar] [CrossRef]
- Abbiss, C.R.; Laursen, P.B. Describing and Understanding Pacing Strategies during Athletic Competition. Sports Med. 2008, 38, 239–252. [Google Scholar] [CrossRef] [PubMed]
- Amann, M.; Dempsey, J.A. Locomotor muscle fatigue modifies central motor drive in healthy humans and imposes a limita-tion to exercise performance. J. Physiol. 2008, 586, 161–173. [Google Scholar] [CrossRef] [PubMed]
- Amann, M.; Proctor, L.T.; Sebranek, J.J.; Pegelow, D.F.; Dempsey, J.A. Opioid-mediated muscle afferents inhibit central motor drive and limit peripheral muscle fatigue development in humans. J. Physiol. 2009, 587, 271–283. [Google Scholar] [CrossRef] [PubMed]


| Analysis | Chronometer | HR (bpm) | VO2 (mL/kg/min) | RPE (6 to 20 Borg Scale) | Speed (m/min) | Distance (km) |
|---|---|---|---|---|---|---|
| Overall | Faster | 157 ± 8 | 43.1 ± 5.0 | 14 ± 2 | 191.7 ± 16.7 | 10.3 ± 0.9 a |
| Normal | 159 ± 9 | 42.5 ± 5.0 | 14 ± 1 | 191.5 ± 18.3 | 11.5 ± 1.1 a | |
| Slower | 156 ± 7 | 42.4 ± 4.5 | 14 ± 2 | 188.3 ± 20.0 | 12.4 ± 1.3 a | |
| L10 | Faster | 169 ± 7 | 46.8 ± 6.7 | 17 ± 2 | 206.7 ± 18.3 b | 2.06 ± 0.18 b |
| Normal | 169 ± 7 | 44.9 ± 5.7 | 17 ± 2 | 201.7 ± 23.3 | 2.02 ± 0.23 | |
| Slower | 166 ± 7 | 46.1 ±5.8 | 17 ± 2 | 198.3 ± 20.0 b | 1.96 ± 0.20 b |
Publisher’s Note: MDPI stays neutral with regard to jurisdictional claims in published maps and institutional affiliations. |
© 2021 by the authors. Licensee MDPI, Basel, Switzerland. This article is an open access article distributed under the terms and conditions of the Creative Commons Attribution (CC BY) license (https://creativecommons.org/licenses/by/4.0/).
Share and Cite
Terra, A.; Paulucio, D.; Machado, M.; Bishop, D.J.; Koch, A.J.; Alvarenga, R.; Pompeu, F.A.M.S. Effect of Unaware Clock Manipulation on Pacing Strategy and Performance in Recreational Athletes. Appl. Sci. 2021, 11, 8062. https://doi.org/10.3390/app11178062
Terra A, Paulucio D, Machado M, Bishop DJ, Koch AJ, Alvarenga R, Pompeu FAMS. Effect of Unaware Clock Manipulation on Pacing Strategy and Performance in Recreational Athletes. Applied Sciences. 2021; 11(17):8062. https://doi.org/10.3390/app11178062
Chicago/Turabian StyleTerra, Augusto, Dailson Paulucio, Marco Machado, David J. Bishop, Alexander J. Koch, Renato Alvarenga, and Fernando A. M. S. Pompeu. 2021. "Effect of Unaware Clock Manipulation on Pacing Strategy and Performance in Recreational Athletes" Applied Sciences 11, no. 17: 8062. https://doi.org/10.3390/app11178062