
Potassium Release from Biomass Particles during Combustion—Real-Time In Situ TDLAS Detection and Numerical Simulation


1
Thermochemical Energy Conversion Laboratory, Department of Applied Physics and Electronics, Umeå University, 90187 Umeå, Sweden
2
Department of Energy Sciences, Lund University, 22100 Lund, Sweden
*
Author to whom correspondence should be addressed.
†
Current address: Physikalisch-Technische Bundesanstalt, Bundesallee 100, 38116 Braunschweig, Germany.
Appl. Sci. 2021, 11(19), 8887; https://doi.org/10.3390/app11198887
Submission received: 31 August 2021
/
Revised: 17 September 2021
/
Accepted: 19 September 2021
/
Published: 24 September 2021
(This article belongs to the Special Issue Diode Laser Spectroscopy – Robust Sensing for Environmental and Industrial Applications)
Abstract
:Potassium (K) is one of the main and most hazardous trace species released to the gas-phase during thermochemical conversion of biomass. Accurate experimental data and models of K release are needed to better understand the chemistry involved. Tunable diode laser absorption spectroscopy (TDLAS) is used for simultaneous real-time in situ measurements of gas-phase atomic K, water (H2O) and gas temperature in the vicinity (boundary layer) of biomass particles during combustion in a laboratory single-particle reactor. Atomic K is detected in a wide dynamic range, including optically thick conditions, using direct absorption spectroscopy at the wavelength of 770 nm, while H2O and temperature are determined by calibration-free scanned wavelength modulation spectroscopy at 1398 nm. The high accuracy and repeatability of the setup allows to distinguish measurements with varying initial particle mass, laser beam height above the particle and fuel type. Four types of biomass with different ash composition are investigated: softwood, Salix, Miscanthus and wheat straw. For Salix and wheat straw, the K release behaviour is, for the first time, compared to a detailed numerical particle model taking into account the interaction between K/S/Cl composition in the particle ash. A good agreement is achieved between the measured and calculated time-resolved atomic K concentrations for the devolatilization phase of the biomass particles.
1. Introduction
Biomass plays an increasingly important role as a renewable energy source for production of heat, power, transportation fuels and other chemicals via thermochemical conversion processes, such as combustion and gasification [1,2]. While high-quality woody biomass shows the most favourable combustion behaviour, the most promising and competitive types of biomass are agricultural, industrial and municipal waste products (streams), as well as fast-growing energy crops. However, biomass, in particular the low-grade types, contains large amounts of potassium (K) and other ash-forming elements that may form hazardous compounds in solid, liquid or gaseous phase. This causes severe operational problems, such as fouling, agglomeration and corrosion, in industrial boilers [3,4], which today prevents the large-scale use of these fuels. There is thus a need to understand and mitigate the problems related to harmful K species, and therefore, to accurately measure and model their behaviour during conversion.
The combustion behaviour of solid fuels, such as biomass pellets, is significantly affected by the conversion conditions (e.g., atmosphere, temperature) [5] and the chemical and physical properties of the fuel, which determine heat and mass transfer rates, reaction paths and reaction kinetics [6,7]. The main K species released to gas-phase during thermochemical biomass conversion are atomic K, potassium hydroxide (KOH) and potassium chloride (KCl) [8,9]. Usually, KOH dominates in combustion, due to the high oxygen availability, while under fuel-rich conditions, the atomic K concentration can be of the same order of magnitude as, or even exceed, the levels of KOH and KCl [10]. An efficient way to improve the understanding of fuel conversion is to perform well-controlled studies of volatile release from biomass particles combusted in laboratory reactors [11,12,13,14,15,16,17,18]. Small-scale single-particle reactors (SPRs) represent the conditions in a typical furnace, with medium temperatures and low heating rates, and allow to distinguish the main particle conversion phases: drying, devolatilization (or pyrolysis), char conversion and ash cooking.
Selective and quantitative in situ detection of all three main K species in high-temperature reacting flows requires relatively complex optical techniques [10,19,20,21]. However, gaseous atomic K, here referred to as K(g), provides a good indication of K release, especially during the devolatilization phase, and can be detected in a wide dynamic range and with high time-resolution using tunable diode laser-absorption spectroscopy (TDLAS) [10,16,22,23]. During recent decades, TDLAS, including direct absorption spectroscopy (DAS) and wavelength modulation spectroscopy (WMS), has become an established and widely utilized tool to measure gas parameters, such as major species and temperature, in thermochemical processes on various scales [24,25]. The technique enables fast in situ measurement with robust setups to obtain absolute species concentrations without calibration, which is particularly important for quantitative assessment of the highly reactive K species.
To understand and generalise the time-dependent K release behaviour for different biomass sources, a numerical model of the particle and its surrounding is highly valuable [2]. It is a way to develop a sub-model for the K release, which can subsequently be used in simulations of larger reactors with many particles. Experimental data obtained with optical techniques can be employed to validate such models [17], which is important for an increased understanding of the chemistry involved and improvement of the model. The particle model used in this study has been developed over the years [17,26,27,28,29,30] and was validated experimentally regarding particle mass loss, H2O concentration and gas temperature [17], as well as total K release [27]. However, the model predictions for the concentrations of the individual K species at the particle boundary layer have so far not been compared to selective, quantitative measurements of these K species.
In this work, a TDLAS spectrometer is used for simultaneous detection of K(g), H2O and gas temperature in the vicinity of biomass particles during combustion in a laboratory single-particle reactor, with the aim to enable a detailed comparison between measured and model-predicted K(g) release. The repeatability of the measurement is assessed and four different types of biomass are investigated. The experimental data for two of the fuels, wheat straw and Salix, are then compared to time-resolved simulations of K(g), H2O and temperature obtained using a numerical particle model that is solely based on the fuel composition and conversion conditions. The model predictions regarding other K and related species are discussed.
2. Materials and Methods
2.1. TDLAS Spectrometer
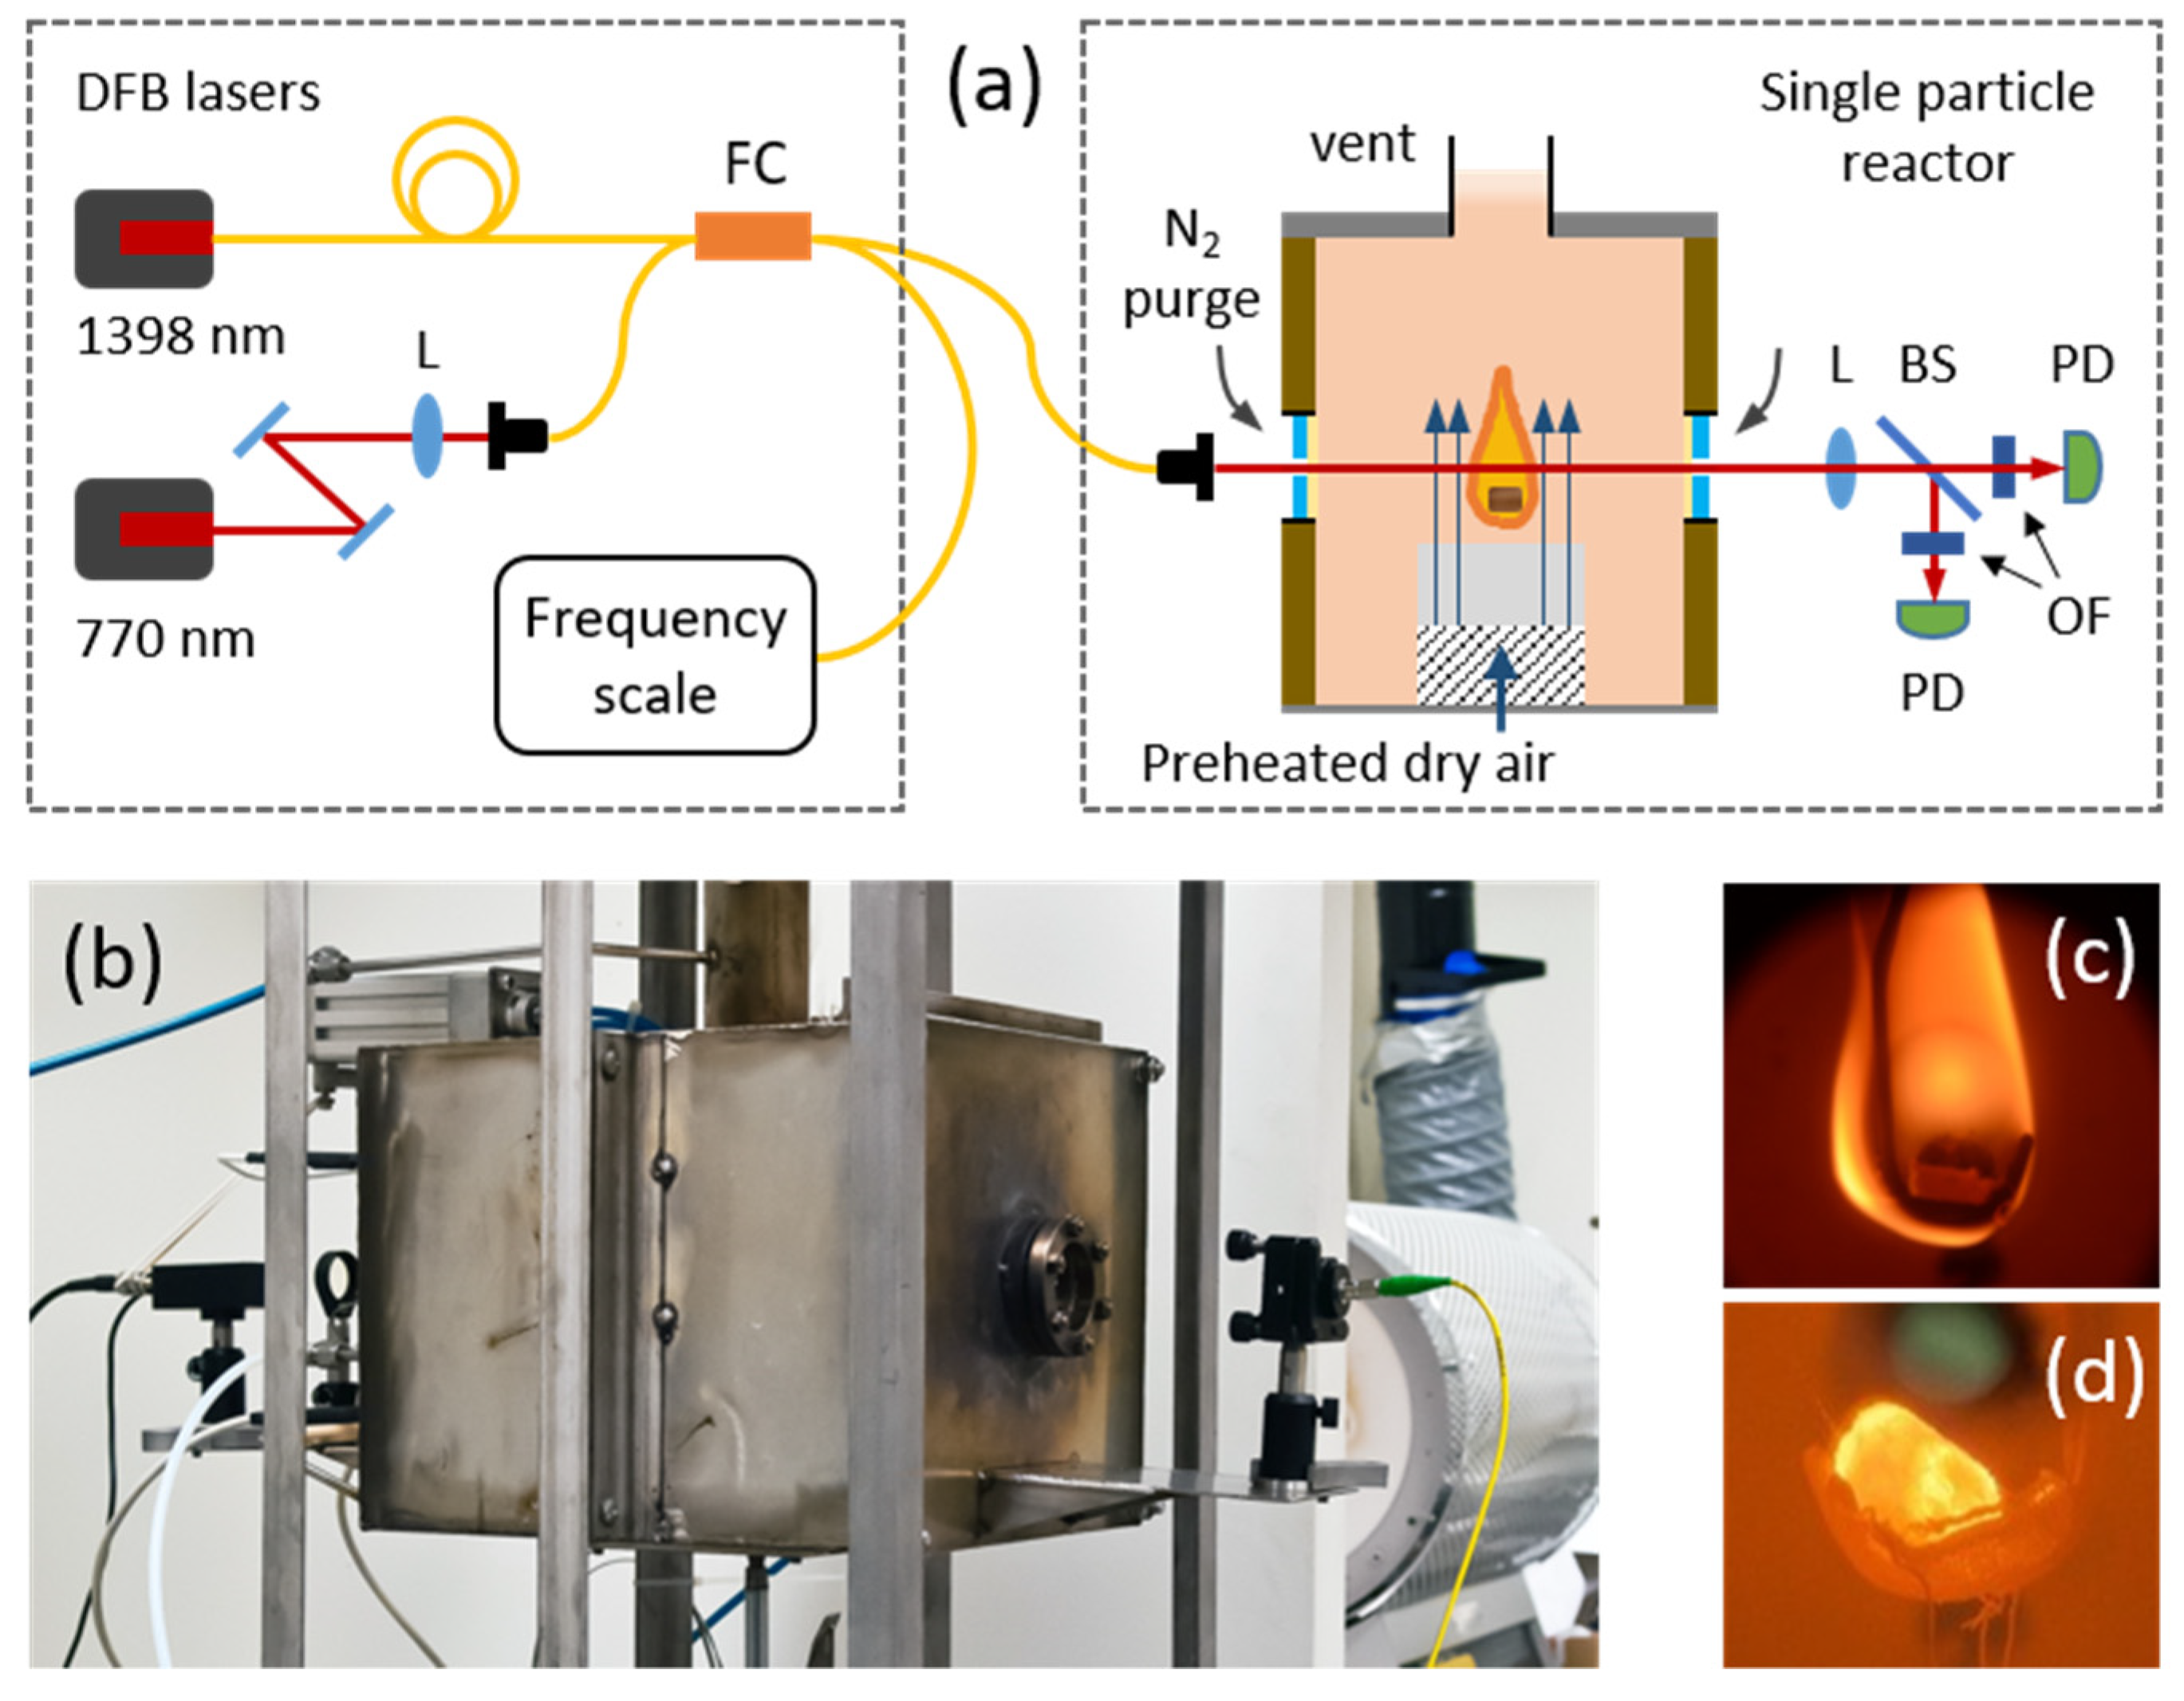
A schematic drawing of the experimental setup including the TDLAS spectrometer and the SPR is presented in Figure 1a. The TDLAS sensor comprised two distributed-feedback (DFB) diode lasers (Nanoplus, Gerbrunn, Germany), one operating around 770 nm for K(g) detection with DAS [16], and another that probed two H2O absorption peaks in the vicinity of 1398 nm using scanned calibration-free WMS (CF-WMS) to simultaneously retrieve path-averaged H2O concentration and H2O-weighted, path-averaged gas temperature [31]. Two-line thermometry is a viable alternative to thermocouples, specifically in high-temperature reacting flows [25,32,33]. The CF-WMS technique ensures high sensitivity, time resolution and baseline stability, which is beneficial in applications where large and unexpected changes in gas temperature and concentration may occur and a background signal without absorbers is difficult to obtain.
The 770 nm laser was scanned with a 200 Hz triangular wave (10 averages) around the electronic D1 transition of atomic K at 769.9 nm. Due to the large line strength (~106 cm−2/atm) of this transitions from the ground state to the first excited state, very low detection limits in the can be achieved. However, a large product of K line strength, concentration and absorption path length, can lead to optically thick conditions, with very high absorbance around the absorption line centre and transmitted light levels below the photodetector threshold. A curve fitting algorithm previously presented by Qu et al. [16] was used to analyse these saturated spectra, essentially by fitting the wings of the line shape. The 1398 nm laser was scanned with a triangular wave at 40 Hz (10 averages) to which a sinusoidal modulation at 8 kHz was added to perform CF-WMS. H2O concentration and temperature were simultaneously retrieved by least-squares fitting simulated to measured 1f-normalized 2f-WMS spectra, with temperature, concentration and nonlinear modulation amplitude as fitting parameters [31]. In all cases, the absorption path length was set to 20 mm, corresponding to the average flame size estimated visually.
The two laser beams were coupled into a single optical fibre via a fibre combiner (Newport, F-CPL-B12355, Deere AvenueIrvine, CA, USA) to simplify light distribution to the SPR. When passing above the biomass particle in the reactor, the co-aligned, collimated laser beams had a diameter of 1.2 mm. After exiting the SPR, the two-wavelength light was separated by a dichroic beam splitter and focused on suitable photodetectors (Thorlabs, PDA20CS and PDA36A, Newton, NJ, USA) for K(g) and H2O/temperature detection in a wavelength-multiplexed manner. Narrowband optical filters (Thorlabs, FB770-10 and FB1400-12) were installed in front of the detectors to ensure minimal interference due to stray light from the flame (during devolatilization, see Figure 1c) or the glowing biomass particle (during char conversion, see Figure 1d). Focusing the light on the photodetectors helped to minimize potential beam steering due to the flame. Synchronized waveform generation (National Instruments, PXI-5402, Cary, NC, USA) and data acquisition (National Instruments, PXIe-6356) boards installed in a PC were used to scan and modulate the lasers and acquire the detector signals, respectively. Prior to each measurement session, a part of the light was led through an uncoated, solid fused silica etalon with free spectral range of 1.5 GHz (SLS Optics) to obtain the relative frequency scale of the recorded spectra.
Based on previous work under well-controlled laboratory conditions, the overall measurement uncertainties in the SPR were estimated to 10% (relative) for K(g) and H2O and 50 K for temperature [16,31]. The dynamic range of the K(g) measurement was 106, from 40 parts per trillion by volume (pptv)·cm to 40 parts per million by volume (ppmv)·cm [16]. Taking into account the spectra averaging, and data deduction, the effective measurement time resolution was 1 s for both K(g) and H2O/temperature.
2.2. Single-Particle Reactor
A laboratory-scale SPR (Figure 1a,b) with internal dimensions of 200 mm × 130 mm × 130 mm was employed to combust the biomass particles [14,15,16,34]. The temperature of the electrically heated reactor was regulated by proportional-integral-derivative (PID) control using a thermocouple. Dry air carrier gas was supplied to the reactor from the bottom through a pre-heated stainless steel tube, a layer of steel-wool and a ceramic honeycomb structure to ensure a homogenous, laminar flow around the biomass particle. The biomass particles were placed in a sample holder made of platinum wires, which was hung in the centre of the SPR above the honeycomb carrier gas inlet using a stainless steel rod. The rod was connected to a micrometre translation stage used to adjust the distance between the particle and the laser beam, i.e., the height-above-particle (HAP). Platinum was used to avoid chemical reactions between the solid fuel (ash and melt) and sample holder material during conversion. A pneumatic system was employed to alternate the reactor positions between sample loading and sample conversion, the former being used to insert the particle into the SPR. Fuel ignition occurred within a few seconds after switching to the sample conversion position.
The SPR had small openings in the front and back wall, with diameters of 5 and 10 mm, respectively, that served as optical access ports through which the laser beams were aligned. The access ports (not equipped with glass windows in this study) were purged with nitrogen (N2) using a flow rate of 0.2–0.3 L/min to avoid background signals from ambient H2O and to prevent combustion gases from exiting the SPR though the ports. The optical components for aligning the laser beams through the reactor and for detection of the transmission were installed on breadboards mounted on the outer walls of the SPR. The combustion experiments were performed at an SPR set temperature of 1123 K and using a carrier flow rate of 4 L/min. In all experiments, only the drying/devolatilization phase (flame, see Figure 1c) and the char conversion phase (glowing particle, see Figure 1d) were recorded. The time point corresponding to the end of devolatilization, which is equivalent to the start of the char conversion, was distinguished visually (flame extinguished) and via the results of the optical measurements (atomic K significantly decreased; H2O below detection limit). The end of the char combustion phase was also visually confirmed.
2.3. Biomass Fuels
Four different types of biomass were used in the present study: a high-quality woody biomass (softwood from spruce), an agricultural residue (wheat straw) and two popular energy crops (Salix and Miscanthus) with high biomass yield and organic content. Arguably, of these fuels, the most relevant for the energy industry are wheat straw (availability, cost) and Salix (fast growing, energy density, chemical composition).
The four fuel types differed regarding their physical properties and chemical compositions (Table 1). The moisture contents, determined by standard wet chemical analysis, ranged from 6.1% to 10% for softwood and wheat straw, respectively. The softwood had the highest particle density, 1243.4 kg/m3, while it was only 243.4 kg/m3 for Miscanthus. The chemical composition differed with respect to total ash content as well as form and relative content of the major ash forming elements, notably K, calcium (Ca), silicon (Si) and chloride (Cl). Wheat straw contained the highest amount of K, followed by Miscanthus, Salix and softwood. However, wheat straw also included high amounts of Cl and Si. These differences will affect the K release behaviour of K during combustion.
Pelletized biomass was chosen to simulate realistic combustion conditions in industrial furnaces, although the larger particle size complicates the interpretation of the results as particle properties (e.g., size, heating rate, radial temperature gradient, chemical composition) change during conversion. Unless otherwise stated, the pellets used in this study were of cylindrical shape with a diameter of 8 mm and a mass of 500 ± 10 mg.
2.4. Numerical Particle Model
A numerical model of the particle and its surrounding is used to simulate the release behaviour of the K species from different biomass sources based on their chemical composition given in Table 1.
The particle model considers heat and mass transfer inside and outside of the particle, where gradients of species and temperature are resolved using an adaptive mesh. Particle shrinkage, evolution of porosity and multi-component diffusion are taken into account. Formation and subsequent reactions of the volatiles in the gas phase are also considered in the model. Since the focus of this paper is on the release of K, a global gas phase chemistry is used to model homogeneous volatile combustion [6,35]. A detailed description of the model, the governing equations and validations can be found in [17]. Recently, we developed a sub-model for the K release from biomass, where the interaction between K/S/Cl composition in the particle ash is taken into account [30]. This sub-model is explained in more detail in the following section.
Sub-Model for the Release of K/S/Cl from Biomass
The presence of organic and inorganic compounds in biomass, specifically potassium, sulphur and chlorine, poses a significant challenge in biomass thermochemical conversion systems. To understand the release behaviour of these species, a sub-model is added to the particle conversion model, where the temporal release of these species during biomass combustion is calculated. However, the release of K from biomass is highly dependent on other elements in the structure of biomass. Chlorine and sulphur, for instance, can significantly facilitate K release, while the presence of silicate and aluminium can lead to formation of stable compounds that stay in the ash structure. The current model takes into account the interaction between K, Cl and S through a set of elementary reactions.
Potassium can be found in organic and inorganic form in the biomass structure. Inorganic potassium in the form of K+ can form crystallized salts as the particle starts to dry. This process is considered in the model through the following reaction:
where the constant ϕ1 is calculated based on the Cl content by assuming that Cl in the biomass is mainly bonded to potassium [9]. The potassium in excess amount to stoichiometric Cl can be bonded to S, forming K2SO4, or bonded to the carbonate group as K2CO3.
The organic potassium is transformed to char-bonded potassium as the particle temperature increases. A part of the organic potassium is transformed into carboxyl groups, releasing atomic potassium into the gas phase [7]. The transformation and decomposition of the organic potassium is considered in the model through the following reactions:
It was suggested by van Lith et al. [11] that an ion-exchange reaction with chain-bonded carboxylic groups and KCl occurs, resulting in alkaline carboxylate and release of hydrogen chloride (HCl), as presented in the following reaction,
Evaporation of KCl is the main source of potassium and chlorine release at relatively low temperature, 970–1070 K [7,9,36]. This is considered in the model through reaction (R5),
At higher temperatures, potassium can be released through evaporation of K2SO4 or K2CO3 or reaction of these compounds with the gas phase H2O. A four step reaction scheme is considered in the model for high temperature release of potassium during the char combustion, as presented in the following reactions,
The final part of the model is related to the sulphur release. Not all sulphur in the biomass structure is bonded to potassium. A large portion of sulphur may be found in the free ion form, S2− [9]. A two-step reaction scheme is assumed for the release of sulphur, as follows,
The set of reactions, as presented above, provide the sub-model for the release of potassium. The kinetic rate constants and the complete set of assumptions and verification of the model can be found in [30].
3. Results and Discussion
3.1. Repeatability and Dependence on Initial Particle Mass
Figure 2 displays H2O concentration, gas temperature and K(g) concentration at HAP 4 mm above softwood particles as a function of conversion time. Figure 2a shows three repetitions for an initial particle mass of 500 ± 10 mg, whereas Figure 2b presents the results for four different initial particle masses (500, 600, 800 and 1000 mg). Since the H2O concentration during char combustion was below the detection limit of the TDLAS sensor (<0.1%), H2O and temperature could only be reliably assessed in the devolatilization stage (Dev.), while the K(g) time series includes the char conversion. The gas temperature above the particle during char burning was close to the SPR set temperature (1123 K).
The time series displayed in Figure 2a suggest that the pellet measurements performed with the current experimental setup are repeatable. Consistent results (shapes, absolute values, devolatilization time) were obtained for three softwood particles with the same initial mass for all parameters. A similarly high repeatability was also found for the other fuel types and at different heights above the pellets. Here, repeatability refers solely to the method and the experimental setup, not the biomass particles themselves, as the uniformity of the pelletized biomass is out of the scope of the current work. Local variations in fuel composition could be the reason for the small differences between the repeated measurement in Figure 2a, e.g., during char conversion. However, overall, the pellets used in this study seemed to have been uniform.
From the time series for different initial particle masses (Figure 2b) it can be observed that the average gas temperatures were comparable for all masses, but that the released H2O increased with mass, probably due to the larger absolute moisture content of the particles with larger mass. Another reason for the increase in H2O concentration could be that the larger pellets led to a larger flame/plume size, which was not accounted for in the spectra evaluation as the absorption path length was fixed to 2 cm. Moreover, the figure clearly shows that the devolatilization and overall conversion times increase with initial particle mass, as expected. However, interestingly, the K(g) concentrations are largely independent of particle mass, which points to conversion conditions and chemical composition being the main factors governing K release, not primarily the absolute K content.
3.2. Dependence on Biomass Type
Figure 3 displays (on the same scales) time series of simultaneously measured H2O, gas temperature and K(g) at HAP 4 mm above softwood (Figure 3a), Miscanthus (Figure 3b), wheat straw (Figure 3c) and Salix (Figure 3d) particles with initial mass of 500 ± 10 mg. In accordance with the energy density data shown in Table 1, the pyrolysis of woody-type fuels (softwood, Salix) takes longer than that of straw-based fuels (wheat straw, Miscanthus). Softwood has the highest energy density and longest devolatilization time (~60 s), while Miscanthus has the lowest energy density and shortest pyrolysis time (~40 s).
The measured H2O concentrations and flame temperatures are comparable for all fuels, except for wheat straw, which shows a higher temperature. With regard to softwood (Figure 2), for all fuels, significant K(g) levels are present only during the devolatilization stage. This is due to the flame, as the decomposition rates of gaseous KOH and KCl to atomic K increase with temperature, and the presumably fuel-rich conditions close to the particle, where the released compounds displace the air/oxygen. The detected K(g) concentrations are several orders of magnitude lower during char combustion, probably because of the lower gas temperature and higher oxygen availability favouring the formation of gaseous KOH instead of K(g). Similar trends for K(g), H2O and temperature were previously observed [12,14,16,23,37].
Wheat straw clearly shows the highest K(g) concentration during devolatilization (and largest total K(g) release), the main reason being the much higher total K content in the fuel (Table 1). However, while the original K content of wheat straw is 30 times larger than that that of softwood according to the table, the measured difference in K(g) concentration (and total release) is significantly smaller than 30. This is most likely because the potassium is released as KCl (high Cl content) or KOH rather than K(g), and that the concentrations of Si and Ca in wheat straw lead to the formation of K-containing compounds in the solid (ash) or liquid (slag) phase, such that less K is released to the gas phase. Interestingly, the study reveals distinct differences in K(g) release between the fuels during char conversion. For the woody biomass, K(g) concentrations were overall higher and increasing, whereas the opposite behaviour was found for the straw-based fuels, with the lowest concentrations observed for Miscanthus.
3.3. Comparison to Numerical Particle Model—Wheat Straw and Salix
The numerical particle model and the potassium release sub-model presented in Section 2.4 were used to simulate the particle conversion and K release behaviour for the given experimental conditions for two of the fuels. A straw-based biomass (wheat straw) and a woody-type biomass (Salix) were chosen for the comparison. The particle properties, ultimate and ash analysis of the samples presented in Table 1, were used as input parameters for the numerical model. According to reactions (R2), (R3) and (R10), the fractions of organic and inorganic potassium and sulphur should also be provided to the model. Ideally, these data are obtained through ash analysis. In this study, however, since the data were not available, the values were chosen based on data in the literature. It was assumed that 80% of the potassium is in the inorganic form and 50% of sulphur is in the free ion (S2−) form. These values were kept constant for both wheat straw and Salix. The numerical simulation resulted in time-dependent data for volatile release from the fuel during conversion and a corresponding 2D representation of the gas phase boundary layer around the particle. The 2D concentration data was averaged along the line-of-sight at given HAPs to obtain concentration values that can be compared to the TDLAS results.
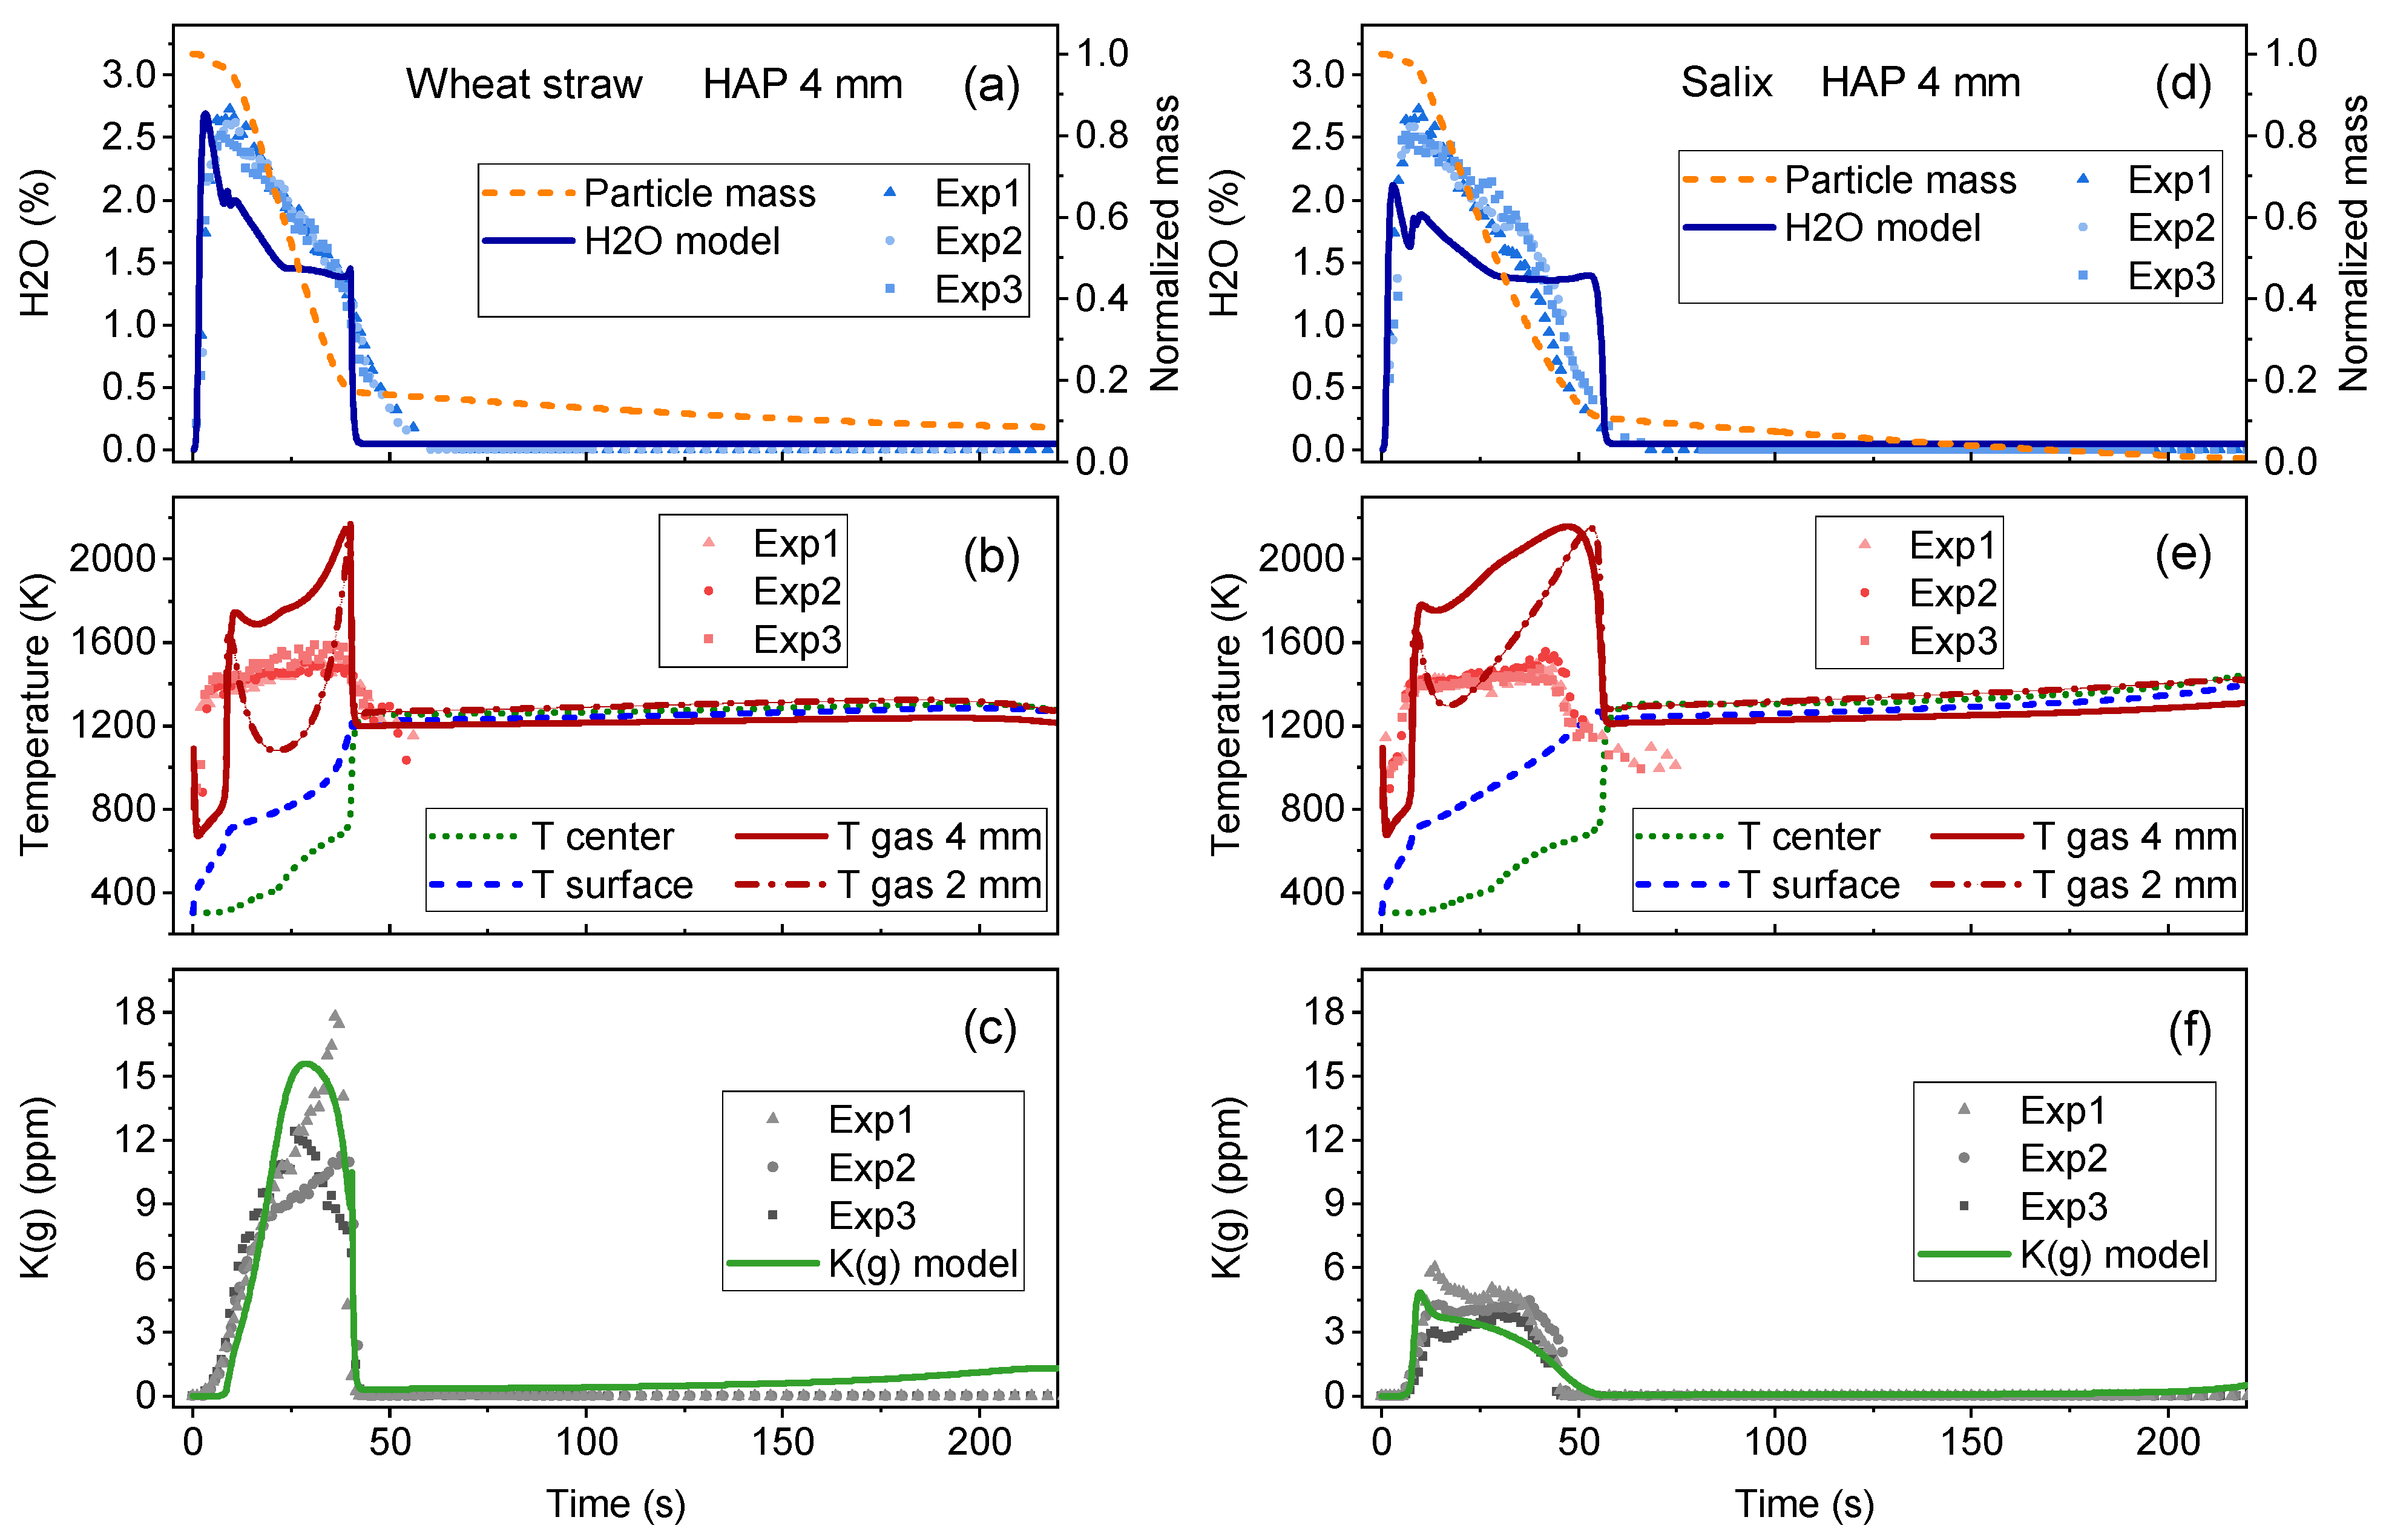
Figure 4 presents a comparison between TDLAS-measured (3 replicates) and model-predicted average H2O concentration, gas temperature and average K(g) concentration for wheat straw (Figure 4a–c) and Salix (Figure 4d–f) at a HAP of 4 mm. In addition to H2O, panels (a) and (d) also display the predicted normalized particle mass during conversion. In Figure 4b,e, the experimental gas temperature at HAP 4 mm is compared to the predicted temperature at HAP 2 and HAP 4 mm, as well as the predicted temperatures at the particle centre and surface. Overall, a similar behaviour is observed for the two fuels. The minor differences stem from the higher ash content of the wheat straw samples and the differences in the particle densities, as presented in Table 1. As seen in both experiments and simulation, the devolatilization process was shorter for the wheat straw particle (~40 s) than for Salix (~50 s).
The present particle model was already validated concerning H2O concentration, gas temperature and mass loss in a previous study using a similar experimental setup [17]. Additionally, in this work, measured and simulated H2O concentrations are close. As concluded in the study by Fatehi et al. [17], the discrepancy in gas temperature at a given HAP can be explained by the fact that a global reaction mechanism was used and that the TDLAS data provide an average (and H2O-weighted) temperature across the flame (and hot flame front). Figure 4b,e shows that the modelled temperature is considerably lower at HAP 2 mm than at HAP 4 mm, such that the average between these two would correspond rather well to the measured temperature. In general, the experimental results represent an axial average due to the finite size of the laser beam (diameter 1.2 mm).
An excellent agreement is found between the measured and simulated K(g) concentration profiles of both wheat straw and Salix (Figure 4c,f). During devolatilization, a significantly lower concentration is correctly predicted for Salix. In the char combustion phase, the measured K(g) is around a factor of 10 lower than the model prediction, presumably because the actual combustion conditions during that phase were different from those assumed in the simulation.
Figure 5 shows a more detailed comparison between model-predicted and experimental K(g) concentrations at HAP 2, 4 and 8 mm, focusing on the devolatilization. A good agreement is achieved, where the model predictions are well within the experimental range. In general, K(g) decreases with increasing HAP. Since the gas phase reaction kinetics were not modelled, this indicates that diffusion is the dominant process, and that the hot plume was increasingly diluted by the surrounding air at higher HAP. The good agreement is also evident from the shape of the K(g) time series during devolatilization. For Salix, a concentration peak is observed in the beginning, after which the level is fairly constant. However, for wheat straw, the concentration is first low and then rises steadily until a maximum is reached at the end of devolatilization. This is most probably due to the high availability of quickly volatilising chlorine in wheat straw (Table 1), leading to the release or formation of KCl instead of K(g).
An important input parameter that can affect the outcome of the model is the fraction of organic K in the ash. According to reaction R3, the release of atomic K is directly proportional to the available organic K, thus, by increasing the organic content in the model, higher values of K(g) can be expected. In future studies, the amounts of organic and inorganic K should be determined through the ash analysis to directly improve the predictability of the model. However, one should note that the ratio between organic and inorganic K in the biomass ash cannot be chosen arbitrarily. There are some limitations related to the amount of Cl in the ash: since chlorine is primarily bonded to potassium, the inorganic K content is at least equal to the stoichiometric Cl content. The percentage of organic/inorganic sulphur, on the other hand, mainly affects the release of SO2 (not measured in this work) and has negligible effect on the final K release.
3.4. Model Predictions for KOH and KCl Release
In order to give an overview of the expected release behaviour of all three main K species, Figure 6 presents the concentrations of gaseous KOH, KCl, K(g), HCl and chloromethane (CH3Cl) for wheat straw (Figure 6a,b) and Salix (Figure 6c,d) as predicted by the numerical model. Panels (a) and (c) show the devolatilization phase in detail, while panels (b) and (d) display both devolatilization and char combustion.
Evidently, for the conversion conditions used in this work, the simulations predict that atomic K is a minor compound compared to KCl and KOH, which are highly abundant. KCl dominates in the beginning of the pyrolysis, due to the high availability of chlorine gas, whereas in the char conversion phase, as the particle temperature increases and oxygen reaches the particle, KOH starts to be released (Figure 6a,b). A similar behaviour was also observed experimentally [12].
As expected from the fuel composition, the concentrations of the K species and the total K release are much higher for wheat straw than for Salix. For example, >100 times more KCl is released from wheat straw compared to the Salix sample, due to the high Cl (and K) content in the straw-based biomass. As presented in Table 1, chlorine accounts for 7% of the ash in wheat straw, while this value is only 0.7% in the case of Salix. Thus, chlorine facilitates the release of potassium during devolatilization through evaporation of KCl. Apart from the K species, small amounts of HCl and CH3Cl are also released during pyrolysis. However, the mass fractions of these species are orders of magnitude lower than those of KCl. Future studies comparing the particle model to experimental data should include measurements of KOH and KCl. The model can be improved by including the gas-phase reactions of the trace elements (K/Cl/S) in the vicinity of the particle.
4. Conclusions
In this work, a robust wavelength-multiplexed TDLAS spectrometer was employed for simultaneous time-resolved detection of atomic potassium, H2O and gas temperature close to softwood, Miscanthus, wheat straw and Salix particles combusted in a laboratory reactor. The experimental approach enabled precise and repeatable K(g) measurements in both the devolatilization and the char conversion phase. During devolatilization, K(g) concentrations were several orders of magnitude higher than during char combustion, with wheat straw releasing the most K(g) overall. The fact that the measured K(g) concentrations were largely independent of particle mass points to chemical composition and conversion conditions being the main factors that govern K release, not primarily the absolute K content in the fuel. For wheat straw and Salix, the experimental K(g) data were, for the first time, compared to simulations of the K(g) release behaviour using a numerical particle model solely based on the fuel composition and reactor operating conditions. A good agreement was observed, providing confidence in the model, which further predicts that for combustion KCl and K(g) dominate during devolatilization and KOH during char conversion. The work constitutes a first step towards validating the model predictions for the distribution of volatile K between gaseous K(g), KOH and KCl.
Author Contributions
Conceptualization, F.M.S.; experimental realisation and data collection, Z.Q. and F.M.S.; numerical simulations, H.F.; writing—original draft preparation, F.M.S., Z.Q. and H.F.; writing—review and editing, F.M.S.; visualization, F.M.S. All authors have read and agreed to the published version of the manuscript.
Funding
F. M. Schmidt gratefully acknowledges funding from the Swedish Energy Agency (project no. 36160-1), the Kempe foundations (project no. JCK-1316), and the Swedish strategic research program Bio4Energy. H. Fatehi acknowledges the support from the Swedish Energy Agency through KC-CECOST, project no. 22538-4. The computations were performed on resources provided by the Swedish National Infrastructure for Computing (SNIC) at PDC (Beskow).
Institutional Review Board Statement
Not applicable.
Informed Consent Statement
Not applicable.
Data Availability Statement
Data supporting the results of this work can be obtained from the corresponding author upon reasonable request.
Conflicts of Interest
The authors declare no conflict of interest.
References
- European Commission. Renewable Energy Road Map–Renewable energies in the 21st century: Building a more sustainable future. In Communication from the Commission to the Council of the European Parliament, COM; European Commission: Brussels, Belgium, 2007. [Google Scholar]
- Fatehi, H.; Weng, W.; Li, Z.; Bai, X.-S.; Aldén, M. Recent Development in Numerical Simulations and Experimental Studies of Biomass Thermochemical Conversion. Energy Fuels 2021, 35, 6940–6963. [Google Scholar] [CrossRef]
- Demirbas, A. Potential applications of renewable energy sources, biomass combustion problems in boiler power systems and combustion related environmental issues. Prog. Energ. Combust. 2005, 31, 171–192. [Google Scholar] [CrossRef]
- Hupa, M. Ash-related issues in fluidized-bed combustion of biomasses: Recent research highlights. Energy Fuels 2011, 26, 4–14. [Google Scholar] [CrossRef]
- Schurmann, H.; Monkhouse, P.B.; Unterberger, S.; Hein, K.R.G. In situ parametric study of alkali release in pulverized coal combustion: Effects of operating conditions and gas composition. Proc. Combust. Inst. 2007, 31, 1913–1920. [Google Scholar] [CrossRef]
- Ranzi, E.; Cuoci, A.; Faravelli, T.; Frassoldati, A.; Migliavacca, G.; Pierucci, S.; Sommariva, S. Chemical kinetics of biomass pyrolysis. Energy Fuels 2008, 22, 4292–4300. [Google Scholar] [CrossRef]
- Van Lith, S.C.; Jensen, P.A.; Frandsen, F.J.; Glarborg, P. Release to the gas phase of inorganic elements during wood combustion. Part 2: Influence of fuel composition. Energy Fuels 2008, 22, 1598–1609. [Google Scholar] [CrossRef]
- Jenkins, B.; Baxter, L.; Miles, T., Jr.; Miles, T. Combustion properties of biomass. Fuel Process. Technol. 1998, 54, 17–46. [Google Scholar] [CrossRef]
- Knudsen, J.N.; Jensen, P.A.; Dam-Johansen, K. Transformation and release to the gas phase of Cl, K, and S during combustion of annual biomass. Energy Fuels 2004, 18, 1385–1399. [Google Scholar] [CrossRef]
- Thorin, E.; Schmidt, F.M. TDLAS-based photofragmentation spectroscopy for detection of K and KOH in flames under optically thick conditions. Opt. Lett. 2020, 45, 5230–5233. [Google Scholar] [CrossRef]
- Van Lith, S.C.; Alonso-Ramírez, V.; Jensen, P.A.; Frandsen, F.J.; Glarborg, P. Release to the gas phase of inorganic elements during wood combustion. Part 1: Development and evaluation of quantification methods. Energy Fuels 2006, 20, 964–978. [Google Scholar] [CrossRef]
- Sorvajarvi, T.; DeMartini, N.; Rossi, J.; Toivonen, J. In situ measurement technique for simultaneous detection of K, KCl, and KOH vapors released during combustion of solid biomass fuel in a single particle reactor. Appl. Spectrosc. 2014, 68, 179–184. [Google Scholar] [CrossRef] [PubMed]
- Sommersacher, P.; Kienzl, N.; Brunner, T.; Obernberger, I. Simultaneous online determination of S, Cl, K, Na Zn and Pb release from a single particle during biomass combustion Part 1: Experimental setup-implementation and evaluation. Energy Fuels 2015, 29, 6734–6746. [Google Scholar] [CrossRef]
- Qu, Z.; Schmidt, F.M. In situ H2O and temperature detection close to burning biomass pellets using calibration-free wavelength modulation spectroscopy. Appl. Phys. B 2015, 119, 45–53. [Google Scholar] [CrossRef] [Green Version]
- Fagerström, J.; Steinvall, E.; Boström, D.; Boman, C. Alkali transformation during single pellet combustion of soft wood and wheat straw. Fuel Process. Technol. 2016, 143, 204–212. [Google Scholar] [CrossRef]
- Qu, Z.; Steinvall, E.; Ghorbani, R.; Schmidt, F.M. Tunable diode laser atomic absorption spectroscopy for detection of potassium under optically thick conditions. Anal. Chem. 2016, 88, 3754–3760. [Google Scholar] [CrossRef] [Green Version]
- Fatehi, H.; Schmidt, F.M.; Bai, X.-S. Gas phase combustion in the vicinity of a biomass particle during devolatilization—Model development and experimental verification. Combust. Flame 2018, 196, 351–363. [Google Scholar] [CrossRef]
- Weng, W.; Li, S.; Costa, M.; Li, Z. Quantitative imaging of potassium release from single burning pulverized biomass char particles. Fuel 2020, 264, 116866. [Google Scholar] [CrossRef]
- Monkhouse, P. On-line spectroscopic and spectrometric methods for the determination of metal species in industrial processes. Prog. Energ. Combust. 2011, 37, 125–171. [Google Scholar] [CrossRef]
- Sorvajärvi, T.; Toivonen, J. Principles and calibration of collinear photofragmentation and atomic absorption spectroscopy. Appl. Phys. B 2013, 115, 533–539. [Google Scholar] [CrossRef] [Green Version]
- Weng, W.; Zhang, Y.; Wu, H.; Glarborg, P.; Li, Z. Optical measurements of KOH, KCl and K for quantitative K-Cl chemistry in thermochemical conversion processes. Fuel 2020, 271, 117643. [Google Scholar] [CrossRef]
- Schlosser, E.; Fernholz, T.; Teichert, H.; Ebert, V. In situ detection of potassium atoms in high-temperature coal-combustion systems using near-infrared-diode lasers. Spectrochim Acta A 2002, 58, 2347–2359. [Google Scholar] [CrossRef]
- Weng, W.; Gao, Q.; Wang, Z.; Whiddon, R.; He, Y.; Li, Z.; Aldén, M.; Cen, K. Quantitative measurement of atomic potassium in plumes over burning solid fuels using infrared-diode laser spectroscopy. Energy Fuels 2017, 31, 2831–2837. [Google Scholar] [CrossRef]
- Goldenstein, C.S.; Spearrin, R.M.; Jeffries, J.B.; Hanson, R.K. Infrared laser-absorption sensing for combustion gases. Prog. Energ. Combust. 2017, 60, 132–176. [Google Scholar] [CrossRef] [Green Version]
- Sepman, A.; Ögren, Y.; Qu, Z.; Wiinikka, H.; Schmidt, F.M. Real-time in situ multi-parameter TDLAS sensing in the reactor core of an entrained-flow biomass gasifier. Proc. Combust. Inst. 2017, 36, 4541–4548. [Google Scholar] [CrossRef] [Green Version]
- Fatehi, H.; Bai, X.S. A Comprehensive Mathematical Model for Biomass Combustion. Combust. Sci. Technol. 2014, 186, 574–593. [Google Scholar] [CrossRef]
- Fatehi, H.; He, Y.; Wang, Z.; Li, Z.; Bai, X.-S.; Aldén, M.; Cen, K. LIBS measurements and numerical studies of potassium release during biomass gasification. Proc. Combust. Inst. 2015, 35, 2389–2396. [Google Scholar] [CrossRef]
- Fatehi, H.; Li, Z.; Bai, X.; Aldén, M. Modeling of alkali metal release during biomass pyrolysis. Proc. Combust. Inst. 2017, 36, 2243–2251. [Google Scholar] [CrossRef] [Green Version]
- Fatehi, H.; Weng, W.; Costa, M.; Li, Z.; Rabaçal, M.; Aldén, M.; Bai, X.-S. Numerical simulation of ignition mode and ignition delay time of pulverized biomass particles. Combust. Flame 2019, 206, 400–410. [Google Scholar] [CrossRef]
- Fatehi, H.; Costa, M.; Bai, X.-S. Numerical study on K/S/Cl release during devolatilization of pulverized biomass at high temperature. Proc. Combust. Inst. 2021, 38, 3909–3917. [Google Scholar] [CrossRef]
- Qu, Z.; Ghorbani, R.; Valiev, D.; Schmidt, F.M. Calibration-free scanned wavelength modulation spectroscopy—Application to H2O and temperature sensing in flames. Opt. Express 2015, 23, 16492–16499. [Google Scholar] [CrossRef] [PubMed]
- Sun, K.; Sur, R.; Chao, X.; Jeffries, J.B.; Hanson, R.K.; Pummill, R.J.; Whitty, K.J. TDL absorption sensors for gas temperature and concentrations in a high-pressure entrained-flow coal gasifier. Proc. Combust. Inst. 2013, 34, 3593–3601. [Google Scholar] [CrossRef]
- Sepman, A.; Ögren, Y.; Qu, Z.; Wiinikka, H.; Schmidt, F.M. Tunable Diode Laser Absorption Spectroscopy Diagnostics of Potassium, Carbon Monoxide, and Soot in Oxygen-Enriched Biomass Combustion Close to Stoichiometry. Energy Fuels 2019, 33, 11795–11803. [Google Scholar] [CrossRef]
- Strandberg, A.; Skoglund, N.; Thyrel, M.; Lestander, T.A.; Broström, M.; Backman, R. Time-resolved study of silicate slag formation during combustion of wheat straw pellets. Energy Fuels 2019, 33, 2308–2318. [Google Scholar] [CrossRef]
- Smith, G.P.; Golden, D.M.; Frenklach, M.; Moriarty, N.W.; Eiteneer, B.; Goldenberg, M.; Bowman, C.T.; Hanson, R.K.; Song, S.H.; Gardiner, W.C.J.; et al. GRI-MECH 3.0. 2010. Available online: http://combustion.berkeley.edu/gri-mech/ (accessed on 21 September 2021).
- Dayton, D.; Jenkins, B.; Turn, S.; Bakker, R.; Williams, R.; Belle-Oudry, D.; Hill, L. Release of inorganic constituents from leached biomass during thermal conversion. Energy Fuels 1999, 13, 860–870. [Google Scholar] [CrossRef]
- Liu, Y.; Wang, Z.; Xia, J.; Vervisch, L.; Wan, K.; He, Y.; Whiddon, R.; Bahai, H.; Cen, K. Measurement and kinetics of elemental and atomic potassium release from a burning biomass pellet. Proc. Combust. Inst. 2019, 37, 2681–2688. [Google Scholar] [CrossRef]
Figure 1.
(a) Schematic drawing of the experimental setup including the two DFB lasers, the single particle reactor (SPR) and the optical detection system. FC—fibre combiner, BS—beam splitter, PD—photodetector, OF—optical filter. (b) Photograph of the SPR with TDLAS optics mounted. (c) Representative photograph of a biomass particle inside the SPR during devolatilization. (d) Representative photograph of a biomass particle inside the SPR during char conversion.

Figure 2.
(a) Time series of H2O, gas temperature and K(g) at HAP 4 mm above softwood particles with initial mass of 500 mg (three replicates). The devolatilization (Dev.) phase (0–50 s) and the char combustion phase (50–250 s) are indicated by arrows. (b) Time series of H2O, temperature and K(g) at HAP 4 mm above softwood particles with initial masses of 500, 600, 800 and 1000 mg. H2O and temperature could be measured only during devolatilization, while the K(g) time series includes the char conversion.

Figure 3.
Simultaneous measured K(g) concentration (solid black line), H2O concentration (dashed blue line) and gas temperature (dotted red line) at HAP 4 mm above different biomass particles as a function of conversion time. (a) softwood; (b) Miscanthus; (c) wheat straw; and (d) Salix.
Figure 3.
Simultaneous measured K(g) concentration (solid black line), H2O concentration (dashed blue line) and gas temperature (dotted red line) at HAP 4 mm above different biomass particles as a function of conversion time. (a) softwood; (b) Miscanthus; (c) wheat straw; and (d) Salix.

Figure 4.
Comparison between measured and simulated H2O (a,d), temperature (b,e) and K(g) (c,f) at HAP 4 mm for wheat straw (a–c) and Salix (d–f). Solid lines represent results obtained by the numerical particle model, whereas markers display TDLAS data.
Figure 4.
Comparison between measured and simulated H2O (a,d), temperature (b,e) and K(g) (c,f) at HAP 4 mm for wheat straw (a–c) and Salix (d–f). Solid lines represent results obtained by the numerical particle model, whereas markers display TDLAS data.

Figure 5.
Comparison between TDLAS-measured and simulated atomic K concentrations at different laser beam heights (2, 4 and 8 mm) above wheat straw (a) and Salix (b) particles. Lines with markers represent the measured data; lines show the model prediction.
Figure 5.
Comparison between TDLAS-measured and simulated atomic K concentrations at different laser beam heights (2, 4 and 8 mm) above wheat straw (a) and Salix (b) particles. Lines with markers represent the measured data; lines show the model prediction.

Figure 6.
Model-predicted concentrations of KOH, KCl, K(g), HCl and CH3Cl at HAP 4 mm for wheat straw (a,b) and Salix (c,d). Panels (a,c) focus on the devolatilization phase, while panels (b,d) also include the char combustion stage.
Figure 6.
Model-predicted concentrations of KOH, KCl, K(g), HCl and CH3Cl at HAP 4 mm for wheat straw (a,b) and Salix (c,d). Panels (a,c) focus on the devolatilization phase, while panels (b,d) also include the char combustion stage.


Table 1.
Physical and chemical properties, including fuel analysis, of softwood, Salix, Miscanthus and wheat straw biomass particles.
Table 1.
Physical and chemical properties, including fuel analysis, of softwood, Salix, Miscanthus and wheat straw biomass particles.
| Unit | Softwood | Salix | Miscanthus | Wheat Straw | |
|---|---|---|---|---|---|
| Particle mass | kg | 5.00 × 10⁻⁴ | 5.00 × 10⁻⁴ | 5.00 × 10⁻⁴ | 5.00 × 10⁻⁴ |
| Particle volume | m3 | 4.02 × 10⁻⁷ | 4.52 × 10⁻⁷ | 4.02 × 10⁻⁷ | 5.03 × 10⁻⁷ |
| Particle density | kg/m3 | 1243.4 | 1105.2 | 1243.4 | 994.7 |
| Calorimetric and proximate analysis | |||||
| LHV | MJ/kg dry | 18.9 | 18.7 | 17.9 | 16.6 |
| Moisture | wt-% rec. | 6.1 | 8.9 | 8.2 | 10.0 |
| Ash content | wt-% dry | 0.42 | 0.98 | 3.22 | 9.05 |
| Ultimate analysis | |||||
| C | wt-% dry | 50.07 | 49.43 | 47.58 | 44.28 |
| H | wt-% dry | 6.2 | 6.13 | 5.8 | 5.62 |
| N | wt-% dry | 0.04 | 0.28 | 0.24 | 0.88 |
| O | wt-% dry | 43.3 | 43.2 | 43.1 | 40.0 |
| Main ash-forming elements | |||||
| K | mg/kg dry | 499 | 1460 | 2780 | 14600 |
| Na | mg/kg dry | 29.9 | 21.1 | 87.1 | 214 |
| Ca | mg/kg dry | 904 | 2310 | 1110 | 5110 |
| Mg | mg/kg dry | 136 | 254 | 480 | 1130 |
| Fe | mg/kg dry | 46.7 | 59.2 | 191 | 546 |
| Zn | mg/kg dry | 10.9 | 30.7 | 11.5 | 22.7 |
| Al | mg/kg dry | 76.6 | 49.5 | 233 | 701 |
| Si | mg/kg dry | 308 | 285 | 10,100 | 22,100 |
| P | mg/kg dry | 47.5 | 493 | 298 | 882 |
| S | mg/kg dry | 56.3 | 234 | 343 | 1390 |
| Cl | mg/kg dry | 23 | 40.1 | 239 | 3510 |
Publisher’s Note: MDPI stays neutral with regard to jurisdictional claims in published maps and institutional affiliations. |
© 2021 by the authors. Licensee MDPI, Basel, Switzerland. This article is an open access article distributed under the terms and conditions of the Creative Commons Attribution (CC BY) license (https://creativecommons.org/licenses/by/4.0/).
Share and Cite
MDPI and ACS Style
Qu, Z.; Fatehi, H.; Schmidt, F.M. Potassium Release from Biomass Particles during Combustion—Real-Time In Situ TDLAS Detection and Numerical Simulation. Appl. Sci. 2021, 11, 8887. https://doi.org/10.3390/app11198887
AMA Style
Qu Z, Fatehi H, Schmidt FM. Potassium Release from Biomass Particles during Combustion—Real-Time In Situ TDLAS Detection and Numerical Simulation. Applied Sciences. 2021; 11(19):8887. https://doi.org/10.3390/app11198887
Chicago/Turabian StyleQu, Zhechao, Hesameddin Fatehi, and Florian M. Schmidt. 2021. "Potassium Release from Biomass Particles during Combustion—Real-Time In Situ TDLAS Detection and Numerical Simulation" Applied Sciences 11, no. 19: 8887. https://doi.org/10.3390/app11198887
Note that from the first issue of 2016, this journal uses article numbers instead of page numbers. See further details here.