Article

Investigation of Geological Structures Using UAV Lidar and Its Effects on the Failure Mechanism of Deep-Seated Landslide in Lantai Area, Taiwan

1
Department of Civil Engineering, National Taiwan University, Taipei 10617, Taiwan
2
Department of Civil Engineering, National Taipei University of Technology, Taipei 10608, Taiwan
3
Department of Civil Engineering, National Chi Nan University, Nantou 54516, Taiwan
*
Author to whom correspondence should be addressed.
Appl. Sci. 2021, 11(21), 10052; https://doi.org/10.3390/app112110052
Submission received: 31 August 2021 / Revised: 19 October 2021 / Accepted: 20 October 2021 / Published: 27 October 2021
(This article belongs to the Special Issue LiDAR DEMs for Geological Mapping)

Abstract

:

Featured Application

The high resolution LiDAR DTM provides detailed topographic information which was used to map the geological structures. The geological structures appeared to affect the failure mechanism significantly. This study suggested the importance of application of high resolution LiDAR, or else the geological structures would have been difficult to locate in this study.

Abstract

The deep-seated landslide in the Lantai area, Taiwan, has a long history of landslide activity and often damages the sole access road to the Tai-Ping Mountain National Forest Recreation Area. This study adopted the high-resolution digital terrain model (DTMH) derived from UAV mounted LiDAR point cloud data for mapping geological structures and verified through field investigation. A slope model was proposed with mapped geological structures and shear zone, and numerical analysis was conducted using finite difference analysis. The failure mechanism was found to be significantly affected by the shear zone bounded by geological structures, which would not have been uncovered without the high-resolution DTM (DTMH). The resulting landslide behavior consisted well with mapped scarp, borehole data, and conformed with the event records. These results provided vital information supporting hazard mitigation strategy.

1. Introduction

Among different types of landslide hazards, the deep-seated landslide often involves large amount of landslide volume and causes severe hazard and damages to infrastructures [1,2]. Many deep-seated landslides have been reported to recur and evolve into an even larger scale and cause more severe consequences [3,4,5]. When investigating the deep-seated landslide hazard, many researchers found that the local geological settings including characteristics of rock formation and geological structures affect the failure mechanism of a deep-seated landslide significantly [6,7,8]. To properly draft up the mitigation strategy for such deep-seated landslide hazard, it is essential to investigate the related geological setting and structures. This investigation of geological settings is often conducted by ground-based investigation, which is time consuming and expensive, and the results often rely on accessibility of the site and available out-crops of the geological formations and structures. The remote sensing techniques have advanced rapidly in recent years, and remote sensing data have been used by many researchers to analyze topographic characteristics of the deep-seated landslides [9,10]. The light detection and ranging (LiDAR) data, especially, provide terrain details in support of identification of geomorphological features [11,12,13,14]. The high-resolution digital terrain model (DTMH) produced by LiDAR mounted on unmanned aviation vehicle (UAV) provides more detailed topographic variations, which facilitate a good opportunity for identifying the geomorphological features such as lineaments related to the geological structures.
The deep-seated landslide in the Lantai area, I-Lan County, Taiwan has a long history of landslide activity and often damages the I-Lan Special Route 1, which is the sole access road to the Tai-Ping Mountain National Forest Recreation Area. Studies and monitoring of the landslide were conducted since 2015 [15,16,17], and the study in 2018 [18] suggested some ground subsidence implying existence of possible geological structures at the site. This study adopted the high-resolution digital terrain model (DTMH) derived from UAV-mounted LiDAR point cloud data for mapping lineaments of geological structures, and they were then verified through field investigation. We then conducted numerical analysis to study the effects of the geological structures on the failure mechanism of the deep-seated landslide. The geological structures might have significantly affected the failure mechanism of the deep-seated landslide and mitigation facilities. Such results could provide valuable information supporting hazard mitigation strategy. Figure 1 shows a flowchart of the methodology of this study.

2. Materials and Method

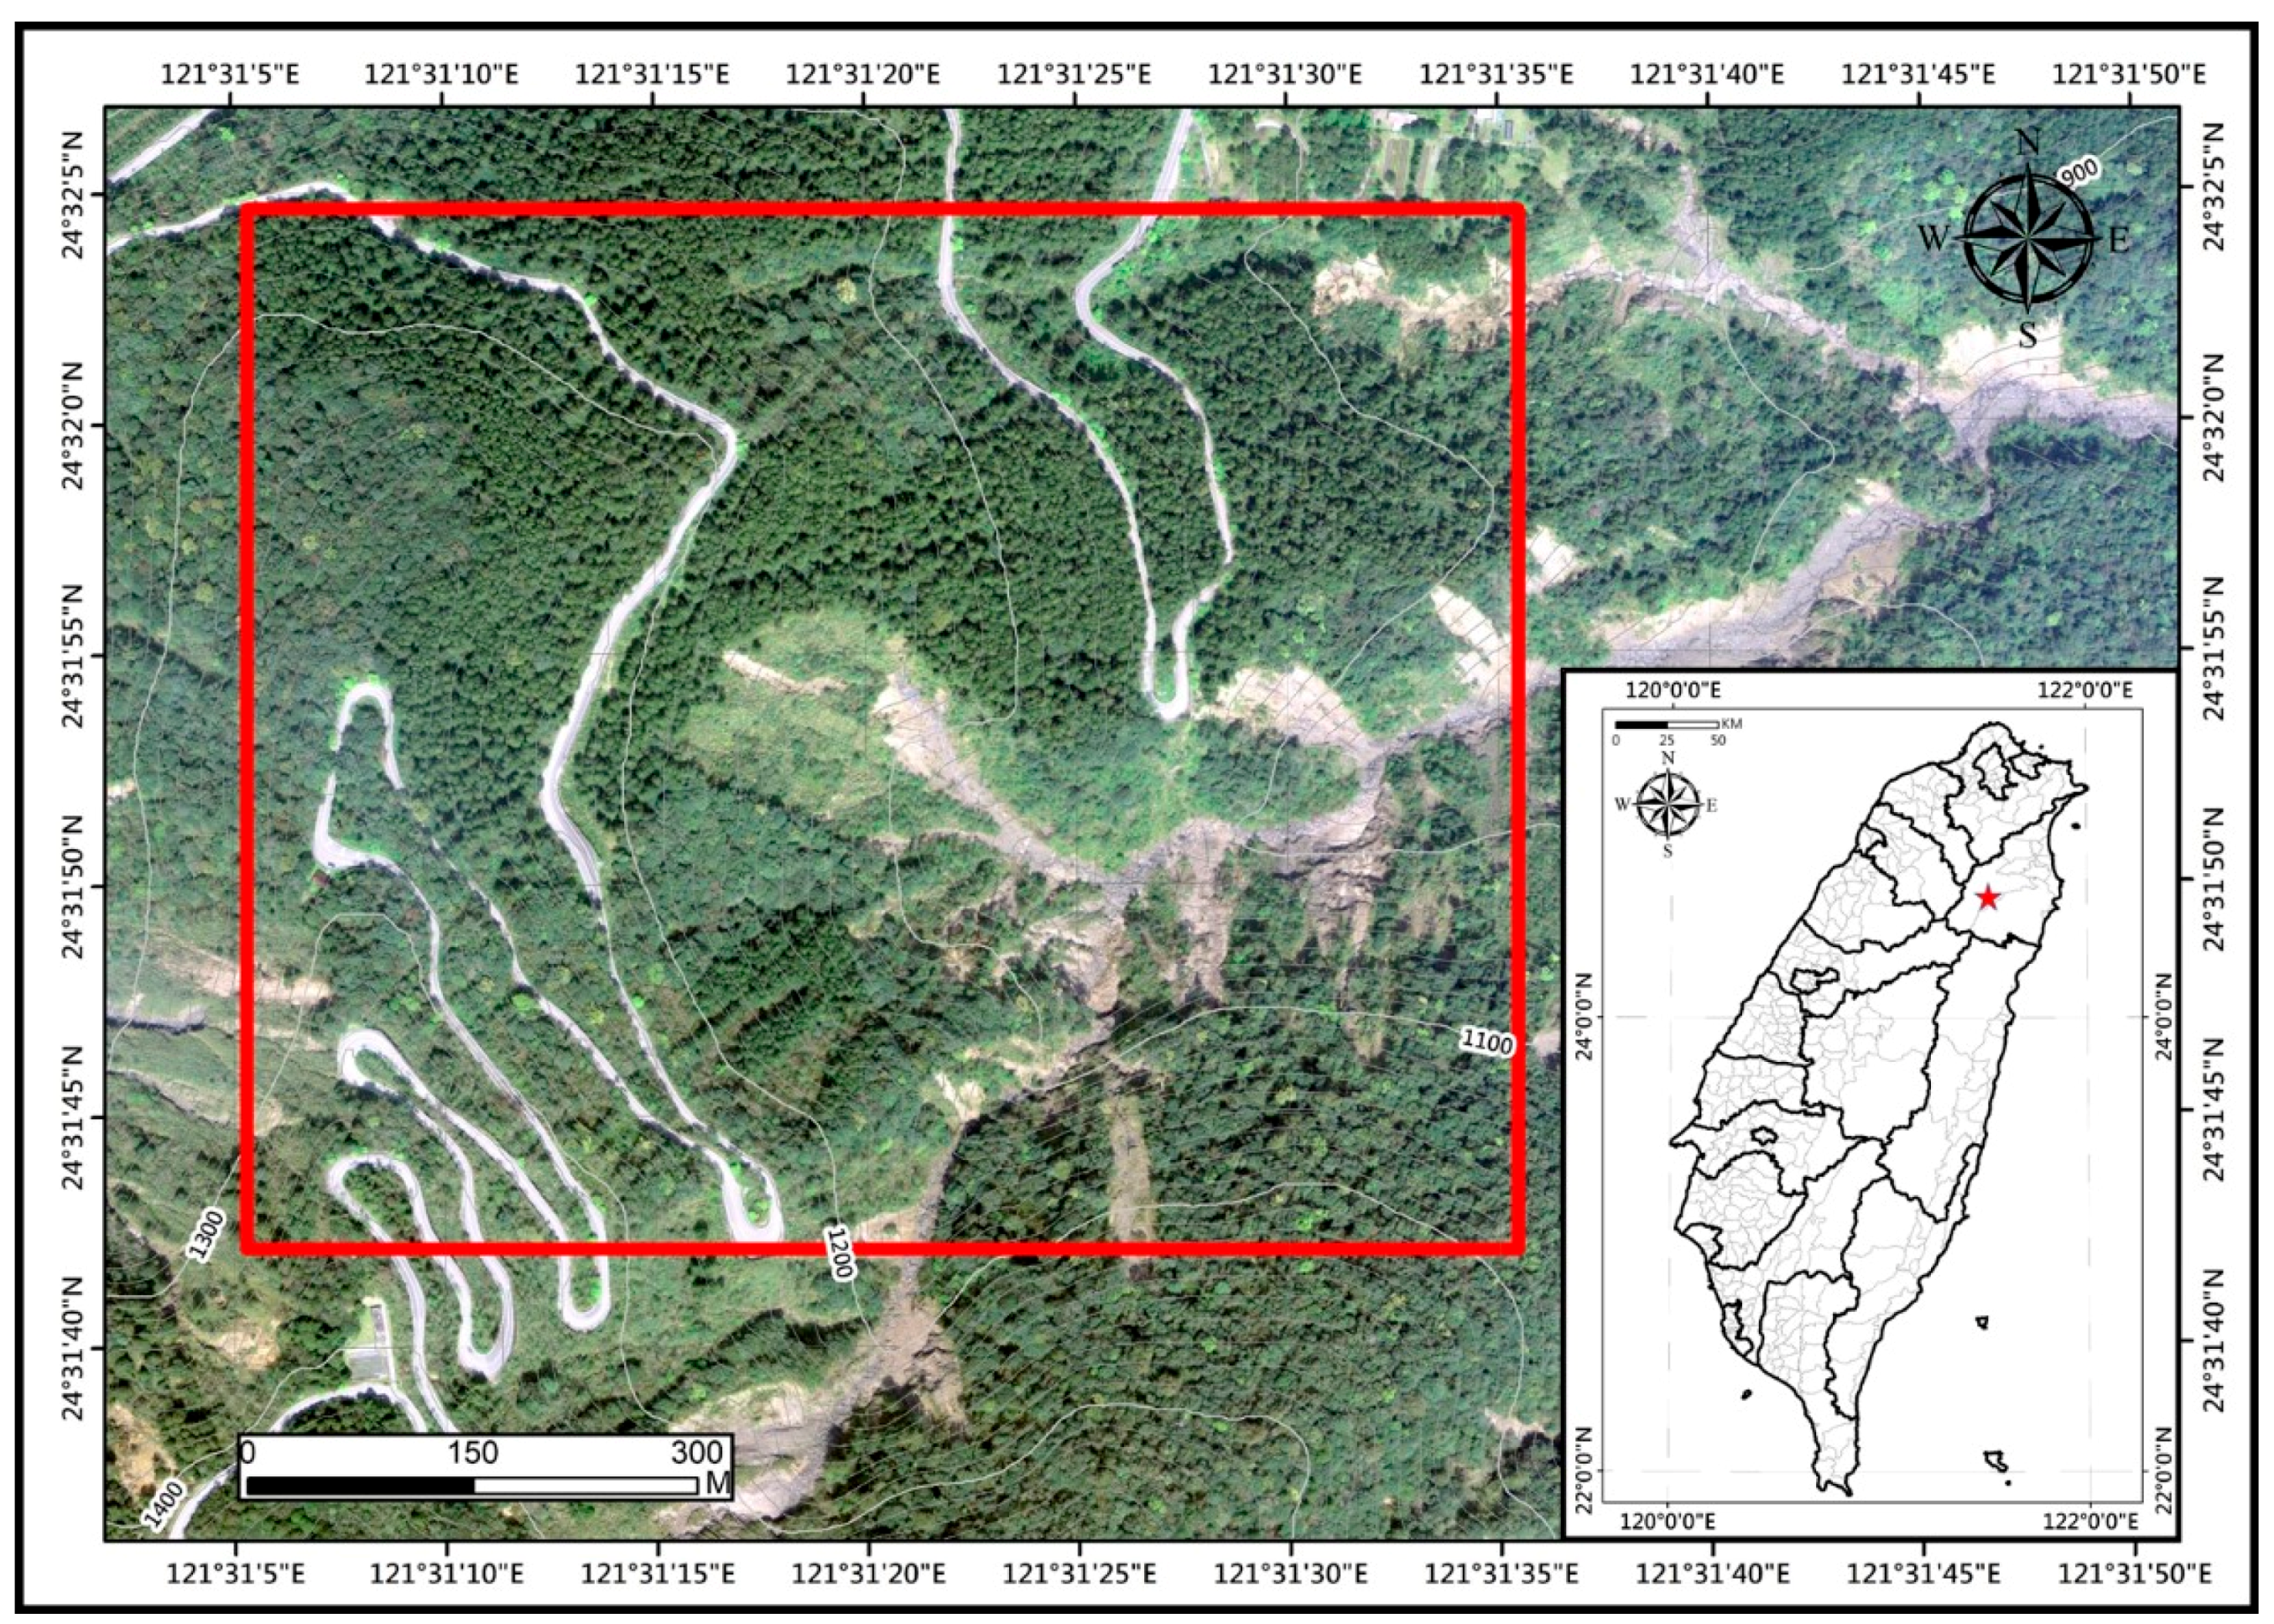
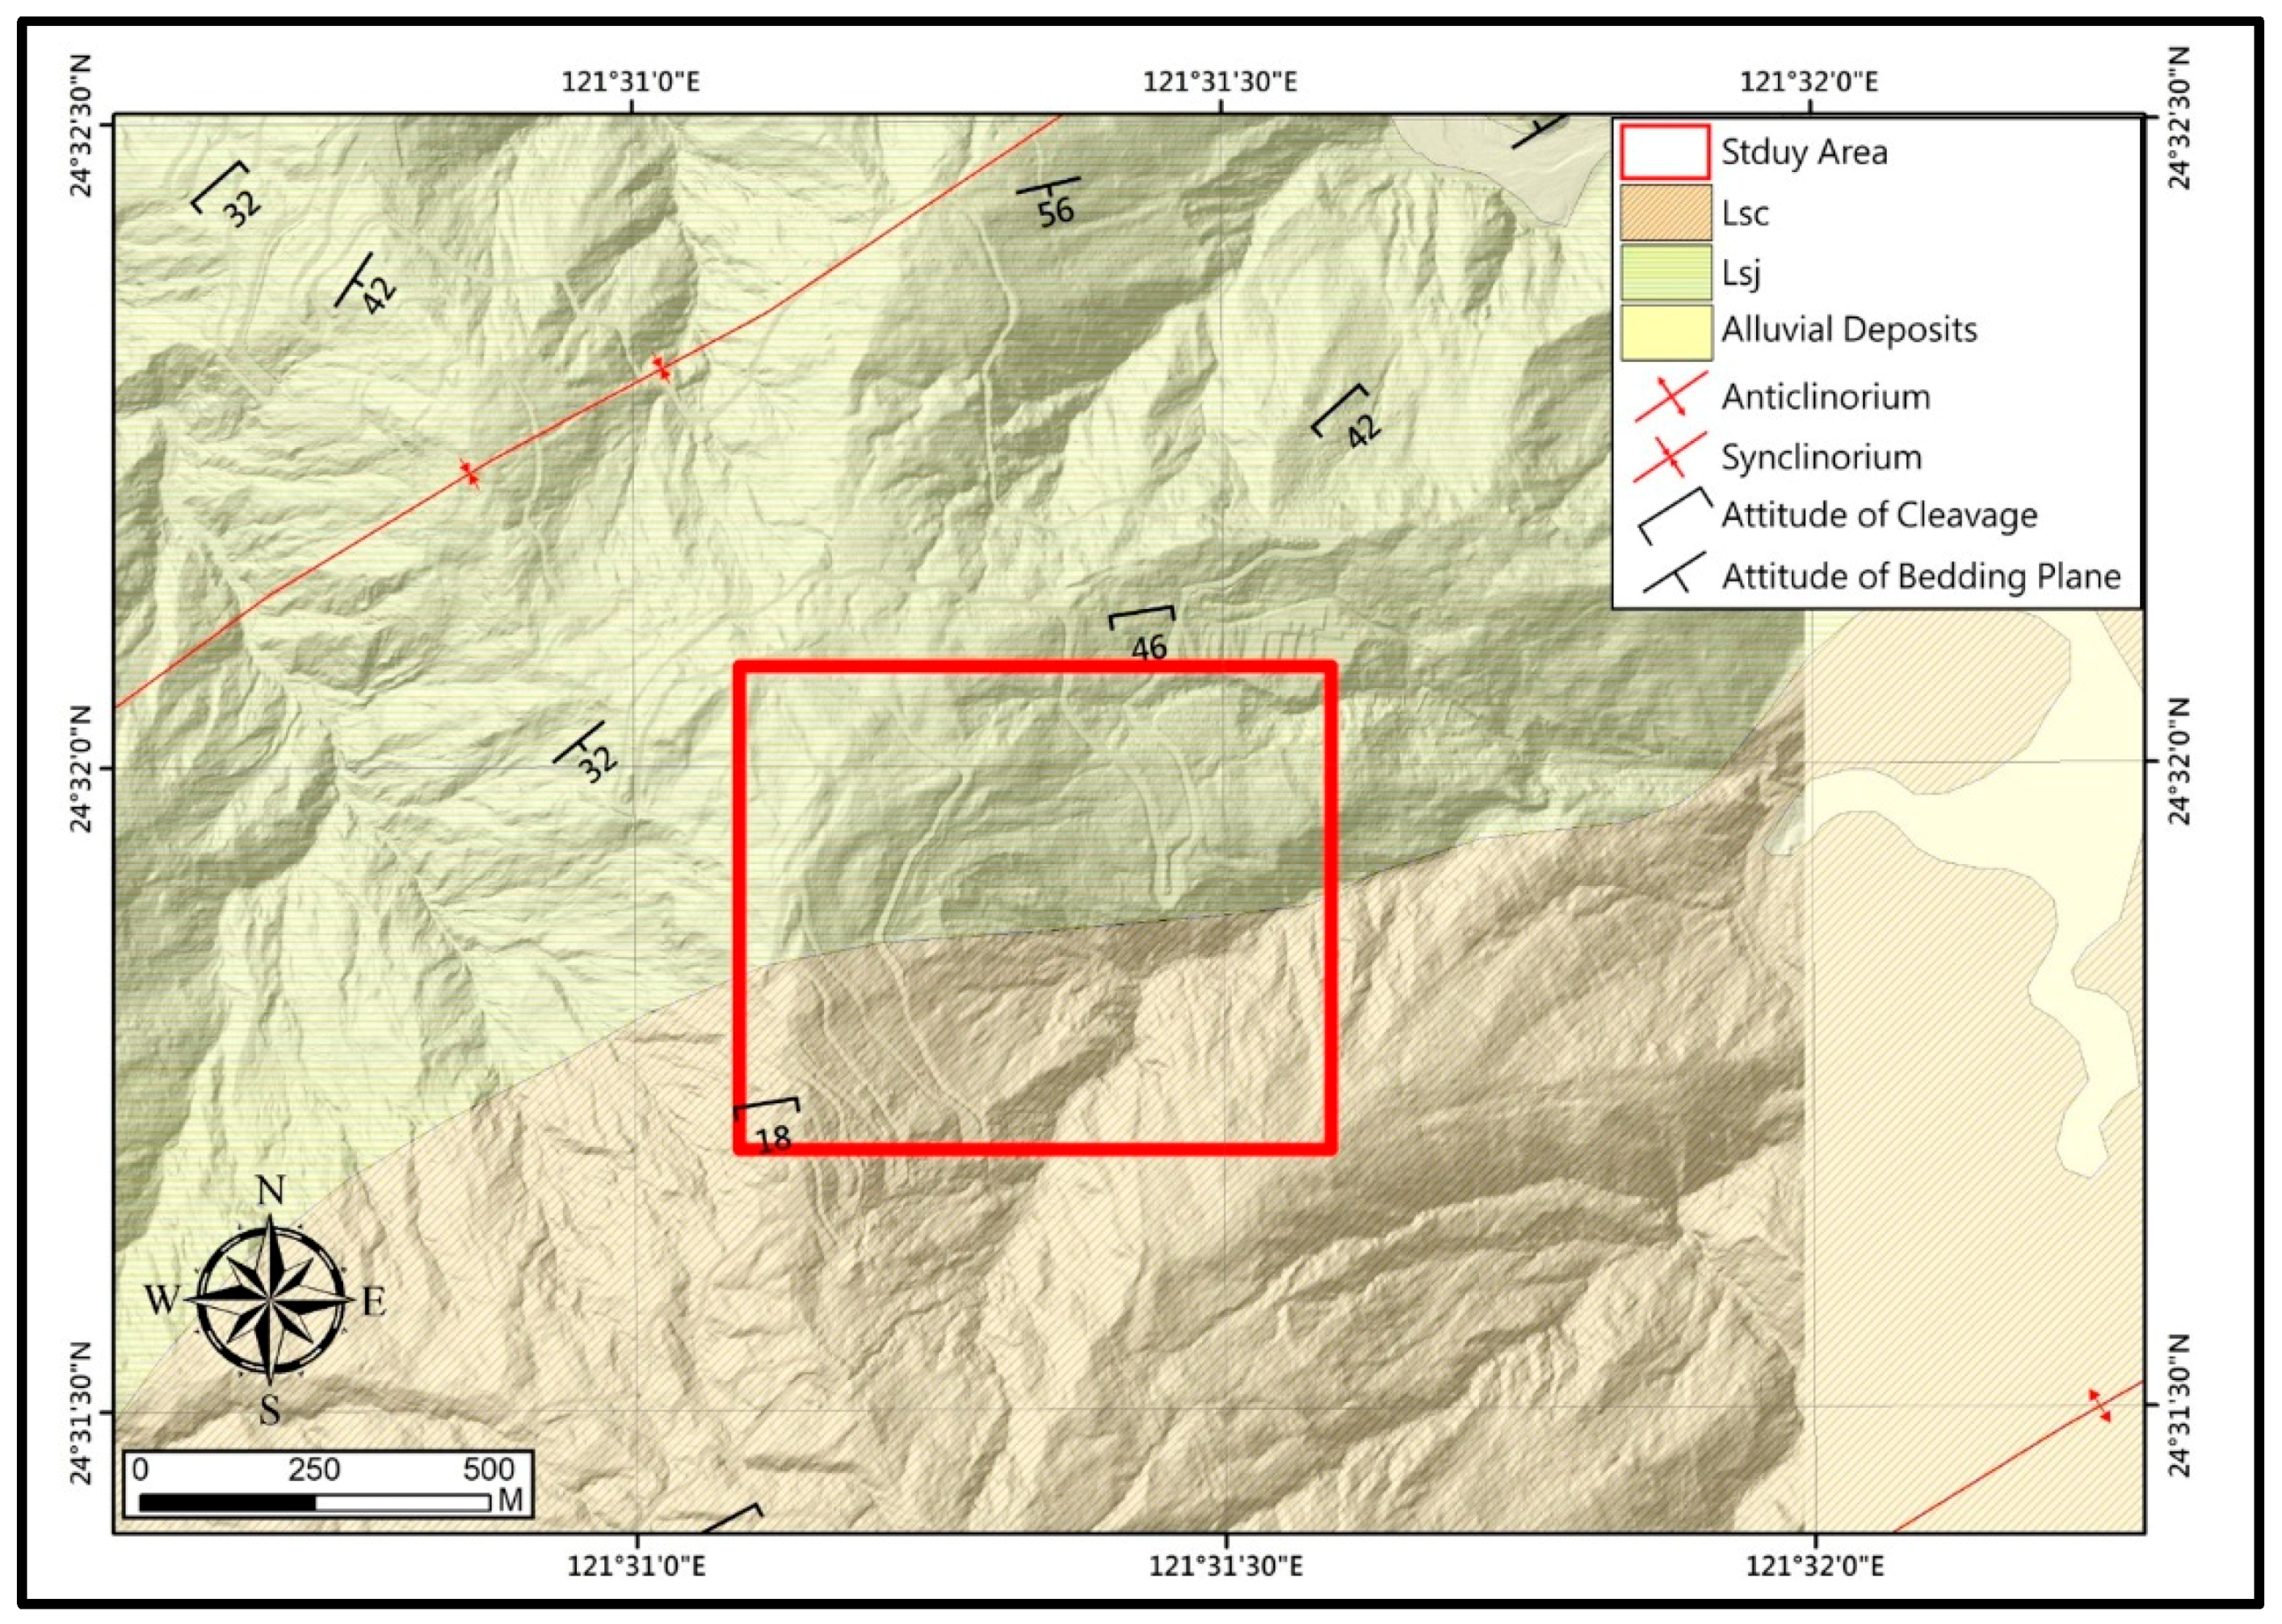
2.1. Geomorphology and Geology of the Study Area

The deep-seated landslide in the Lantai study area situated at the 13.5 km of the I-Lan Special Route 1 in the Tai-Ping Mountain National Forest Recreation Area, Ta-Tung District, I-Lan County, Northeast Taiwan as shown in aerial photograph taken on 27 September 2017 in Figure 2. The study area is enclosed by the red lines, and scars and ground erosion caused by previous landslides are clearly observed in Figure 2. The study area has a long history of landslide activity causing road subsidence, damages of retaining structures, and tilting trees at the site. The terrain of the study area is fairly steep, and the elevation ranges approximately from 1000 to 1200 m above sea level with higher elevation in the west direction sloping toward east direction. The average attitude of the main landslide slope is approximately N29 °E dipping to 30 °E shown in Figure 2.
The study area was located in the Lushan Formation as presented in the geological map in Figure 3 [19]. The Lushan Formation is mainly dark gray to black slate, and the formations in the study area include the Lushan formation Chingshuihu Member (Lsc) and Lushan Formation Jentse Member (Lsj), with the Jentse Member on top. The Lushan formation Chingshuihu Member is mainly composed of slate or phyllite with thin beds of metasandstone, and the Jentse Member is mainly composed of argillite with thin alternations of argillite and metasandstone. The deep-seated landslide in the study area is mainly situated on the Lushan Formation Jentse Member of argillite and slate. The slate was highly inhomogeneous and anisotropic, with weak bedding planes of slate stratum and highly developed cleavages. The rock material was easily weathered which lead to a low strength and contributed to the cause of landslide. The attitude of the bedding plane is approximately N51 °E/32 °SE, and the attitude of the cleavage is approximately N81 °E/46 °SE, respectively, as shown in Figure 3.

2.2. Satellite Images, Aerial Photographs, GNSS, and DTMs of the Study Area

The level 3 precision corrected images of SPOT5 satellite with a resolution of 2.5 m acquired on 16th March 2005 and 11th March 2006 were provided by the Center for Space and Remote Sensing Research. Aerial photograph taken on 30th November 1980 with a resolution of 0.25 m was provided by the Forestry Bureau Aerial Survey Office. The 5 m resolution digital terrain model (DTM5) derived from aerial photographs of 2002 were provided by the National Land Surveying and Mapping Center, Ministry of Interior. The accuracy in plane and hilly area was approximately 0.5 m, and that in mountain area and steep ground was about 0.8 m horizontal, and 1~2 m vertical, respectively [20]. Positioning of field investigation points was conducted by Global Navigation Satellite System (GNSS) using Leica Zeno GG03 with post-processing accuracy of 5 mm + 0.5 ppm RMS. The real time accuracy was 1 cm + 2 ppm horizontal, and 2 cm + 2 ppm vertical, respectively.
For the high resolution UAV mounted LiDAR, the Aerospace (AeroVironment now) Vapor 55 UAV was used to administer the LiDAR mission using Riegl VUX-1UAV LiDAR ranger on 2018. Three flight missions were conducted in different periods to cover the study area of about 90 hectares. The field of view was 120 degrees with scan pulse rate of 380 KHz, and flight height was approximately 120–150 m above ground level to achieve a point cloud density of more than 250 points per square meter. Process of the raw dataset is composed of several components, including laser scanning system information, navigation device information, original laser data, trajectory data, tie objects, etc. Full waveform analysis and geo-referencing laser data were conducted by merging laser data and position data derived from INS/GNSS unit. All data are adjusted considering parameters including: orientation and position offsets of the laser data, the navigation device, and the trajectory, under the RIEGL RIPROCESS software with Scan Alignment Tool and/or with RiPRECISION, based mainly on the echo, intensity, and plane-based adjustment. This method searches planar surface patches in all point clouds automatically for each flight-line to find correspondences between patches of different point clouds. The plane-based adjustment uses an iterative approach to calculate the correction values in each flight-line. The data can then be verified visually in 2-Dimension and 3-Dimension using laser signal reflectivity, laser data density, color-encoded height visualization, height differences within raster cells, and others. Quality of matched different data records is assessed by visual inspection or by statistical analysis. If the quality of data alignment is good, the point cloud classification is then processed. In this research, TerraSolid toolsets, including TerraScan, TerraModel, and TerraPhoto are used to improve the quality of point cloud classification. First, the point cloud is automatically classified according to multiple parameters including echo, intensity, maximum building size, terrain angle, iteration angle, and iteration distance, so as to separate ground points from “default” points. A similar process is used to classify other kinds of point cloud, such as isolation, vegetation, low points, buildings, etc. Then all automatically classified point clouds are checked and re-edited manually using two mutually perpendicular profiles and proceed successively. The results of the classified points from the profiles are examined for immediate correspondence with the ortho-photo and with simultaneously generated DTM. The aforementioned processes are used iteratively so as to classify the overall point clouds. Finally, the raster DTM and DSM are generated from the classified point cloud.
Due to accessibility and network signals, only eight static GNSS points located on mountain road are used as checkpoints. The error is estimated by comparing the elevation differences between the check points and DTM at the same position for lacking horizontal reference mark. The resulting average difference and standard deviation are 3.1 and 3.9 cm, respectively. The overall maximum height difference is 6.6 cm. The resolution of the DTMH derived from the LiDAR point cloud data was 0.2 m.

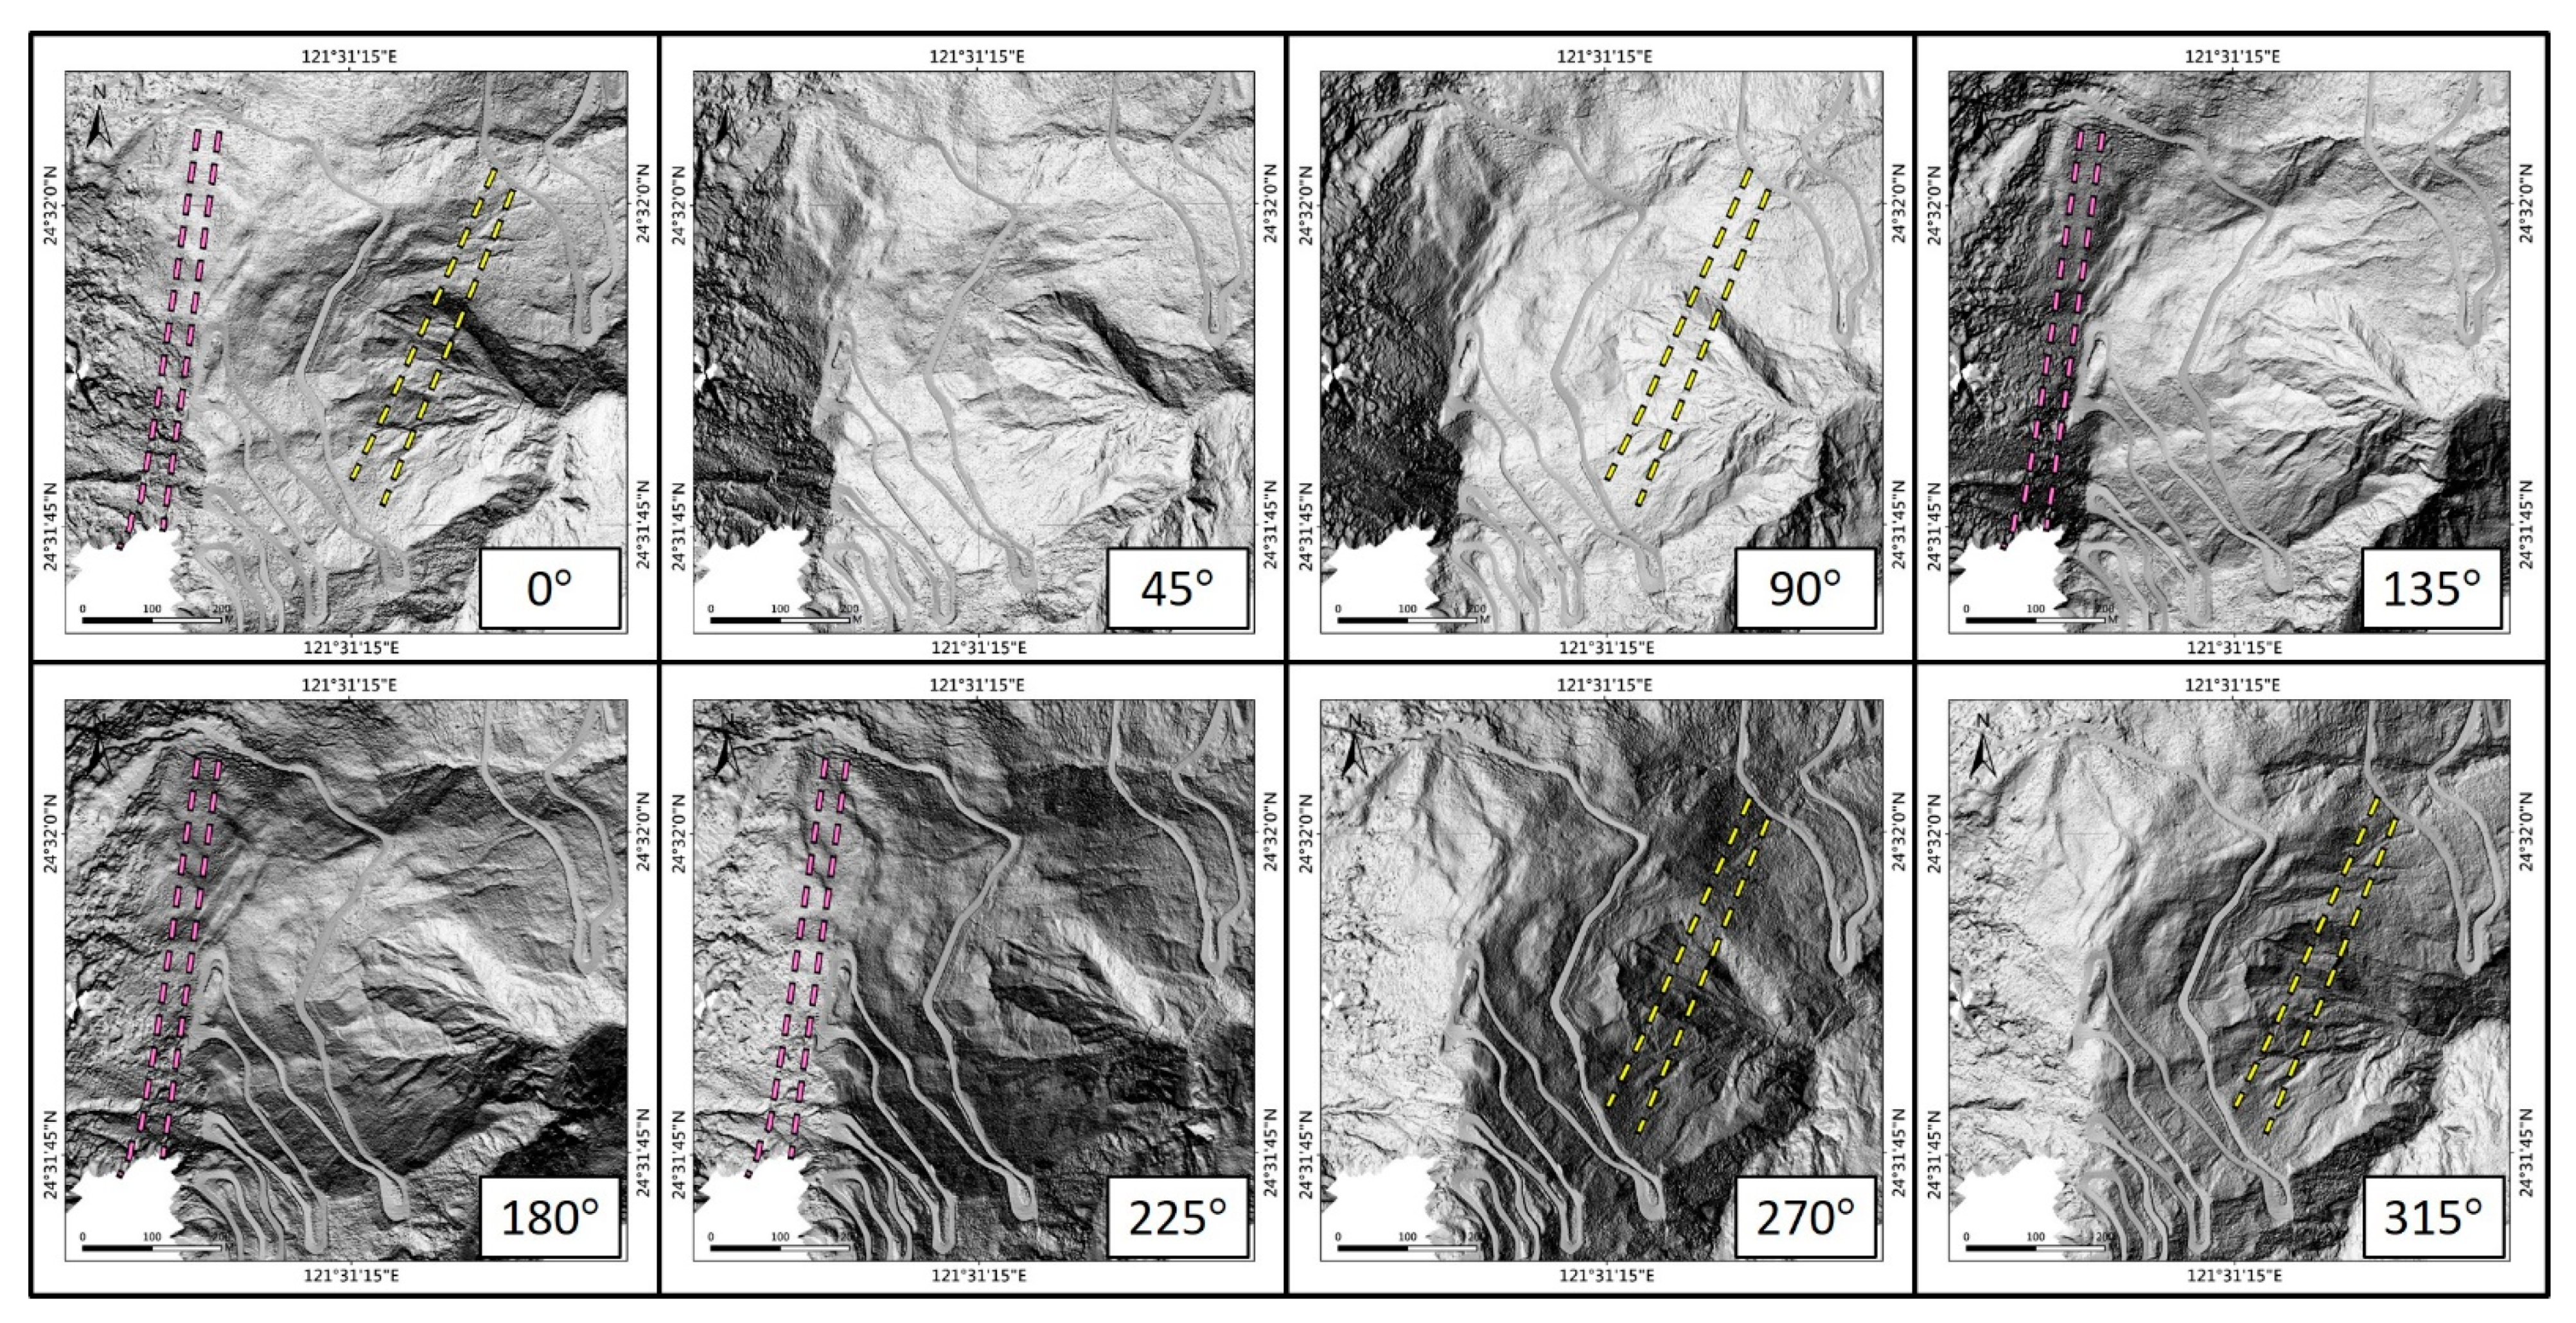
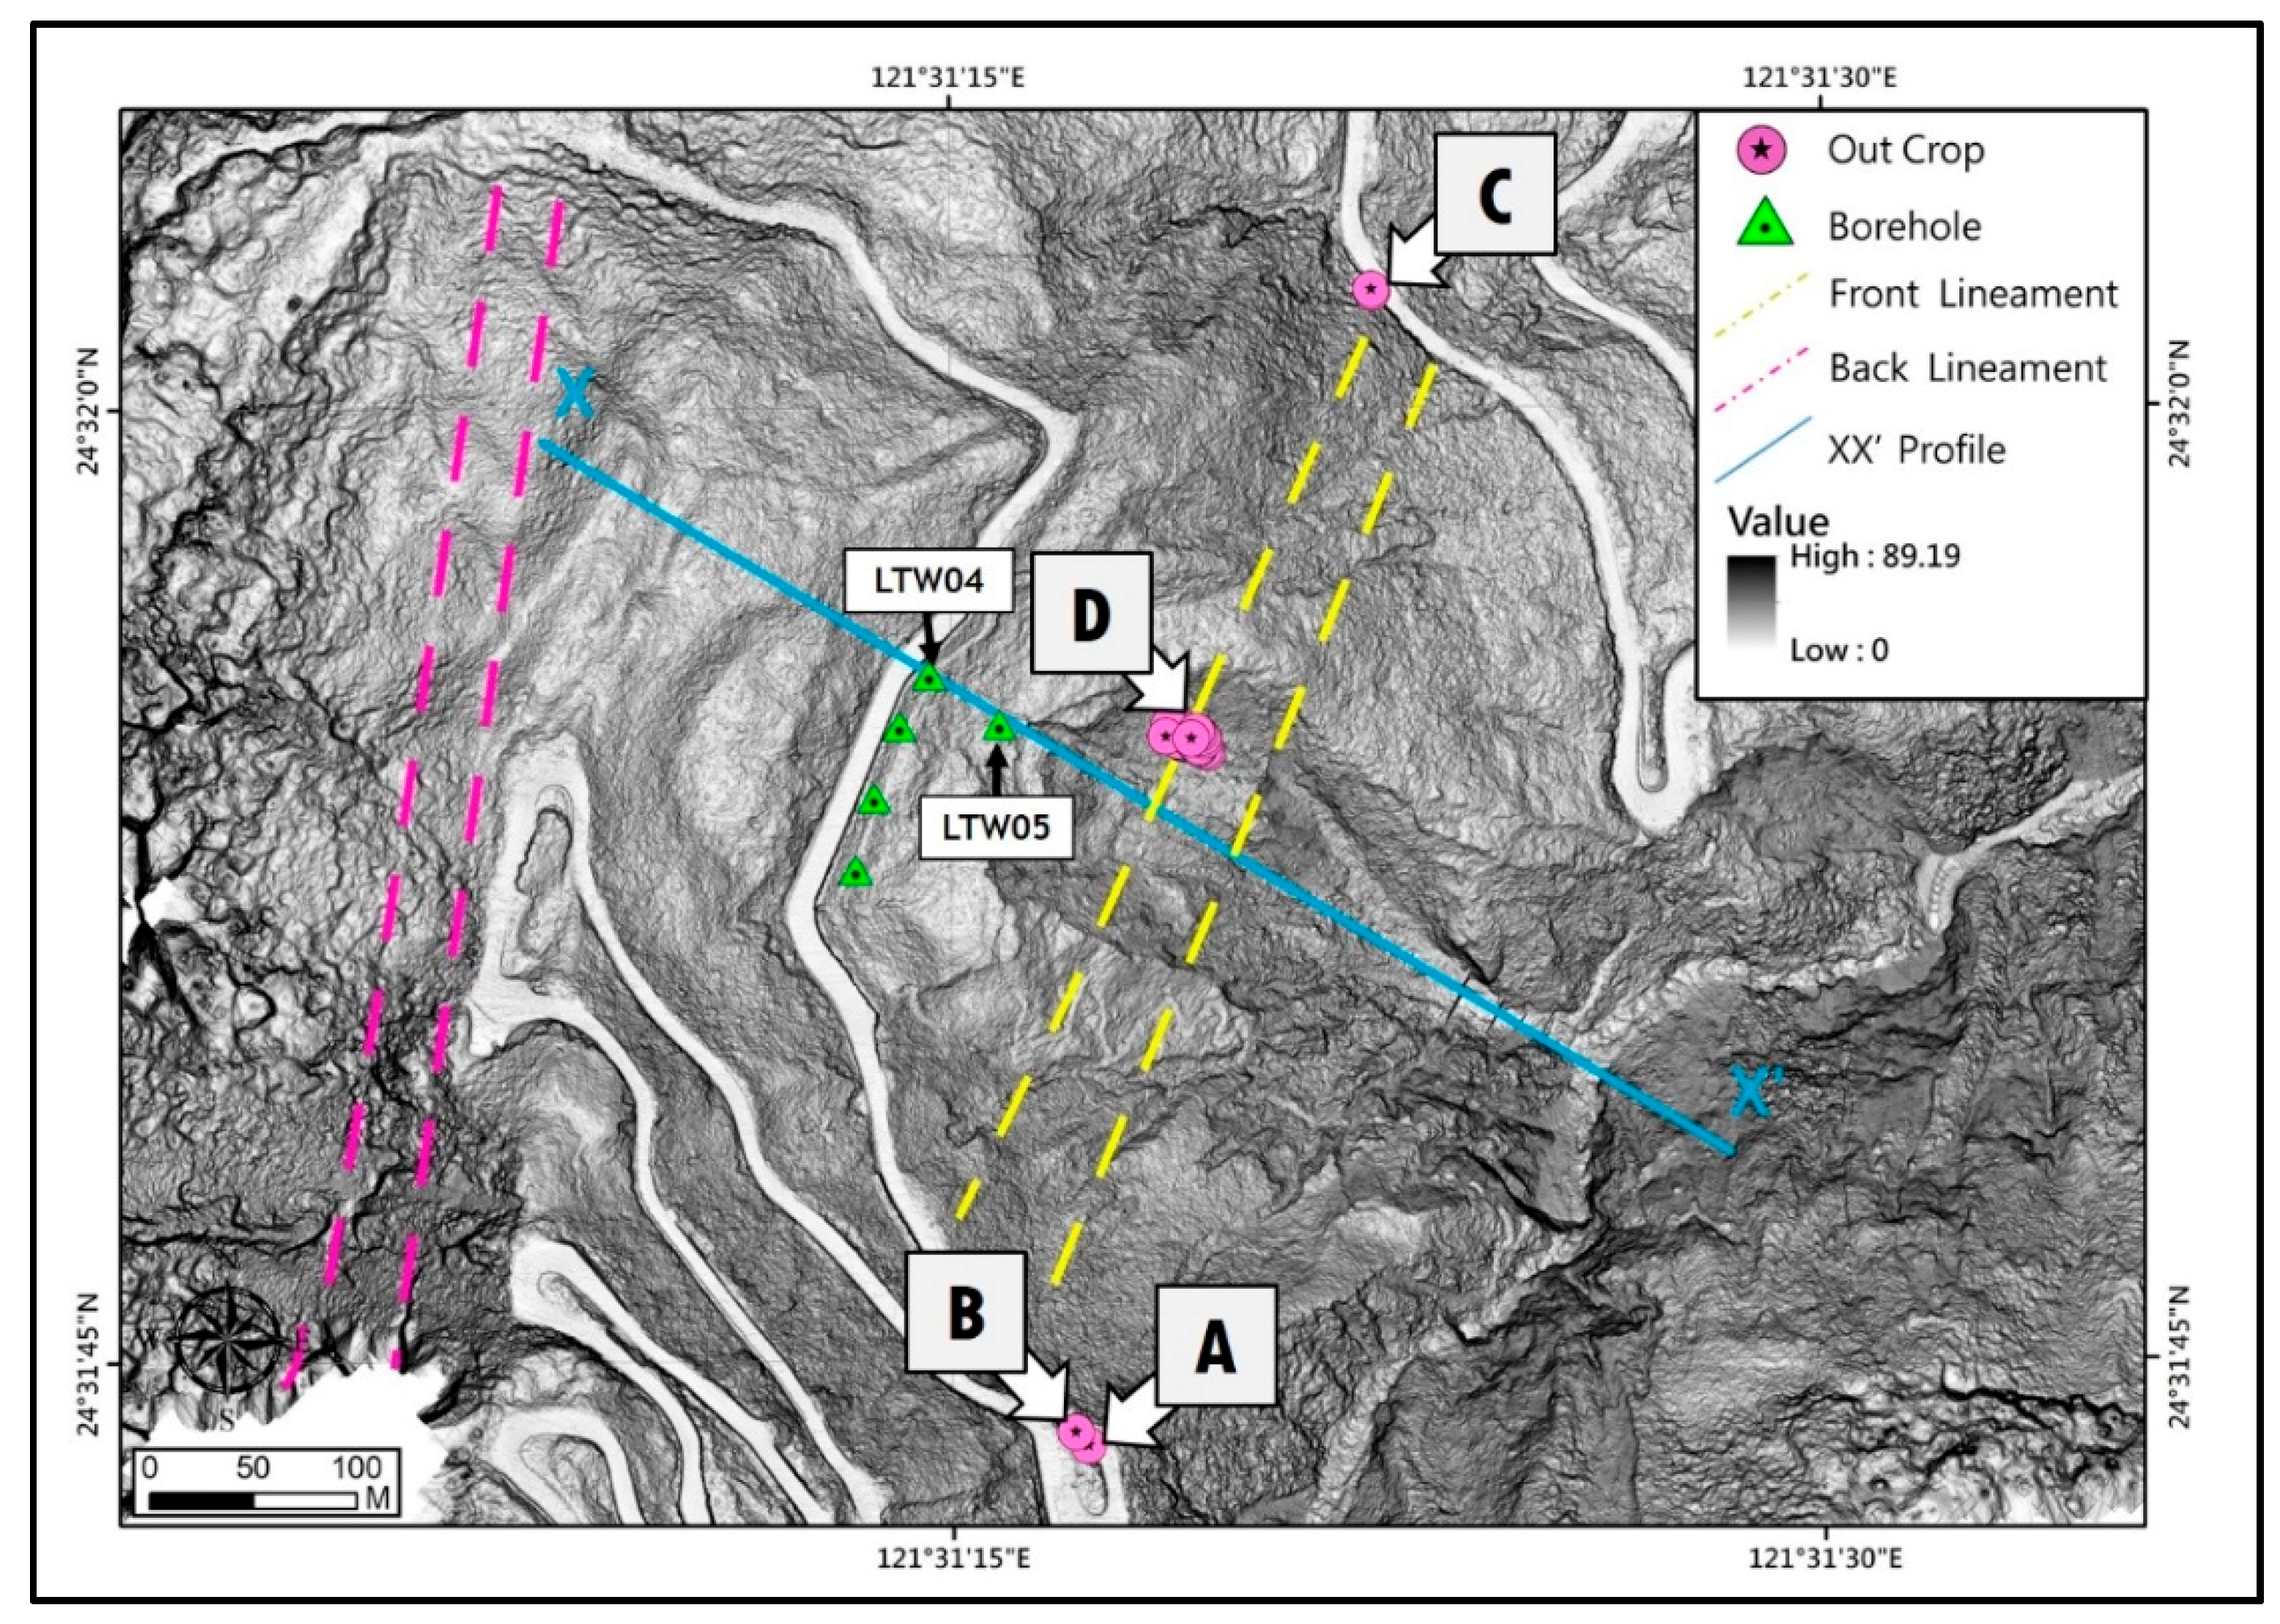
2.3. Mapping of Deep-Seated Landslide and Lineament

A significant landslide event induced by Typhoon Haitang in 2005 was reported by Lin et al. [15], therefore, the SPOT5 satellite images captured before and after the typhoon were used to map the landslide areas. Varnes and other researchers [6,21,22] proposed the geomorphological features of the deep-seated landslide including: (1.) a crown with tension cracks; (2.) a main scarp; (3.) related slide blocks; (4.) a minor scarp; (5.) a main body; (6.) transverse tension cracks; and (7.) a toe bulge. These geomorphologic features have been used for identifying deep-seated landslides with the main scarp being the most important feature [23,24,25,26]. The main scarp can be observed as a shadowed lineament on the remote sensing images suggesting ground subsidence caused by the scarp. The lineaments and topography exhibiting matching characteristics are identified as scarps of deep-seated landslides. The comparisons of the SPOT5 images before and after the typhoon event showed the topographic and ground variations caused by the landslide, which were compared to the geomorphological features of deep-seated landslide and locations of scarp were mapped accordingly. The SPOT5 image after the event with the mapped scarp was then overlaid with DTM5 three-dimensionally to accentuate the topographic variations. The image was inspected from different aspects three-dimensionally, which finalized mapping of the scarp and the deep-seated landslide. Lin et al. [26] utilized slope map derived from DTM for mapping of the geomorphological features of landslide, which accentuated the curvature of topographic variation. Thus, further validation was conducted by overlaying the SPOT5 image with mapped scarp on the slope map derived from DTM5 to observe the matching characteristics.
For mapping of the geological structure, the high resolution UAV mounted LiDAR DTMH was used. O’Leary et al. defined a lineament as a simple, or composite linear feature of a surface that could be mapped [27]. Ramli et al. [28] proposed that the lineaments could be joints, faults, and shear zones that might affect the landslides. The DTMH provides detailed topographic variations for mapping of such lineaments. In this study, the shaded relief from DTMH obtained at eight different azimuth angles was used to locate the lineaments of geological structure of the terrain following the method by Lin et al. [26,29]. The azimuth angle was measured from north in the clockwise direction. Figure 4 illustrates the lineament mapping process using the shaded relief at eight different azimuth angles: 0°, 45°, 90°, 135°, 180°, 225°, 270°, and 315°, with a light incidence angle of 45°. As shown in Figure 4, the shadow of the lineaments suggesting ground subsidence was observed and marked with yellow dash lines on the main slope face in the shaded relief at the azimuth angles of 0°, 90°, 270°, and 315°; and the shadow of the lineaments marked with purple dash lines was observed on the opposite slope face at the azimuth angles of 0°, 135°, 180°, and 225°. The lineaments found from different azimuth angles shaded relief were summarized and edited to determine the final locations of the geological structures. The three-dimensional shaded relief map derived from DTMH with the mapped lineaments was then inspected from different aspects for validation of the mapped results. Ground investigations were conducted to further validate the mapped geological structures, and the out-crops of the geological structures were located with specimens taken at the site.

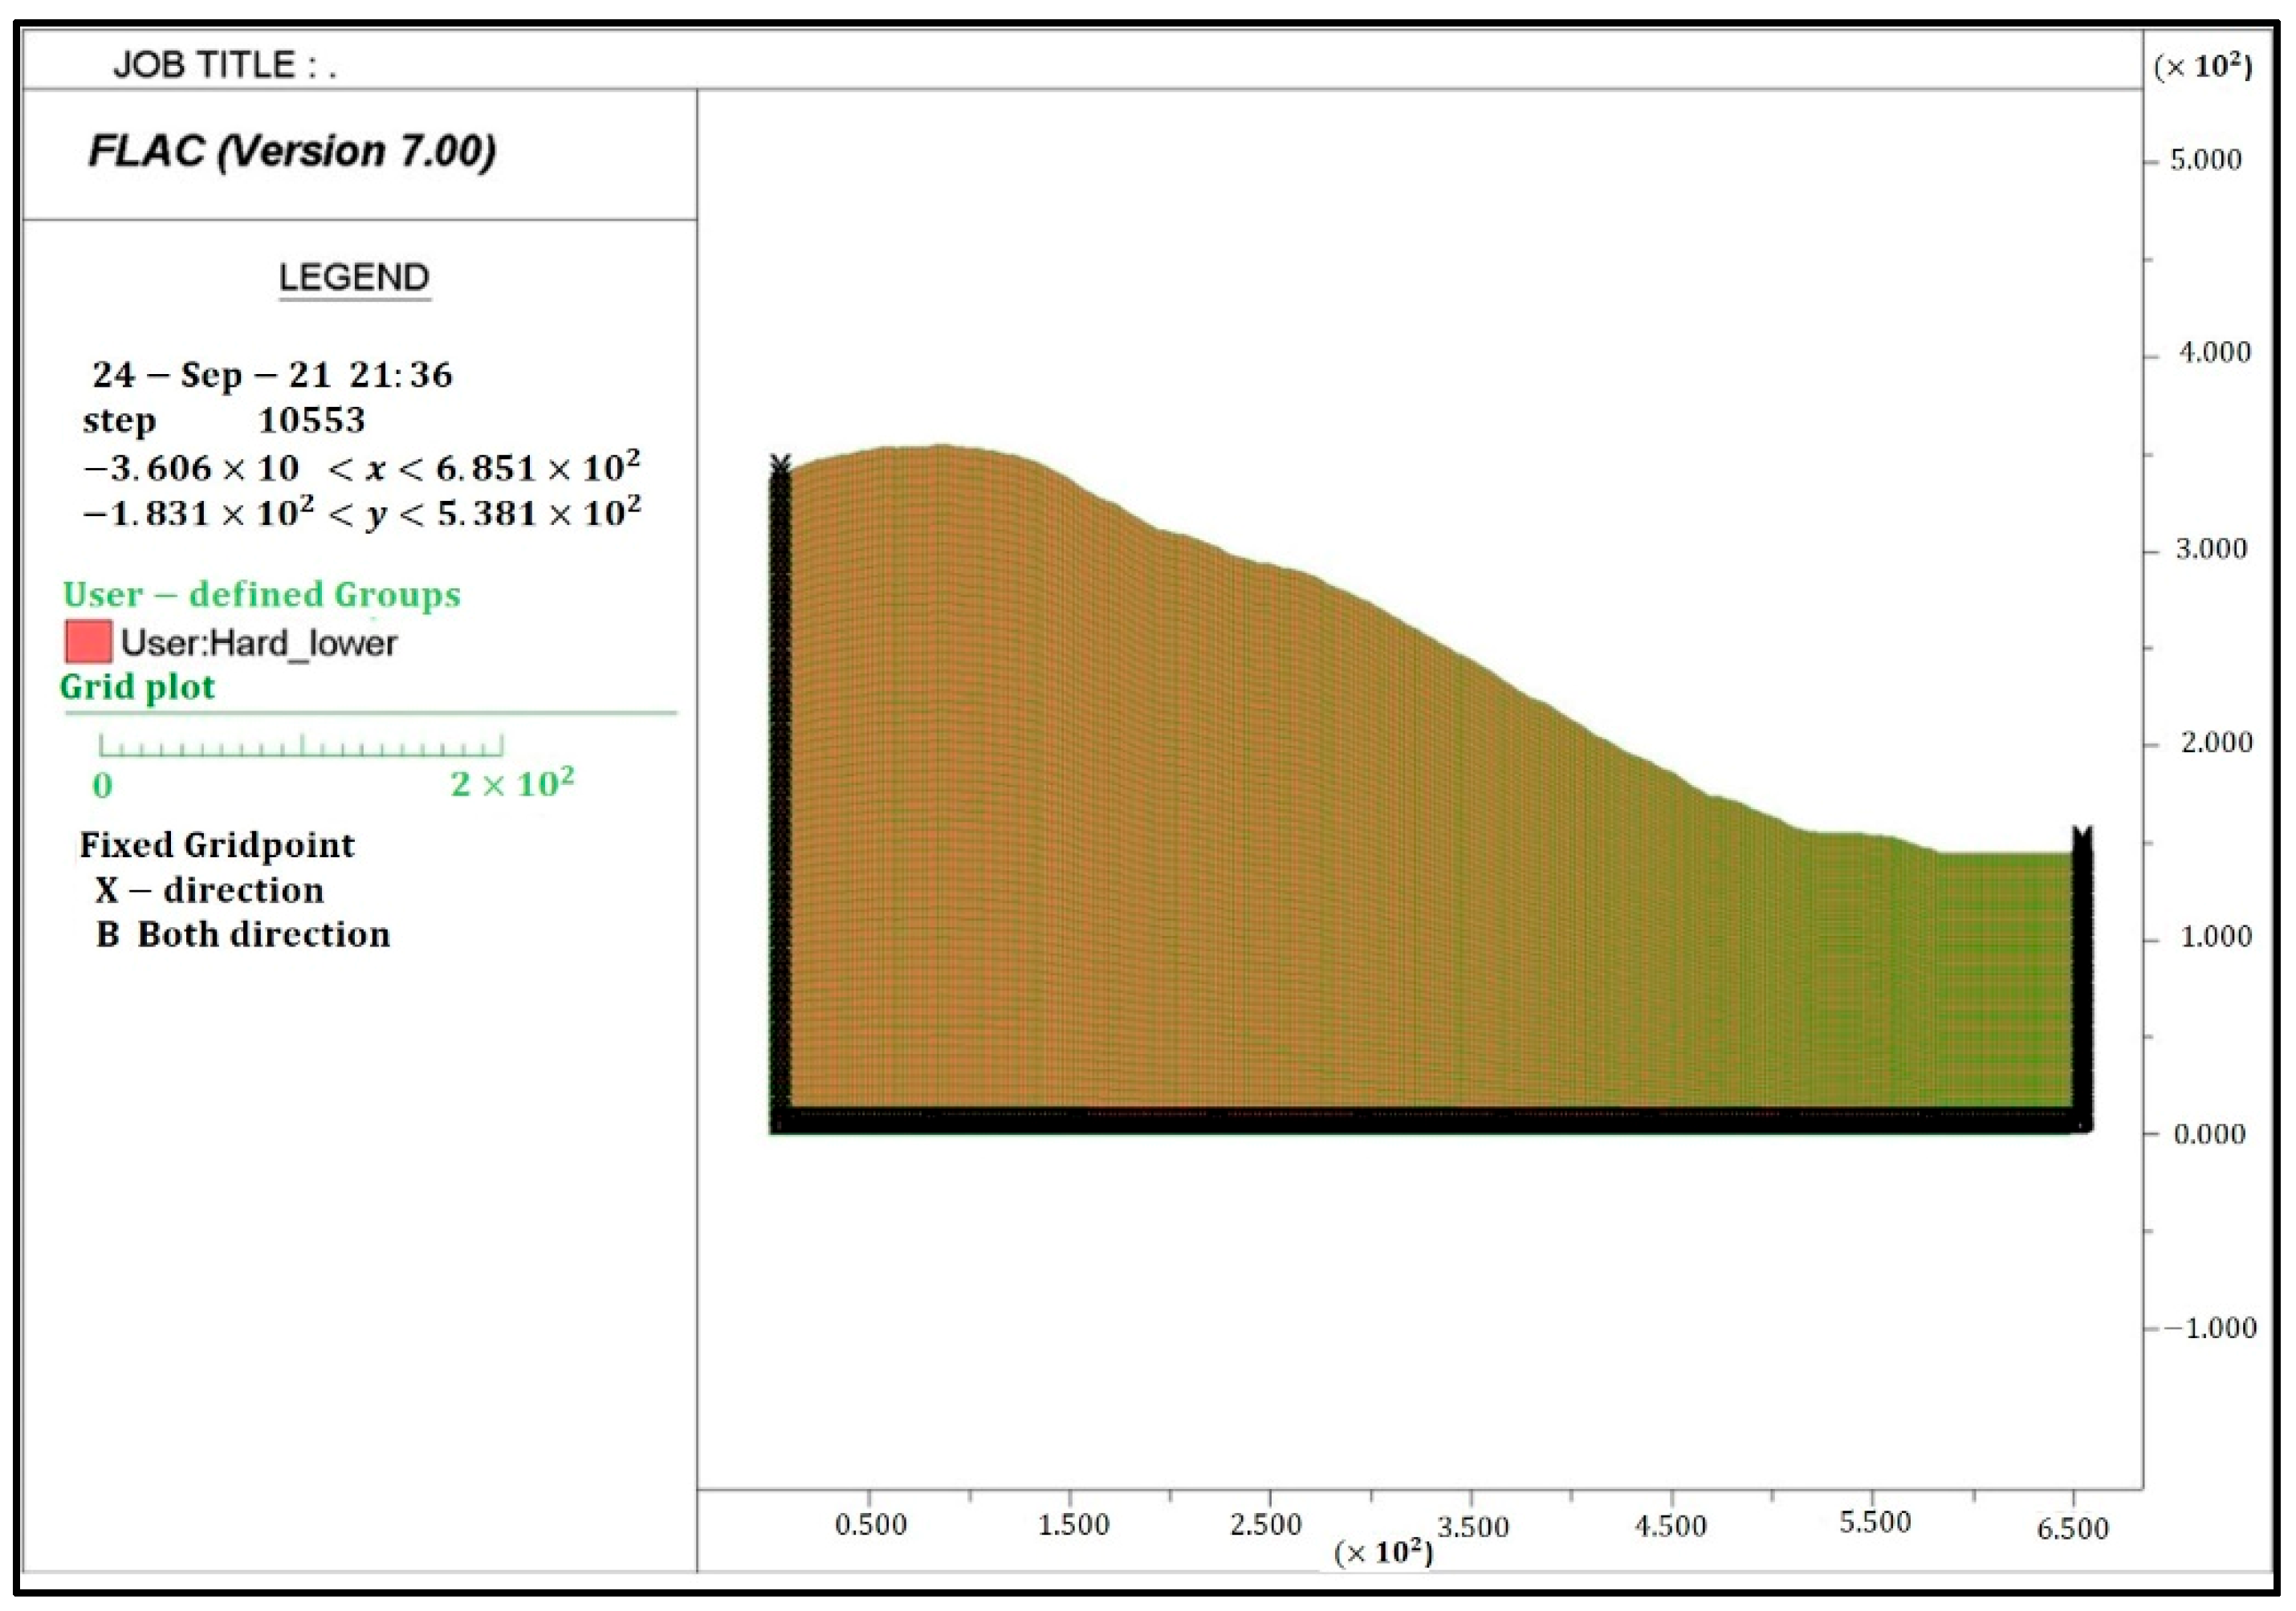
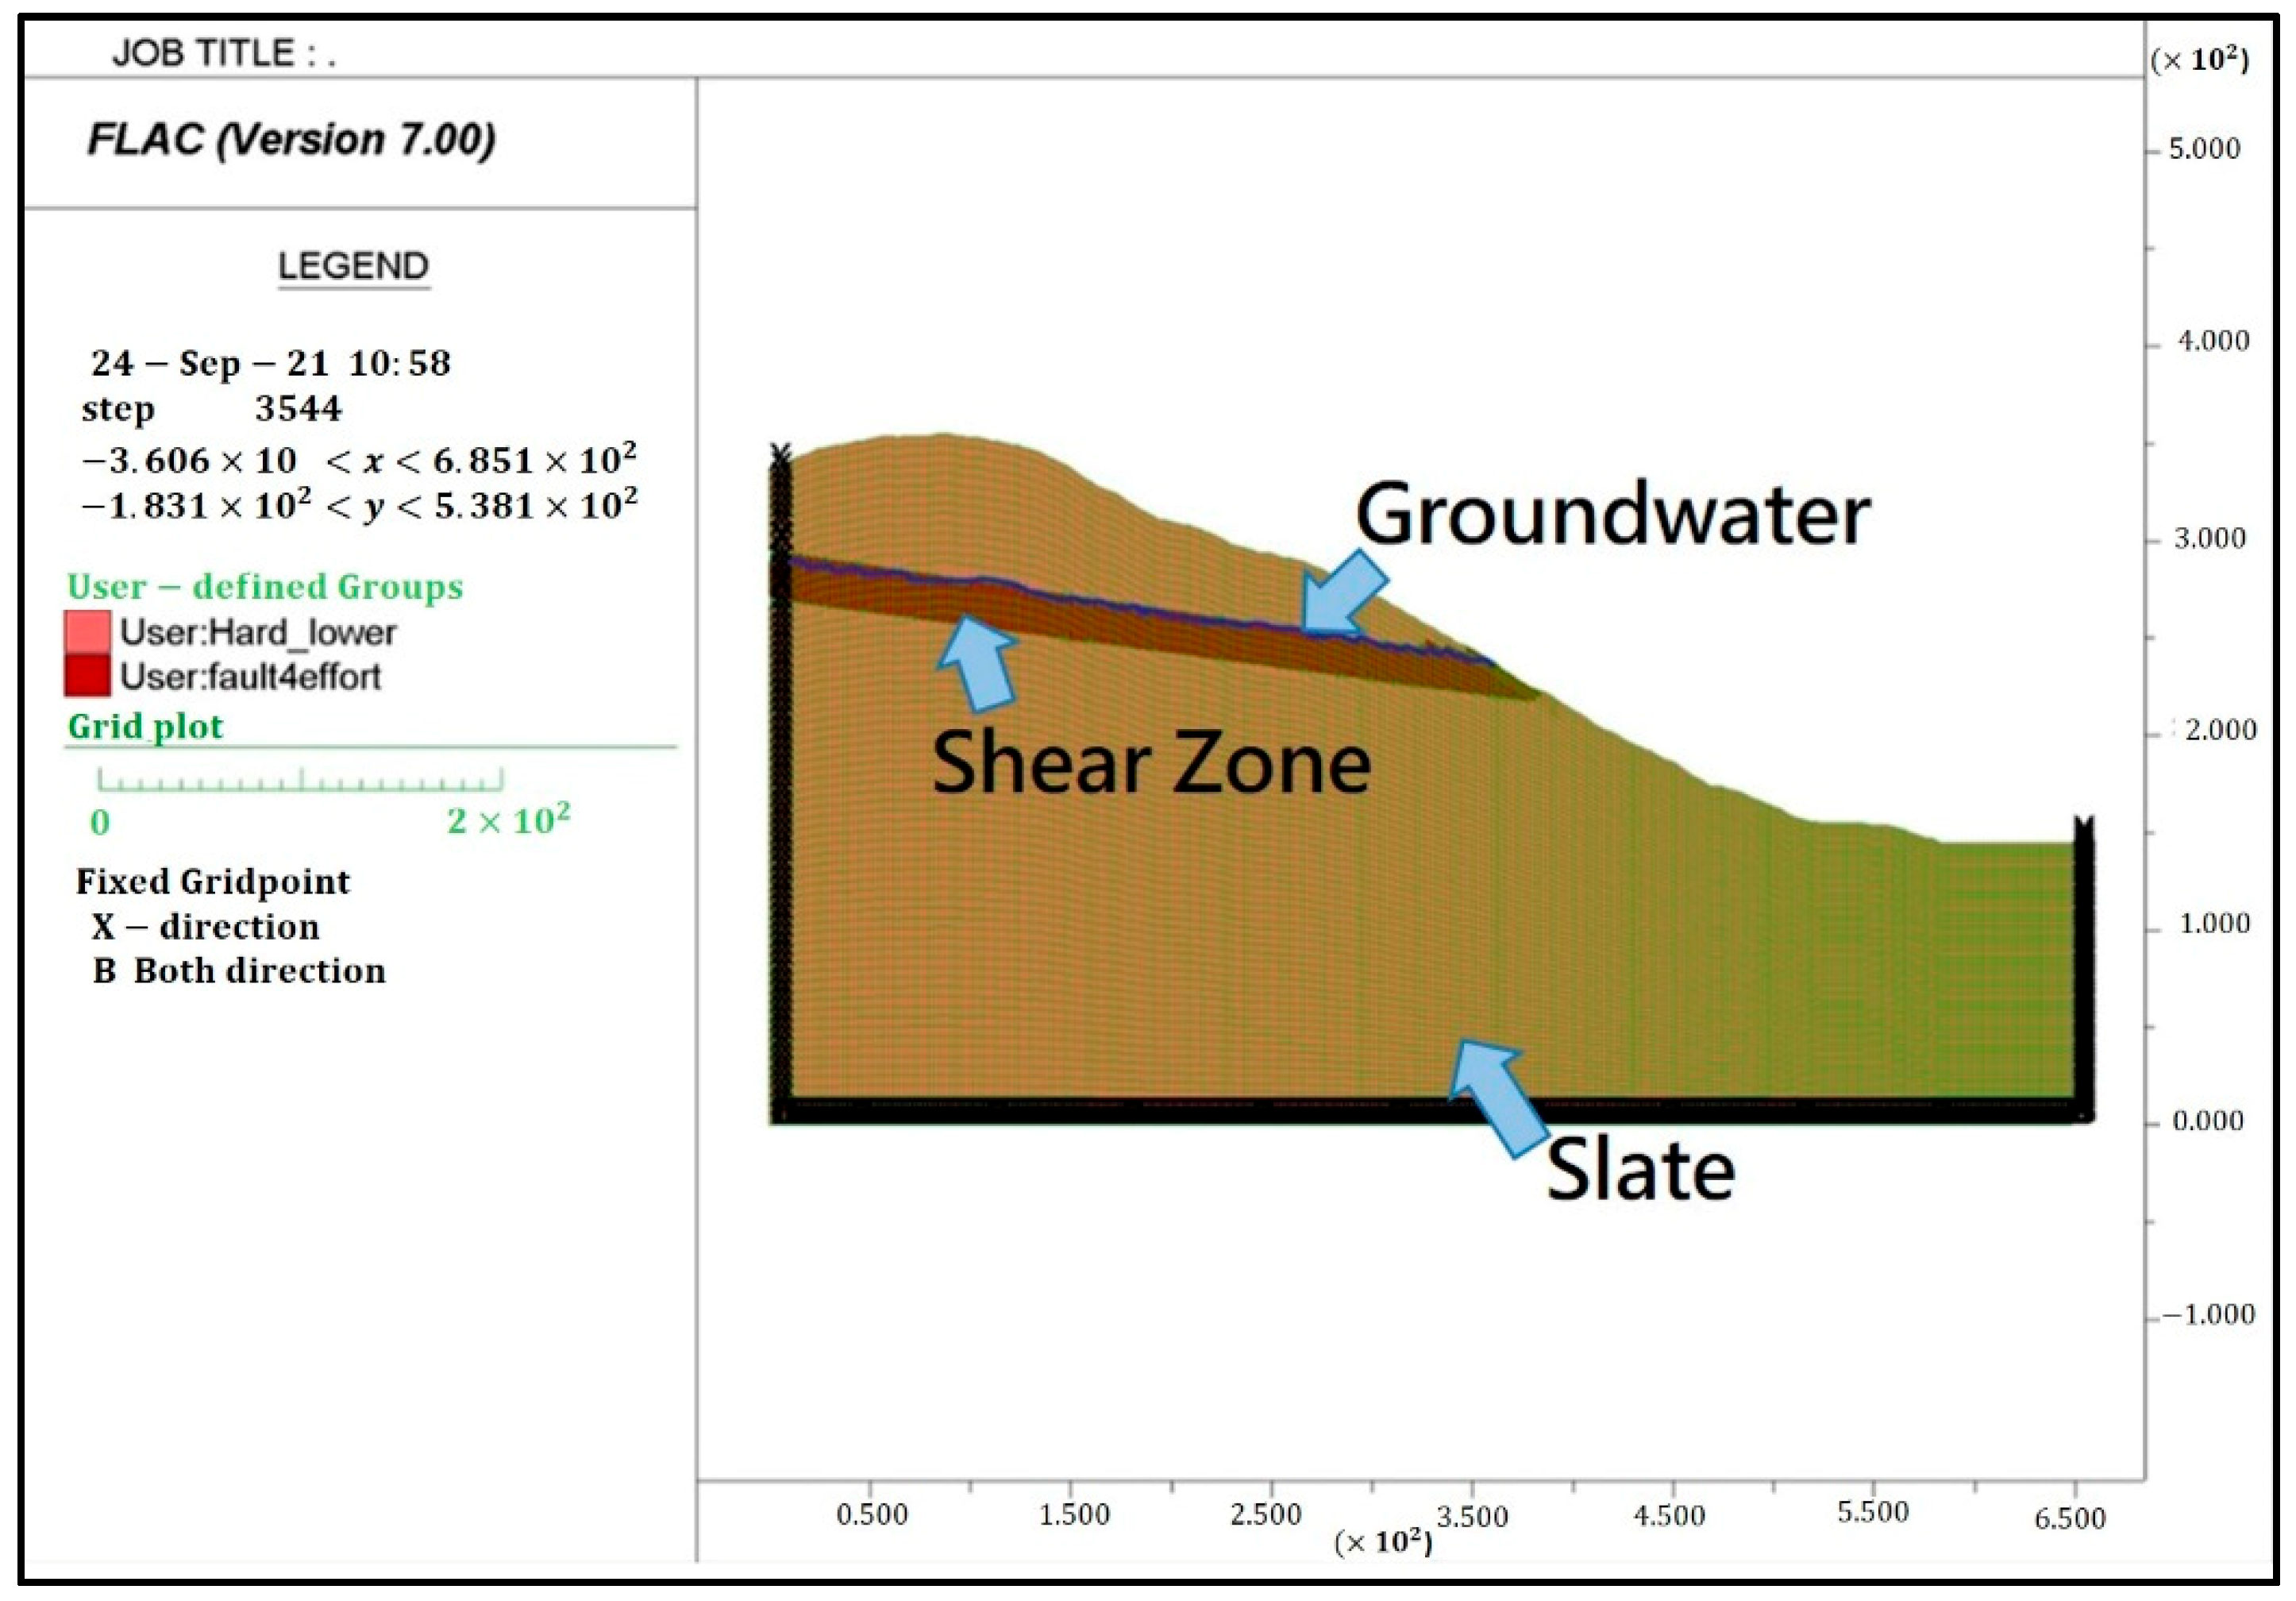
2.4. Numerical Model for Stability Analysis

In order to understand the effect of the geological structures on the stability and failure mechanism of the deep-seated landslide, a numerical analysis was conducted using the Fast Lagrangian Analysis of Continua (FLAC), which was a commercially available software. The FLAC analysis utilizes explicit finite difference method to analyze the two-dimensional stress-strain field of a continuum, and is widely used for the analysis of geotechnical related fields, such as underground excavation, tunneling, slope stability, foundation, and seepage in earth dam [30]. The two-dimensional continuum field is discretized into grids, and the boundary conditions and constitutive law of material are assigned. The equation of motion is adopted to calculate the unbalanced force for each grid point in sequential time step. The strain increment and stress are calculated from the unbalanced force following each time step, and the resulting new set of unbalanced force is applied in the subsequent time step calculation. The iterative procedures continue until the differences in unbalanced forces become negligible. The final stress and displacement condition of the continuum are thus determined. In this study, the two-dimensional profile of the slope along the main sliding direction was taken for stability analysis. The DTM5 derived in 2003 is used to construct the model slope to properly present the slope topography before the 2005 event as illustrated in Figure 5. The lateral boundaries of the model were assumed to have no lateral displacement, and the base boundary was assumed fixed with no displacement. The boundaries are set at a sufficient distance so that the main slope body will not be affected by the boundary constraint. The material was assumed to behave elasto-plastically, and the Mohr-Coulomb constitutive model was adopted. The model profile was constructed following the investigated results of ground layers, geological structures, and ground water table. The material properties were assigned following data of previous research and results of laboratory tests. The analysis procedures are carried out by: (1) forming the grid of slope model, and assigning constitutive law and material properties; (2) set up boundaries and initiate geo-static stress field; (3) apply ground water condition assumption; and (4) solve for stress-strain field of the model slope.

3. Results

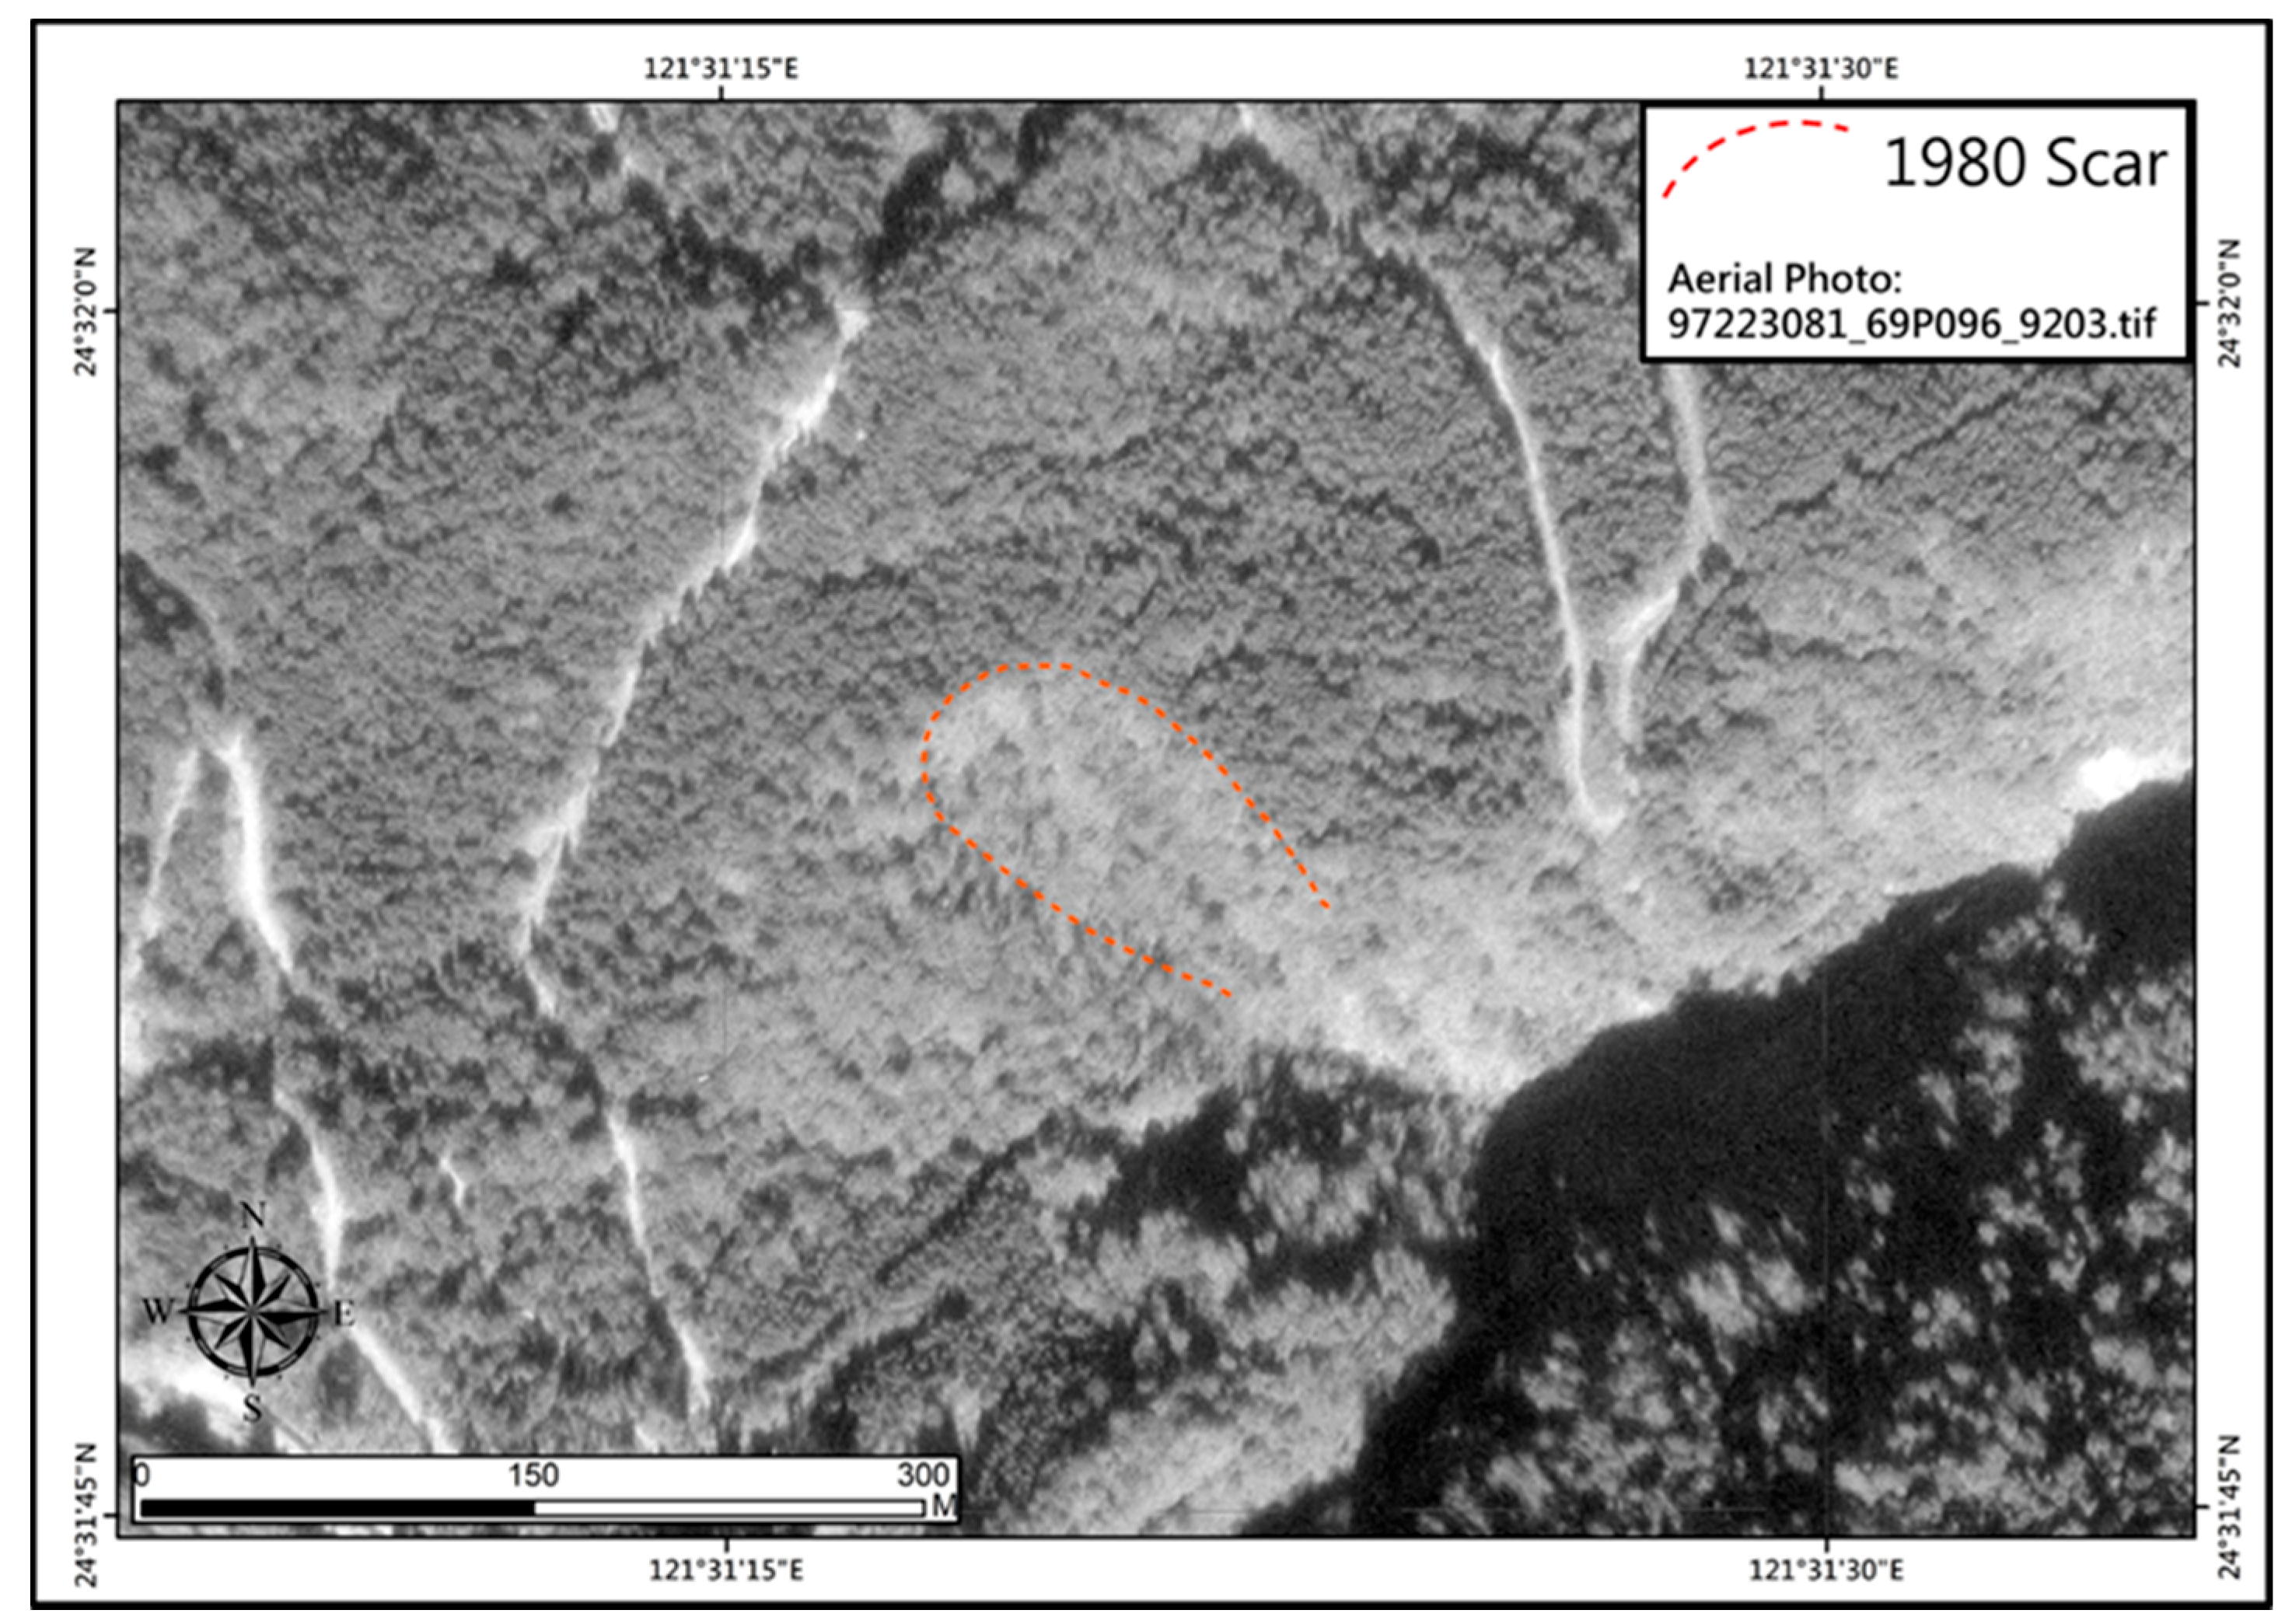
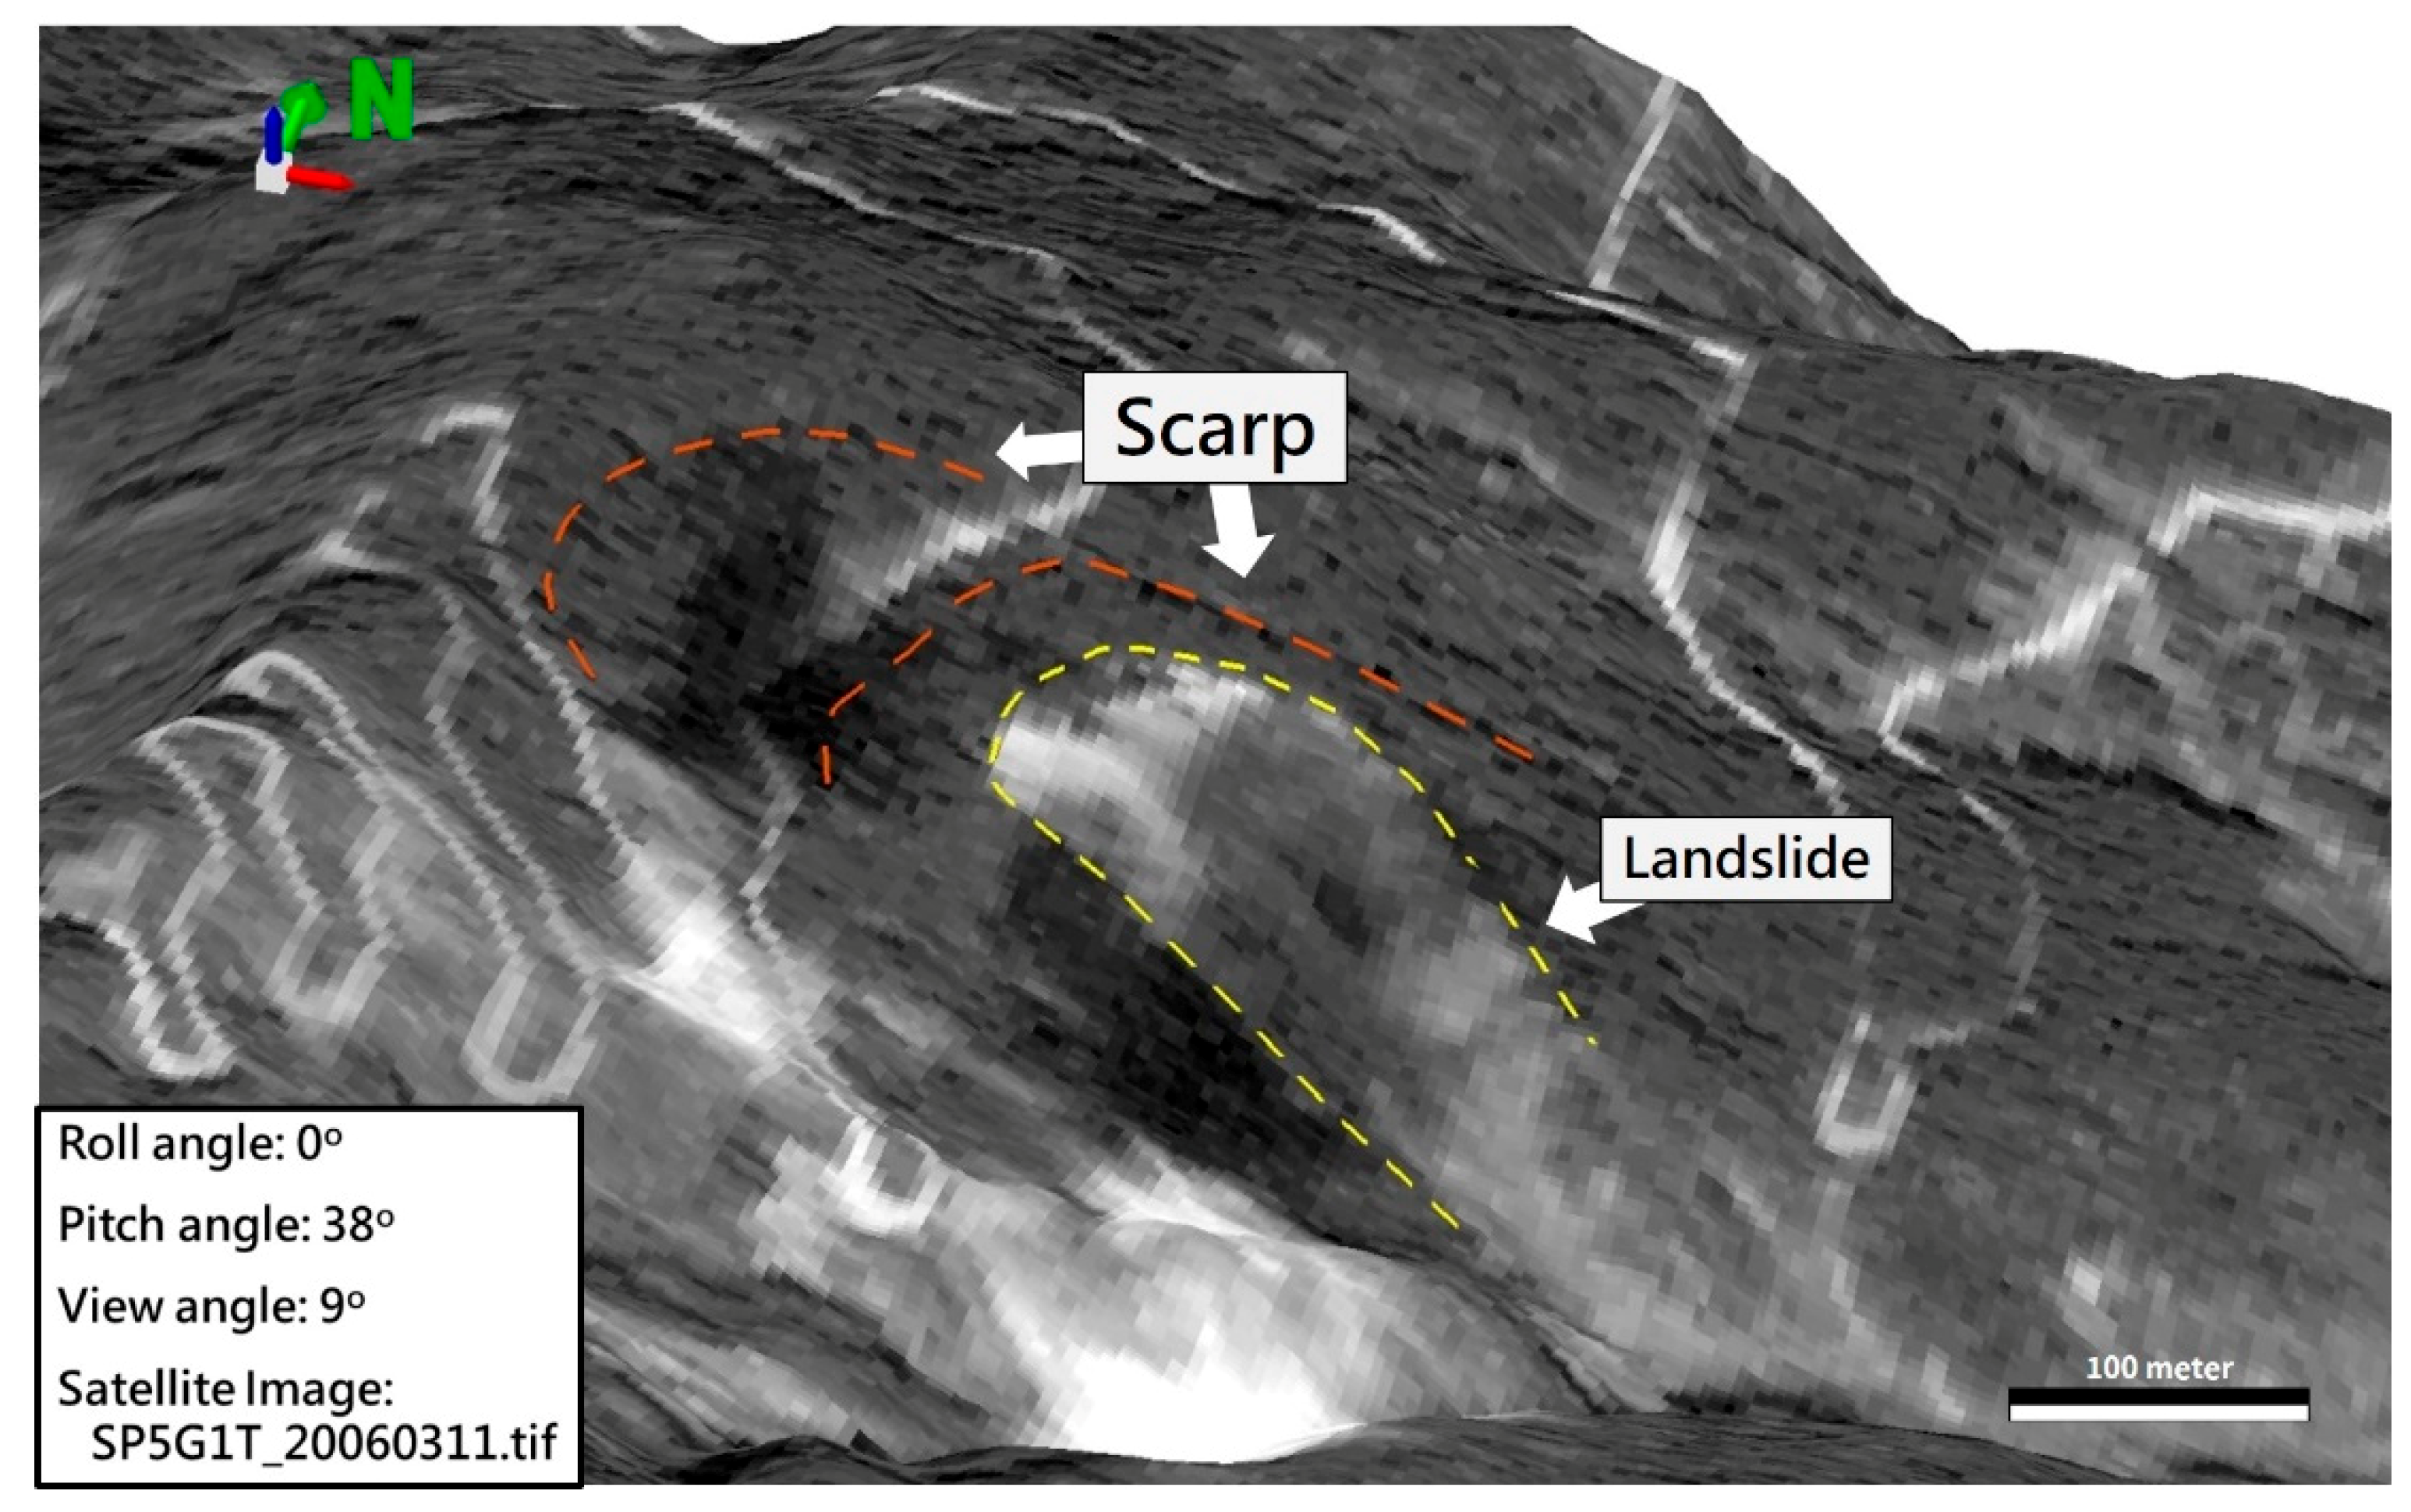
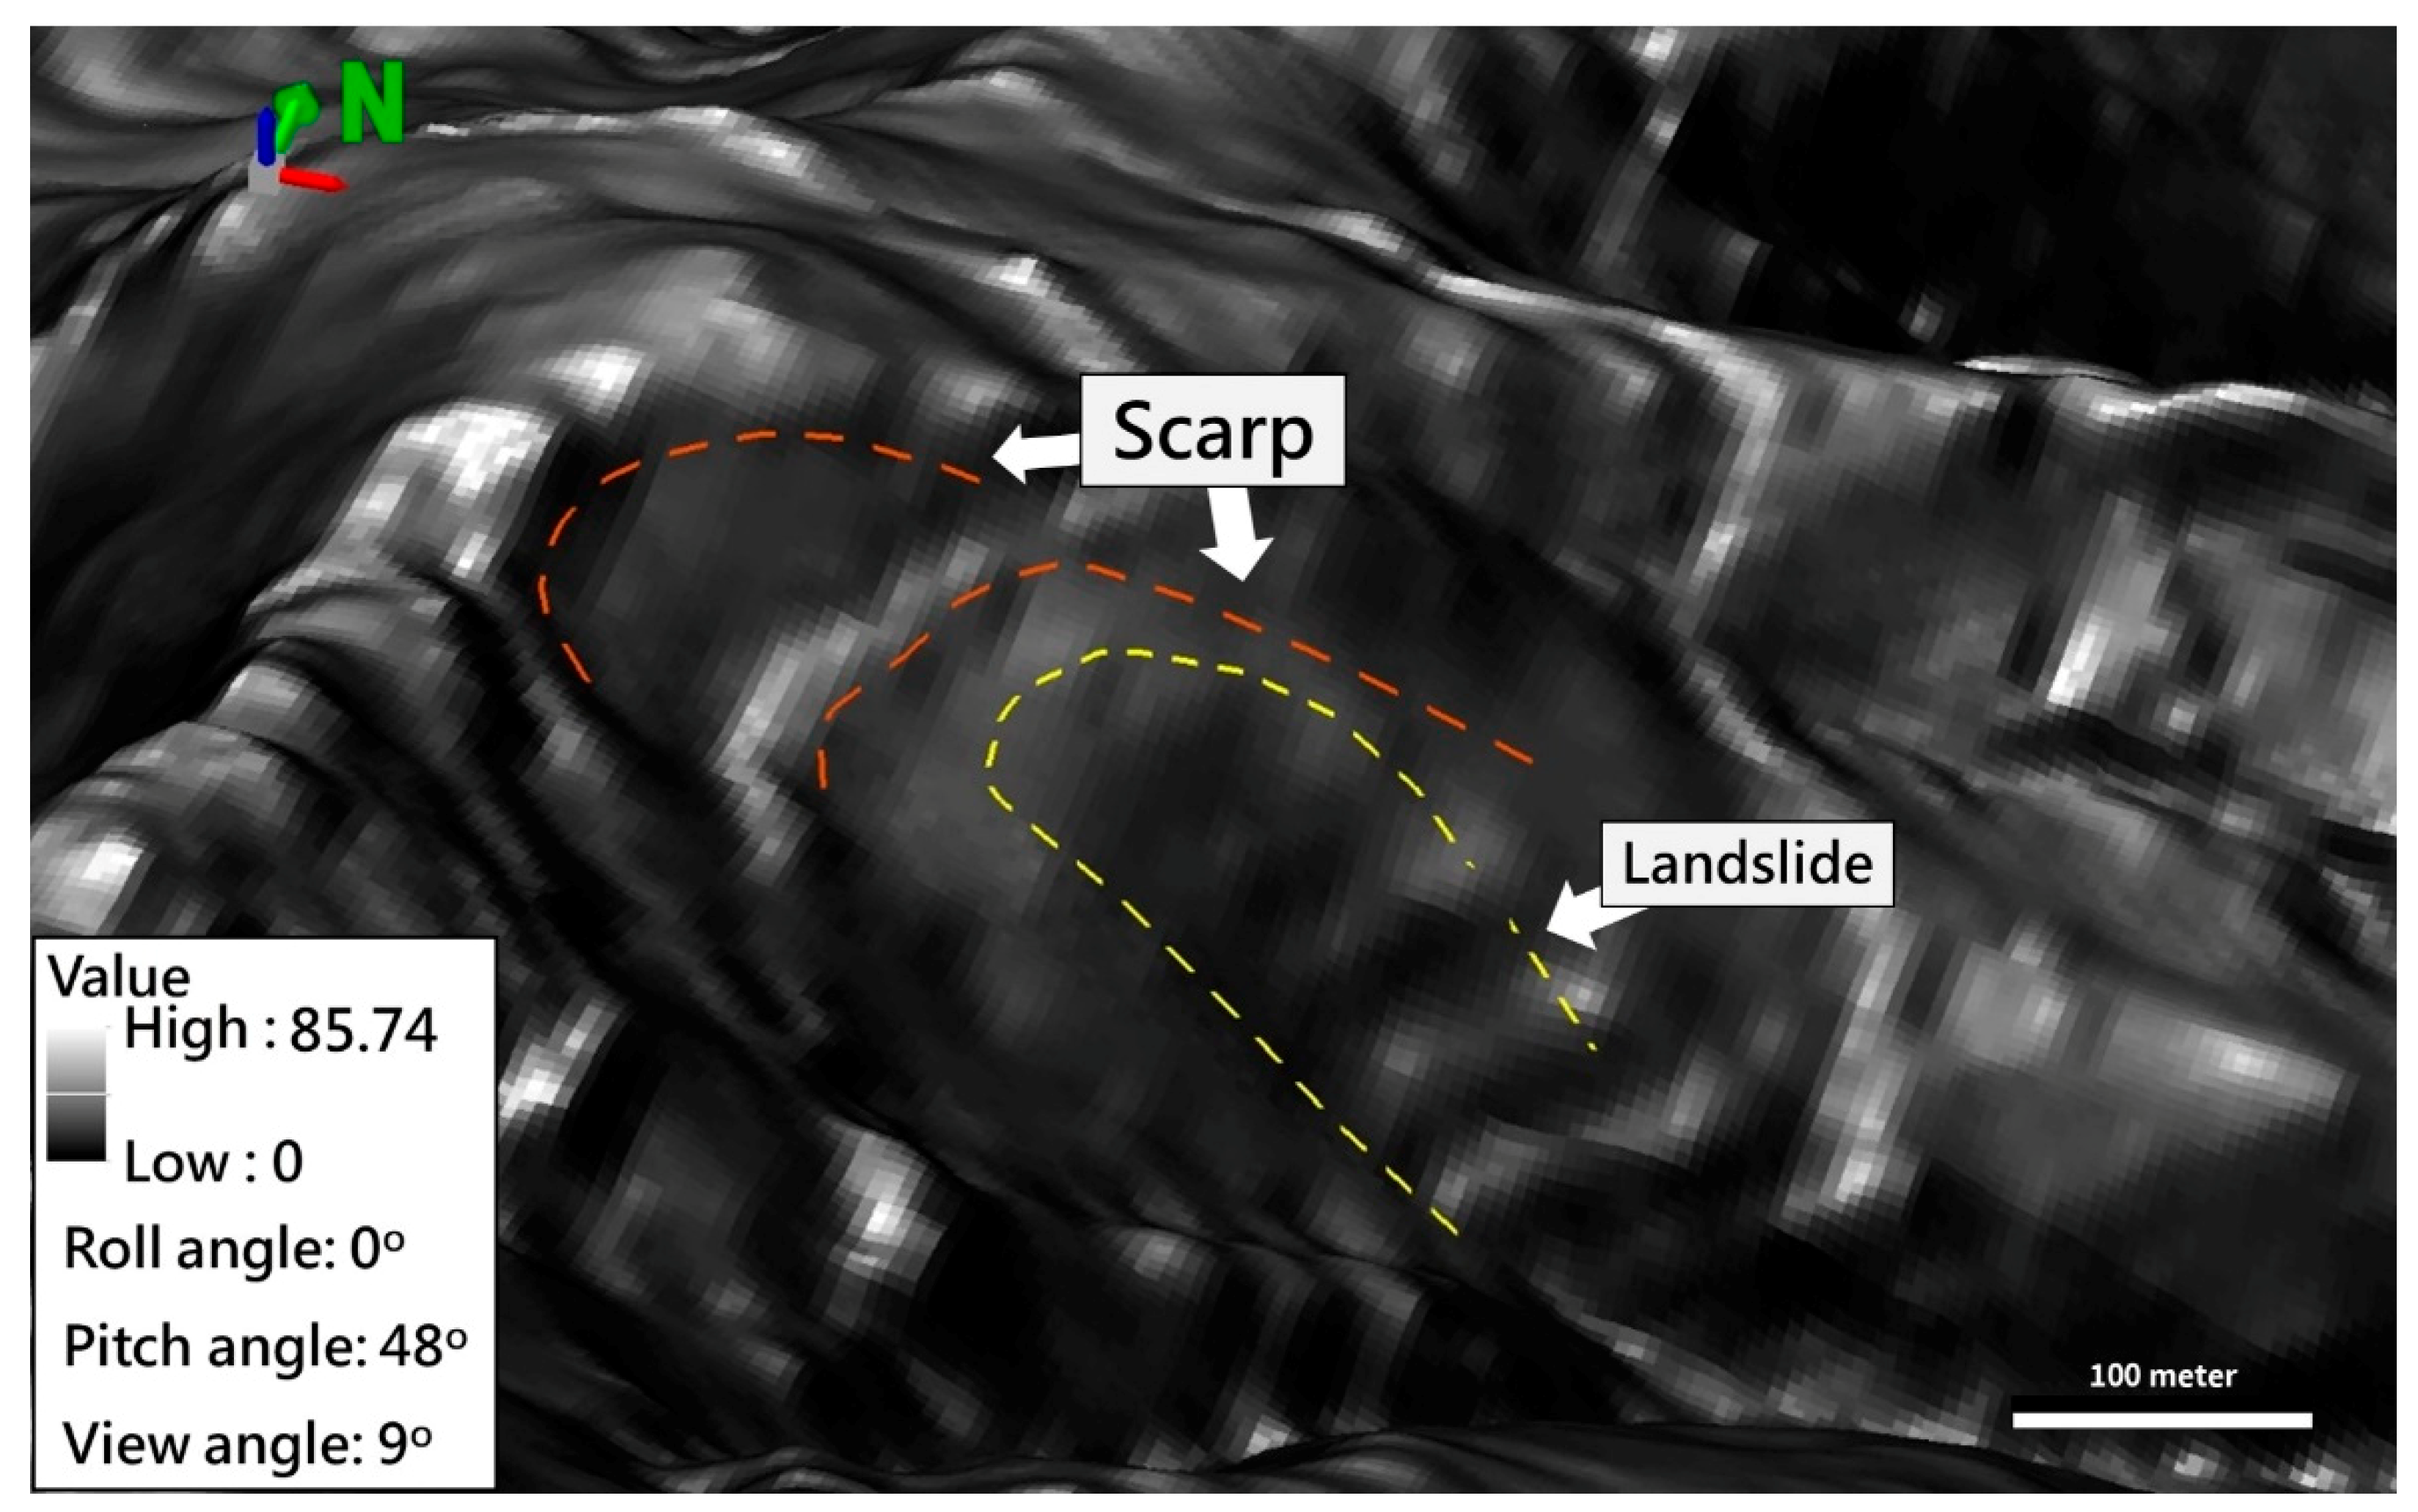
3.1. Identification of the Deep-Seated Landslide and the 2005 Event

The Lantai study area has a long history of deep-seated landslide activities with the first recorded event before 1980. The aerial photograph acquired on 30 November 1980 is the first aerial image record of the landslide as shown in Figure 6. We can observe the bare land exposed due to the landslide before 1980 with dash line marking the edge of the exposed ground, and some vegetation developed after the landslide. A lineament suggesting head scarp can be observed in the up-slope direction of the dashed line just beneath the road. Recurring landslide activities were reported in 2001 by Typhoon Nari, 2005 by Typhoon Haitang, and 2015 by Typhoon Soudelor, and some other smaller events. The events in 2001 and 2015 damaged the road with not so significant scale. Typhoon Haitang hit the Lantai area on 17 July 2005, bringing more than 1000 mm accumulated rainfall, and caused a significant landslide damaging the road and retaining structure severely. The SPOT5 images acquired on 16 March 2005 before and 11 March 2006 after the typhoon event are shown in Figure 7. In the SPOT5 image before typhoon (Figure 7a), the exposed ground can be observed with another scarp developed further up slope. The SPOT5 image after typhoon (Figure 7b) showed a significant enlargement and further development of the exposed landslide scar compared to the image before typhoon. The lineament of the scarp further up slope beneath the road can be observed clearly in both images. Observing the topographic and ground variations especially the head scarp caused by the landslide event in the images, the locations of scarp and landslide could be mapped. The SPOT5 image after the event was overlaid on DTM5 three-dimensionally in Figure 8, which accentuated the topographic variations and lineament of the scarp caused by the landslide. Through inspection from different aspects three-dimensionally, mapping of the scarp and the deep-seated landslide was finalized as shown in Figure 8. The scarps of the landslide appeared to enlarge and develop retrogressively up slope. A new scarp further up slope of the road was observed and mapped. Further validation of the mapped scarp was conducted by overlaying the mapped scarp and SPOT5 image on the slope map derived from DTM5 in Figure 9. It was found that the location of mapped scarps situated where significant topographic variation showing subsidence was, and appeared to consist with the geomorphological characteristics of the deep-seated landslide.

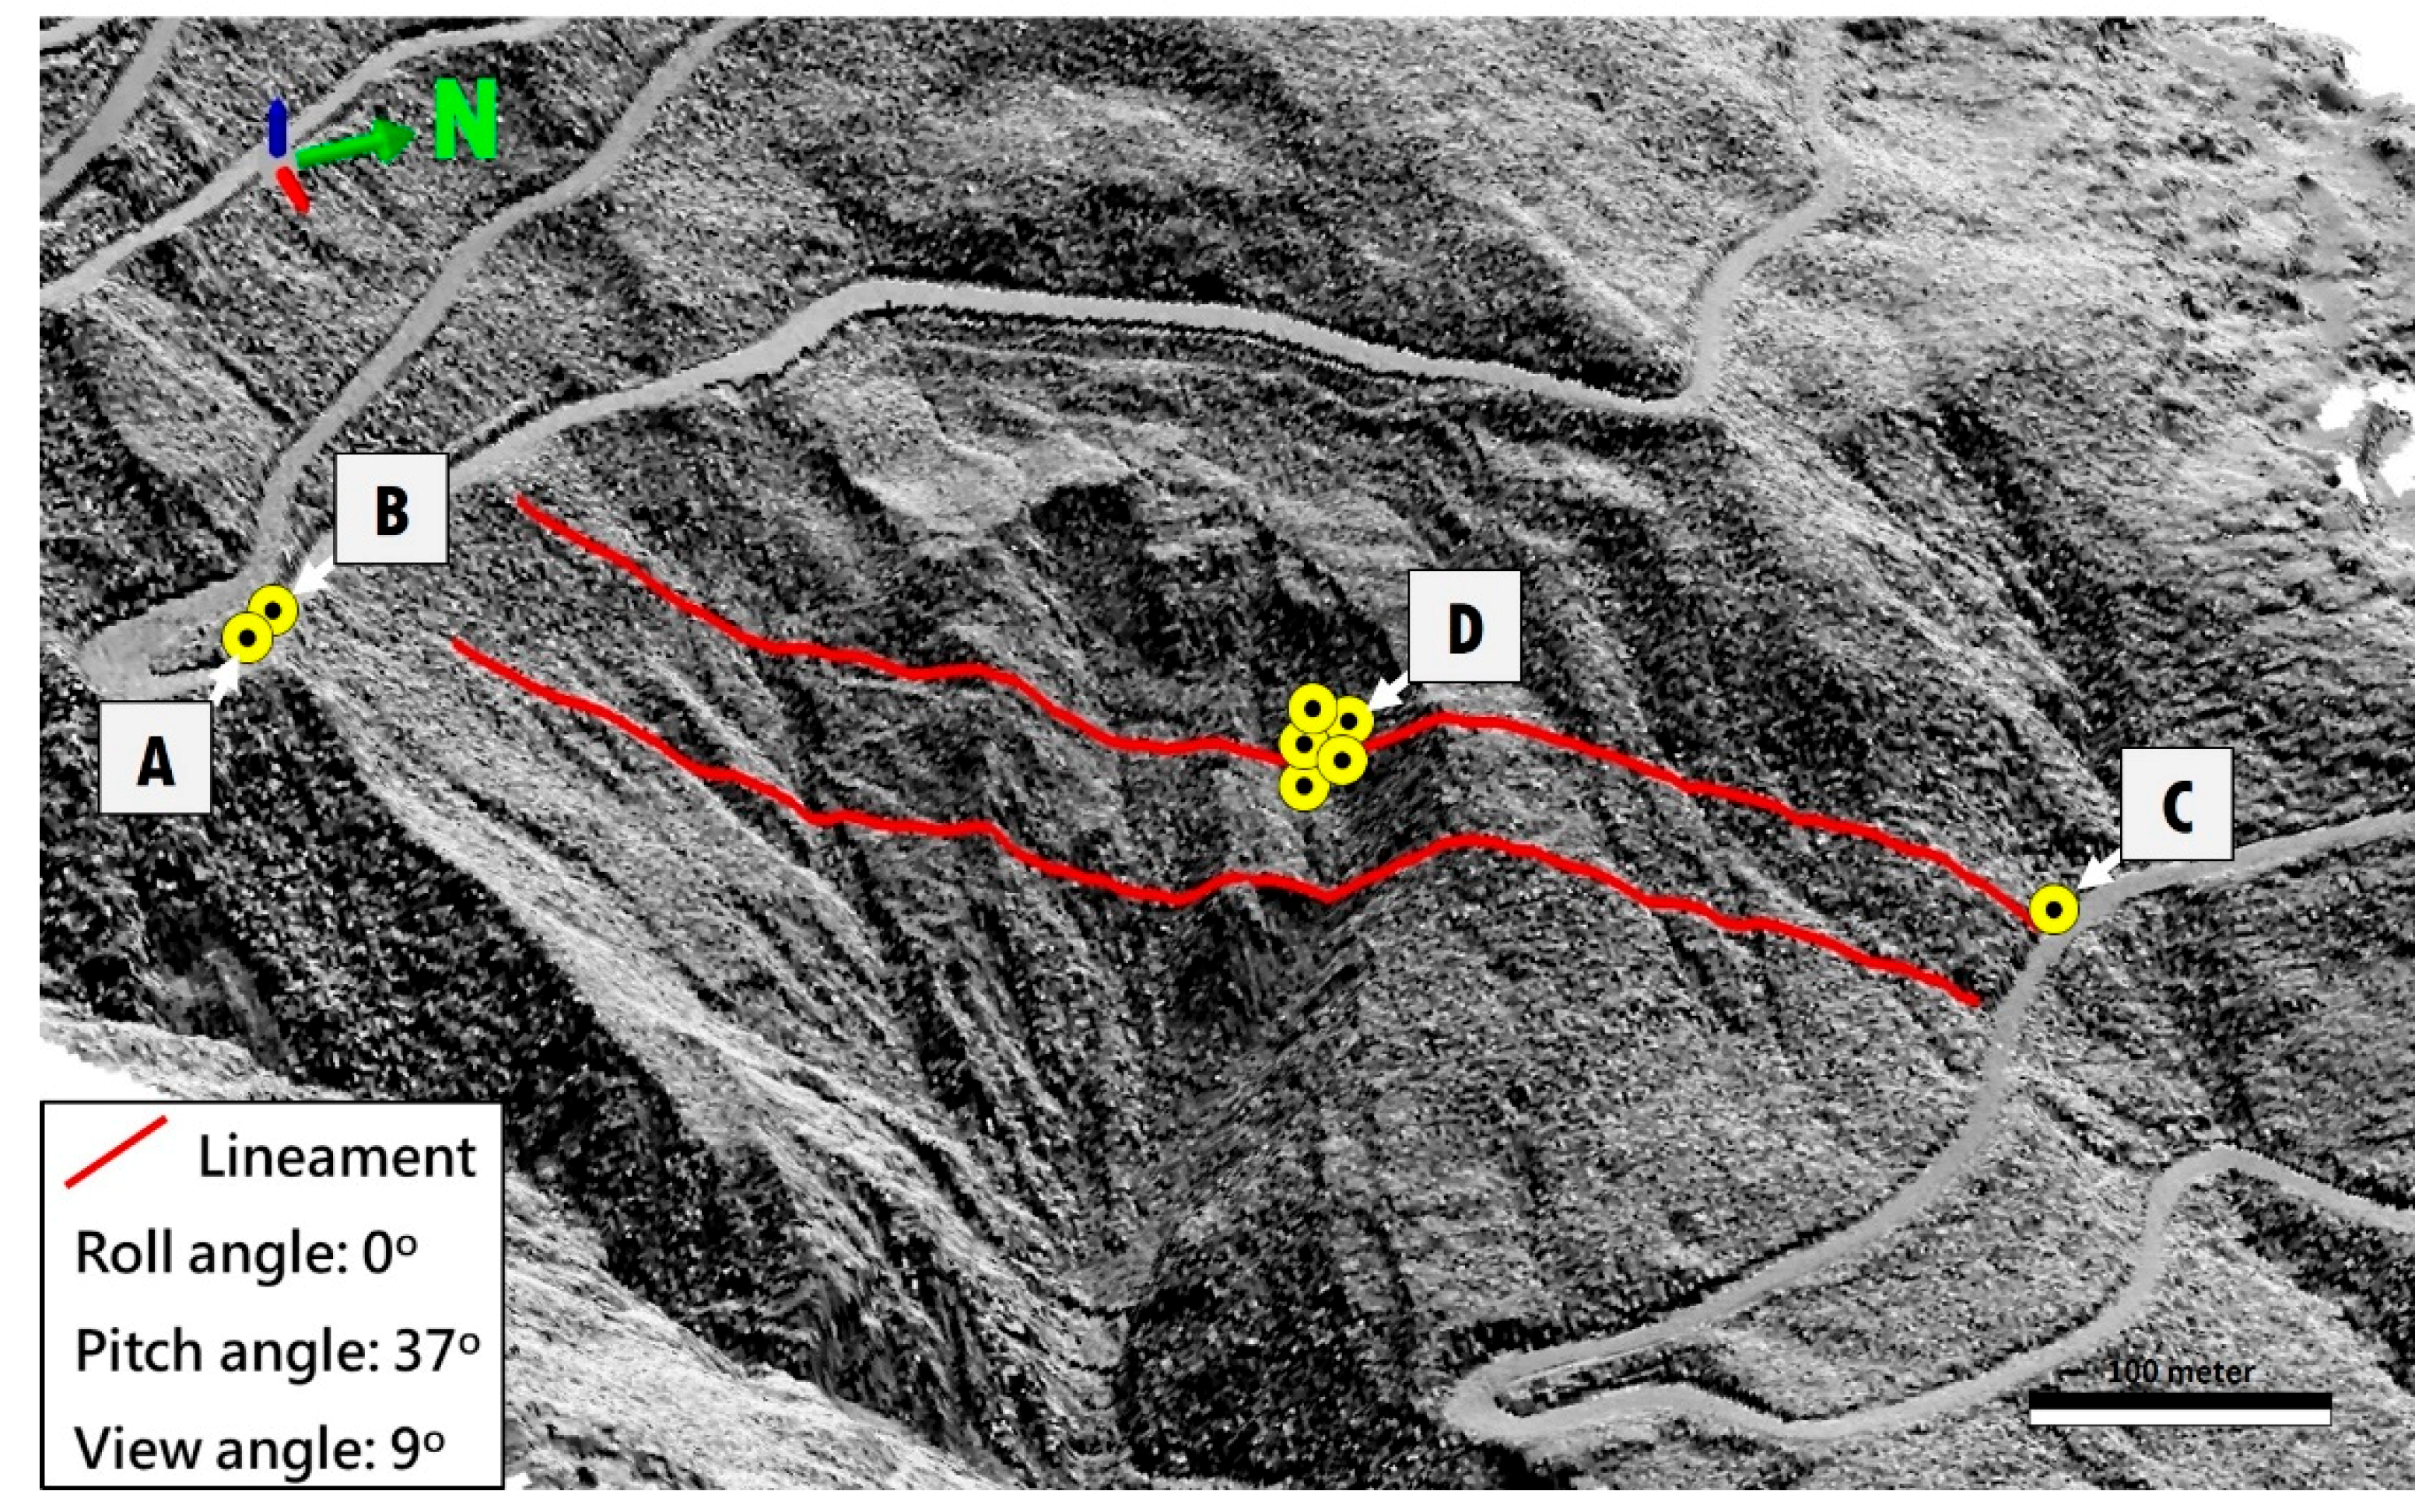
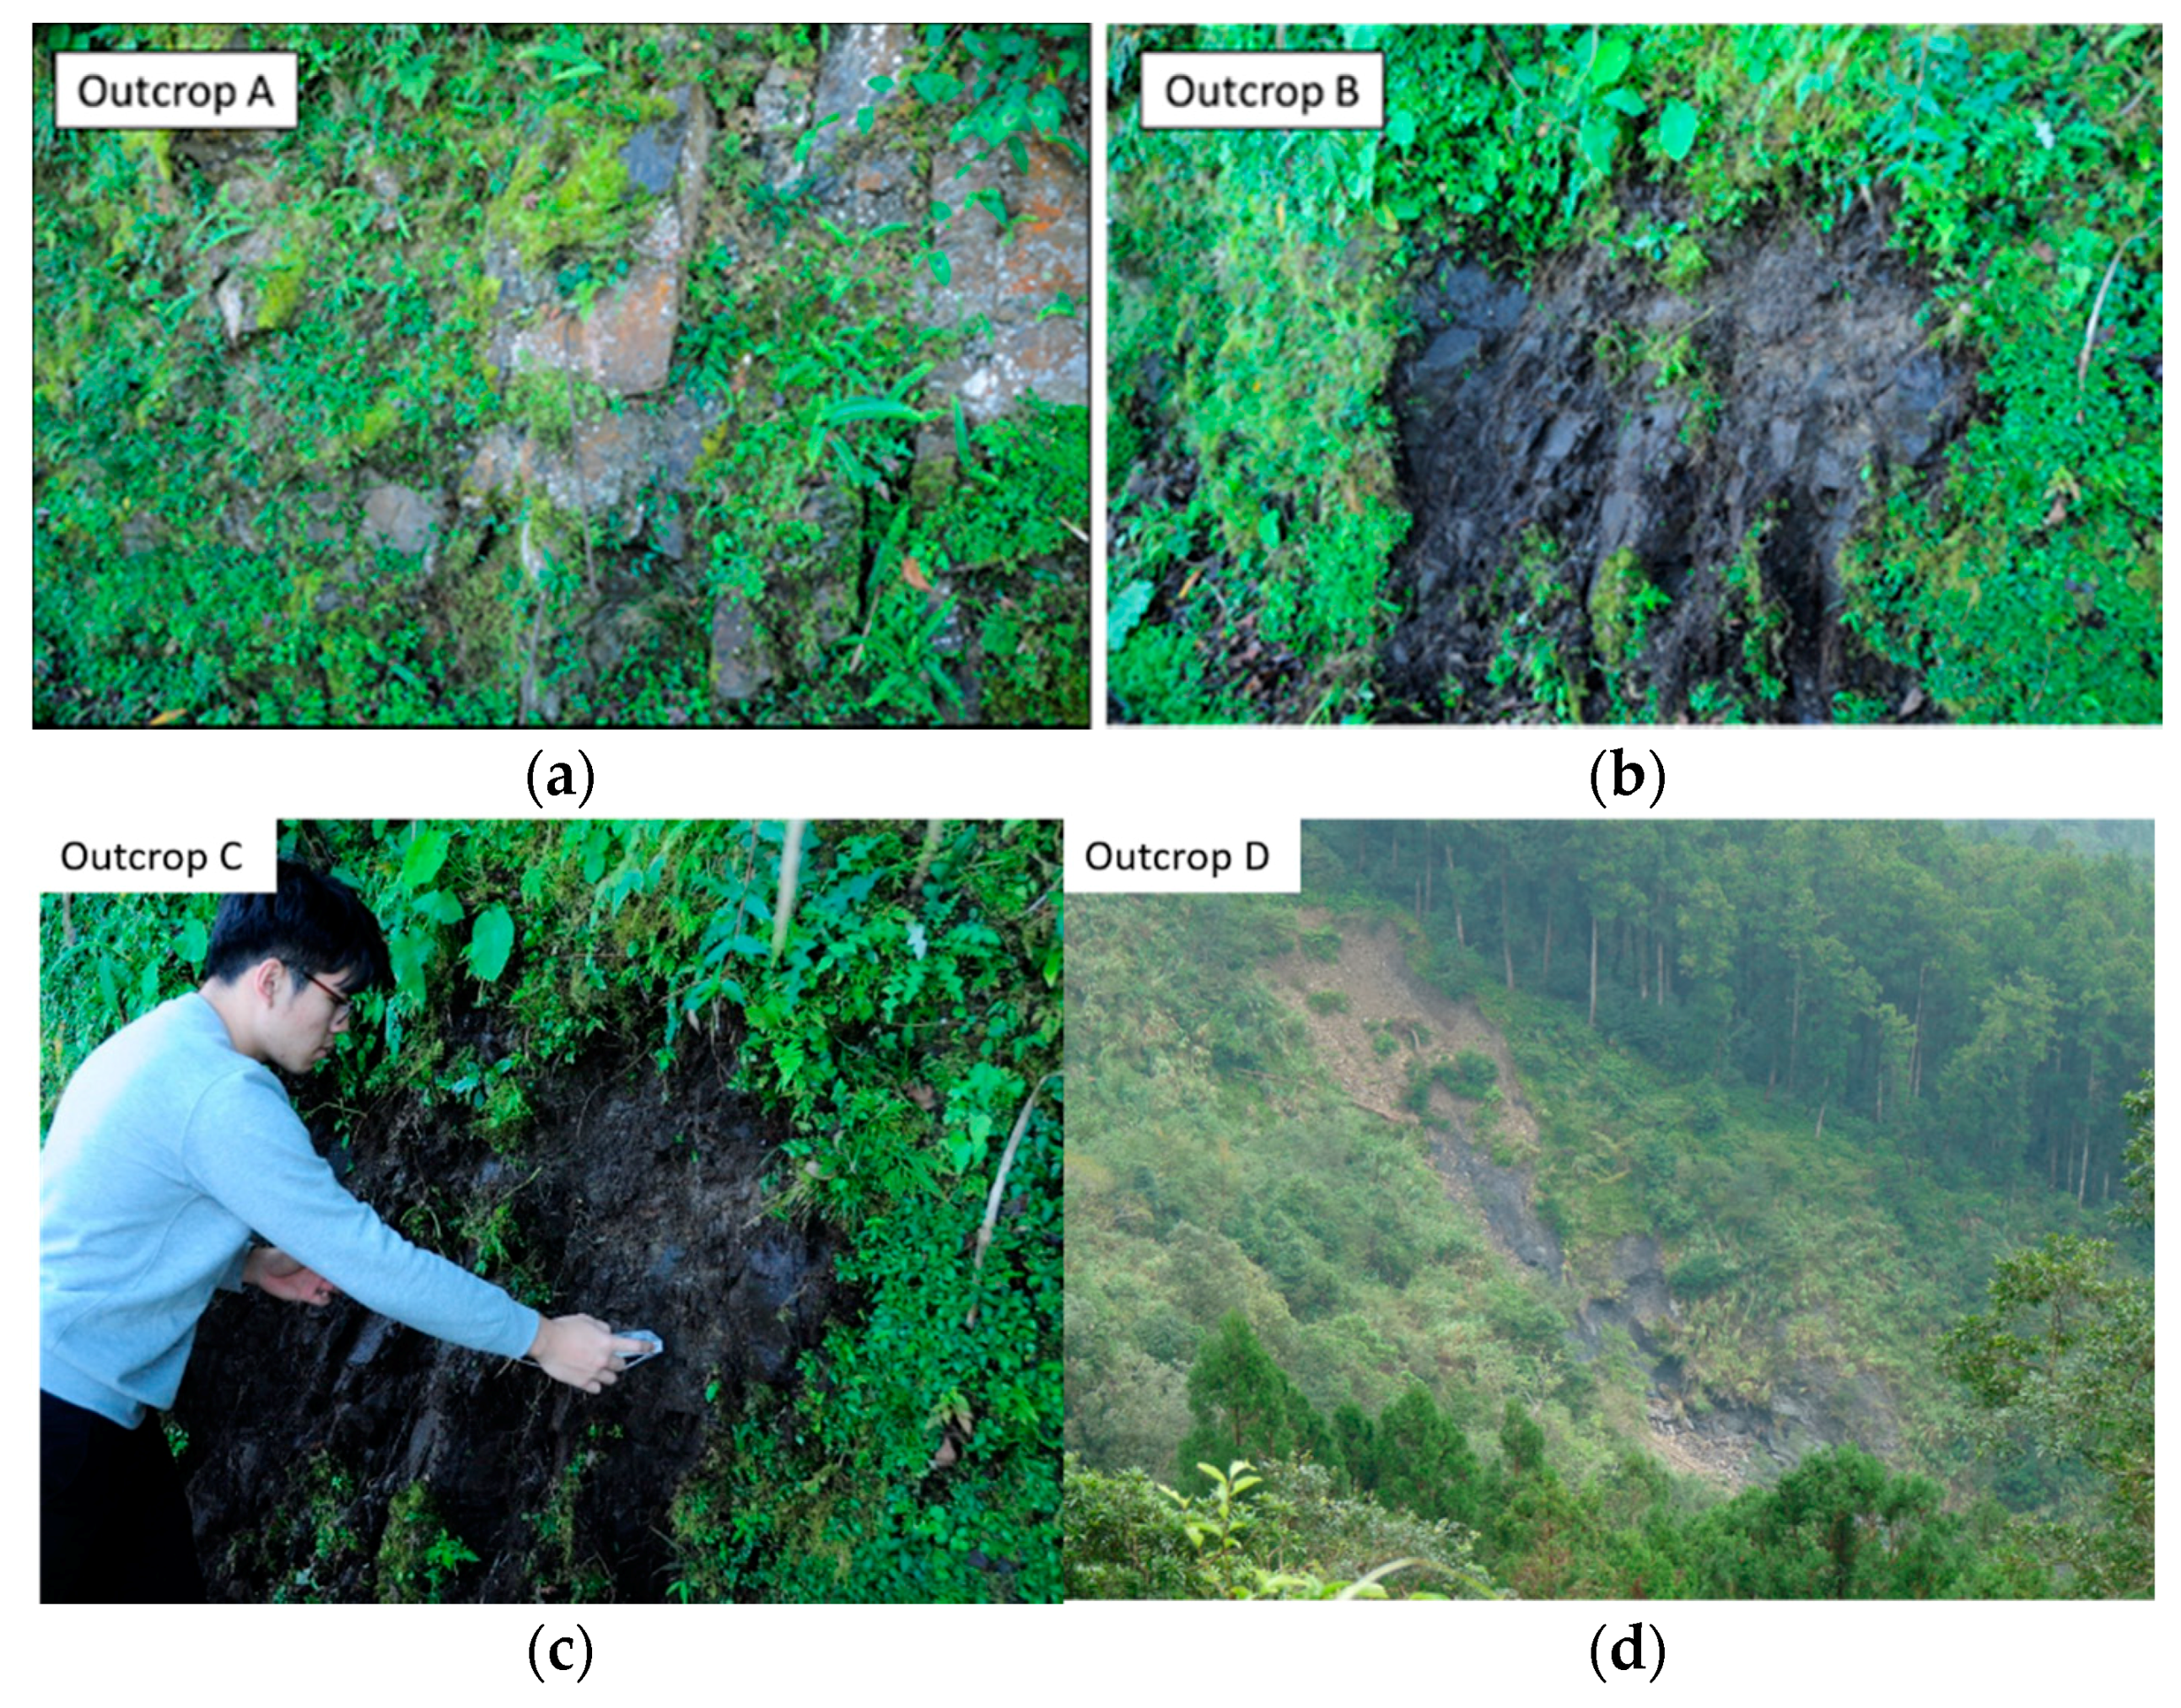
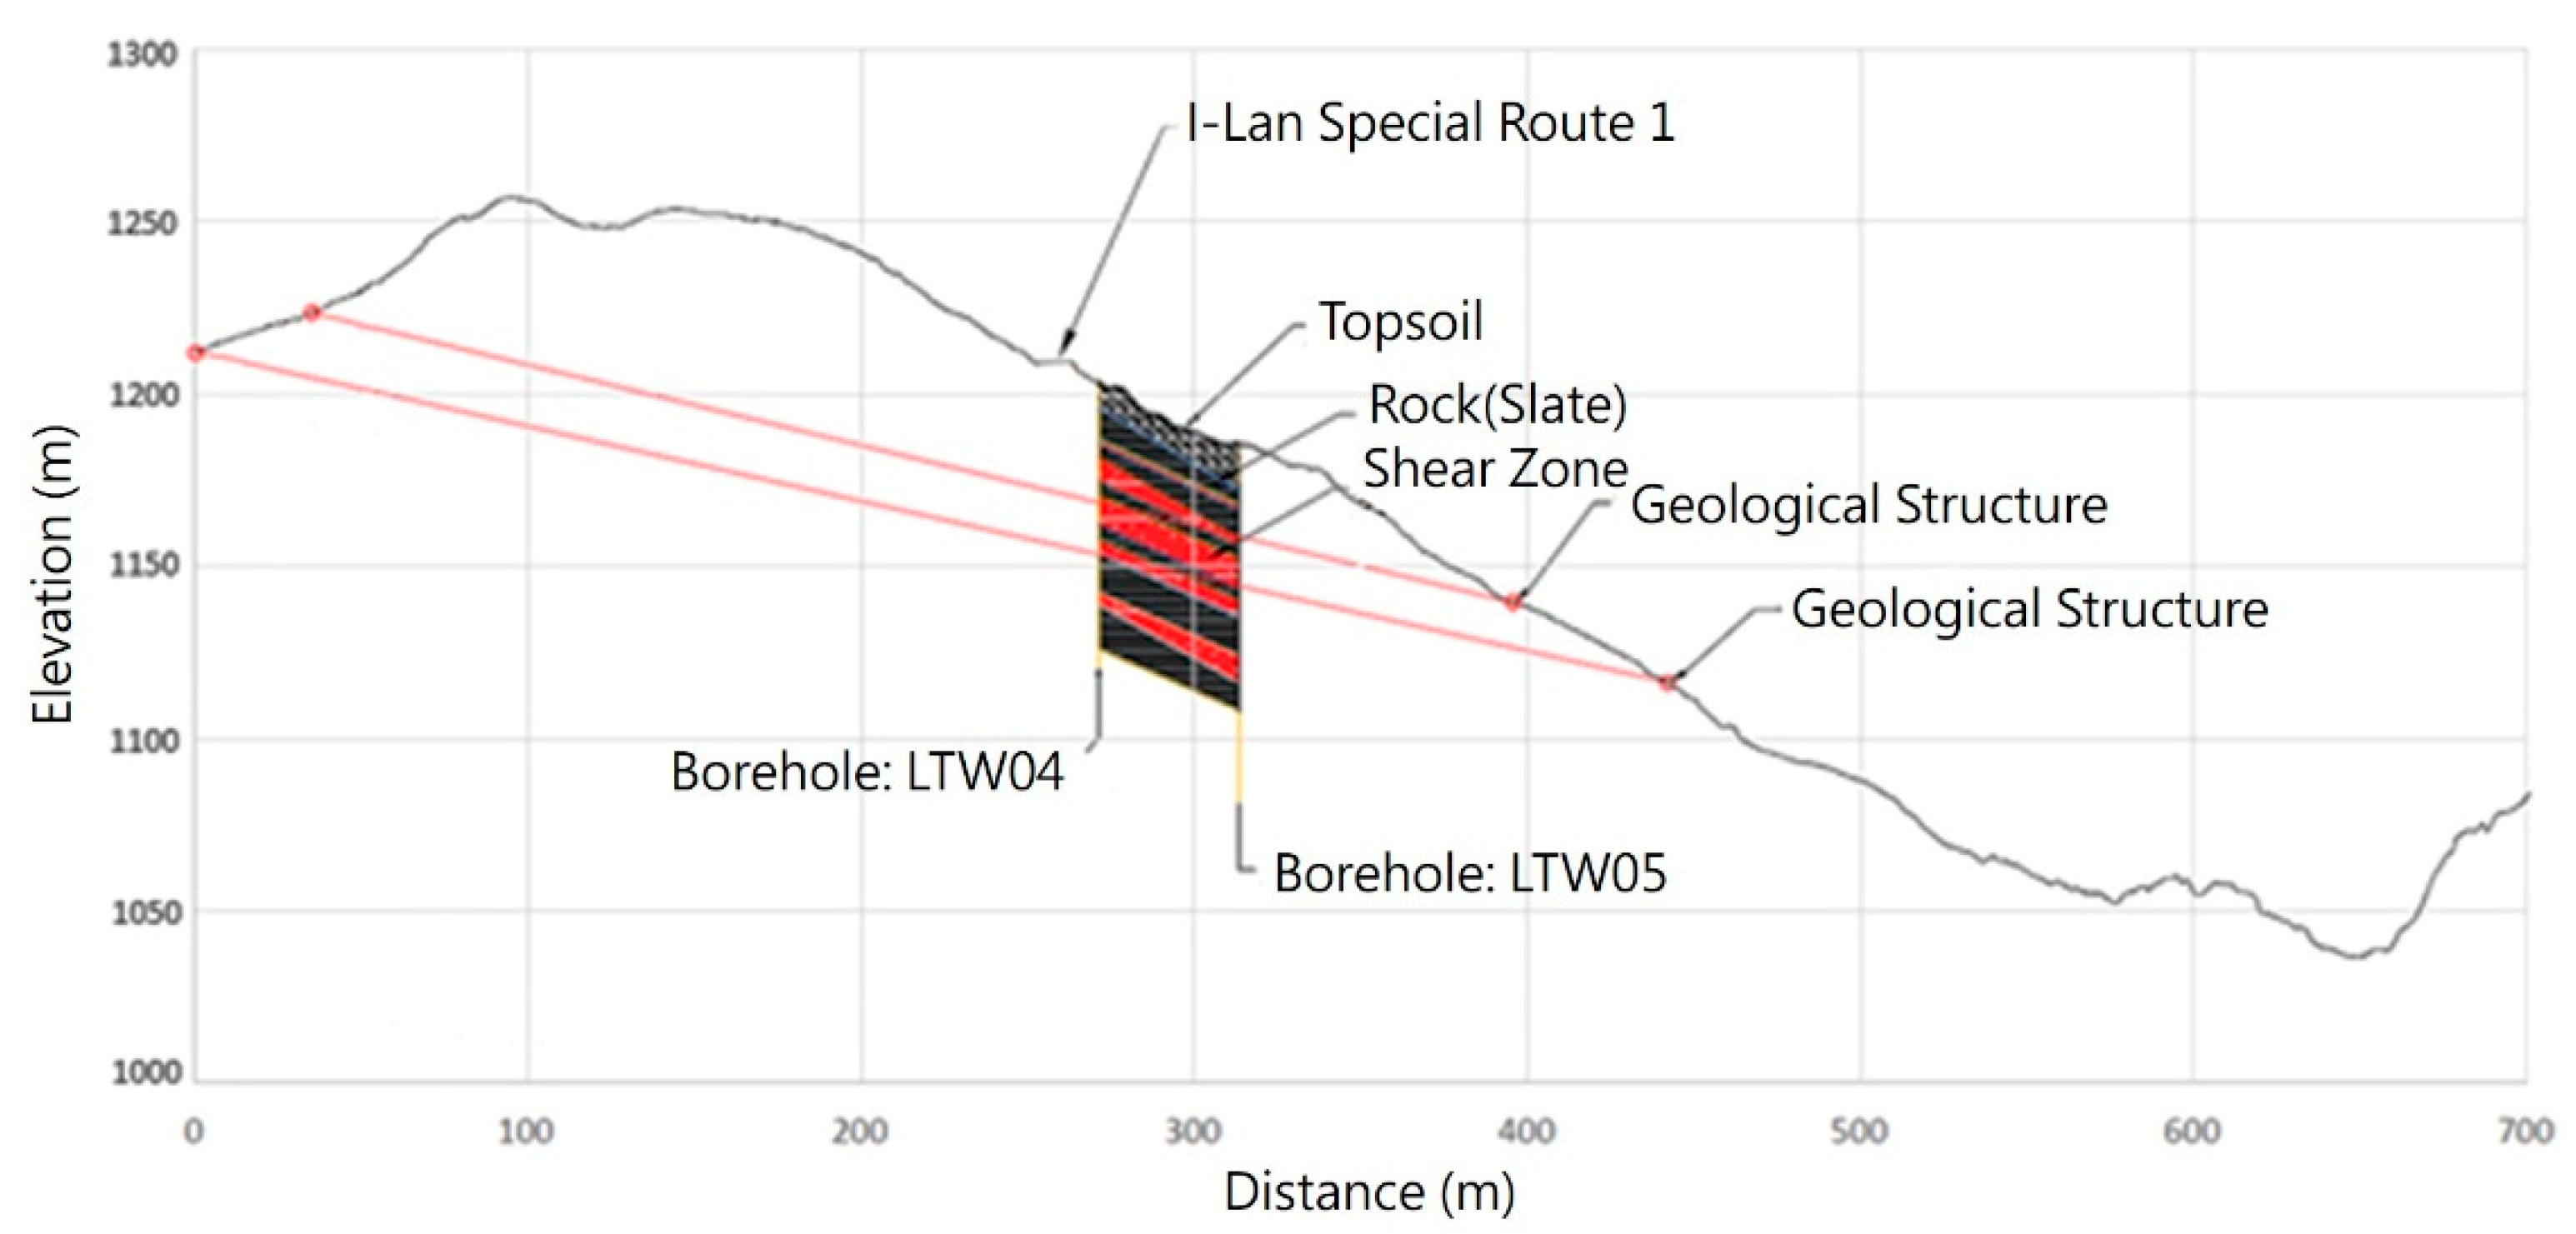
3.2. Identification of the Geological Structures and Field Investigation

Identification of lineaments of geological structure was conducted using shaded relief map derived from DTMH at eight different azimuth angles as shown in Figure 4. The mapped lineaments were summarized and edited to determine the geological structures. The three-dimensional shaded relief map was then derived with the mapped lineaments and viewed from different angles to identify the topographic subsidence and validation of the mapped geological structure lineaments. The two mapped lineaments on the main slope face could be clearly identified and validated on three-dimensional shaded relief map when viewing from the east direction toward the west direction as marked by the red lines in Figure 10. The two lineaments were approximately 50 m apart, and intersected with the I-Lan Special Route 1 at about 11.4 km on the north side, and at about 13.9 km on the south side. The shaded relief map of the opposite slope behind the ridge was derived and displayed three-dimensionally with the mapped lineaments on opposite slope in Figure 4. The lineaments of geological structures were identified and validated as shown by the orange lines in Figure 11 viewing from west direction toward the east direction. To investigate the extension and attitude of the geological structures in the slope body, the two sets of lineaments on both sides of the ridge were approximated as straight lines and projected on the two-dimensional slope map in Figure 12. It appeared that the set of geological structure lineaments extended from the slope of the main study area through the slope body till reaching the opposite slope. By connecting the two sets of lineaments mapped on opposite slope surfaces of the ridge, the two geological structure surfaces through the slope body were formed. The statues of the two geological structure surfaces were measured taking the shortest distance between the corresponding lineaments on opposite slope surfaces, and the statue of the upper surface was N13 °E dipping 23 °E, while the statue of the lower surface was N20 °E dipping 20 °E, respectively. There was likely a shear zone bounded by the two geological structure surfaces. Such identification would not be possible without DTMH which provided detailed topographic variations.
Field investigations were conducted where the mapped geological structures appeared to intersect with the I-Lan Special Route 1 for further validation. Three out-crops were located in the field, with out-crops A and B located near the south intersection of lineaments and road close to the landslide slope, and out-crop C located near the north intersection of lineaments and road. The out-crops A and B were found near 13.9 km of the road as shown in Figure 10 and Figure 12. The out-crop A was found to be a fractured dark gray rock with well-developed discontinuities with a spacing of about 25 cm and inner width of 1 mm as shown in Figure 13a.
The clayey material was moist and in black color, and displayed the characteristics of a fault gouge material as shown in Figure 13b. Similar black dense clayey material was also found at out-crop C at 11.4 km of the I-Lan Special Route 1 in Figure 13c. Locations of the investigated out-crops were positioned using the GNSS system. The locations of out-crops A and B were about at the intersection of the lower geological structure lineament and road, and the location of out-crop C was at near the intersection of the upper geological structure lineament and road as shown in Figure 10 and Figure 12. Further review of previous field investigation record conducted by the authors, the field data revealed that the similar fault gouge material was exposed on the slope surface due to the erosion caused by the heavy rainfall of Typhoon Soudelor in 2015 in Figure 13d [15]. Locations of the exposed black clayey material were marked as out-crop D, and situated near the intersection of the upper geological structure lineament and landslide scar shown in Figure 10 and Figure 12. Thus, the mapped geological structures and their locations were validated by the field data, and it was postulated that the two geological structure surfaces formed a shear zone that extended from the slope surface of the study area to the opposite slope behind the ridge and could have affected the failure mechanism of the deep-seated landslide of the study area.

3.3. Construction of Numerical Model for Stability Analysis

The DTM5 derived in 2003 before the 2005 event was used for construction of the model slope. The slope profile for stability analysis was vital for yielding proper results and was often taken as along the main sliding direction of the landslide. From the previous research of the Lantai deep-seated landslide, the main sliding direction was estimated as along the profile line X-X’ shown in Figure 12 [31]. Distribution of the ground layers at the site were determined referring to the borehole data of previous research [15,16,17,18]. Four boreholes were drilled from 2015~2017 by Lin et al. [15,16,17], and the borehole LTW04 located close to the profile X-X’ was used. The borehole LTW05 located approximately along the profile X-X’ was also used, which was drilled by Wang et al. in 2018 [18]. Locations of both boreholes LTW04 and LTW05 were shown in Figure 12. Tseng inspected the borehole loggings and cores, and classified the ground layer distribution into three types of layer, i.e., the top soil, the shear zone, and slate [32]. By taking the profile along line X-X’, the slope profile was constructed based on DTM5 as shown in Figure 14. Ground layer distribution of the two borehole loggings were presented in Figure 14, and the shear zone bounded by the geological structure surfaces was projected on the profile. It was found that location of the projected shear zone matched the distribution of shear zone material identified in the borehole loggings marked as red blocks in Figure 14. Samples of the shear zone material were taken and tested in the laboratory for the material property parameters by Tseng and Hsia [32,33]. The material property parameters of the Lushan slate were obtained from previous research experiences and literatures [34,35,36]. The thickness of the top soil was small and had little effects on the failure mechanism of the deep-seated landslide compared to the main slope body, and thus was neglected in the numerical model analysis. Parameters of the material property used in the numerical model analysis are listed in Table 1. The Lantai landslide events were usually caused by heavy rainfall induced by typhoons, thus the ground water condition would play an important role for stability analysis. Due to lacking ground water monitoring data in field, location of the ground water table was assumed to follow the steady-state seepage when subjected to long-term precipitation, and was adjusted to consist with the water table record of the borehole LTW4. This ground water table is considered as reasonable but lower than the potential water table caused by the heavy rainfall event. The resulting numerical slope model with the ground layers and water table is as shown in Figure 15.

3.4. Results of Numerical Analysis

Results of the numerical analysis of the model slope shown in Figure 15 are plotted as distribution of the maximum shear strain increment in the slope body in Figure 16. In Figure 16 it was found that the main potential sliding surface formed in the slope body indicated by the maximum shear strain increment developed from the toe of the slope, and extended toward up-slope direction till reaching the area near the road. The location of the sliding surface intersected with the shear zone bounded by the mapped geological structures, and the crest of the sliding surface was close to the shear zone. The location of the sliding surface appeared to be reasonable as the crest located at the location where significant topographic variation of subsidence occurred close to the road, and the toe exited near the river valley and toe of the slope where ground bulge occurred. Another sliding surface developed with crest located up slope of the crest of the main sliding surface can be observed in Figure 16. This higher position potential sliding surface could indicate a local failure, or it could overlap with the main sliding surface to form a large sliding surface. Location of this second sliding surface also conformed well with the topographic variation of the upper slope as the crest located at subsidence area. Some bulging was found near the toe of this local sliding surface.
Location of the potential sliding surface was compared to the borehole logging and shear zone profile as shown in Figure 17 by plotting the distribution of the maximum shear strain increment as contours. The depth of the shear surface was at about 57 m, and location of the potential sliding surface appeared to consist well with depth of the identified shear zone materials in the borehole loggings and shear zone bounded by the geological structures. In addition, the lower part of the shear zone passed through the upper portion of the shear zone material in borehole LTW05 above the sliding surface, which explained the wide range distribution of the shear zone material in the logging. The crest and toe points of the potential sliding surface were mapped and compared to the mapped landslide scarps from SPOT5 image as shown in Figure 18. The crest points consisted well with the mapped landslide scarps of SPOT5 image with the crest point of main sliding surface located just near the road. This result consisted well with the finding in field investigation, and suggested a possible damage of the road as often being reported by the authority.

4. Discussion

The high-resolution DTMH derived from LiDAR point cloud data provided detailed topographic information, which enabled identification of the geological structure lineaments in this study. Such geological structure lineaments were further validated through field investigation of the out-crops. Mapping and identification of the geological structures would not have been possible without the high-resolution terrain information. The DTMs used in the previous research have resolutions of 5 m and 1 m [31,32,33], respectively, and no clear evidence of geological structures was found. The accuracy of the terrain model was limited especially in the vertical direction in the mountainous and steep ground areas. The vertical accuracy of 1~2 m or higher in the mountain area for DTM5 was reported. The identification of the geological structures relies on detailed information of the topographic variations, typically ground subsidence in the vertical direction, which might have been lost due to the accuracy limitation of DTM.
A shear zone bounded by the identified geological structure surfaces was postulated in this study which appeared to be reasonable and was validated by comparing the projected shear zone to the borehole logging data of LTW04 and LTW05 in Figure 14. The logging data displayed the distribution of shear zone materials found in the cores, and the distribution was consistent with the projected shear zone bounded by the geological structures. Furthermore, the identified geological structures and shear zone provided supporting data for interpretation of the drill cores and field data, which provided information on distribution of the ground layers at the site.
In order to understand whether the existence of the geological structures and shear zone would have affected the failure mechanism of the deep-seated landslide, a separate numerical model analysis was conducted. A slope model similar to the slope model in Figure 15 with the same ground layer, water table, and same material properties but without the shear zone was constructed for the numerical analysis. Figure 19 shows the resulting distribution of the maximum shear strain increment in the slope body. The potential sliding surface indicated by the maximum shear strain increment appeared to develop to a greater depth and formed a larger potential sliding surface. The resulting crest and toe points were also plotted in Figure 18 and marked as state 1. Comparing the sliding surface in Figure 19 to that of the model with the shear zone in Figure 16, it was found that the sliding surface of the model without the shear zone extended to a greater depth and up the slope reaching behind the ridge. The extent of the sliding depth was deeper than distribution of shear zone material in boreholes LTW04 and LTW05 and could not be verified by the borehole data. The crest point of the no shear zone model plotted in Figure 18 located at much further up slope just beyond the ridge, and was beyond the mapped scarp. In addition, no evidence in field and historical records were found to support subsidence at the crest area and related displacements caused by this potential sliding surface. Thus, the proposed slope model with the identified geological structures and shear zone appeared to be a more reasonable model, and provide satisfactory results supported by field evidence, historical records, and borehole data. The failure mechanism of the deep-seated landslide appeared to be significantly affected by the existence of geological structures and shear zone, which were unable to be located without the high-resolution LiDAR derived DTM in the previous study [15,16,17]. The significant differences in the locations of potential sliding surface would affect location and depth of the mitigation facilities severely. Thus, the resulting failure mechanism and location of sliding surface along with the landslide behavior of this study provided vital data for drafting mitigation strategy and design of mitigation facilities.

5. Conclusions

The deep-seated landslide in the Lantai area, Taiwan, has a long history of landslide activity and damages the sole access road to the Tai-Ping Mountain National Forest Recreation Area from time to time. The high-resolution digital terrain model (DTMH) derived from UAV mounted LiDAR data were adopted for mapping the lineaments of the geological structures. Field investigation verified the locations of the geological structures, and fault gouge material was found. Comparing the location of geological structures to the borehole data, it was postulated that a shear zone was bounded by the geological structure surfaces and extended through the slope body. A slope model was constructed with the proposed shear zone in the slope body, and the numerical analysis was conducted using the finite difference analysis. The failure mechanism was found to be quite different for the slope model with the proposed shear zone and geological structures compared to the slope model without the shear zone. It appeared that the shear zone bounded by geological structures affected the landslide behavior significantly. In addition, the proposed slope model resulted in landslide behavior that consisted well with mapped scarps, borehole data, and conformed with the event records. The identification of the geological structure lineaments would not have been possible without the high-resolution DTMH. The results of this study appeared to interpret the field data and evaluate the failure mechanism of the Lantai deep-seated landslide properly. These results could provide vital information supporting hazard mitigation strategy.

Author Contributions

Conceptualization, M.-L.L.; methodology, M.-L.L.; validation, M.-L.L. and Y.-C.C.; formal analysis, Y.-C.C. and Y.-H.T.; investigation, Y.-H.T. and K.-L.W.; data curation, Y.-C.C., Y.-H.T. and K.-J.C.; writing—original draft preparation, M.-L.L.; visualization, Y.-C.C. and Y.-H.T.; supervision, M.-L.L. All authors have read and agreed to the published version of the manuscript.

Funding

This research was partly supported by the Ministry of Science and Technology, Taiwan (project number: MOST106-2119-M-006-009). The high-resolution LiDAR and borehole LTW05 data were provided by the Soil and Water Conservation Bureau (project number: SWCB-107-207), Council of Agriculture, Taiwan.

Data Availability Statement

The authors do not have the authority to distribute the remote sensing data, images, and geological map.

Conflicts of Interest

The authors declare no conflict of interest.

References

  1. Chigira, M. The Potential Area of Large-Scale Landslides; Scientific & Technical Publishing Co., Ltd.: Taipei, Taiwan, 2011. (In Chinese) [Google Scholar]
  2. Lin, M.L.; Wang, K.L.; Chen, S.C.; Feng, Z.Y.; Chang, K.T. Typhoon Morakot Major Hazard Investigation Project: Sub-Project (2), Major Landslide Hazard Investigation (Choshui River and Chishan River Basins); Report; National Science and Technology Center for Disaster Reduction: Taipei, Taiwan, 2009. (In Chinese)
  3. Iverson, R.M.; George, D.L.; Allstadt, K.; Reid, M.E.; Collins, B.D.; Vallance, J.W.; Schilling, S.P.; Godt, J.W.; Cannon, C.M.; Magirl, C.S.; et al. Landslide mobility and hazards: Implications of the 2014 Oso disaster. Earth Planet. Sci. Lett. 2015, 412, 197–208. [Google Scholar] [CrossRef] [Green Version]
  4. Jibson, R.W. Landslide Hazards at La Conchita, California Report 2005-1067; US Geological Survey: VA, USA, 2005.
  5. Miller, L.R.; Miller, D.J. Hazel/Gold Basin Landslides: Geomorphic Review Draft Report; M2 Environmental Services: Seattle, WA, USA, 1999. [Google Scholar]
  6. Agliardi, F.; Crosta, G.; Zanchi, A. Structural constraints on deep-seated slope deformation kinematics. Eng. Geol. 2001, 59, 83–102. [Google Scholar] [CrossRef]
  7. Chigira, M.; Tsou, C.Y.; Matsushi, Y.; Hiraishi, N.; Matsuzawa, M. Topographic precursors and geological structures of deep-seated catastrophic landslides caused by Typhoon Talas. Geomorphology 2013, 201, 479–493. [Google Scholar] [CrossRef]
  8. Roering, J.J.; Kirchner, J.W.; Dietrich, W.E. Characterizing structural and lithologic controls on deep-seated landsliding: Implications for topographic relief and landscape evolution in the Oregon Coast Range, USA. GSA Bull. 2005, 117, 654–668. [Google Scholar] [CrossRef] [Green Version]
  9. Bruckl, E.; Brunner, F.K.; Kraus, K. Kinematics of a deep-seated landslide derived from photogrammetric, GPS, and geophysical data. Eng. Geol. 2006, 88, 140–159. [Google Scholar] [CrossRef]
  10. Guzzetti, F.; Mondini, A.C.; Cardinali, M.; Fiorucci, F.; Santangelo, M.; Chang, K.-T. Landslide Inventory Maps: New tools for an Old Problem. Earth-Sci. Rev. 2012, 112, 42–66. [Google Scholar] [CrossRef] [Green Version]
  11. Miner, A.S.; Flentje, P.; Mazengarb, C.; Windle, D.J. Landslide Recognition Using LiDAR Derived Digital Elevation Models-Lessons Learnt from Selected Australian Example. In Proceedings of the 11th IAEG Congress of the International Association of Engineering Geology and the Environment, Auckland, New Zealand, 5–10 September 2010. [Google Scholar]
  12. Schulz, W.H. Landslide Susceptibility Revealed by LIDAR Imagery and Historical Records, Seattle, Washington. Eng. Geol. 2007, 89, 67–87. [Google Scholar] [CrossRef]
  13. Lin, C.W.; Tseng, C.M.; Tseng, Y.H.; Fei, L.Y.; Hsieh, Y.C.; Tarolli, P. Recognition of large scale deep-seated landslides in forest areas of Taiwan using high resolution topography. J. Asian Earth Sci. 2013, 62, 389–400. [Google Scholar] [CrossRef]
  14. Dewitte, O.; Jasselette, J.C.; Cornet, Y.; Van Den Eeckhaut, M.; Collignon, A.; Poesen, J.; Demoulin, A. Tracking landslide displacements by multi-temporal DTMs: A combined aerial stereophotogrammetric and LIDAR approach in western Belgium. Eng. Geol. 2008, 99, 11–22. [Google Scholar] [CrossRef]
  15. Lin, C.W.; Chen, R.F.; Chen, H.J.; Hsu, Y.R.; Huang, A.B.; Chen, J.J.; Lin, M.L.; Wang, K.L. Establishment of a Comprehensive Monitoring System and Study of Monitoring Data and Sliding Mechanisms: An Example of Tai-Ping Shan LanTai Area (I); Report; Ministry of Science and Technology: Taipei, Taiwan, 2015.
  16. Lin, C.W.; Chen, R.F.; Chen, H.J.; Hsu, Y.R.; Huang, A.B.; Chen, J.J.; Lin, M.L.; Wang, K.L. Establishment of a Comprehensive Monitoring System and Study of Monitoring Data and Sliding Mechanisms: An Example of Tai-Ping Shan LanTai Area (II); Report; Ministry of Science and Technology: Taipei, Taiwan, 2016.
  17. Lin, C.W.; Chen, R.F.; Chen, H.J.; Hsu, Y.R.; Huang, A.B.; Chen, J.J.; Lin, M.L.; Wang, K.L. Establishment of a Comprehensive Monitoring System and Study of Monitoring Data and Sliding Mechanisms: An Example of Tai-Ping Shan LanTai Area (III); Report; Ministry of Science and Technology: Taipei, Taiwan, 2017.
  18. Wang, K.L.; Lin, M.L.; Ni, T.F.; Chen, J.J.; Chen, R.F.; Chen, H.J.; Chen, J.W.; Kuo, J.Y.; Chang, K.J.; Hsu, Y.R.; et al. The Construction Supervision Service of Landslides and Anchor on Yijhuan Route 1 and Cueifong Scenic Road; Report; Soil and Water Conservation Bureau: Nantou, Taiwan, 2018.
  19. 1/50000 Geological Map, No.15 Sanshin Plate, Geological Investigation and Database for Upstream Watershed of Flood-Prone Area, Central Geological Survey; MOEA: Taipei, Taiwan, 1995.
  20. National Land Surveying and Mapping Center; Ministry of the Interior. Results of Digital Elevation Model Offer; National Land Surveying and Mapping Center: Taipei, Taiwan, 2005.
  21. Varnes, D.J. Slope Movement Types and Processes. In Special Report 176: Landslides: Analysis and Control; Trans. Research Board: Washington, DC, USA, 1978. [Google Scholar]
  22. Cruden, D.M.; Varnes, D.J. Landslide Types and Processes. In Landslides: Investigation and Mitigation; Turner, A.K., Schuster, R.L., Eds.; Special Report 247; National Research Council, National Academy of Science: Washington, DC, USA, 1996; pp. 36–75. [Google Scholar]
  23. Van Den Eeckhaut, M.; Kerle, N.; Poesen, J.; Hervás, J. Object-oriented identification of forested landslides with derivatives of single pulse LiDAR data. Geomorphology 2012, 173–174, 30–42. [Google Scholar] [CrossRef]
  24. Van Den Eeckhaut, M.; Poesen, J.; Verstraeten, G.; Vanacker, V.; Moeyersons, J.; Nyssen, J.; van Beek, L.P.H. The effectiveness of hillshade maps and expert knowledge in mapping old deep-seated landslides. Geomorphology 2005, 67, 351–363. [Google Scholar] [CrossRef]
  25. Van Den Eeckhaut, M.; Poesen, J.; Verstraeten, G.; Vanacker, V.; Nyssen, J.; Moeyersons, J.; Beek, L.P.H.V.; Vandekerckhove, L. Use of LIDAR-derived images for mapping old landslides under forest. Earth Surf. Process. Landf. 2007, 32, 754–769. [Google Scholar] [CrossRef]
  26. Lin, M.L.; Chen, T.W.; Lin, C.W.; Ho, D.J.; Cheng, K.P.; Yin, H.Y.; Chen, M.C. Detecting large-scale landslides using Lidar data and aerial photos in the Namasha-Liuoguey Area, Taiwan. Remote Sens. 2014, 6, 42–63. [Google Scholar] [CrossRef] [Green Version]
  27. O’Leary, D.W.; Friedman, J.D.; Pohn, H.A. Lineament, linear, lineation: Some proposed new standards for old terms. Geol. Soc. Am. Bull. 1976, 87, 1463–1469. [Google Scholar] [CrossRef]
  28. Ramli, M.F.; Yusof, N.; Yusoff, M.K.; Juahir, H.; Shafri, H.Z.M. Lineament mapping and its application in landslide hazard assessment: A review. Bull. Eng. Geol. Environ. 2010, 69, 215–233. [Google Scholar] [CrossRef]
  29. Lin, M.L.; Chen, T.W. Estimating volume of deep-seated landslides and mass transport in Basihlan River Basin, Taiwan. Eng. Geol. 2020, 278, 105825. [Google Scholar] [CrossRef]
  30. FLAC V.7 Manual; ITASCA Consulting Group, Inc.: Minneapolis, MN, USA, 2011.
  31. Lin, M.L.; Tseng, Y.H. Failure mechanism and evolution of deep-seated landslide in Lantai area. In Proceedings of the 18th Conference on Current Researches in Geotechnical Engineering in Taiwan, Pingtung, Taiwan, 1–3 September 2020. [Google Scholar]
  32. Tseng, Y.H. Landslide Evolution and Analysis of Failure Mechanism in Lantai Area. Master’s Thesis, National Taiwan University, Taipei, Taiwan, 2019. [Google Scholar]
  33. Hsia, K.C. Evolution and Failure Mechanism of the Deep-Seated Landslide in Lantai Area. Master’s Thesis, National Taiwan University, Taipei, Taiwan, 2016. [Google Scholar]
  34. Lin, M.L.; Wang, K.L.; Liao, J.T.; Lo, W.; Wang, T.T. Simulation and Monitoring in Areas Susceptible to Landslide Hazard (1/4); Report; Central Geological Survey, Ministry of Economics: Taipei, Taiwan, 2007.
  35. Lee, S.C. Simulation of Landslide Run-Out Distance Using Plastic Model. Master’s Thesis, National Taiwan University, Taipei, Taiwan, 2008. [Google Scholar]
  36. Chang, K.T.; Huang, S.C.; Lin, M.L.; Chang, Y.T. Geological investigations and analyses of a landslide in a slate area-the Lushan Landslide. J. Chin. Soil Water Conserv. 2009, 4, 393–407. [Google Scholar]
Figure 1. Methodology flowchart of this study.
Applsci 11 10052 g001
Figure 2. Aerial photo showing location of the deep-seated landslide in the Lantai study area with landslide scars and ground erosion, and the aerial photo was acquired on 27th September 2017 taken by ADS40 sensor at an elevation of approximately 4086~4091 m above ground level (AGL) (the WGS 84 coordinates were used). The red star marks the location of study area.
Applsci 11 10052 g002
Figure 3. Geological map on the shaded relief of the study area, modified from 1:50,000 Geological Map, Sanshin Plate by Central Geological Survey, 1995 [19]. The Lsc indicates Lushan formation Chingshuihu Member, and the Lsj indicates Lushan Formation Jentse Member (WGS 84 coordinates).
Applsci 11 10052 g003
Figure 4. Illustration of the identified lineaments of geological structure using shaded relief map derived from DTMH at eight different azimuth angles: 0°, 45°, 90°, 135°, 180°, 225°, 270°, and 315°, with a light incidence angle of 45° (WGS 84 coordinates). The yellow dash lines marked the lineaments on the main slope face observed at the azimuth angles of 0°, 90°, 270°, and 315°; and purple dash lines marked the lineaments on opposite slope face observed at the azimuth angles of 0°, 135°, 180°, and 225°.
Applsci 11 10052 g004
Figure 5. Illustration of the model slope constructed using DTM5 before the 2005 event, and no lateral displacement for the lateral boundaries and fixed boundary at base were assigned.
Applsci 11 10052 g005
Figure 6. The first aerial photo image record of the deep-seated landslide of the study area taken on 30 November 1980 (WGS 84 coordinates). The bare ground exposed due to landslide is marked with the red dash line, and some vegetation recover can be observed.
Applsci 11 10052 g006
Figure 7. The SPOT5 images acquired on (a) 16th March 2005 before, and (b) 11 March 2006 after the 2005 Typhoon Haitang event. The orange dash line marked the scars and edges of exposed ground caused by landslide (WGS 84 coordinates). The landslide scar in (b) was enlarged and developed further up slope compared to scar in (a).
Applsci 11 10052 g007
Figure 8. The SPOT5 image after 2005 event was overlaid on DTM5 three-dimensionally, viewing from west direction toward east direction, and lineaments of landslide scarp mapped were shown as the colored dash lines.
Applsci 11 10052 g008
Figure 9. The SPOT5 image after 2005 event was overlaid on three-dimensional slope map of DTM5 viewing from west direction toward east direction, and lineaments of landslide scarp mapped were shown as the colored dash lines.
Applsci 11 10052 g009
Figure 10. The three-dimensional shaded relief map derived from DTMH viewing from east direction toward west direction. Two lineaments were identified and marked by the red lines, the yellow dots marked the out-crop field investigation points A, B, C, and D.
Applsci 11 10052 g010
Figure 11. The three-dimensional shaded relief map derived from DTMH of the opposite slope over the ridge viewing from west direction toward east direction. Two lineaments were identified and marked by the orange lines on the opposite slope. The red lines indicated the lineaments on the main slope surface of the study area.
Applsci 11 10052 g011
Figure 12. The two sets of lineaments on opposite slope surfaces of the ridge were projected on the planar slope map derived from DTMH using approximate straight lines (WGS 84 coordinates). The field investigation points A, B, C, and D are indicated as pink dots, and green triangles indicate locations of boreholes. The X-X’ profile was used for stability analysis.
Applsci 11 10052 g012
Figure 13. Photographs of out-crops in field: (a) out-crop A, (b) out-crop B with the moist black fault gouge material, (c) out-crop C also showing moist black fault gouge material, and (d) photo taken in October, 2015 after Typhoon Soudelor showing out-crop D with moist black material exposed.
Applsci 11 10052 g013
Figure 14. The slope profile along profile X-X’ based on DTM5 before the event, showing the borehole loggings of LTW04 and LTW05, with black color indicating rock material (slate), and the red color indicating shear zone material. A shear zone bounded by the two geological structure surfaces was assumed and projected on the profile by red lines.
Applsci 11 10052 g014
Figure 15. The slope model of profile X-X’, with the ground layers of rock material (slate) and shear zone. Location of the ground water table is also indicated.
Applsci 11 10052 g015
Figure 16. The distribution of the maximum shear strain increment from the numerical model analysis of the proposed slope model with shear zone (state 2). The distribution of the maximum shear strain suggested the location of potential sliding surface, and the location of the shear zone could be observed suggesting larger shear strain developed in the shear zone.
Applsci 11 10052 g016
Figure 17. The distribution of the maximum shear strain increment plotted as contours, and compared to the borehole loggings and shear zone. The potential sliding surface appeared to pass through the shear zone material indicated as black legend for the loggings, and shear zone passed through shear zone material in the upper part of logging.
Applsci 11 10052 g017
Figure 18. The mapped scarps of SPOT5 image and the crest and toe points of the potential sliding surface resulted from numerical analysis of profile X-X’ (WGS 84 coordinates). Points marked as state 2 indicated results of the slope model with shear zone (with geological structures), and points marked as state 1 indicated results of numerical analysis of slope model without geological structures.
Applsci 11 10052 g018
Figure 19. The distribution of the maximum shear strain increment from the numerical analysis of the slope model without geological structure (state 1). The distribution of the maximum shear strain suggested a deeper and larger potential sliding surface.
Applsci 11 10052 g019
Table 1. Parameters of material property of each ground layer used in the numerical analysis.
Ground LayerMass Density (kg/m3)Bulk Modulus (GPa)Shear Modulus (GPa)Cohesion (kPa)Friction Angle (∘)
slate27002.921.3518035
shear zone27001.590.7310025
Publisher’s Note: MDPI stays neutral with regard to jurisdictional claims in published maps and institutional affiliations.

