1. Introduction
The analysis of the time series characteristics of port ship flow sequences and the accurate prediction of port ship flow can provide references for the port layout design and the management of ship navigation. Port congestion has been recognized as a serious problem in all large ports in the world, which has a significant effect on the shipping date, the transportation cost, economic loss of the owner of the goods, and even the development of ports [
1,
2]. Nevertheless, understanding the arrival laws and accurate prediction of the port ship traffic flow are two keys to solve this problem. Therefore, this paper aims to study the arrival laws of ship traffic flow in container ports based on the long-range correlation and multifractality, and then, to provide a reference and theoretical basis for effective modeling and prediction of port ship flows.
There is an abundance of literature on long-range dependence for time series data, such as biomedical data [
3,
4,
5], stock returns [
6,
7,
8], hydrology [
9,
10,
11], and climatology [
12,
13,
14]. However, only a few studies focus on traffic flow sequences [
15,
16] and the research on maritime traffic flow sequences are very limited. This is mainly due to the difficulty in obtaining data on port ship traffic flow in the maritime sector. However, in recent years, there are more and more relevant studies on the application of ship AIS data [
17,
18]. This makes it possible to study the time series of maritime ship flow.
Studies on maritime traffic flow, especially the ship flow sequences in the ports, are very important as they can provide basic decisions for the allocation of port operation infrastructures, rational port planning, and port investment. Furthermore, if the ship flow sequences in ports are long-range dependent and multifractal, then the traditional ships flow prediction models should revalue to incorporate this type of volatility. Unfortunately, there is no universally accepted theory to define the volatility of traffic flow sequence. In order to understand the irregular patterns of ship flow time series, especially for prediction, we need to know whether the maritime traffic flow system follows chaotic, random, or deterministic structural patterns. The complex pattern is the motivation behind the study of maritime ship flow series through the Multifractal Detrended Fluctuation Analysis (MF-DFA).
The contributions of this study are threefold: First, we present a descriptive statistics of the ship traffic flow time series. Second, we analyze the long-range dependence correlation characteristics of the ship traffic flow series using the Hurst exponent. Third, we determine the degree of multifractality of the ship traffic flow of the different ports through the Multifractal Detrended Fluctuation Analysis, and compare them based on the MF-DFA results. Our results suggested that the ship flow sequences at different time scales in the ports of Shanghai, Singapore, and Rotterdam showed different degrees of long-range dependency. Therefore, the ship flow prediction models should incorporate the long-range dependency in forecasting. In addition, the results indicated that the ship flow sequences in container ports are multifractal, where the degree of multifractality is much higher for the port of Singapore compared with Shanghai and Rotterdam.
The rest of the paper is organized as follows:
Section 2 presents a brief review on the literature.
Section 3 introduces the methodology used in this paper.
Section 4 describes the sample data.
Section 5 presents empirical results. Finally,
Section 6 provides concluding observations based on the findings of the study.
2. Literature Review
In the last few decades, researchers discovered more characteristics of volatility in terms of long-range dependence and multifractality of the data in numerous fields including DNA sequences [
3,
4,
19], climatology and hydrological time series [
11,
20,
21], and stocks and other financial market data [
6,
7,
22,
23]. In most of these studies, the complex long-range correlations and multifractality behaviors of the time series were measured by the so called Hurst exponent, which was originally developed in hydrology for the practical matter of determining optimum dam sizing for the Nile river’s volatile rain and drought conditions [
22,
24].
The long-range correlations can be captured using several methods, including Rescaled Range Analysis (R/S) [
22], Detrended Fluctuation Analysis (DFA) [
3], Wavelet analysis [
25], Multifractal Detrended Fluctuation Analysis [
25], and so on. Coronado et al. [
26] compared various methods on Hurst exponent and pointed that DFA is superior to other methods since it is less influenced by the time series finite size than others. As a generalization of DFA, MF-DFA is a popular method for the nonstationary time series, which has been applied with great success in several areas of research. Several literatures have also demonstrated the possibility of detecting the multifractal properties in time series through MF-DFA method [
9,
27].
MF-DFA is a good method to study the characteristics of time series of stock market and complex traffic flow. For example, Mensi et al. [
28] and Ali et al. [
29] stated that MF-DFA is an acceptable choice to study comparative efficiency and the multifractality of stock markets. They found that the Islamic stock markets’ adjustment to speculative activity is, in fact, higher than their conventional counterparts, and all stock market returns exhibited multifractal features. Besides, some scholars used MF-DFA to examine the highway traffic flow time series in Beijing, Shanghai and other places and discovered that the long-range dependence behavior is ubiquitous in time series of road traffic flows. Moreover, the length of the time scale was significantly impacted on the multifractal characteristics of traffic flow sequences [
30,
31,
32].
At present, a broad consensus has emerged that long-range dependence and multifractality are somewhat realistic phenomena in traffic flow series [
15,
33,
34]. However, there is no research on the long-range correlations of the time series of maritime traffic flow. Therefore, motivated by the importance of temporal structure and long-range correlations for modeling and prediction of maritime ship flow series, we investigated the complex temporal structure and long-range correlation behaviors of the ship flow sequences of container ports from the multifractal perspective using the MF-DFA method. Evaluation of such results for container ship flow in different time scales and different container ports will facilitate the production of more insights on evolution dynamics of these ports and global trade.
3. Methodology
We analyzed the ship flow sequences of three representative container ports by the MF-DFA method, which is a generalization of DFA method [
35,
36]. To obtain the generalized Hurst exponent, we followed the five-step procedure introduced by [
9,
36] to measure the multifractality and nonstationary behavior of Brazilian rivers. Rego et al. [
9] pointed out that the periodic components in the sequence should be removed at the first stage before beginning with the general procedure of Kantelhardt et al. [
36].
For a record
, where
N denotes the length of the record, the MF-DFA consists of the following steps [
35,
36]:
Step 1: We first integrate the series and obtain the profile
,
where
is the mean value of the entire series.
Step 2: The integrated series is divided into boxes of equal length s.
Step 3: In each box of length
s, we calculate a polynomial fitting of
, which represents the trend in that box. The shape of the polynomial trend is defined by the order
m. A higher order
m yield a more complex shape of the trend, but might lead to overfitting for a time series within small segment sizes. Therefore, in this study, we choose
m equal to 2 as suggested by Ihlen (2012) [
37]. The
y coordinate of the fit line in each box is denoted by
.
Step 4: The integrated series is detrended by subtracting the local trend in each box of length s.
Step 5: For a given box size,
If the series is long-range and the power-law is correlated for large values of the time scales, the fluctuation functions
can be written as Equation (
3):
where
is the generalized Hurst exponent. The generalized Hurst exponent
can be obtained by observing the slope of the log–log plots of
and scale
s through the method of ordinary least squares (OLS). If
is independent of
q, the time series is monofractal, otherwise, it is multifractal.
Table 1 shows the relationship between the long-range dependence of time series and the generalized Hurst exponent.
The value of the generalized Hurst exponent equal to 0.5 indicates an uncorrelated time series. A generalized Hurst exponent value larger than 0.5 indicates a positive long-range dependence and persistence of the series. In other words, the larger the H value is, the stronger the persistence is. A generalized Hurst exponent value smaller than 0.5 indicates a negative long-range dependence and antipersistence of the series. This means the closer the H value is to 0, the stronger the antipersistence is.
When
q is equal to two,
is identical to the well-known Hurst exponent. Generally, the Hurst exponent is between 0 and 1. However, it is worth noting that the generalized Hurst index obtained by applying the MF-DFA method in this study may be greater than 1 [
36,
38].
The singularity spectrum
is introduced to measure the degree of multifractality of the series and can be obtained through Legendre transform:
Here,
is the singularity strength and used to characterize the singularities of the time series.
indicates the dimension of the subset of sequences that is characterized by
. The strength of multifractality can be estimated by the spans of singularity given by
4. Data
As this research investigates the long-range dependence and multifractality for ship flow sequences in container ports, we extracted required container ship flow data from the Automatic Identification System (AIS) database. The data span is from 1 January 2013 to 31 December 2017 for three representative container ports in the world—that is, Shanghai, Singapore, and Rotterdam.
Figure 1 represents the original data of ship flow at different time scales for these three container ports.
The port of Shanghai is not only the largest container port in China, but also the world’s largest container port. Its shipping routes reach the world’s 12 largest shipping areas, and it has established business contacts with more than 500 ports in nearly 200 countries and regions. As the world’s second largest container port, Singapore is also the largest transit port in the Asia-Pacific region. The Port of Rotterdam is the largest port in Europe, as well as the European Gateway. Therefore, in this study, the ports of Shanghai, Singapore, and Rotterdam were chosen to represent all the ports around the globe.
We analyzed and compared the long-range correlation and multifractality characteristics of the ship flow sequences of both Asian and European ports and the gateway ports and transit ports. In general, the ship flow sequences for the three ports depicted different characteristics at different time scales. Among them, the ship flow series of Shanghai and Rotterdam with daily and weekly time scales showed a more significant upward trend than the ship flow series of Singapore port. Ship flow sequences of the three ports with monthly scale fluctuated up and down along the time line, indicating a nonlinear and nonstationary feature. Generally, these fluctuations are not random, but relate to the seasonal and monthly cycles.
5. Empirical Results
5.1. Descriptive Statistics
It is a well-known fact that the statistical properties of time series vary with time and depend on time windows.
Table 2 presents the descriptive statistics for the original ship flow series at different time scales.
According to
Table 2, the average number of ships arriving in the port of Singapore is greater than that of the Shanghai port at any time scale. Therefore, although Shanghai’s container port ranks first in the world list, the port of Singapore is still the busiest container port in the world. This is mainly due to its unique geographical location and its role as the largest transit port in the Asia-Pacific region.
Besides, the standard deviation of ship flow sequences in port of Shanghai is larger than that of Singapore and Rotterdam ports, regardless of the time scale. This shows that the numbers of arriving ships in the ports of Rotterdam and Singapore are relatively stable compared to Shanghai.
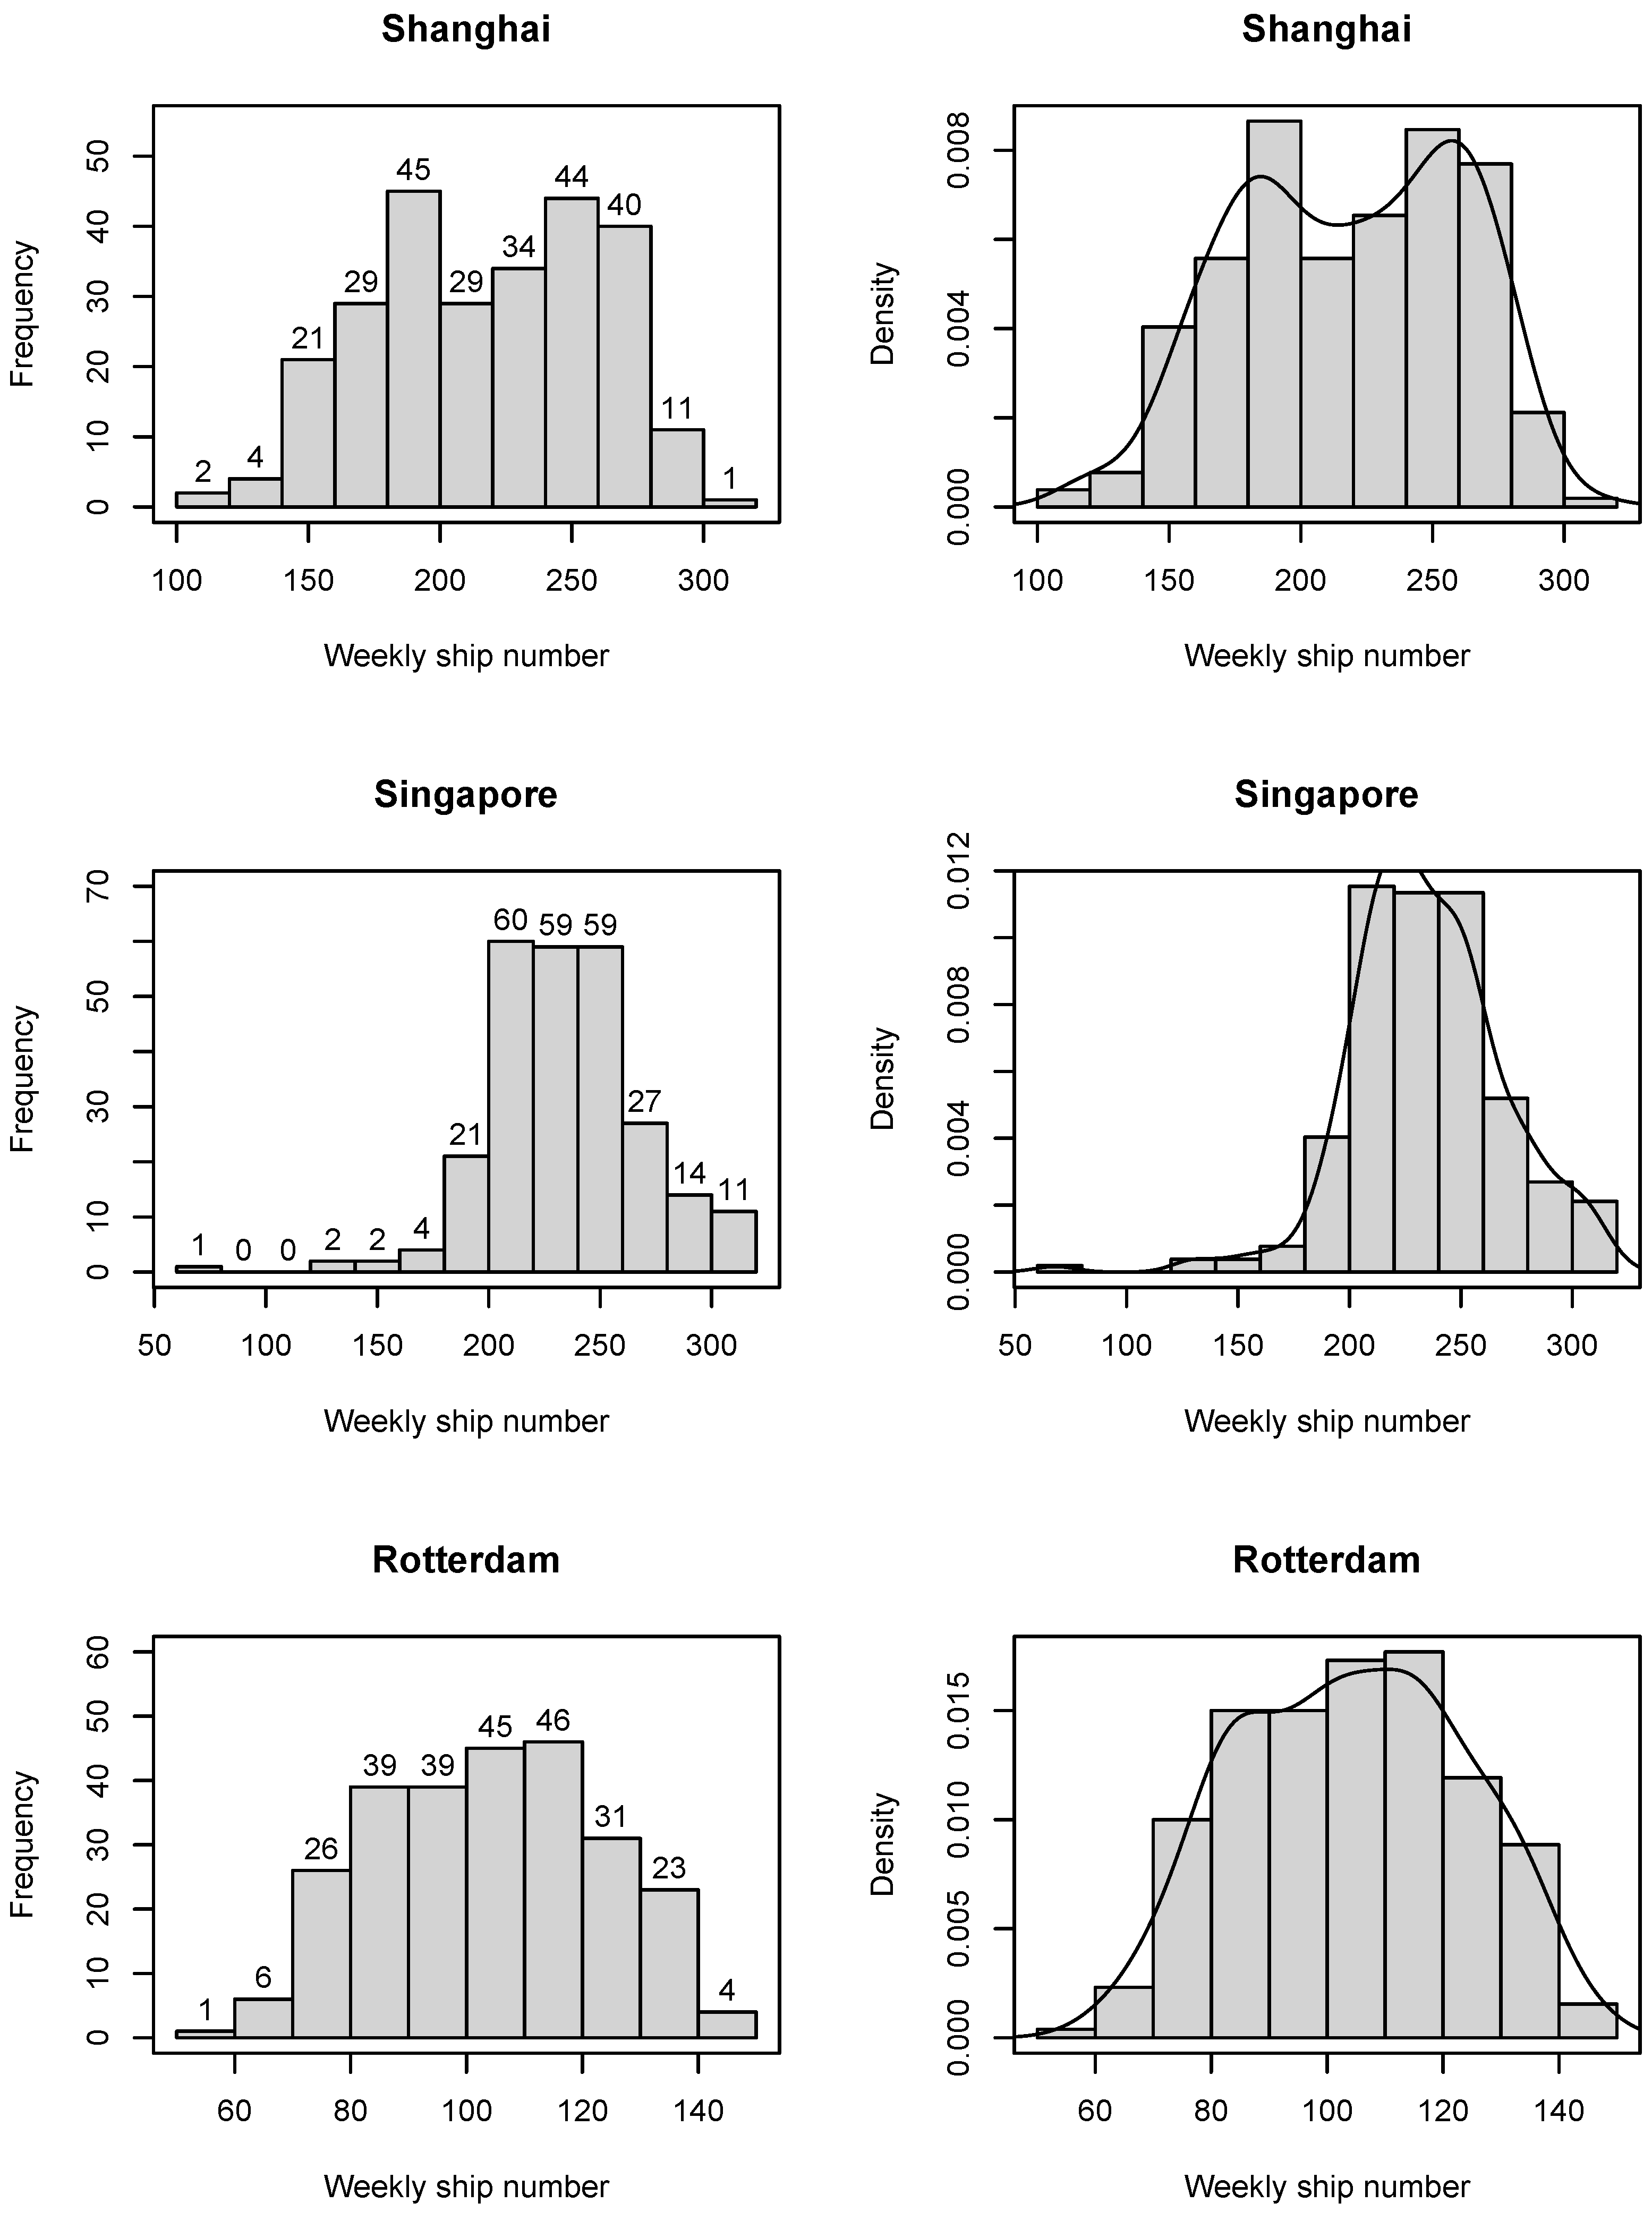
The results from skewness and kurtosis analysis demonstrated that the different time scales significantly affect the temporal structure of the ship flow sequence. Indeed, skewness reflects the degree of symmetry in the distribution.
Table 2 shows that the skewness in almost all the ship flow sequences are negative, except for the daily ship flow sequence of Rotterdam (0.263) and monthly ship flow sequence of Singapore (0.164). This indicates that all of the ship flow sequences are leftward distributions, except for the daily ship flow sequence of Rotterdam and monthly ship flow sequence of Singapore.
On the other hand, the kurtosis reflects the sharpness of the image. The higher the kurtosis, the sharper the center point on the image; in this sense, the kurtosis measures the degree of data aggregation in the center. In this study, the traditional kurtosis is replaced by the “super kurtosis” calculation method, which is to subtract the kurtosis 3 of the normal distribution from the original kurtosis so that the comparison benchmark is zero.
Table 2 shows that the super kurtosis values of daily ship flow sequences are greater than 0, indicating that the daily ship flow sequence distributions are more concentrated and have a longer tail than the normal distribution. In the weekly ship flow sequences, only the super kurtosis of Singapore is greater than 0. The super kurtosis of all the monthly ship flow sequences are less than 0, indicating that these sequences are scattered and have a shorter tail than the normal distribution. Therefore, only the daily ship flow sequence of three ports and the weekly ship flow sequence of Singapore exhibited the characteristic of “sharp peak or fat tail”. Further, the ship flow sequences of three ports with different time scales deviated from the normal distribution. The results are further validated by the frequency and probability density distribution of ship flow at the port in
Figure 2,
Figure 3 and
Figure 4.
In addition, we investigated the stationarity of the above ship flow series with different time scales. In general, the ADF and KPSS tests are complementarily used to evaluate the stationarity in time series models. Therefore, both methods were used in this study to test the stationarity of the ship flow time series with the intention of obtaining more precise results. The null hypothesis of the ADF test was the presence of a unit root, indicating the nonstationarity; the null hypothesis of the KPSS test was the absence of unit root, indicating stability.
Table 1 showed that the
p values of the ADF test of all the ship flow sequences were greater than 0.05; so, the null hypothesis is accepted—that is, the sequences are nonstationary time series. Similarly, the KPSS test results indicated a
p value less than 0.05, rejecting the null hypothesis. Therefore, all the ship flow sequences of three ports are nonstationary time series.
5.2. Long-Range Dependence and Multifractality
Figure 5 depicts the fluctuation function
F versus scale for the ship flow sequences of three ports with different time scales in log-coordinates and the OLS linear regression for these curves when
q is equal to two. We calculated the generalized Hurst exponents from the slopes of these straight lines. The Hurst exponent of all the ship flow sequences was greater than 0.5, which indicated a positive long-range dependence and persistence in these ship flow sequences.
Table 3 presents the results for long-range dependence in ship flow sequences of three ports when
q is equal to two. Empirical results suggested high Hurst exponents for ship flow sequences. An important feature of these results implied that, in general, Hurst exponents becomes larger as the time scale increases. The port of Singapore has the highest Hurst exponent in weekly ship flow sequence, which is close to 1. However, in the monthly ship flow sequences, Singapore obtains the lowest Hurst exponent, which is just 0.751. Therefore, ship flow sequences in the port of Singapore have a higher Hurst exponent when the time scale is small. On the contrary, the ship flow sequences in the ports of Shanghai and Rotterdam have a higher Hurst exponent when the time scale is larger. Moreover, the differences in Hurst exponents under different time scales seem to be higher for the port of Singapore.
Figure 6 presents the results for the MF-DFA methodology for
. Qualitative results showed that the generalized Hurst exponent for all ship flow sequences decreased with the increase in
q; the generalized Hurst exponent of these ship flow sequences is dependent on the selection of
q. However, for the monthly ship flow sequence in the ports of Shanghai and Rotterdam, this dependence on
q was not significant. The differences in generalized Hurst exponents of daily and weekly series for three ports seem to be smaller as
q increases. The generalized Hurst exponents for port of Singapore decreased faster than those for Shanghai and Rotterdam with the increase in
q in all time scales. In particular, there was no substantial change in generalized Hurst exponent of the monthly ship flow series for Shanghai and Rotterdam;
remained between 0.8 and 1.2 with the increase in
q. For the monthly sequence, when
q is less than zero, the generalized Hurst exponents of Singapore and Rotterdam are larger than that of Shanghai; meanwhile, when
q is larger than zero, the situation may change to the opposite, and the generalized Hurst exponent of ship flow for Shanghai becomes the largest. These results suggest that these differences are not spurious or due to error measures. An important additional comment is that the degrees of multifractality of ship flow sequences in Shanghai and Singapore container ports are much higher than the ones found for ship flow in Rotterdam port.
The leveling of
q-order Hurst exponent reflects that the
q-order root-mean-square (RMS) is insensitive to the magnitude of local fluctuations. The multifractal spectrum will have a long left tail when the time series have a multifractal structure that is insensitive to the local fluctuations with small magnitudes. In contrary, the multifractal spectrum will have a long right tail when the time series have a multifractal structure that is insensitive to the local fluctuations with small magnitudes [
37].
Figure 7 depicts the multifractal spectrum for ship flow sequences of three ports with different time scales. According to
Figure 7, the multifractal spectrum of ship flow sequences for all ports can be divided into two sections. However, the spans of the multifractal singularity are different, implying that they have different multifractality strengths. For the daily ship flow sequences, the port of Rotterdam has the lowest multifractal strength, while the port of Singapore has the highest multifractal strength. Furthermore, the shape of multifractal spectrum of daily ship flow for Singapore shifts to the right and the spectrum is slightly right-skewed, indicating that the scaling behavior of small fluctuations dominates the fluctuation of the daily ship flow for Singapore port.
Compared with the daily ship flow time series, the multifractal spectra of Shanghai and Rotterdam obtained from weekly ship flow sequences shifted to the left and the spectrum is slightly left-skewed. This indicates that the scaling behavior of large fluctuations dominates the fluctuation of the weekly ship flow for Shanghai and Rotterdam port.
According to the multifractal theory, the strength of multifractality can be characterized by the span of the multifractal singularity strength function in Equation (
6). The bigger the
is, the stronger the degree of multifractality becomes.
Table 4 presents the quantitative strength of multifractality of all the ship flow sequences of the three ports. It can be seen that the degree of multifractality of weekly series is the strongest for all three ports, followed by the monthly time series, and the daily time series has the weakest multifractality. The monthly ship flow sequence of Singapore port has the highest degree of multifractality. An interpretation for this result is that the weekly ship flow sequence of Singapore is very sensitive to the changes of various influencing factors, and it is very hard to predict. Therefore, compared with the forecast of the ship traffic flows of days and months, the weekly forecast is the most difficult for the ship flow at the container port. This shows that the multifractal method is essential for the analysis of ship flow sequences.
5.3. Type of Multifractality
Another contribution of this study is to identify the type of multifractality presented in the ship traffic flow data. We performed the same analysis on the randomly shuffled series of the original ship traffic flow sequences. The randomly shuffled sequences were obtained by shuffling the original ship flow sequences. The shuffled sequences remained with the same fluctuation distributions, though it destroyed any temporal correlations in the original data.
The process of shuffling can be depicted as the three steps presented by [
39]. Firstly,
pairs are generated from random integer numbers with
, where
N is the length of the original time series. Secondly,
p and
q entries are swapped with each other. Finally, the above two steps are repeated
times to ensure that the original series is fully shuffled.
We shuffled the ship flow sequences and calculated
. As seen in
Figure 8, the
is approximately 0.5 for most of the ship flow sequences except for the weekly ship flow sequences of Singapore. The shuffled ship flow sequences with
of about 0.5, indicating the multifractality of these ship flow sequences, are caused by different fluctuations in correlations of small and large scales. However, the multifractality of the weekly ship flow sequences of Singapore port is caused by a broadening of the probability density function. This result is consistent with the results shown in
Figure 3. Therefore, the multifractality presented in the ship flow sequences of container ports are due to the correlation properties as well as the probability density function of the ship flow series.
6. Conclusions
In this study, we investigated the statistical properties of container ship flow time series and made a detailed investigation on long-range behaviors and fractal characteristics of ship flow sequences for three representative container ports in the world—Shanghai, Singapore, and Rotterdam. This study concludes three main findings.
Firstly, the empirical evidence given in this study emphasize the significance of long-range dependence behaviors and multifractal property in all ship flow sequences at different time scales for three container ports.
Secondly, the empirical evidence from comparisons among these ship flow sequences at different time scales implies that the long-range dependence becomes larger for each port as the time scale increases, except for the port of Singapore. Shanghai and Rotterdam were identified as the ports with the highest degree of long-range dependence in monthly ship flow sequences, while Singapore was identified as having the highest degree of long-range dependence in weekly ship flow sequence.
Finally, the empirical evidence confirmed the multifractal property as an impact factor on the ship flow sequences of container ports. The analysis on the shuffled data indicated that the presence of multifractality in the ship flow sequences of container ports is due to the correlation properties as well as to the probability density function of the ship flow series.
The findings of this study provide some interesting implications. First, the existence of long-range dependence and multifractality in container ship flow could be exploitable and helpful for shipping companies and policy makers. In other words, the presence of chaotic structure such as long-range dependence and multifractality in container ship flow sequences implies that the volume and direction of container ship flow may demand certain rules. Therefore, the shipping company can carry out short-term capacity allocation and adjustment according to container ship flow prediction. Second, the presence of long-range dependence and multifractality in the data suggests that container ship flow forecasting models should account for existing nonlinearities in the data, otherwise, their results may be biased and highly misleading.
Port groups can use these findings in forecasting the expected volatility in the number of arriving container ships, and thereby, in developing and carrying out the layout planning of the port infrastructure, shipping date planning, and even port expansion investment. Moreover, some advanced modeling approaches can be employed for ship flow sequence forecasting, such as statistical modeling [
40,
41] and machine learning methods [
42,
43].
In addition, we regarded the trends in the ship traffic flow time series in this study as caused by external conditions. We identified and filtered out these trends in MF-DFA analysis. However, these trends may not be completely caused by external conditions, and some trends may carry endogenous power from data. At this time, when we explore the long-range power-law dependence of the time series, whether to filter out the trend needs further discussion, as pointed out by Hu et al. [
38]. The effect of trends on detrended fluctuation analysis for ship traffic flow time series of ports can be further studied in the future.
Author Contributions
C.-J.L.: conceptualization, methodology, software, validation, formal analysis, investigation, visualization; J.W.: writing—review and editing; H.L.J.: writing—review and editing; Z.-H.H.; resources, data curation, writing—original draft preparation, supervision. All authors have read and agreed to the published version of the manuscript.
Funding
This work was supported in part by the Australian Research Council Centre of Excellence for Mathematical and Statistical Frontiers (ACEMS), under grant number CE140100049, the National Natural Science Foundation of China (No. 71871136 and 71801150), and the 2021 General project of Shanghai Philosophy and Social Science Planning (2021BJB006).
Institutional Review Board Statement
Not applicable.
Informed Consent Statement
Not applicable.
Data Availability Statement
The data used to support the findings of this study are available from the corresponding author upon reasonable request.
Conflicts of Interest
The authors declare no conflict of interest.
References
- Simões, P.; Marques, R.C. Influence of congestion efficiency on the European seaports performance: Does it matter? Transp. Rev. 2010, 30, 517–539. [Google Scholar] [CrossRef]
- Ke, G.Y.; Li, K.W.; Hipel, K.W. An integrated multiple criteria preference ranking approach to the Canadian west coast port congestion conflict. Expert Syst. Appl. 2012, 39, 9181–9190. [Google Scholar] [CrossRef] [Green Version]
- Peng, C.K.; Buldyrev, S.V.; Havlin, S.; Simons, M.; Stanley, H.E.; Goldberger, A.L. Mosaic organization of DNA nucleotides. Phys. Rev. E 1994, 49, 1685. [Google Scholar] [CrossRef] [PubMed] [Green Version]
- Audit, B.; Vaillant, C.; Arneodo, A.; d’Aubenton Carafa, Y.; Thermes, C. Long-range correlations between DNA bending sites: Relation to the structure and dynamics of nucleosomes. J. Mol. Biol. 2002, 316, 903–918. [Google Scholar] [CrossRef]
- Leite, A.; Rocha, A.; Silva, M.; Gouveia, S.; Carvalho, J.; Costa, O. Long-range dependence in heart rate variability data: ARFIMA modelling vs. detrended fluctuation analysis. In Proceedings of the 2007 Computers in Cardiology, Durham, NC, USA, 30 September–3 October 2007; IEEE: Piscataway, NJ, USA, 2007; pp. 21–24. [Google Scholar]
- Cajueiro, D.O.; Tabak, B.M. Evidence of long range dependence in Asian equity markets: The role of liquidity and market restrictions. Phys. A Stat. Mech. Appl. 2004, 342, 656–664. [Google Scholar] [CrossRef]
- Mishra, R.K.; Sehgal, S.; Bhanumurthy, N. A search for long-range dependence and chaotic structure in Indian stock market. Rev. Financ. Econ. 2011, 20, 96–104. [Google Scholar] [CrossRef]
- Pérez-Rodríguez, J.V.; Andrada-Félix, J.; Rachinger, H. Testing the forward volatility unbiasedness hypothesis in exchange rates under long-range dependence. N. Am. J. Econ. Finance 2021, 57, 101438. [Google Scholar] [CrossRef]
- Rego, C.; Frota, H.; Gusmão, M. Multifractality of Brazilian rivers. J. Hydrol. 2013, 495, 208–215. [Google Scholar] [CrossRef]
- Tyralis, H.; Dimitriadis, P.; Koutsoyiannis, D.; O’Connell, P.E.; Tzouka, K.; Iliopoulou, T. On the long-range dependence properties of annual precipitation using a global network of instrumental measurements. Adv. Water Resour. 2018, 111, 301–318. [Google Scholar] [CrossRef]
- Iliopoulou, T.; Papalexiou, S.M.; Markonis, Y.; Koutsoyiannis, D. Revisiting long-range dependence in annual precipitation. J. Hydrol. 2018, 556, 891–900. [Google Scholar] [CrossRef]
- Pal, S.; Dutta, S.; Nasrin, T.; Chattopadhyay, S. Hurst exponent approach through rescaled range analysis to study the time series of summer monsoon rainfall over northeast India. Theor. Appl. Climatol. 2020, 142, 581–587. [Google Scholar] [CrossRef]
- Karmakar, S.; Goswami, S.; Chattopadhyay, S. Exploring the pre-and summer-monsoon surface air temperature over eastern India using Shannon entropy and temporal Hurst exponents through rescaled range analysis. Atmos. Res. 2019, 217, 57–62. [Google Scholar] [CrossRef]
- Chakraborty, S.; Chattopadhyay, S. Exploring the Indian summer monsoon rainfall through multifractal detrended fluctuation analysis and the principle of entropy maximization. Earth Sci. Inform. 2021, 14, 1571–1577. [Google Scholar] [CrossRef]
- Chand, S.; Aouad, G.; Dixit, V.V. Long-Range Dependence of Traffic Flow and Speed of a Motorway: Dynamics and Correlation with Historical Incidents. Transp. Res. Rec. 2017, 2616, 49–57. [Google Scholar] [CrossRef]
- Wang, J.L.; Wei, H.R.; Ye, C.; Ding, Y. Fractal behavior of traffic volume on urban expressway through adaptive fractal analysis. Phys. A Stat. Mech. Appl. 2016, 443, 518–525. [Google Scholar]
- Hu, Z.H.; Liu, C.J.; Chen, W.; Wang, Y.G.; Wei, C. Maritime convection and fluctuation between Vietnam and China: A data-driven study. Res. Transp. Bus. Manag. 2020, 34, 100414. [Google Scholar] [CrossRef]
- Hu, Z.H.; Liu, C.J.; Tae-Woo Lee, P. Analyzing interactions between Japanese ports and the Maritime Silk Road based on complex networks. Complexity 2020, 2020, 3769307. [Google Scholar] [CrossRef]
- Ghorbani, M.; Jonckheere, E.A.; Bogdan, P. Gene expression is not random: Scaling, long-range cross-dependence, and fractal characteristics of gene regulatory networks. Front. Physiol. 2018, 9, 1446. [Google Scholar] [CrossRef] [PubMed] [Green Version]
- Gaudio, R.; De Bartolo, S.G.; Primavera, L.; Gabriele, S.; Veltri, M. Lithologic control on the multifractal spectrum of river networks. J. Hydrol. 2006, 327, 365–375. [Google Scholar] [CrossRef]
- Franzke, C. Nonlinear trends, long-range dependence, and climate noise properties of surface temperature. J. Clim. 2012, 25, 4172–4183. [Google Scholar] [CrossRef] [Green Version]
- Hurst, H.E. Long-term storage capacity of reservoirs. Trans. Am. Soc. Civ. Eng. 1951, 116, 770–799. [Google Scholar] [CrossRef]
- Wang, Z.; Yan, Y.; Chen, X. Long-range correlation and market segmentation in bond market. Phys. A Stat. Mech. Appl. 2017, 482, 477–485. [Google Scholar] [CrossRef] [Green Version]
- Wang, Y.; Wei, Y.; Wu, C. Analysis of the efficiency and multifractality of gold markets based on multifractal detrended fluctuation analysis. Phys. A Stat. Mech. Appl. 2011, 390, 817–827. [Google Scholar] [CrossRef]
- Abry, P.; Veitch, D. Wavelet analysis of long-range-dependent traffic. IEEE Trans. Inf. Theory 1998, 44, 2–15. [Google Scholar] [CrossRef]
- Coronado, A.V.; Carpena, P. Size effects on correlation measures. J. Biol. Phys. 2005, 31, 121–133. [Google Scholar] [CrossRef] [PubMed] [Green Version]
- Wang, F.; Liao, G.P.; Zhou, X.Y.; Shi, W. Multifractal detrended cross-correlation analysis for power markets. Nonlinear Dyn. 2013, 72, 353–363. [Google Scholar] [CrossRef]
- Mensi, W.; Hamdi, A.; Yoon, S.M. Modelling multifractality and efficiency of GCC stock markets using the MF-DFA approach: A comparative analysis of global, regional and Islamic markets. Phys. A Stat. Mech. Appl. 2018, 503, 1107–1116. [Google Scholar] [CrossRef]
- Ali, S.; Shahzad, S.J.H.; Raza, N.; Al-Yahyaee, K.H. Stock market efficiency: A comparative analysis of Islamic and conventional stock markets. Phys. A Stat. Mech. Appl. 2018, 503, 139–153. [Google Scholar] [CrossRef]
- Shang, P.; Lu, Y.; Kamae, S. Detecting long-range correlations of traffic time series with multifractal detrended fluctuation analysis. Chaos Solitons Fractals 2008, 36, 82–90. [Google Scholar] [CrossRef]
- Doménech-Carbó, A. Rise and fall of historic tram networks: Logistic approximation and discontinuous events. Phys. A Stat. Mech. Appl. 2019, 522, 315–323. [Google Scholar] [CrossRef]
- Feng, S.; Wang, X.; Sun, H.; Zhang, Y.; Li, L. A better understanding of long-range temporal dependence of traffic flow time series. Phys. A Stat. Mech. Appl. 2018, 492, 639–650. [Google Scholar] [CrossRef]
- Wang, Y.; Vormer, F.; Hu, M.; Duong, V. Empirical analysis of air traffic controller dynamics. Transp. Res. Part C Emerg. Technol. 2013, 33, 203–213. [Google Scholar] [CrossRef]
- Yuan, P.; Lin, X. How long will the traffic flow time series keep efficacious to forecast the future? Phys. A Stat. Mech. Appl. 2017, 467, 419–431. [Google Scholar] [CrossRef]
- Gómez-Extremera, M.; Carpena, P.; Ivanov, P.C.; Bernaola-Galván, P.A. Magnitude and sign of long-range correlated time series: Decomposition and surrogate signal generation. Phys. Rev. E 2016, 93, 042201. [Google Scholar] [CrossRef] [Green Version]
- Kantelhardt, J.W.; Zschiegner, S.A.; Koscielny-Bunde, E.; Havlin, S.; Bunde, A.; Stanley, H.E. Multifractal detrended fluctuation analysis of nonstationary time series. Phys. A Stat. Mech. Appl. 2002, 316, 87–114. [Google Scholar] [CrossRef] [Green Version]
- Ihlen, E.A.F. Introduction to Multifractal Detrended Fluctuation Analysis in Matlab. Front. Physiol. 2012, 3, 141. [Google Scholar] [CrossRef] [Green Version]
- Hu, K.; Ivanov, P.C.; Chen, Z.; Carpena, P.; Stanley, H.E. Effect of trends on detrended fluctuation analysis. Phys. Rev. E 2001, 64, 011114. [Google Scholar] [CrossRef] [Green Version]
- Lu, W.Z.; Xue, Y. Detrended fluctuation analysis of particle number concentrations on roadsides in Hong Kong. Build. Environ. 2014, 82, 580–587. [Google Scholar] [CrossRef]
- Xu, X.; McGrory, C.A.; Wang, Y.G.; Wu, J. Influential factors on Chinese airlines’ profitability and forecasting methods. J. Air Transp. Manag. 2021, 91, 101969. [Google Scholar] [CrossRef]
- Zhang, S.; Wu, J.; Jia, Y.; Wang, Y.G.; Zhang, Y.; Duan, Q. A temporal LASSO regression model for the emergency forecasting of the suspended sediment concentrations in coastal oceans: Accuracy and interpretability. Eng. Appl. Artif. Intell. 2021, 100, 104206. [Google Scholar] [CrossRef]
- Zhu, M.; Wu, J.; Wang, Y.G. Multi-horizon accommodation demand forecasting: A New Zealand case study. Int. J. Tour. Res. 2021, 23, 442–453. [Google Scholar] [CrossRef]
- Wu, J.; Wang, Y.G.; Tian, Y.C.; Burrage, K.; Cao, T. Support vector regression with asymmetric loss for optimal electric load forecasting. Energy 2021, 223, 119969. [Google Scholar] [CrossRef]
| Publisher’s Note: MDPI stays neutral with regard to jurisdictional claims in published maps and institutional affiliations. |
© 2021 by the authors. Licensee MDPI, Basel, Switzerland. This article is an open access article distributed under the terms and conditions of the Creative Commons Attribution (CC BY) license (https://creativecommons.org/licenses/by/4.0/).


