Article

Characterisation of COVID-19-Related Tweets in the Croatian Language: Framework Based on the Cro-CoV-cseBERT Model

by
Karlo Babić
1,2,
Milan Petrović
1,2,
Slobodan Beliga
1,2,
Sanda Martinčić-Ipšić
1,2,
Mihaela Matešić
2,3 and
Ana Meštrović
1,2,*
1
Department of Informatics, University of Rijeka, 51000 Rijeka, Croatia
2
Center for Artificial Intelligence and Cybersecurity, University of Rijeka, 51000 Rijeka, Croatia
3
Faculty of Humanities and Social Sciences, 51000 Rijeka, Croatia
*
Author to whom correspondence should be addressed.
Appl. Sci. 2021, 11(21), 10442; https://doi.org/10.3390/app112110442
Submission received: 4 October 2021 / Revised: 25 October 2021 / Accepted: 2 November 2021 / Published: 6 November 2021
(This article belongs to the Section Computing and Artificial Intelligence)

Abstract

:
This study aims to provide insights into the COVID-19-related communication on Twitter in the Republic of Croatia. For that purpose, we developed an NL-based framework that enables automatic analysis of a large dataset of tweets in the Croatian language. We collected and analysed 206,196 tweets related to COVID-19 and constructed a dataset of 10,000 tweets which we manually annotated with a sentiment label. We trained the Cro-CoV-cseBERT language model for the representation and clustering of tweets. Additionally, we compared the performance of four machine learning algorithms on the task of sentiment classification. After identifying the best performing setup of NLP methods, we applied the proposed framework in the task of characterisation of COVID-19 tweets in Croatia. More precisely, we performed sentiment analysis and tracked the sentiment over time. Furthermore, we detected how tweets are grouped into clusters with similar themes across three pandemic waves. Additionally, we characterised the tweets by analysing the distribution of sentiment polarity (in each thematic cluster and over time) and the number of retweets (in each thematic cluster and sentiment class). These results could be useful for additional research and interpretation in the domains of sociology, psychology or other sciences, as well as for the authorities, who could use them to address crisis communication problems.

1. Introduction

Social media play an important role in global crises, such as the COVID-19 pandemic. They serve as a key communication platform [1] and are potentially a source of valuable information [2]. During the last two decades, social media have amplified the spread of information, as well as misinformation and disinformation which may lead to an infodemic as a negative side effect [3]. Thus, social media monitoring (infoveillance) is needed for better understanding of crisis communication.
In this light, natural language processing (NLP) offers a set of techniques and methods that contributes to the monitoring of crisis communication on social media. Namely, automatic keyword extraction, topic modelling, named entity recognition, text classification, sentiment analysis, fake news detection, etc., can be applied to different aspects of information monitoring. When dealing with a large amount of textual data, these techniques can perform more efficiently than humans [4]. For example, when dealing with data gathered from social networks, sentiment analysis based on machine learning (ML) provides insights into public attitudes. In the context of the pandemic, this may contribute to the implementation of appropriate public health responses [5]. Therefore, sentiment analysis (sometimes combined with topic modelling) is one of the most frequent NLP tasks implemented in COVID-19 information monitoring [6,7,8,9,10,11,12].
Focusing on the similar tasks, in this research we describe the implementation of an NLP based framework for the analysis of tweets written in the Croatian language, integrating the sentiment analysis, the topis analysis and the analysis of message spreading (retweeting). There are fewer studies focused on other languages, such as sentiment analysis of Polish [13] and Greek [14] tweets or topic modelling for tweets in the Italian language [15]. Studies limited to one language are important as a potential source of material for further comparative research of COVID-19-related communication in different languages. Thus, although the proposed framework covers only local aspects of online COVID-19 communication, limited to the Croatian language, it is a valuable contribution to the research in the context of monitoring the pandemic-related communication.
The goal of this research was to develop a framework that includes language resources for the Croatian language and then to apply it to the analysis and characterisation of COVID-19-related tweets. The main purpose of developing the framework was to answer the following research questions:
RQ1:
What sentiment was present in COVID-19-related tweets posted during the first three pandemic waves and how did the amount of negative sentiment change over time?
RQ2:
What is the number of tweets present in the different thematic clusters related to COVID-19 and how do these trends change over the three pandemic waves?
RQ3:
What is the distribution of sentiment polarity (in each thematic cluster and over time) and the distribution of retweets (across thematic clusters and sentiment)?
As mentioned above, an essential prerequisite for answering these questions is to develop a language model and datasets for the domain of COVID-19 texts in the Croatian language. We decided to use and train a BERT variant of the language model. BERT (Bidirectional Encoder Representations from Transformers) [16] is a deep bidirectional Transformer that learns sentence representations. The BERT model was initially pre-trained on a large corpus of English texts, but the multilingual versions of BERT, mBERT [17], trained on 104 languages and XLM-R, trained on 100 languages [18] soon followed. Although mBERT and XLM-R achieve good results, it has been found that models trained on few languages (bilingual and trilingual models) or on one language (monolingual models) perform better than models trained on a large number of languages (multilingual models) [19,20,21]. When it comes to less-resourced languages, such as Croatian, there is still a lack of available monolingual language models. Thus, for the purpose of this study, we used an existing trilingual CroSloEngualBERT language model [21] that was pre-trained using online news articles in Croatian, Slovene and English. However, the COVID-19 pandemic led to the emergence of new terminology that has not been covered within the CroSloEngualBERT. To fill this gap, we additionally trained the model on a dataset of COVID-19-related texts in the Croatian language (Cro-CoV-Texts). The result is a new version of the BERT language model, Cro-CoV-cseBERT, that can be used for any NLP task in the domain of COVID-19.
In the second step, we applied the Cro-CoV-cseBERT model for the representation of tweets. We collected data from Twitter and filtered 206,196 unique COVID-19-related tweets in the Croatian language posted between 1 January 2020 and 31 May 2021 and created a Cro-CoV-Tweets dataset. From this dataset, we chose a representative sample of 10,000 tweets, manually labelled each tweet with one of three possible labels (negative, neutral and positive) and constructed a Senti-Cro-CoV-Tweets dataset enabling supervised learning of sentiment. We represented each tweet as a Cro-CoV-cseBERT embedding and trained four different ML models (naïve Bayes, random forest, support vector machine, and multilayer perceptron) on the task of sentiment analysis. The performance of ML models has been assessed using standard evaluation measures. Multilayer perceptron proved to be the best performing model and, thus, we used it for the annotation of the rest of the Cro-CoV-Tweets dataset.
Next, we performed an extensive analysis of the Cro-CoV-Tweets dataset with the aim of answering the research questions. First, we observed trends of negativity in tweets posted during the pandemic. Furthermore, given the vectors of tweets, we performed clustering using a k-means algorithm and identified possible themes of tweets grouped into clusters. In the last step, we examined how sentiment in clusters changes over time and how COVID-19-related messages spread in social media in terms of retweeting.
To summarise, we identify three main contributions of this study.
  • We trained the Cro-CoV-cseBERT model for the representation of COVID-19 tweets in the Croatian language using a large dataset of COVID-19-related texts in the Croatian language;
  • We developed two datasets that could be further used in similar research: (i) Senti-Cro-CoV-Tweets—a dataset of 206,196 Croatian tweets related to COVID-19 posted during the first three waves of the pandemic and (ii) Senti-Cro-CoV-Tweets —a dataset of 10,000 Croatian COVID-19 tweets manually annotated for sentiment;
  • We provide an overview of sentiment, themes and retweeting of COVID-19 messages in the Croatian language, which should prove to be of help when it comes to monitoring the crisis communication.
This paper is structured as follows: in Section 2, we review previous research focused on the analysis of the crisis communication related to COVID-19 in social media and applications of the BERT language model. In Section 3, we describe the dataset collected from Twitter and the annotated dataset for the sentiment analysis. Next, in Section 4, we describe the NLP methods that we used in this research. In Section 5, we present and discuss the results. In Section 6, we present the main findings, possible applications and limitations of this study. In the last section, we provide conclusions.

2. Background

2.1. NLP-Based Analyses of COVID-19 Related Tweets

During the COVID-19 pandemic, a number of studies focused on the analysis of tweets related to the coronavirus outbreak. Many of these studies used various NLP techniques in different tasks, such as analysis of infodemic and information spreading in general [22,23,24,25], fake news detection [26,27], and sentiment analysis [6,7,8,9,10,11]. Within the scope of this work, we will focus on sentiment analysis studies.
The majority of studies analysed tweets posted during the early stage of the pandemic. Thus, Chandrasekaran et al. in [9] analysed sentiment, themes and topics of English-language COVID-19-related tweets posted in the time period between 1 January and 9 May 2020. The study explores the trends and variations in the change of the nature of COVID-19-related tweets over a period of time, from before until after the outbreak was declared a pandemic. The results show that sentiment scores are mostly negative for the topics related to the spread and increase in the number of cases. Samuel et al. [28] trained two classification models (naïve Bayes and Logistic regression) and compared their performance on classification of COVID-19 tweets into a positive or a negative class. They found that there was a growth of negative sentiment in COVID-19 tweets. De Melo and Figueiredo [11] performed sentiment analysis, topic modelling and named entity recognition of tweets and news articles about COVID-19 published during the first wave of the pandemic by more than one million users from Brazil. They reported that the social media tended to have a more negative than positive and neutral sentiment, especially toward political themes.
Some authors also included emotion analysis. Thus, Lwin et al. [8] examined trends of four emotions: fear, anger, sadness, and joy, present in worldwide tweets related to coronavirus during the early stage of the pandemic. Their findings indicate that negative emotions were dominant in the first stage of the pandemic. Similarly, Xue et al. in [6] analysed emotions of 1.9 million COVID-19-related tweets in the English language, posted between 23 January and 7 March 2020. They found that the fear of the unknown nature of the coronavirus was dominant in all topics. The same group of authors [7] analysed emotions in tweets published from March to April 2020 using an emotion lexicon. They also performed topic modelling and showed that emotion of fear arises in messages related to new cases or death reports.
In our previous preliminary research related to analysis of COVID-19 texts, we compared sentiment of COVID-19-related tweets in the Croatian and Polish language during the first wave of pandemic [29], detected topics in COVID-19-related news articles and comments [30], examined retweeting of COVID-19 tweets [31], and analysed the polarity of Croatian online news related to COVID-19 [32].
While the majority of studies covered sentiment analysis of COVID-19 tweets in general, some studies put focus on more specific topics, such as vaccination [33,34] or online education [35,36]. There is also a small number of studies that focused more on the comparison of different algorithms for sentiment classification of COVID-19 tweets than on their application and analysis of results. One such paper is [37], where the authors compared the performance of five ML algorithms on the task of sentiment analysis of a small dataset of COVID-19 tweets using different experimental settings. Additionally, they evaluated LSTM and confirmed that deep learning models do not perform well on small datasets.
A large number of the mentioned studies used sentiment lexicons such as VADER or textBlob for the task of sentiment analysis, or at least, for the initial annotation of the dataset that is later used for supervised classification. Using sentiment lexicons or emotion lexicons is the faster method when it comes to obtaining results. However, some studies show that machine learning outperforms lexicon-based methods [38]. Hence, in this work, we employ and compare different ML methods with a manually annotated dataset for a supervised learning of sentiment classification task based on the BERT language model used for text representation.

2.2. BERT-Based Language Models

For all NLP tasks, the first important issue is an adequate language model which incorporates properties of text (e.g., semantics, syntax). The seminal work by Mikolov et al. [39] contributed to the emergence of numerous variants of text representation models in the form of low dimensional vectors in continuous space-embeddings. Embeddings enable representation of semantically related linguistic units with similar vector representations. The first generation was characterised by shallow language models, such as Word2Vec [39], Doc2Vec [40], GloVe [41] and fastText [42]. The main drawback of these models are static embeddings in which multiple concepts (i.e., different meanings of the same unit, polysemy) are not represented by different embedding vectors. Moreover, it has been demonstrated that they do not perform well when ported to new domains, differing from the one on which they have been trained [43]. This spurred the development of a generation of deep language models, namely ELMo [44], GPT/GPT-2 [45], GPT-3 [46] and BERT [16]. The deep language models successfully overcome the issue by replacing static embeddings with contextualized representations. Hence, they enable learning of contextual and task-independent representations which yielded an improvement in performance on various NLP tasks [47,48]. In recent years, there have been attempts to use BERT-like models for the task of sentiment analysis of social networks messages. In this section, we shortly describe studies in which BERT-like models were used for the task of sentiment analysis of social networks, such as Twitter or Weibo or in some other COVID-19-related NLP tasks.
Pota et al. [49] introduced the BERT language model for the task of Twitter sentiment analysis, where they first transformed the Twitter jargon, including emojis and emoticons, into plain text, and then applied BERT, which was pre-trained on plain text, to fine-tune and classify the tweets. Their results show improvements in sentiment classification performance, both with respect to other state-of-the-art systems and with respect to the use of only the BERT classification model. They presented a case study of the Italian language, but their approach can be adopted for other languages as well. Another study that presented the use of BERT for Twitter was reported in [50]. In this study, the authors describe how they trained a BERT-like model AlBERTo for the Italian language, specifically on the language style used on Twitter. AlBERTo has been trained, without consequences, on text spans containing typical social media characters including emojis, links, hashtags and mentions. The model was evaluated on three tasks: subjectivity classification, polarity classification and irony detection and it was shown that it outperformed the baseline models in terms of precision, recall and F1-score.
Recently, studies have been reporting applications of BERT-like models for sentiment analysis in the domain of COVID-19. Chintalapudi et al. [51] described the sentiment analysis of a COVID-19 dataset in the Indian language collected from Twitter between 23 March 2020 and 15 July 2020. They used BERT model, and compared it with three other models, namely logistic regression (LR), support vector machines (SVM), and long-short term memory (LSTM). Accuracy for every sentiment was separately calculated. The BERT model produced 89% accuracy and the other three models produced 75%, 74.75%, and 65%, respectively. In [52], the authors performed large-scale Twitter discourse classification using Language-agnostic BERT Sentence Embeddings (LaBSE), which is the state-of-the-art model for multilingual sentence embeddings representation. They analysed more than 26 million COVID-19 tweets showing that large-scale surveillance of public discourse is feasible with ML approaches. Wang et al. [5] performed fine-tuning of the BERT model for sentiment classification on Chinese Weibo posts related to COVID-19. Their approach achieved considerable accuracy that beats all baseline NLP algorithms. They also extracted the central and representative topics by adopting TF-IDF (term frequency-inverse document frequency) model. Their analyses provide insights into the trends of sentiment and topics connected to negative sentiment of Weibo posts.
Due to the success in the performance on various NLP tasks, various studies propose variants of BERT-like models trained for tasks other than sentiment analysis such as: COBERT for question answering [53], CT-BERT for fact checking [54], BERT and OpenAI GPT-2 for text summarization [55], Sen-SCI-CORD19-BERT for assessing the semantic similarity [56], etc. The BERT family of models has been identified in numerous studies as a promising approach when monitoring large volumes of communication data, so we adopted and fine-tuned a variant of a BERT language model for the sentiment analysis of tweets in the Croatian language—the Cro-CoV-Tweets dataset.

3. Datasets

3.1. Cro-CoV-Tweets Dataset

The collected Twitter data capture the period between 1 January 2020 and 31 May 2021, an almost half-year period, covering the duration of the first three epidemic waves. A pandemic/epidemic wave is a graph that tracks the number of people suffering from a disease over time. Epidemics usually begin with a sharp increase in the number of patients in a short time, that number then reaches a peak, after which it begins to decline until there are no new infections. Some epidemiological experts state that if there is no new case in a population for a certain number of days (e.g., 14 days), only then can the end of the epidemic (epidemic wave) be declared. The definition of a second wave is that the first wave must end and that a certain period must pass in between. In this study, there was no complete cessation for fourteen days without a single case of infection in Croatia. Thus, there are no official dates delimiting the three epidemic waves in Croatia. However, we took approximate dates defining the periods that cover the start and end of each wave. Therefore, in this study, we determined the periods of three waves as follows: the first wave: 1 January 2020–15 May 2020; the second wave: 16 May 2020–25 February 2021, and the third wave: 26 February 2021–31 May 2021. Note that 26 February 2020 is the date when the first case of coronavirus infection was confirmed in Croatia. However, in our analysis, we wanted to capture tweets that were posted even before the official start of the pandemic in the Republic of Croatia. The data were collected using tweepy [57], a Python library for accessing the Twitter API. The retrieval of tweets was filtered with the help of a set of COVID-19-related keywords listed in Appendix A.
The final dataset Cro-CoV-Tweets consists of 206,196 tweets. The daily frequency of tweets is shown in Figure 1. It can be observed that the highest number of tweets was posted during the first lockdown in Croatia, in March and April 2020. The second peak of tweets occurred in the autumn of 2020 during the second pandemic wave, characterised by a major outbreak of the disease. In order to better describe the Cro-CoV-Tweets dataset, we report visualisations of several other distributions of COVID-19-related tweets during the observed time period in Appendix A, Figure A1.

3.2. Senti-Cro-CoV-Tweets Dataset

From the retrieved tweets, we first selected a representative sample of 10,000 tweets and constructed an annotated sentiment dataset, Senti-Cro-CoV-Tweets, with negative, neutral, positive and sarcasm categories. The sentiment annotation was performed in two phases: the goal of the first phase was to obtain the annotation instructions, and the goal of the second was to obtain the annotation of the sentiment in the dataset.
The first phase was necessary in order to be able to discuss and define a list of common annotation instructions and to instruct the principal annotator. Initially, we selected a random subset of 100 tweets and performed two rounds of annotations. In the first round, six human annotators, including one expert in linguistics, labeled each tweet without being instructed in advance. Prior to annotation, only four labels were determined: Negative, neutral, positive, and sarcasm. Note that later in the experiments, we relabeled all sarcastic tweets as negative, but initially, sarcasm was regarded as a separate category. The consistency of initial annotations provided by six annotators is assessed by Inter-Annotator Agreement (IAA) in terms of Fleiss’ kappa coefficient. Fleiss’ kappa measures how well multiple annotators can make the same annotation decision in an annotation category. In the first round, the IAA was 0.33, which is a fair agreement (please note: the Fleiss’ kappa ranges from 0 to 1: values lower than 0.4. imply fair agreement, between 0.41 and 0.60—moderate, above between 0.61 and 0.8—substantial, above 0.81—almost perfect agreement [58].) After the first round of independent annotations, six annotators discussed at the level of individual instances the argumentation for the annotation category and identified vague points of annotation, and subsequently resolved possible issues and doubts. This resulted in a final list of detailed instructions for sentiment labelling which enabled training the principal annotator according to the instructions. Next, in the second round of annotations, all six annotators and the new annotator annotated 100 tweets according to the set of instructions and achieved an IAA of 0.62. At this stage, we had agreement upon the variations and nuances in the annotation.
In the second phase, the rest of the 10,000 tweets were annotated by the principal annotator in accordance with the agreed instructions with the support of the linguistic expert. After the annotation procedure, the distribution of sentiment was as follows: 4914 neutral tweets; 3730 with negative sentiment, 475 with positive sentiment and 841 tweets annotated as sarcasm (which we treat as a negative sentiment). In the initial dataset, there were also 40 tweets in English language which are not included in the final version of the Senti-Cro-CoV-Tweets dataset, so the size of the Senti-Cro-CoV-Tweets dataset is 9960 tweets.

4. Methodology

In this section, we describe the methodology used in this research. First, we trained the Cro-CoV-cseBERT model for the representation of COVID-19 tweets in the Croatian language as embedding vectors. We compared this model against the fastText model as a baseline. For the purpose of a supervised task of sentiment classification, we trained all four ML models and reported the evaluation results for both representation models in combination with each of the four ML models. Next, we performed a clustering of tweets and identified the main themes of clusters. After applying these methods, we characterised the COVID-19 tweets by providing the information about the amount of negative sentiment and retweeting during the three pandemic waves and across clusters. The sequential workflow of the methodology, along with the methods, algorithms, and datasets is illustrated in Figure 2.

4.1. Text Embeddings

4.1.1. Cro-CoV-cseBERT Model

We trained the Cro-CoV-cseBERT based on the CroSloEngualBERT [21] (cseBERT), a trilingual language model that was pre-trained on a large volume of texts from online news articles in Croatian, Slovene and English. Cro-CoV-cseBERT is the name of the cseBERT model after we fine-tuned the cseBERT on a large corpus of texts related to the COVID-19 in the Croatian language, Cro-CoV-Texts. Cro-CoV-Texts contains 186,738 news articles and 500,504 user comments related to COVID-19 published on Croatian online news portals and 28,208 COVID-19 tweets in the Croatian language (excluding tweets from the Senti-Cro-CoV-Tweets dataset). All texts were preprocessed using the same procedure as described in [59], which includes: replacement of usernames, replacement of urls and translating emojis into ASCII code.
We fine-tuned the initial CroSloEngualBERT language model on Cro-CoV-Texts for the masked language modelling task using the Simple Transformers library [60]. To prepare the data for training, we did the stratified random split by date into training (80%), validation (10%), and test (10%) parts, separately for each of the publishing sources. Then, we split the input data into smaller chunks of up to 3 sentences using the Classla library for Croatian tokenization and sentence splitting [61]. Additionally, we up-sampled the COVID-19 tweet dataset 20 times, since it is the smallest one in our data. We trained the model for one epoch by using the learning rate 4 × 10 5 with warmup and linear decay. We obtained similar masked language modelling loss results on the training data (1.702), validation data (1.794), and the final test data (1.783).
Afterwards, we used the SentenceTransformers Python framework [62] to create tweet embeddings with the Cro-CoV-cseBERT model, which we used for the rest of this work.

4.1.2. FastText Model

For the purpose of evaluation of the Cro-CoV-cseBERT model, we compared it to the fastText skip-gram model [42] as the baseline. The fastText embeddings for the Croatian language are available from CLARIN.SI-embed.hr dataset [63]. In this case, tokens are words separated by whitespace character and tweets are vectorized by averaging token embeddings (i.e., the centroid-averaged token vectors).

4.2. Sentiment Analysis

For the supervised task of sentiment analysis, we trained four classification models: naïve Bayes, random forest, support vector machine, and multilayer perceptron. We classified sentiment into three classes: Negative, neutral, and positive, and compared the performance of models using both Cro-CoV-cseBERT and fastText embeddings. According to the evaluation results (reported in Section 5), we chose the best performing combination of the model and representation to annotate the whole Cro-CoV-Tweets dataset.
All the models were trained with the scikit-learn Python library [64], using the annotated Senti-Cro-CoV-Tweets dataset. Out of 9960 labeled tweets, we used 90% of tweets for training and 10% of tweets for evaluation.

Evaluation

We compared the performance of the trained Cro-CoV-cseBERT model with fastText model as the baseline using different ML models in the supervised task of sentiment analysis. The evaluation was performed in terms of standard classification metric: precision, recall, F1-score and accuracy. Table 1 and Table 2 show the evaluation results obtained from naïve Bayes, random forest, support vector machine, and multilayer perceptron classification models trained with Cro-CoV-cseBERT and fastText embeddings, respectively.
According to the evaluation results, Cro-CoV-cseBERT outperforms the fastText model for each ML model (only in the case of naïve Bayes, both models have the same accuracy 0.71). When comparing only ML models used in the supervised task of sentiment analysis, the highest scores of all evaluation measures are achieved with multilayer perceptron, in both representation models. In particular, F1-score is 0.66 for Cro-CoV-cseBERT, and 0.59 in the case of the fastText.
All the trained models could perform better with a more balanced dataset, but the number of positive tweets is significantly lower than the number of tweets in other classes. We also report detailed results of the per-class evaluation in Appendix B.1.

4.3. Clustering

Next, we clustered the tweets represented with Cro-CoV-cseBERT embeddings using k-means clustering with 10 clusters. K-means is trained with 500 iterations using the scikit-learn Python library. Since embedding representations capture the semantics of tweets, tweets assigned to the specific cluster are semantically similar. Thus, we assigned a theme related to every cluster and further analysed the quantity of tweets in individual clusters and how these trends were changing over time. Additionally, we analysed the negativity present in every cluster.

5. Results

5.1. Insights into the Negativity of Tweets Related to COVID-19

In this subsection, we aim to answer RQ1, i.e., what sentiment was present in COVID-19-related tweets posted during the first three pandemic waves and how did the amount of negative sentiment change over time? Initially, we trained the classification models for the three annotated categories: Negative, neutral, or positive and evaluated the performance of different models. After applying the best performing model (multilayer perceptron with Cro-CoV-cseBERT embeddings) to the Cro-CoV-Tweets dataset, the numbers of tweets per classes were as follows, neutral: 99,469; negative: 96,511 and positive: 10,216. As the percentage of positive tweets (5%) is low in comparison to the neutral (48.2%) and negative tweets (46.8%), we merged the neutral and positive tweets into one non-negative group enabling a better visualization on the relationship between the negative and non-negative tweets. This way, we obtained insights into the negativity of COVID-19-related tweets.
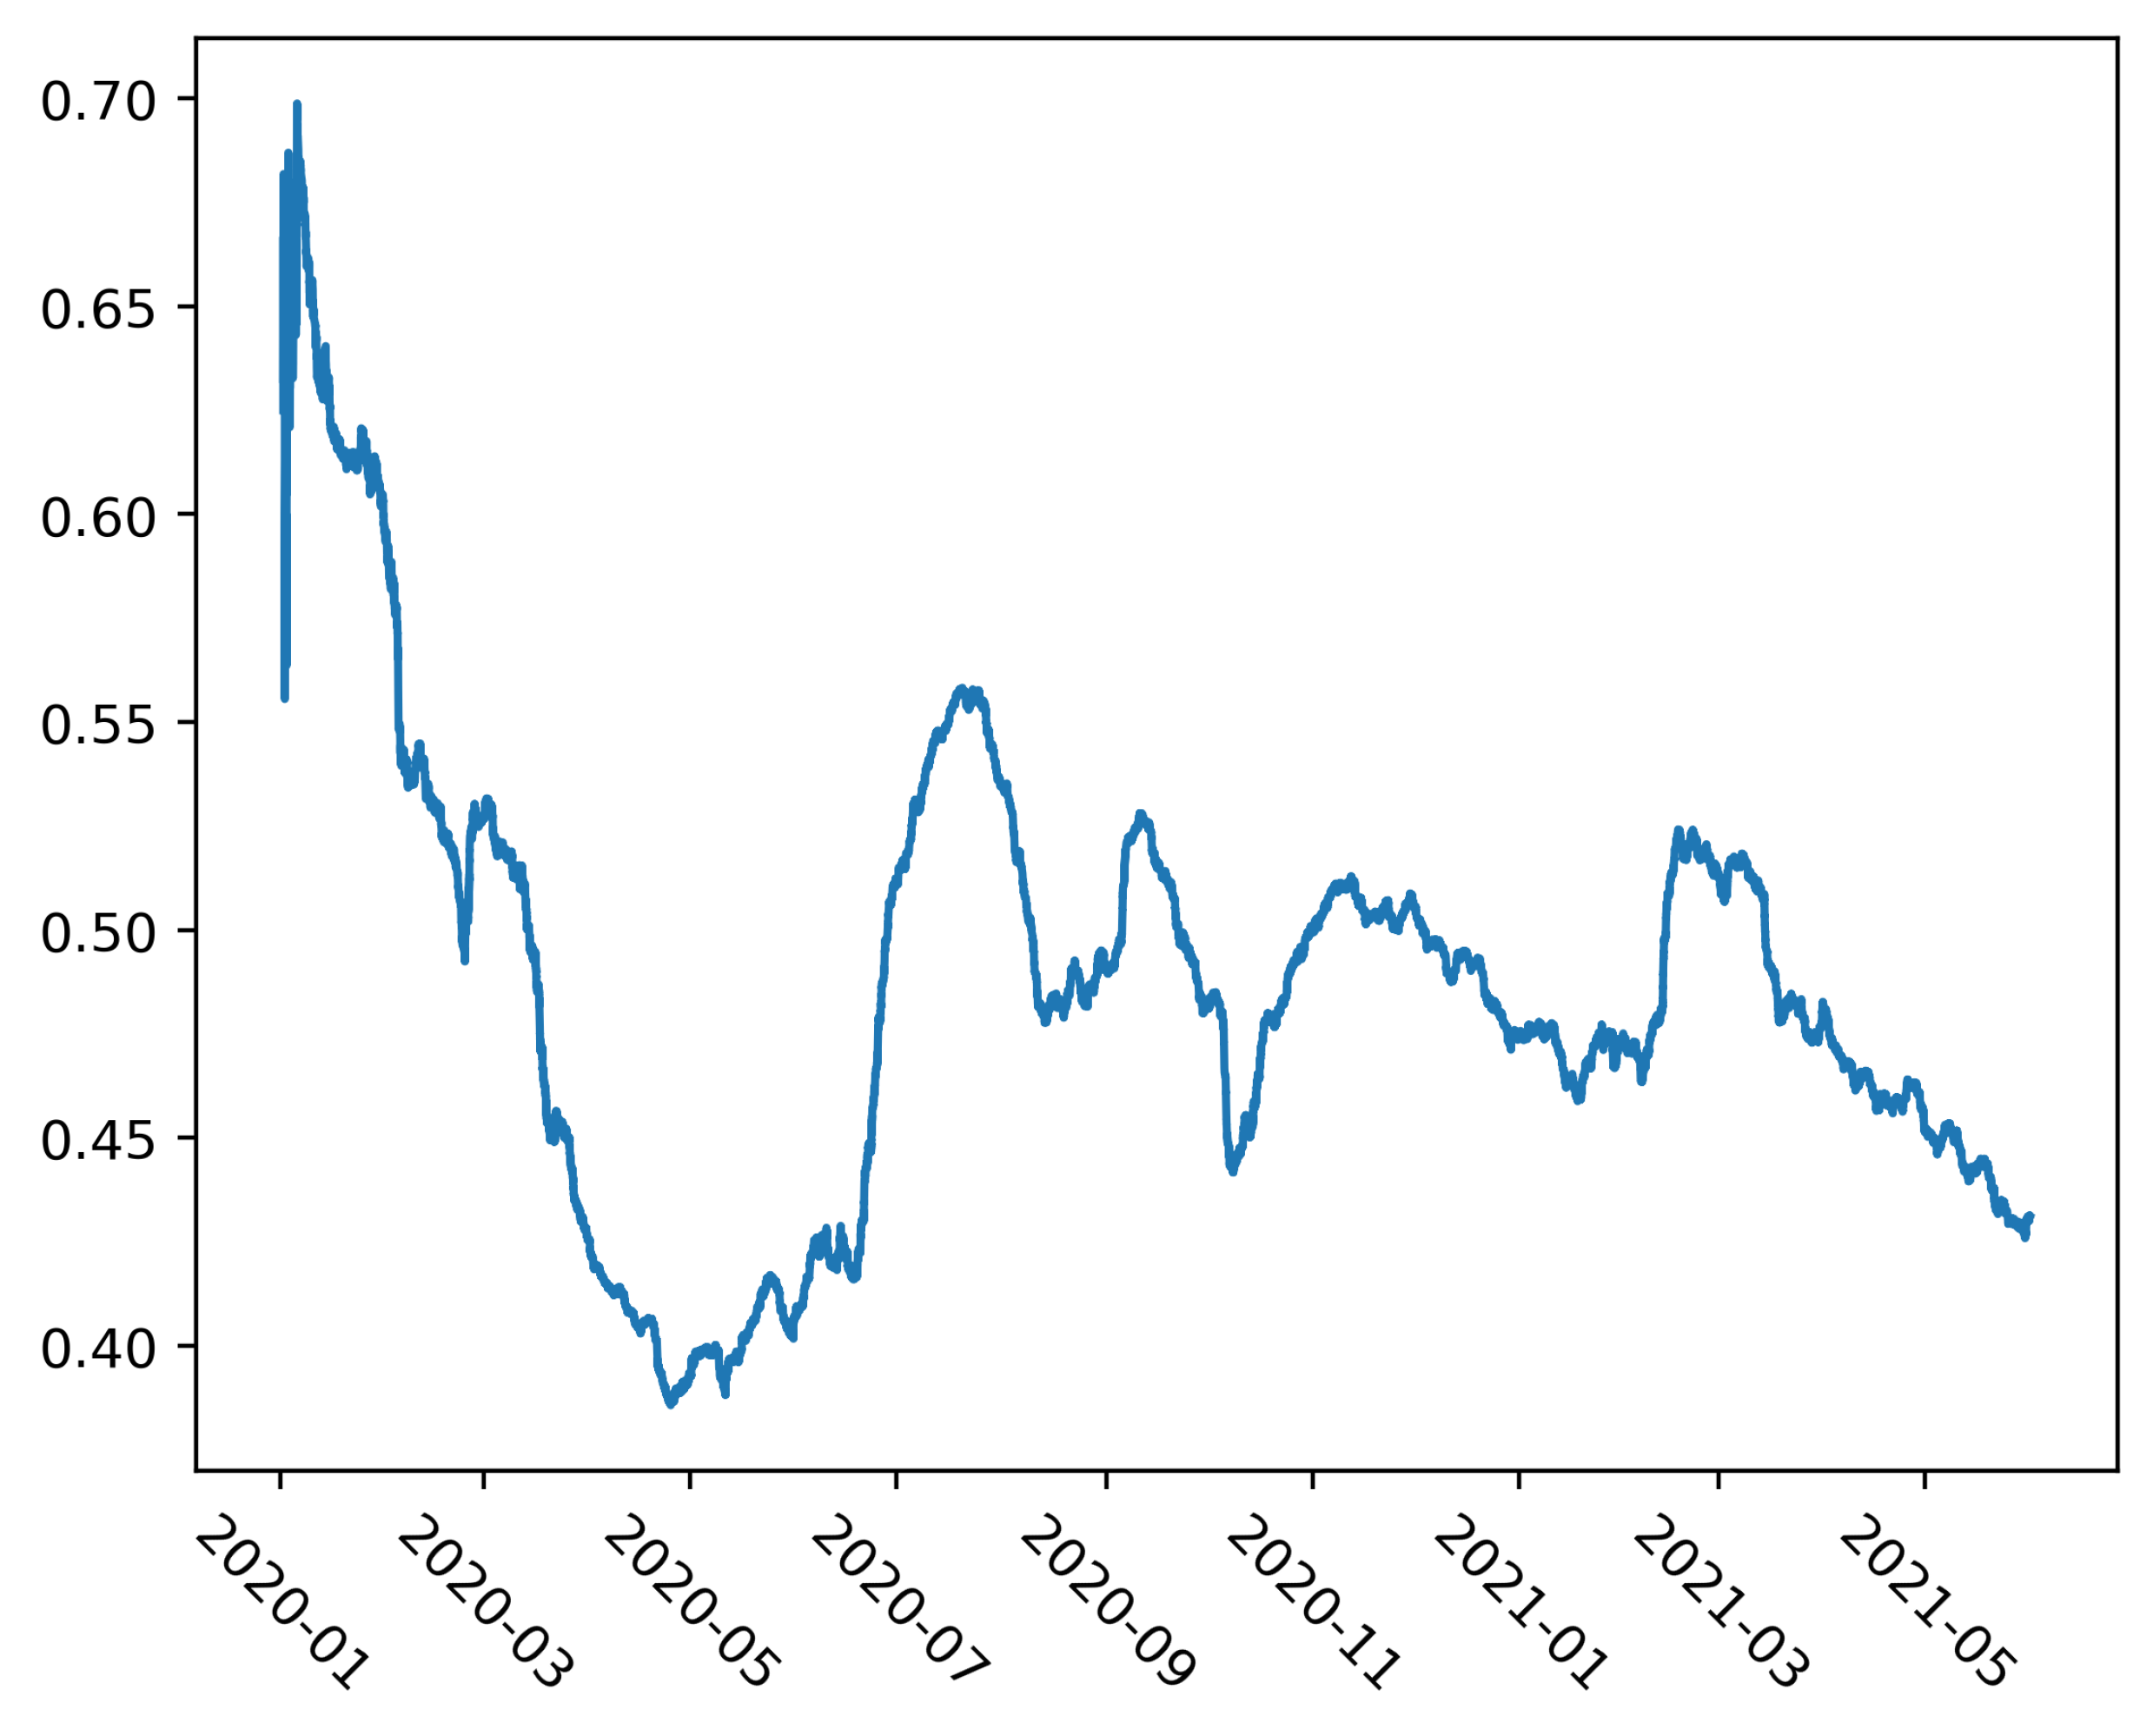
In Figure 3, the sentiment is visualized through time by averaging sentiment over a 30-day sliding window. To calculate the average sentiment, the negative sentiment is treated as 1 and non-negative (neutral and positive) as 0. The higher the value of the sentiment, the more negative it is, hence, we reference it as negativity. In May 2020, the negativity was at its lowest, which coincides with the time when there were almost no new COVID-19 cases and strict lockdown measures were starting to relax. In May 2021, the negativity decreased again as the summer was getting closer and the number of COVID-19 cases was getting lower.

5.2. Analysis and Description of Clusters Related to COVID-19

To answer the second research question (RQ2: What is the number of tweets present in the different thematic clusters related to COVID-19 and how do these trends change over the three pandemic waves?), we clustered the tweets into 10 clusters. Next, we explored the content of clusters by extracting tweets with representations closest to the center of the cluster in the learned representation space. We use the Euclidean distance for the quantification of the distance between representations. Tweets that are grouped together are semantically similar, describing a theme captured in a cluster, as listed in Table 3.
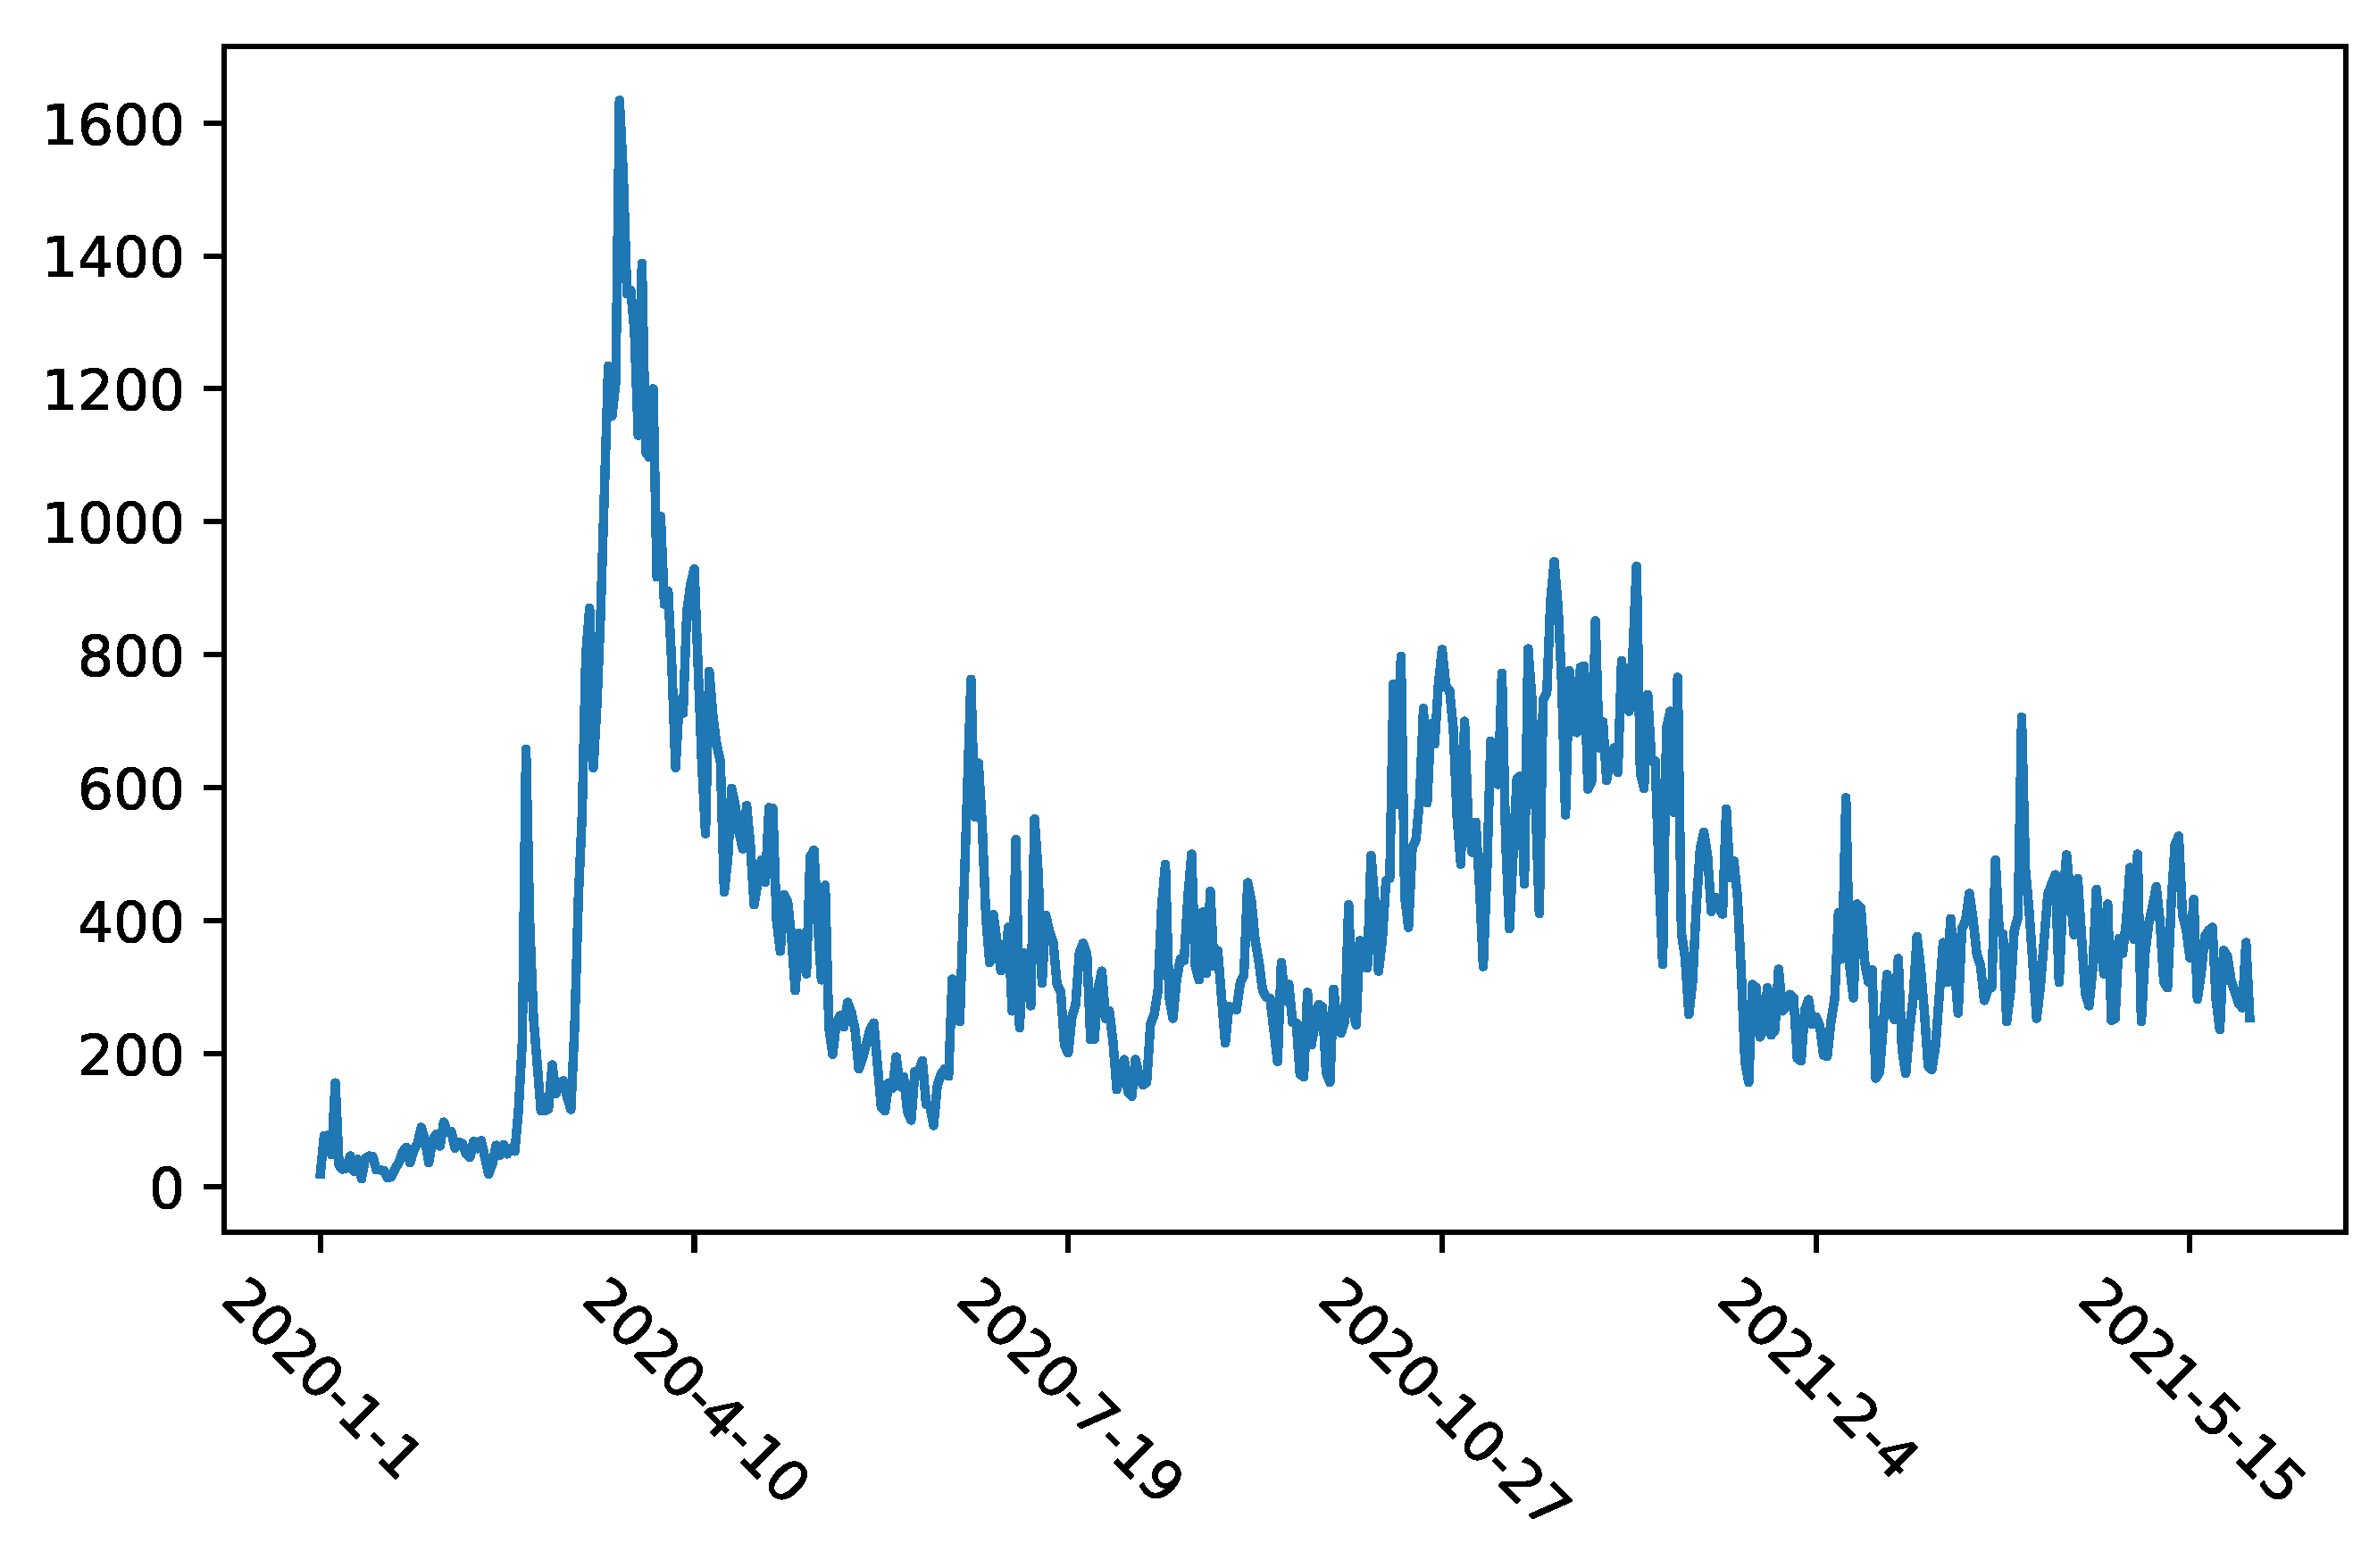
Then, we explored the distribution of tweets across thematic clusters and how these trends were changing during the whole observed period. The results are shown in Figure 4.
According to the results, the highest number of tweets belong to the cluster #4 related to the “Public discussion regarding anti-pandemic policies and vaccines” with 29.63% of tweets in total (cluster #4). It is followed by the clusters with themes related to “Coping with the pandemic” (cluster #2 with 18.37% of tweets in total) and “Public comments on statements of the politicians and scientists” (cluster #6 with 15.10% of tweets in total). The remaining 37% of tweets are distributed across the other 7 identified themes in such a way that there is no cluster with more than 7% of tweets.
When we analyse the trends across the three waves, it seems that the number of tweets belonging to each cluster/theme is relatively constant during all three pandemic waves. The biggest change is present in cluster #2 (“Coping with the pandemic”) which contains 26% of the tweets in the first pandemic wave, while in the next two waves, the percentage is smaller (16.12% in the second wave and 13.41% in the third wave). This can be explained by the fact that this theme was the most interesting in the early stage of the pandemic, while at a later point, the people had already learned how to cope with the pandemic. On the contrary, cluster #6 (“Public comments on statements of the politicians and scientists”) has a higher number of tweets in the second and third wave than in the first wave. It seems that people needed to comment on politicians and scientists more intensely after the first wave.

5.3. Statistics across the Clusters

In the last part of the analysis, we analysed sentiment and retweeting across clusters aiming to answer the third research question (RQ3: What is the distribution of sentiment polarity (in each thematic cluster and over time) and the distribution of retweets (across thematic clusters and sentiment)?).
Sentiment is calculated as the average sentiment in each cluster (i.e., negative sentiment is represented as 1, and the rest is represented as 0, as defined in Section 5.2). Figure 5 shows cluster statistics sorted by the presence of negativity. We report the total number of tweets in each cluster, the average number of retweets of a tweet for each cluster, the percentage of retweets for each cluster, and the negativity across clusters.
According to these results, we determined that the three most negative clusters refer to tweets related to the “Revolt against the COVID-19 policies and behaviour of citizens” (cluster #3 with 0.89 negativity score), “Public discussion regarding anti-pandemic policies and vaccines”, (cluster #4 with 0.804 negativity score) and “Ironic comments of COVID-19” (cluster #8 with 0.673 negativity score). If we take into account the topics, the high amount of negativity is not surprising for clusters #3 and #8. However, it is not the case with cluster #4 which is dedicated to the discussion of anti-pandemic policies and vaccines. In some previous studies of COVID-19 tweets in English related to the vaccination [33,34], the attitudes were far more positive or neutral than negative.
The most non-negative cluster of tweets is “Information about new daily COVID-19 cases” (cluster #7 with negativity score 0.055). The reason is that this cluster contains only tweets about new cases with no subjective messages and these tweets are always classified as neutral. The clusters related to the “Informative facts” (cluster #0 with negativity score 0.113), “Education and implementation of the COVID-19 policies” (cluster #1 with negativity score 0.122) and “Coping with the pandemic” (cluster #2 with negativity score 0.67) are also detected as highly non-negative. This may indicate that there is a degree of optimistic attitudes in tweets related to education, implementation of COVID-19 policies and coping with the pandemic in general.
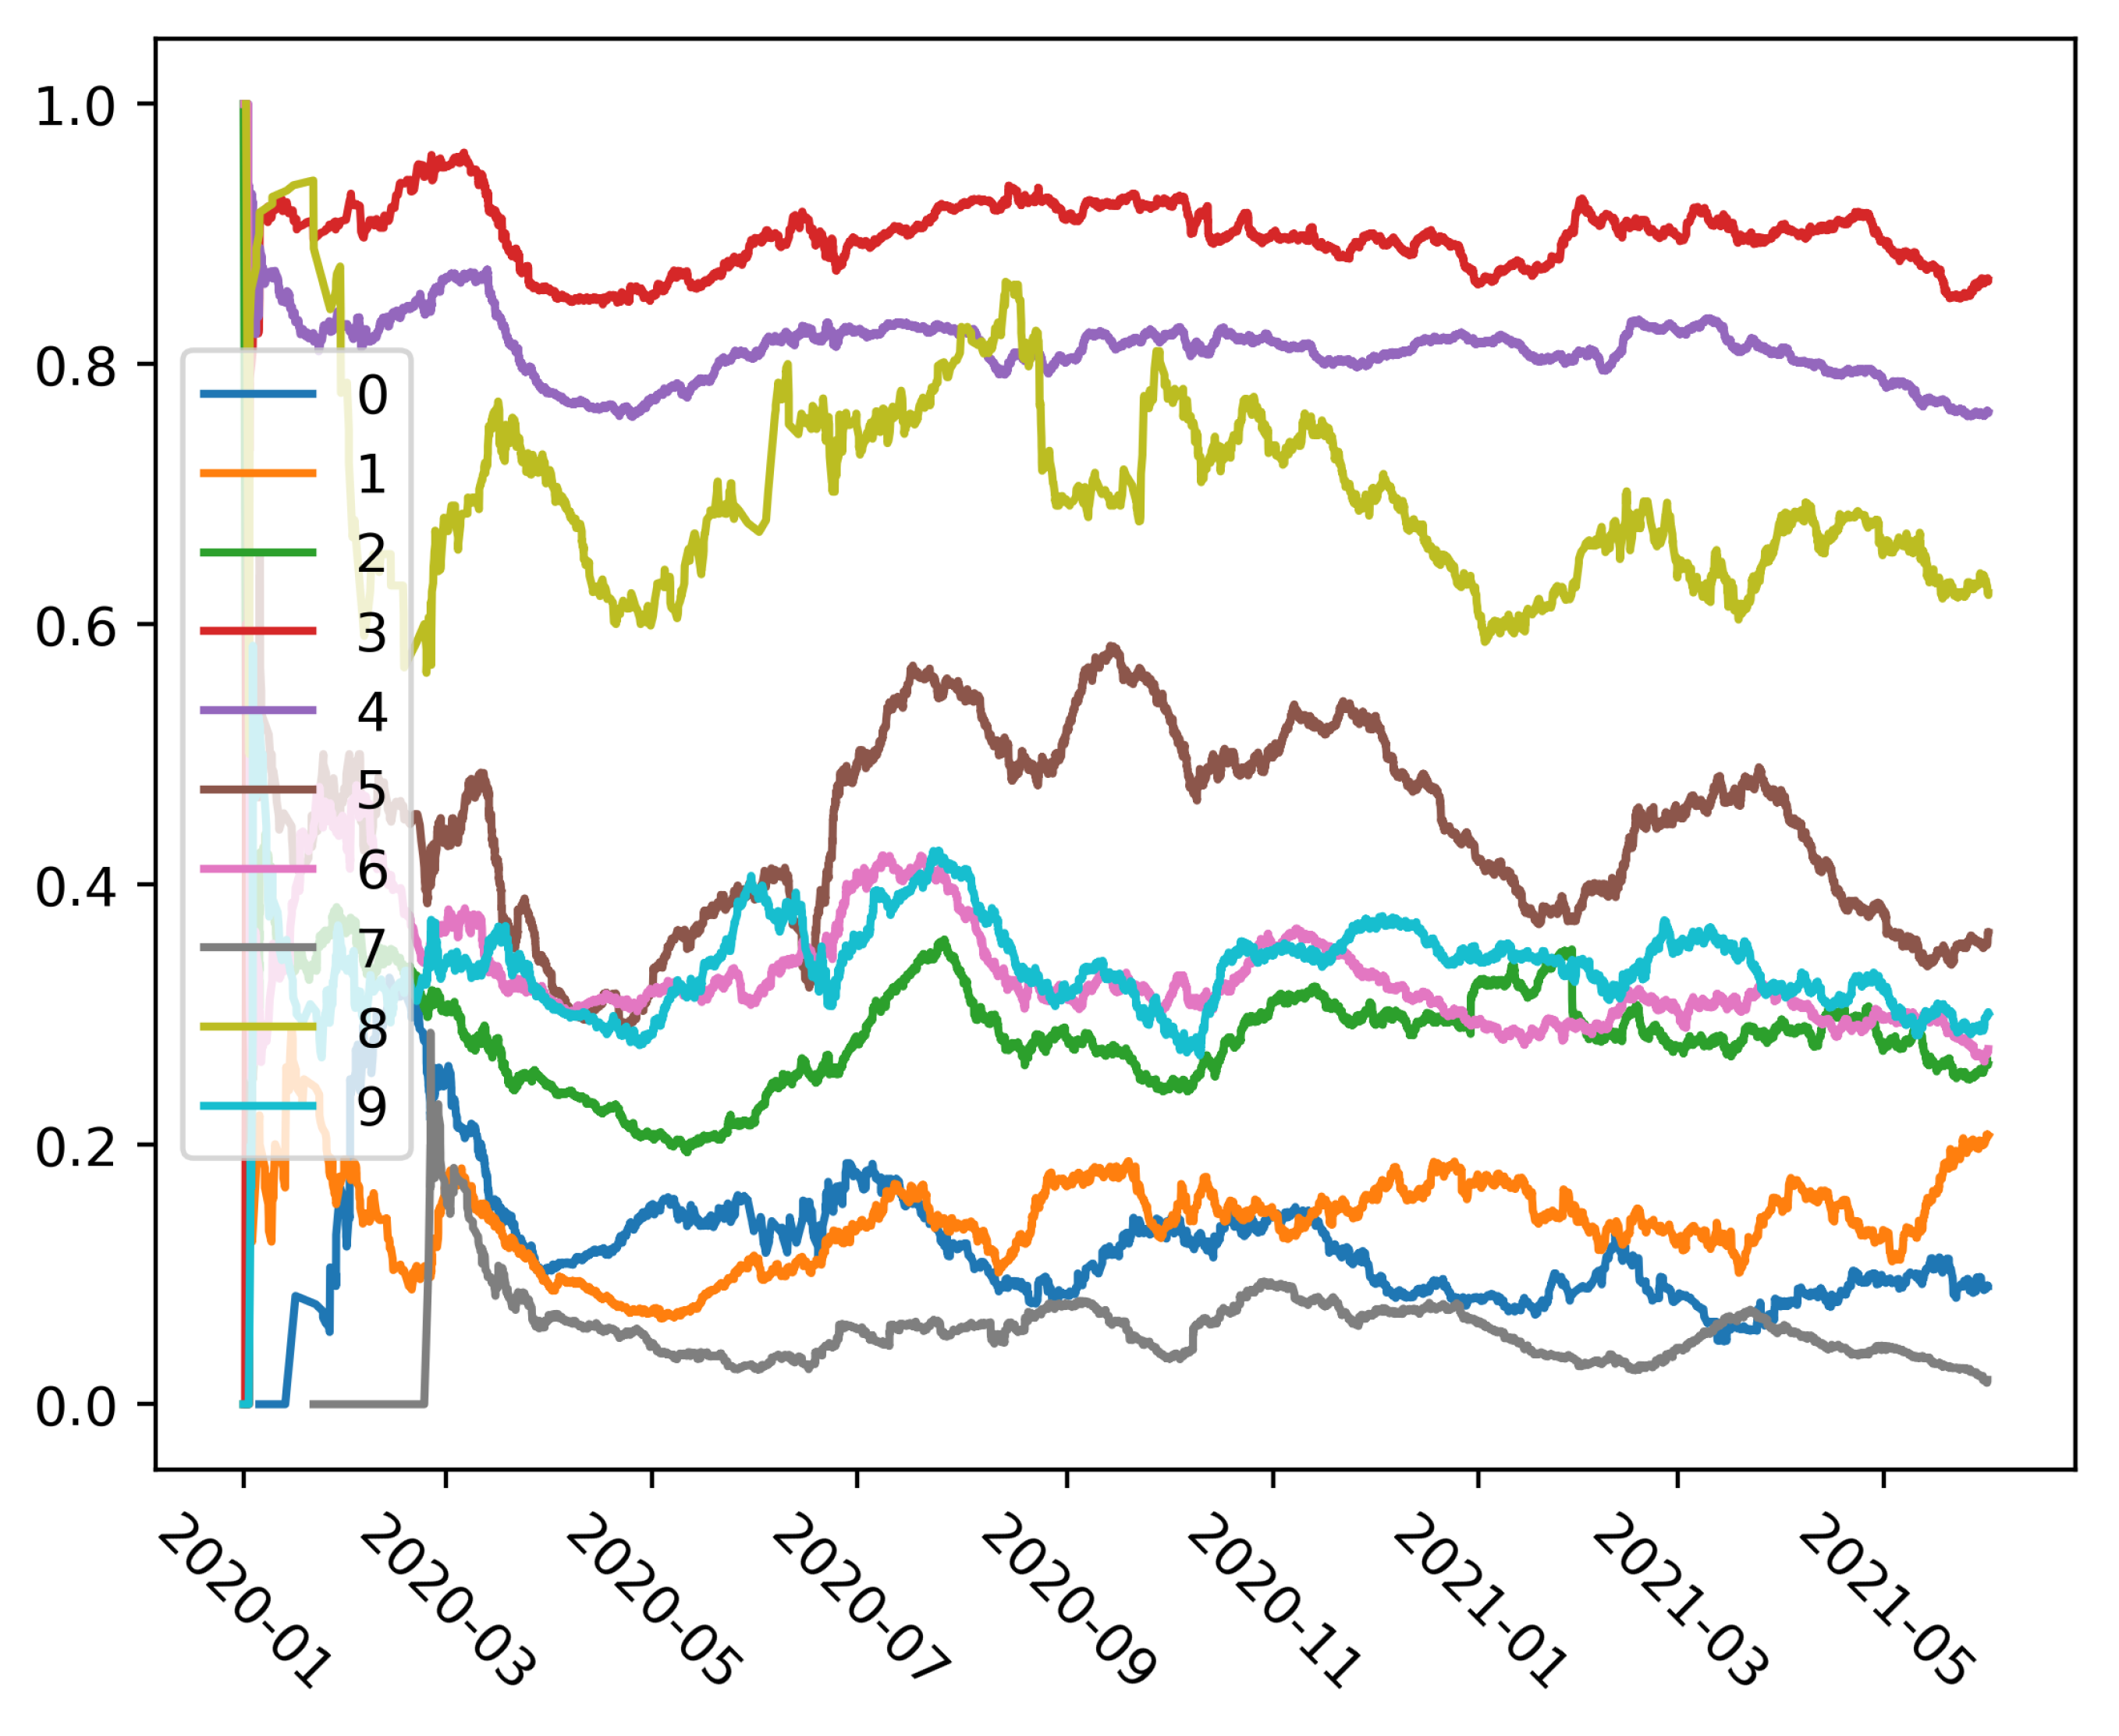
The graph visualised in Figure 6 shows how sentiment of each cluster changes over the observed period. From the graph, it can be seen that the sentiment is uniformly distributed for most of the clusters throughout all three waves. The most negative sentiment is consistently present in clusters #3, #4, while in cluster #8, the negative sentiment is not uniformly distributed. The fluctuations in cluster #8 may be caused by the small number of tweets, since it is the cluster with the smallest number of entries The clusters identified as non-negative (#7, #0 and #1) also show uniform distribution during the three pandemic waves. Sentiment in cluster #5 focused on the “Impact of COVID-19 policies on economy and education” varied over the time, similar as in the cluster #8. Sentiment in this cluster was less negative in the end of the first wave (in May and July of 2020) and, then, it has suddenly increased to negative at the beginning of the second wave (in August of 2020). Later, at the end of the second wave, the negativity is lower again. It seems that the topics related to economy and education are the most prone to changes in accordance to the pandemic waves.
The analysis of sharing these tweets in terms of retweeting shows that the percentage of retweeting is generally low. There is only one cluster with a high average number of retweets. This is the cluster #1 (“Education and implementation of the COVID-19 policies”) which is identified as a highly non-negative cluster with a small amount of tweets (6.31%). The average number of retweets in this cluster is around 20 which is relatively high since there is a low number of retweets in the whole dataset. Except this cluster, the only other clusters with more than 5 retweets on average are the two most negative clusters #3 (“Revolt to the COVID-19 policies and behaviour of citizens”) and #4 (“Public discussion regarding anti-pandemic policies and vaccines”).
In the last step, we analysed and compared the amount of retweeting across clusters. The highest percentage of retweets (more than 34%) is present in cluster #4. This makes sense because this cluster contains the highest number of tweets. Next, clusters #1 and #2 have around 20% of retweets, while tweets in the rest of the clusters contain less than 10% of retweets. Cluster #2 is the one with the highest number of average retweets per one tweet and, thus, it contains a large proportion of retweets as well.
According to the results related to retweeting, it seems that the cluster with the most non-negative sentiment and two clusters with the most negative sentiment have a higher percentage of retweets than the other clusters. Thus, we cannot conclude that retweeting of COVID-19 tweets in the Croatian language goes in favour of negative or non-negative sentiment. Rather, we can only notice that both sentiments are retweeted equally.

6. Discussion

6.1. Principal Results

Principal results of this research can be divided into two parts: (i) the Cro-CoV-cseBERT-based framework developed for the COVID-19 tweets analysis described in Section 3 and Section 4, and (ii) the results of the application of the framework on the dataset of COVID-19 tweets in the Croatian language described in Section 5. The Cro-CoV-cseBERT-based framework is a prerequisite for an extensive analysis of COVID-19 tweets that enables answering the three research questions.
The Cro-CoV-cseBERT-based framework was developed for the task of analysis of COVID-19-related communication on Twitter in Croatia. For that purpose, we developed language resources for the Croatian language intended for the representation and analysis of COVID-19 tweets. Within the proposed framework, we used the existing NLP methods for the task of sentiment analysis and clustering. That is in line with some other similar studies that use similar approaches for other languages [6,7,8,9,10,11]. However, in order to deal with the texts in the Croatian language related to the domain of COVID-19, we have to develop adequate language resources. Thus, in response to other similar studies, this research contributes in terms of (i) Cro-CoV-cseBERT language model, (ii) a dataset of 206,196 unique COVID-19 tweets in the Croatian language posted between 1 January 2020 and 31 May 2021—Cro-CoV-Tweets dataset, and (iii) a dataset of 10,000 tweets annotated manually with one of the three labels describing the sentiment (positive, negative, neutral)—Senti-Cro-CoV-Tweets dataset.
In the second part of the research, we performed an extensive analysis of COVID-19-related tweets in the Croatian language. Specifically, we addressed the three open research questions and our main findings are summarized below.
Regarding the first research question related to sentiment, we found that negative sentiment is present in 46.8% of the COVID-19-related tweets. The negativity of tweets varies substantially over the three pandemic waves. The amount of negative sentiment in tweets is highest during the first wave, during the lockdown period. Later, the higher number of negative tweets is exhibited during August 2020, probably due to the sudden and early end of the tourist season (note that tourism is one of the main economic sectors in Croatia). Again, one negative peak appeared in April 2021 caused by the uncertainty brought about by the third epidemic wave. Less negative tweets are present in May/June 2020 and May 2021 due to the decrease in the number of confirmed COVID-19 cases. These results confirm our previous findings in [29], where we have presented similar results for tweets in Croatian and Polish posted during the first wave of the pandemic. Our findings are also in line with similar studies for other languages which have already revealed that negative attitudes and emotions are dominant in tweets posted during the COVID-19 pandemic, such as [6,7,8,9,11,28].
The second research question is related to the main themes present in the COVID-19 tweets and how these trends change over time. The cluster with the highest number of tweets (29.63%) is associated with the theme “Public discussion regarding anti-pandemic policies and vaccines”. It is followed by the clusters with themes related to “Coping with the pandemic” (18.37%) and “Public comments on statements of the politicians and scientists” (15.10%). The number of tweets in clusters is more consistent over time than sentiment is. Greatest changes are present in the cluster of tweets related to the “Messages on how to cope with the pandemic” that had more tweets in the first than in the second and the third waves. This makes sense because this topic was the focal point when it came to providing important information when the pandemic first started. The cluster related to the theme “Public comments on statements of the politicians and scientists” has a higher number of tweets in the second and third waves than in the first wave. It would seem that people become more and more dissatisfied with the politicians and scientists as the pandemic progresses, which makes sense.
A more detailed analysis of thematic clusters is performed in relation to the third research question which aimed to explore the distribution of negative sentiment and retweets across clusters. The most negative sentiment is present in clusters related to themes “Revolt against the COVID-19 policies and behaviour of citizens” and “Public discussion regarding anti-pandemic policies and vaccines”. These results differ from two related studies that explored sentiment of COVID-19 tweets related to vaccines [33,34] which have revealed that sentiment in the case of vaccination tends to be positive (both in England and USA). Less negative sentiment is present in thematic clusters that tend to be strictly informative, such as the cluster with the theme “Information about new daily COVID-19 cases”. Other two clusters that are positioned as highly non-negative clusters are related to themes “Education and implementation of the COVID-19 policies” and “Coping with the pandemic”. This indicates that possibly optimistic attitudes are present in tweets related to education, implementation of COVID-19 policies and coping with the pandemic in general. The analysis of retweeting conducted in the last step revealed that the highest number of retweets is present in the cluster with the theme “Education and implementation of the COVID-19 policies”. It should be added that retweeting is not a frequent action on Croatian Twitter. Still, in general, we found that negative and non-negative tweets have a similar number of retweets on average.

6.2. Possible Applications of the Results

There are several possible applications of this research.
Outputs of the first phase of the research can be of further use as resources in the domain of NLP tasks focused on the Croatian language. Thus, Cro-CoV-cseBERT can be used in any NLP application with the task of analysis of COVID-19-related texts. The dataset Cro-CoV-Tweets of publicly available tweets can serve as a resource for other similar studies. Next, the dataset Senti-Cro-CoV-Tweets of 10,000 tweets labeled with sentiment is a valuable resource for training and/or evaluation of other supervised models in the task of sentiment analysis.
Furthermore, the analysis and characterisation of tweets during the pandemic provides interesting information about COVID-19 communication on social media. It reveals public opinions and attitudes related to COVID-19 themes, allowing the authorities to address crisis communication problems, such as, for instance, perception of COVID-19 policies, public attitudes towards vaccines or opinions regarding problems related to the economy, etc. All these results will be available through an interactive web application that allows queries over different time periods and provides data visualizations of sentiment, topics, and retweets. This will enable scientists to exploit our results in other scientific fields such as psychology or sociology.
As a study of COVID-19-related communication on Twitter limited to the Croatian language and Croatia, this study may serve as a resource for further comparative research of COVID-19-related communication in different languages. Additionally, the proposed framework can be extended and used for further analysis of tweets posted during the pandemic and post-pandemic periods. In addition to this, similar approaches could be applied to other languages using appropriate language resources.

6.3. Limitations

This research has a few limitations. First, we characterised the social media content related to the COVID-19 pandemic by only taking into account Twitter. However, a large amount of information is present in media which were not covered by this study. For example, Facebook is not included because its policies do not allow data scraping and analysis. Additionally, individuals are also exposed to COVID-19-related information through online news portals and traditional sources. Therefore, to obtain a more realistic picture of media content related to the pandemic, it would be advisable to extend the analysis to all the available sources. Hence, in future work, we plan to extend this study by integrating heterogeneous data sources, such as other social media platforms, online news portals and all the other sources of textual data in social media such as user comments on online news media. The second limitation arises from the fact that automatic classifiers never have one hundred percent accuracy. In the case of sentiment classifier that we have trained, the accuracy is 0.79. That means that around 20% of tweets are not correctly annotated. This is a common drawback of all studies in the domain of NLP. However, the achieved accuracy is sufficient to give an overview of public opinions and attitudes. The third limitation is that this study analysed only texts in the Croatian language and, thus, the results are interesting to a smaller community. As mentioned in previous sections, these results can be of interest for further comparison of COVID-19-related communication on Twitter in different countries. In addition, a similar approach could be applied to any other language and/or country since the entire methodology is portable and only dependent on the available data sources and the maturity of the NLP methods per selected language.

7. Conclusions

In this study, we describe an NLP-based framework for the task of analysis of COVID-19-related communication on the Twitter in Croatia. For that purpose we developed language resources for the Croatian language intended for the representation and analysis of COVID-19 tweets. We applied the proposed framework on a dataset of 206,196 COVID-19 tweets in the Croatian language posted between 1 January 2020 and 31 May 2021 (Cro-CoV-Tweets).
Overall results can be summarized as follows. Negative sentiment is present in 46.8% of the COVID-19-related tweets. The negativity of tweets varies over the three pandemic waves, while the number of tweets across the 10 identified thematic clusters does not substantially vary across the three pandemic waves. The cluster with the highest number of tweets (almost 30%) is “Public discussion regarding anti-pandemic policies and vaccines”, which is also ranked as the second most negative cluster. The most negative cluster is related to the theme “Revolt against the COVID-19 policies and behaviour of citizens”. The highest number of retweets is present in the cluster with the theme “Education and implementation of the COVID-19 policies”, which is ranked as the third most non-negative cluster. In terms of retweeting, we can notice that both sentiments are retweeted to an equal extent.
This research demonstrates the possibilities afforded by the convenience and usefulness of NLP methods which can process a large amount of textual data and provide insights into the sentiment and topics of the observed texts. In this way, natural language processing can complement the achievements of traditional approaches used in research in the domains of humanities and social sciences when it comes to the task of analysing the public opinion and attitudes toward various COVID-19-related themes.
Possible future extensions of this work include further development of the Cro-CoV-cseBERT model in terms of fine-tuning for the supervised task of sentiment analysis (Cro-CoV-cseBERT) and some other experiments in which we plan to combine embeddings from heterogeneous sources (text, metadata and network properties) for tweet representation. Moreover, we plan to use other NLP techniques such as topic modelling and named entity recognition for crisis communication monitoring.
We believe our work contributes to the pursuit of the expanding social media research when it comes to the task of monitoring online communication regarding the COVID-19 pandemic.

Author Contributions

Conceptualization, A.M.; methodology, A.M., K.B., S.M.-I., M.M., S.B., M.P.; software, K.B.; evaluation, K.B.; datasets construction M.P. and S.B.; annotation—first round, M.M., S.B., S.M.-I., M.P., K.B., A.M.; annotation—supervision, M.M.; visualization, M.P. and K.B.; interpretation, A.M., K.B., S.M.-I., M.M., S.B., M.P.; writing—original draft, A.M., K.B., M.P.; writing—review and editing A.M., S.M.-I., M.M., S.B. supervision, A.M.; funding acquisition, A.M. All authors have read and agreed to the published version of the manuscript.

Funding

This work has been supported in part by the Croatian Science Foundation under the project IP-CORONA-04-2061, “Multilayer Framework for the Information Spreading Characterization in Social Media during the COVID-19 Crisis” (InfoCoV), and by University of Rijeka project number uniri-drustv-18-38.

Data Availability Statement

The Croatian Twitter dataset related to COVID-19 topics, Cro-CoV-Tweets, and the Croatian Twitter dataset with sentiment annotations, Senti-Cro-CoV-Tweets, are available on GitHub https://github.com/InfoCoV/InfoCoV. The Cro-CoV-cseBERT model is available on Hugging Face https://huggingface.co/InfoCoV/Cro-CoV-cseBERT. All data are available under the Creative Commons license (CC-BY-NC-ND) (http://hdl.handle.net/11356/1342).

Acknowledgments

We would like to thank Velebit AI, especially Mladen Fernežir for leading the implementation of the Cro-CoV-cseBERT model.

Conflicts of Interest

The authors declare no conflict of interest.

Sample Availability

Samples of the compounds are available from the authors.

Abbreviations

The following abbreviations are used in this manuscript:
BERTBidirectional Encoder Representations from Transformers
LSTMLong Short Memory Transducer
NLPNatural Language Processing
MLMachine Learning
TF-IDFTerm Frequency-Inverse document Frequency

Appendix A. Dataset Description

keywords = [‘koron’, ‘virus’, ’covid’, ’kovid’, ’karant’, ’izolac’, ’ostanidoma’, ’ostanimodoma’, ’slusajstruku’, ’slušajstruku’, ’ostanimoodgovorni’, ’coron’, ’sarscov2’, ’sars’ ’cov2’, ’ncov’, ’vizir’, ’lockd’, ’simpto’, ’pfizer’, ’moderna’, ’astrazeneca’, ’sputnik’, ’cjep’, ’cijep’ ’samoizola’, ’viro’, ’zaraž’, ’zaraz’, ’respir’, ’testira’, ’obolje’, ’nuspoj’, ’capak’, ’beroš’, ’beros’ ’markoti’, ’alemka’, ’pandem’, ’epide’, "ljekov", ’propusnic’, ’stožer’, ’stozer’, "medicin", ’hzjz’, ’antigensk’, ’festivala slobode’, ’dezinf’, ’infekc’, ’inkubacij’, ’mask’, ’bolnic’, ’n95’, ’doktor’, ’terapij’, ’patoge’, ’dijagnost’, ’distanc’]
Figure A1. Statistics of the Cro-CoV-Tweets dataset showing various distributions across the observed time period (1 January 2020–31 May 2021): frequencies of tweets per week (a), frequencies of tweets per month (b), frequencies of tweets per week and hour (c), frequencies of tweets across time of the day (d), frequencies of tweets per user (e), frequencies of words in tweets (f).
Applsci 11 10442 g0a1aApplsci 11 10442 g0a1b

Appendix B. Evaluations

The subsections bellow contain the evaluations for Cro-CoV-cseBERT and FastText. In each table (for each machine learning algorithm), we show precision, recall, and F1-score for each of the three classes. It can be seen from the tables that the positive class has the poorest results. The classification of positive tweets is the worst because of the low number of positive tweets in the training dataset.

Appendix B.1. Cro-CoV-cseBERT

Table A1. Naïve Bayes evaluation.
ClassPrecisionRecallF1-Score
Neutral0.830.690.75
Negative0.760.750.76
Positive0.140.500.21
Table A2. Random Forest evaluation.
ClassPrecisionRecallF1-Score
Neutral0.800.770.79
Negative0.740.820.78
Positive000
Table A3. Support Vector Machine evaluation.
ClassPrecisionRecallF1-Score
Neutral0.810.790.80
Negative0.760.830.79
Positive000
Table A4. Multilayer Perceptron evaluation.
ClassPrecisionRecallF1-Score
Neutral0.840.770.80
Negative0.770.840.81
Positive0.370.380.38

Appendix B.2. FastText

Table A5. Naïve Bayes evaluation.
ClassPrecisionRecallF1-Score
Neutral0.810.690.74
Negative0.720.770.74
Positive0.110.280.16
Table A6. Random Forest evaluation.
ClassPrecisionRecallF1-Score
Neutral0.760.780.77
Negative0.730.760.74
Positive0.000.000.00
Table A7. Support Vector Machine evaluation.
ClassPrecisionRecallF1-Score
Neutral0.780.740.76
Negative0.710.800.75
Positive0.000.000.00
Table A8. Multilayer Perceptron evaluation.
ClassPrecisionRecallF1-Score
Neutral0.790.770.78
Negative0.750.790.77
Positive0.250.180.21

References

  1. Glik, D.C. Risk communication for public health emergencies. Annu. Rev. Public Health 2007, 28, 33–54. [Google Scholar] [CrossRef]
  2. Cuello-Garcia, C.; Pérez-Gaxiola, G.; van Amelsvoort, L. Social media can have an impact on how we manage and investigate the COVID-19 pandemic. J. Clin. Epidemiol. 2020, 127, 198. [Google Scholar] [CrossRef] [PubMed]
  3. Eysenbach, G. Infodemiology: The epidemiology of (mis) information. Am. J. Med. 2002, 113, 763–765. [Google Scholar] [CrossRef]
  4. Zhou, L.; Pan, S.; Wang, J.; Vasilakos, A.V. Machine learning on big data: Opportunities and challenges. Neurocomputing 2017, 237, 350–361. [Google Scholar] [CrossRef] [Green Version]
  5. Wang, T.; Lu, K.; Chow, K.P.; Zhu, Q. COVID-19 sensing: Negative sentiment analysis on social media in China via BERT model. IEEE Access 2020, 8, 138162–138169. [Google Scholar] [CrossRef]
  6. Xue, J.; Chen, J.; Chen, C.; Zheng, C.; Li, S.; Zhu, T. Public discourse and sentiment during the COVID 19 pandemic: Using Latent Dirichlet Allocation for topic modeling on Twitter. PLoS ONE 2020, 15, e0239441. [Google Scholar] [CrossRef] [PubMed]
  7. Xue, J.; Chen, J.; Hu, R.; Chen, C.; Zheng, C.; Su, Y.; Zhu, T. Twitter discussions and emotions about the COVID-19 pandemic: Machine learning approach. J. Med. Internet Res. 2020, 22, e20550. [Google Scholar] [CrossRef] [PubMed]
  8. Lwin, M.O.; Lu, J.; Sheldenkar, A.; Schulz, P.J.; Shin, W.; Gupta, R.; Yang, Y. Global sentiments surrounding the COVID-19 pandemic on Twitter: Analysis of Twitter trends. JMIR Public Health Surveill. 2020, 6, e19447. [Google Scholar] [CrossRef]
  9. Chandrasekaran, R.; Mehta, V.; Valkunde, T.; Moustakas, E. Topics, trends, and sentiments of tweets about the COVID-19 pandemic: Temporal infoveillance study. J. Med. Internet Res. 2020, 22, e22624. [Google Scholar] [CrossRef] [PubMed]
  10. Abd-Alrazaq, A.; Alhuwail, D.; Househ, M.; Hamdi, M.; Shah, Z. Top concerns of tweeters during the COVID-19 pandemic: Infoveillance study. J. Med. Internet Res. 2020, 22, e19016. [Google Scholar] [CrossRef] [Green Version]
  11. de Melo, T.; Figueiredo, C.M. Comparing News articles and tweets about COVID-19 in Brazil: Sentiment analysis and topic modeling approach. JMIR Public Health Surveill. 2021, 7, e24585. [Google Scholar] [CrossRef] [PubMed]
  12. Ilyas, H.; Anwar, A.; Yaqub, U.; Alzamil, Z.; Appelbaum, D. Analysis and visualization of COVID-19 discourse on Twitter using data science: A case study of the USA, the UK and India. Glob. Knowl. Mem. Commun. 2021. Available online: https://www.emerald.com/insight/content/doi/10.1108/GKMC-01-2021-0006/full/html (accessed on 25 October 2021).
  13. Probierz, E.; Galuszka, A.; Dzida, T. Twitter Text Data from# Covid-19: Analysis of Changes in Time Using Exploratory Sentiment Analysis. In Journal of Physics: Conference Series; IOP Publishing: Beijing, China, 2021; Volume 1828, p. 012138. [Google Scholar]
  14. Kydros, D.; Argyropoulou, M.; Vrana, V. A Content and Sentiment Analysis of Greek Tweets during the Pandemic. Sustainability 2021, 13, 6150. [Google Scholar] [CrossRef]
  15. De Santis, E.; Martino, A.; Rizzi, A. An infoveillance system for detecting and tracking relevant topics from Italian tweets during the COVID-19 event. IEEE Access 2020, 8, 132527–132538. [Google Scholar] [CrossRef]
  16. Devlin, J.; Chang, M.W.; Lee, K.; Toutanova, K. Bert: Pre-training of deep bidirectional transformers for language understanding. arXiv 2018, arXiv:1810.04805. [Google Scholar]
  17. Pires, T.; Schlinger, E.; Garrette, D. How multilingual is multilingual BERT? arXiv 2019, arXiv:1906.01502. [Google Scholar]
  18. Conneau, A.; Khandelwal, K.; Goyal, N.; Chaudhary, V.; Wenzek, G.; Guzmán, F.; Grave, E.; Ott, M.; Zettlemoyer, L.; Stoyanov, V. Unsupervised cross-lingual representation learning at scale. arXiv 2019, arXiv:1911.02116. [Google Scholar]
  19. Virtanen, A.; Kanerva, J.; Ilo, R.; Luoma, J.; Luotolahti, J.; Salakoski, T.; Ginter, F.; Pyysalo, S. Multilingual is not enough: BERT for Finnish. arXiv 2019, arXiv:1912.07076. [Google Scholar]
  20. Martin, L.; Muller, B.; Suárez, P.J.O.; Dupont, Y.; Romary, L.; de La Clergerie, É.V.; Seddah, D.; Sagot, B. Camembert: A tasty french language model. arXiv 2019, arXiv:1911.03894. [Google Scholar]
  21. Ulčar, M.; Robnik-Šikonja, M. FinEst BERT and CroSloEngual BERT. In International Conference on Text, Speech, and Dialogue; Springer: Brno, Czech Republic, 2020; pp. 104–111. [Google Scholar]
  22. Cinelli, M.; Quattrociocchi, W.; Galeazzi, A.; Valensise, C.M.; Brugnoli, E.; Schmidt, A.L.; Zola, P.; Zollo, F.; Scala, A. The COVID-19 social media infodemic. Sci. Rep. 2020, 1, 1–10. [Google Scholar] [CrossRef] [PubMed]
  23. Park, H.W.; Park, S.; Chong, M. Conversations and medical news frames on twitter: Infodemiological study on covid-19 in south korea. J. Med. Internet Res. 2020, 22, e18897. [Google Scholar] [CrossRef] [PubMed]
  24. Cuomo, R.E.; Purushothaman, V.; Li, J.; Cai, M.; Mackey, T.K. Sub-national longitudinal and geospatial analysis of COVID-19 tweets. PLoS ONE 2020, 15, e0241330. [Google Scholar] [CrossRef]
  25. Lopez, C.E.; Vasu, M.; Gallemore, C. Understanding the perception of COVID-19 policies by mining a multilanguage Twitter dataset. arXiv 2020, arXiv:2003.10359. [Google Scholar]
  26. Bunker, D. Who do you trust? The digital destruction of shared situational awareness and the COVID-19 infodemic. Int. J. Inf. Manag. 2020, 55, 102201. [Google Scholar] [CrossRef]
  27. Pulido, C.M.; Villarejo-Carballido, B.; Redondo-Sama, G.; Gomez, A. COVID-19 infodemic: More retweets for science-based information on coronavirus than for false information. Int. Sociol. 2020, 35, 377–392. [Google Scholar] [CrossRef] [Green Version]
  28. Samuel, J.; Ali, G.; Rahman, M.; Esawi, E.; Samuel, Y.; others. Covid-19 public sentiment insights and machine learning for tweets classification. Information 2020, 11, 314. [Google Scholar] [CrossRef]
  29. Babić, K.; Petrović, M.; Beliga, S.; Martinčić-Ipšić, S.; Jarynowski, A.; Meštrović, A. COVID-19-Related Communication on Twitter: Analysis of the Croatian and Polish Attitudes. In Proceedings of Sixth International Congress on Information and Communication Technology; Springer: Singapore, 2022; pp. 379–390. [Google Scholar]
  30. Bogović, P.K.; Beliga, S.; Martinčić-Ipšić, S.; Meštrović, A. Topic Modelling of Croatian News during COVID-19 Pandemic. In Proceedings of the 2021 44th International Convention on Information and Communication Technology, Electronics and Microelectronics (MIPRO), Opatija, Croatia, 26–30 May 2021; pp. 1205–1212. [Google Scholar]
  31. Babić, K.; Petrović, M.; Beliga, S.; Martinčić-Ipšić, S.; Pranjić, M.; Meštrović, A. Prediction of COVID-19 Related Information Spreading on Twitter. In Proceedings of the 2021 44th International Convention on Information and Communication Technology, Electronics and Microelectronics (MIPRO), Opatija, Croatia, 26–30 May 2021; pp. 424–428. [Google Scholar]
  32. Ilić, A.; Beliga, S. The Polarity of Croatian Online News Related to COVID-19: A First Insight. In Proceedings of the 32nd Central European Conference on Information and Intelligent Systems (CECIIS), Varaždin, Croatia, 13–15 October 2021. in press. [Google Scholar]
  33. Sattar, N.S.; Arifuzzaman, S. COVID-19 Vaccination Awareness and Aftermath: Public Sentiment Analysis on Twitter Data and Vaccinated Population Prediction in the USA. Appl. Sci. 2021, 11, 6128. [Google Scholar] [CrossRef]
  34. Hussain, A.; Tahir, A.; Hussain, Z.; Sheikh, Z.; Gogate, M.; Dashtipour, K.; Ali, A.; Sheikh, A. Artificial intelligence–enabled analysis of public attitudes on facebook and twitter toward covid-19 vaccines in the united kingdom and the united states: Observational study. J. Med. Internet Res. 2021, 23, e26627. [Google Scholar] [CrossRef] [PubMed]
  35. Mujahid, M.; Lee, E.; Rustam, F.; Washington, P.B.; Ullah, S.; Reshi, A.A.; Ashraf, I. Sentiment Analysis and Topic Modeling on Tweets about Online Education during COVID-19. Appl. Sci. 2021, 11, 8438. [Google Scholar] [CrossRef]
  36. Bhagat, K.K.; Mishra, S.; Dixit, A.; Chang, C.Y. Public Opinions about Online Learning during COVID-19: A Sentiment Analysis Approach. Sustainability 2021, 13, 3346. [Google Scholar] [CrossRef]
  37. Rustam, F.; Khalid, M.; Aslam, W.; Rupapara, V.; Mehmood, A.; Choi, G.S. A performance comparison of supervised machine learning models for Covid-19 tweets sentiment analysis. PLoS ONE 2021, 16, e0245909. [Google Scholar] [CrossRef]
  38. Kolchyna, O.; Souza, T.T.; Treleaven, P.; Aste, T. Twitter sentiment analysis: Lexicon method, machine learning method and their combination. arXiv 2015, arXiv:1507.00955. [Google Scholar]
  39. Mikolov, T.; Sutskever, I.; Chen, K.; Corrado, G.S.; Dean, J. Distributed representations of words and phrases and their compositionality. In Advances in Neural Information Processing Systems; Curran Associates: Red Hook, NY, USA, 2013; pp. 3111–3119. [Google Scholar]
  40. Le, Q.; Mikolov, T. Distributed representations of sentences and documents. In Proceedings of the International Conference on Machine Learning, Beijing, China, 21–26 June 2014; pp. 1188–1196. [Google Scholar]
  41. Pennington, J.; Socher, R.; Manning, C.D. Glove: Global vectors for word representation. In Proceedings of the 2014 Conference on Empirical Methods in Natural Language Processing (EMNLP), Doha, Qatar, 25–29 October 2014; pp. 1532–1543. [Google Scholar]
  42. Bojanowski, P.; Grave, E.; Joulin, A.; Mikolov, T. Enriching word vectors with subword information. Trans. Assoc. Comput. Linguist. 2017, 5, 135–146. [Google Scholar] [CrossRef] [Green Version]
  43. Polignano, M.; Basile, P.; de Gemmis, M.; Semeraro, G. A comparison of word-embeddings in emotion detection from text using bilstm, cnn and self-attention. In Proceedings of the Adjunct Publication of the 27th Conference on User Modeling, Adaptation and Personalization, Larnaca, Cyprus, 9–12 June 2019; pp. 63–68. [Google Scholar]
  44. Peters, M.E.; Neumann, M.; Iyyer, M.; Gardner, M.; Clark, C.; Lee, K.; Zettlemoyer, L. Deep contextualized word representations. arXiv 2018, arXiv:1802.05365. [Google Scholar]
  45. Radford, A.; Wu, J.; Child, R.; Luan, D.; Amodei, D.; Sutskever, I.; others. Language models are unsupervised multitask learners. OpenAI Blog 2019, 1, 9. [Google Scholar]
  46. Brown, T.B.; Mann, B.; Ryder, N.; Subbiah, M.; Kaplan, J.; Dhariwal, P.; Neelakantan, A.; Shyam, P.; Sastry, G.; Askell, A.; et al. Language models are few-shot learners. arXiv 2020, arXiv:2005.14165. [Google Scholar]
  47. Ethayarajh, K. How contextual are contextualized word representations? comparing the geometry of BERT, ELMo, and GPT-2 embeddings. arXiv 2019, arXiv:1909.00512. [Google Scholar]
  48. Babić, K.; Martinčić-Ipšić, S.; Meštrović, A. Survey of Neural Text Representation Models. Information 2020, 11, 511. [Google Scholar] [CrossRef]
  49. Pota, M.; Ventura, M.; Catelli, R.; Esposito, M. An effective BERT-based pipeline for Twitter sentiment analysis: A case study in Italian. Sensors 2021, 21, 133. [Google Scholar] [CrossRef] [PubMed]
  50. Polignano, M.; Basile, P.; De Gemmis, M.; Semeraro, G.; Basile, V. Alberto: Italian BERT language understanding model for NLP challenging tasks based on tweets. In Proceedings of the 6th Italian Conference on Computational Linguistics, CLiC-it 2019, Bari, Italy, 13–15 November 2019; Volume 2481, pp. 1–6. [Google Scholar]
  51. Chintalapudi, N.; Battineni, G.; Amenta, F. Sentimental Analysis of COVID-19 Tweets Using Deep Learning Models. Infect. Dis. Rep. 2021, 13, 329–339. [Google Scholar] [CrossRef]
  52. Gencoglu, O. Large-scale, language-agnostic discourse classification of tweets during COVID-19. Mach. Learn. Knowl. Extr. 2020, 2, 603–616. [Google Scholar] [CrossRef]
  53. Alzubi, J.A.; Jain, R.; Singh, A.; Parwekar, P.; Gupta, M. COBERT: COVID-19 Question Answering System Using BERT. Arab. J. Sci. Eng. 2021, 1–11. [Google Scholar]
  54. Alkhalifa, R.; Yoong, T.; Kochkina, E.; Zubiaga, A.; Liakata, M. QMUL-SDS at CheckThat! 2020: Determining COVID-19 tweet check-worthiness using an enhanced CT-BERT with numeric expressions. arXiv 2020, arXiv:2008.13160. [Google Scholar]
  55. Kieuvongngam, V.; Tan, B.; Niu, Y. Automatic text summarization of covid-19 medical research articles using bert and gpt-2. arXiv 2020, arXiv:2006.01997. [Google Scholar]
  56. Guo, X.; Mirzaalian, H.; Sabir, E.; Jaiswal, A.; Abd-Almageed, W. Cord19sts: Covid-19 semantic textual similarity dataset. arXiv 2020, arXiv:2007.02461. [Google Scholar]
  57. Roesslein, J. Tweepy Documentation. 2009, Volume 5. Available online: http://tweepy.readthedocs.io/ (accessed on 1 July 2021).
  58. Landis, J.R.; Koch, G.G. The measurement of observer agreement for categorical data. Biometrics 1977, 33, 159–174. [Google Scholar] [CrossRef] [PubMed] [Green Version]
  59. Müller, M.; Salathé, M.; Kummervold, P.E. Covid-twitter-bert: A natural language processing model to analyse covid-19 content on twitter. arXiv 2020, arXiv:2005.07503. [Google Scholar]
  60. Fine-Tuning a BERT Model (MLM)Permalink. Available online: https://simpletransformers.ai/docs/lm-minimal-start/#fine-tuning-a-bert-model-mlm (accessed on 1 June 2021).
  61. Ljubešić, N.; Dobrovoljc, K. What does Neural Bring? Analysing Improvements in Morphosyntactic Annotation and Lemmatisation of Slovenian, Croatian and Serbian. In Proceedings of the 7th Workshop on Balto-Slavic Natural Language Processing; Association for Computational Linguistics: Florence, Italy, 2019; pp. 29–34. [Google Scholar] [CrossRef] [Green Version]
  62. Reimers, N.; Gurevych, I. Sentence-BERT: Sentence Embeddings using Siamese BERT-Networks. In Proceedings of the 2019 Conference on Empirical Methods in Natural Language Processing; Association for Computational Linguistics: Florence, Italy, 2019. [Google Scholar]
  63. Ljubešić, N. Word Embeddings CLARIN.SI-embed.hr 1.0. 2018. Slovenian Language Resource Repository CLARIN.SI. Available online: https://www.clarin.si/repository/xmlui/handle/11356/1205 (accessed on 1 June 2021).
  64. Pedregosa, F.; Varoquaux, G.; Gramfort, A.; Michel, V.; Thirion, B.; Grisel, O.; Blondel, M.; Prettenhofer, P.; Weiss, R.; Dubourg, V.; et al. Scikit-learn: Machine Learning in Python. J. Mach. Learn. Res. 2011, 12, 2825–2830. [Google Scholar]
Figure 1. Frequency of COVID-19-related tweets during the three pandemic waves.
Applsci 11 10442 g001
Figure 2. The sequential workflow of the methodology.
Applsci 11 10442 g002
Figure 3. Sentiment (negativity) through time with a sliding window of 30 days. Positive direction on the y-axis represents negative sentiment.
Applsci 11 10442 g003
Figure 4. Percentage of tweets in the 10 clusters during 4 different time periods: chart A shows the overall tweet count percentages by cluster, chart B covers the first wave of the COVID-19 pandemic (1 January 2020–15 May 2020), chart C covers the second wave (16 May 2020–25 February 2021), and chart D covers the third wave (26 February 2021–31 May 2021).
Applsci 11 10442 g004
Figure 5. Number of tweets (count), average retweet count, retweet count percentage, and average sentiment (negativity) by cluster. Ordered by the average sentiment where the negative class is 1, and the neutral and positive are 0.
Applsci 11 10442 g005
Figure 6. Sentiment (negativity) by clusters through time with a sliding window of 30 days. Positive direction on the y-axis represents negative sentiment.
Applsci 11 10442 g006
Table 1. Evaluations with Cro-CoV-cseBERT embeddings in terms of precision, recall, and F1-score calculated as macro averages (the complete results are in Appendix B.1).
MethodPrecisionRecallF1-ScoreAccuracy
Naïve Bayes0.570.650.570.71
Random Forest0.510.530.520.77
Support Vector Machine0.520.540.530.78
Multilayer Perceptron0.660.670.660.79
Table 2. Baseline evaluations with fastText embeddings in terms of precision, recall, and F1-score calculated as macro averages (the complete results are in Appendix B.2).
MethodPrecisionRecallF1-ScoreAccuracy
Naïve Bayes0.550.580.550.71
Random Forest0.500.510.500.75
Support Vector Machine0.500.510.500.74
Multilayer Perceptron0.600.580.590.76
Table 3. Clusters and their main themes.
#Cluster Description
0Informative facts about COVID-19
1Education and implementation of the COVID-19 policies
2Coping with the pandemic
3Revolt against the COVID-19 policies and behaviour of citizens
4Public discussion regarding anti-pandemic policies and vaccines
5Impact of COVID-19 policies on economy and education
6Public comments on statements of the politicians and scientists
7Information about new daily COVID-19 cases
8Ironic comments of COVID-19
9Short generic messages related to COVID-19
Publisher’s Note: MDPI stays neutral with regard to jurisdictional claims in published maps and institutional affiliations.

