Article

A Multi-Layer Security Scheme for Mitigating Smart Grid Vulnerability against Faults and Cyber-Attacks

1
Robotics School of Fuzhou Polytechnic, Fuzhou 350108, China
2
Electrical Engineering Department, Faculty of Engineering, Minia University, Minia 61519, Egypt
3
Faculty of Engineering, Kotelawala Defence University, Kandawala Estate, Ratmalana 10390, Sri Lanka
4
Queensland Micro- and Nanotechnology Centre, Griffith University, Nathan, Brisbane 4111, Australia
5
Department of Botany and Microbiology, College of Science, King Saud University, P.O. Box 2455, Riyadh 11451, Saudi Arabia
6
Chair of Energy Application Engineering, Institute of Technology, Estonian University of Life Sciences, 51006 Tartu, Estonia
*
Author to whom correspondence should be addressed.
Appl. Sci. 2021, 11(21), 9972; https://doi.org/10.3390/app11219972
Submission received: 25 August 2021 / Revised: 18 October 2021 / Accepted: 21 October 2021 / Published: 25 October 2021

Abstract

:
To comply with electric power grid automation strategies, new cyber-security protocols and protection are required. What we now experience is a new type of protection against new disturbances namely cyber-attacks. In the same vein, the impact of disturbances arising from faults or cyber-attacks should be surveyed by network vulnerability criteria alone. It is clear that the diagnosis of vulnerable points protects the power grid against disturbances that would inhibit outages such as blackouts. So, the first step is determining the network vulnerable points, and then proposing a support method to deal with these outages. This research proposes a comprehensive approach to deal with outages by determining network vulnerable points due to physical faults and cyber-attacks. The first point, the network vulnerable points against network faults are covered by microgrids. As the second one, a new cyber-security protocol named multi-layer security is proposed in order to prevent targeted cyber-attacks. The first layer is a cyber-security-based blockchain method that plays a general role. The second layer is a cyber-security-based reinforcement-learning method, which supports the vulnerable points by monitoring data. On the other hand, the trend of solving problems becomes routine when no ambiguity arises in different sections of the smart grid, while it is far from a big network’s realities. Hence, the impact of uncertainty parameters on the proposed framework needs to be considered. Accordingly, the unscented transform method is modeled in this research. The simulation results illustrate that applying such a comprehensive approach can greatly pull down the probability of blackouts.

1. Introduction

At present, protection schemes play an important role in smart grid operation in terms of security and safety. During the development of a smart power grid, protection scheme reliability has taken priority over verification of whole system security [1]. While reinforcing the systems of protection guarantees grid reliability, the probability of their false function may increase owing to higher complexity [2]. It has been experienced that the hidden failures in the protection devices can lead to cascading outages, which in turn can cause widespread power grid blackouts. A study has been reported by the North American Electric Reliability Council (NERC) in which protective devices are involved in about 75% of main disturbances [3]. Several widespread cascading outages have turned up in recent years, affecting vast customers in the United States. All of these reported blackouts were associated with protection devices’ hidden failures due to other system disturbances [4,5]. Such cases, as mentioned above, create network vulnerable points.
In the status quo, the operators have to get a line on the vulnerability of the power system due to the upsurge in the power grid intricacy and continuous development of it [6]. The vulnerability phrase does not have any general determinate description. Suitable ability to tolerate all contingencies, stabilize and recover without passing limits of the system is the commonly accepted description for a power grid, which is named an invulnerable network [7]. In other words, the weaknesses and susceptibility that make damage to the power grid likely are called vulnerability.
Several indices and approaches have been introduced in the literature. References [8,9,10,11,12,13,14,15,16,17,18,19,20] propose ranking approaches based on certain performance indices, which consider information as well as active and reactive power, bus voltages of the power grid. Authors in [8] have tried to provide a deep-learning-based effective method in order to model the security-constrained optimal power flow considering the automatic primary response of generation units. This reference has represented the machine learning models’ effectiveness at finding feasible solutions. Also assessing the vulnerability of the electrical grid has been investigated in [9,10,11]. The vulnerable points in the network can be categorized based on (1) the steady-state vulnerability assessment (SSVA) (2) dynamic vulnerability assessment (DVA) as expressed by the authors of [12]. Authors in [13] have proved that the vulnerability assessment is significant to examine the validation of measures in the electrical grid. It is important to say that having a close look at the uncertainty and contingency effects on the power system operation takes more attention in recent investigations. Hence, references [14,15] have provided an effective model based on grid operation taking into account the different contingencies in the electrical grid. Authors in [16,17] have tried getting into a comprehensive survey of uncertainty modeling emerging from renewable sources within a smart grid. The presence of uncertain parameters in the grid causes the emergence of vulnerability challenges facing the electrical power operation, which is proven in [18,19,20]. Authors in [18] have proposed a two-stage adaptive robust optimization model to get an immunized solution for vulnerability under uncertain conditions. In this method, some decisions have been made before the uncertainty in the first stage. Then, the defender decision as a second stage is considered after the uncertainty. The reconfirmation of lines in the radial electrical grids can be introduced as an appropriate solution to analyze the vulnerable points under uncertain conditions concerning reference [19]. Authors in [20] have tried to present a mixed OPF-stochastic cascading failure model to assess the uncertainty and vulnerability of a smart grid. The cascading-failure-based AC power flow model proposed in this paper improves the simulation of voltage-related failures in the grid under uncertainty. In the literature [21,22,23]; computational intelligence methods have been utilized to minimize the time consumption of prior techniques. Reference [21] makes capital out of the cloud method to satisfy the accuracy in vulnerability assessment. In other words, the security scheme proposed in [21] using the vulnerability assessment could deal with the main security issues. On the other hand, structured approaches like network analysis methods based on power-flow are still up to date. The researchers in reference [22] have utilized the DC power flow for computing the grid vulnerability. In this paper, using a new index based on the time-sequential Monte Carlo simulation and an N-k′-1 scenario, the reliability and vulnerability were evaluated and it was proven that the AC power flow can be privileged. In addition, reference [23] has designed and implemented an attacker-defender bi-level linear program for vulnerability assessment. In the other classification of the literature, surveys related to the network vulnerable points, effective vulnerability mitigation methods have been focused on ensuring reliability and resiliency of the grid. In the context of applications to strengthen power grid ability and prevent consequential accidents, many attempts have been made by industrial initiatives [24,25], supervisory mechanisms [26], load reduction techniques [27], and employment of energy storage [28]. This investigation employs microgrids for vulnerability mitigation. In addition, it may be an important point of view that network vulnerability can be utilized as a significant criterion for evaluating the impact of cyber-attacks as well. As already mentioned, to deal with the destructive effects of cyber-attacks in network vulnerability points, the multi-layer cyber-security protocol is applied in this research. The first layer is a public security protocol based on blockchain. Blockchain technology has emerged in the economic environment, healthcare centers, and industry because of its remarkable advantages. The applicability of blockchain technology in tasks including voting, identity recognition, and data authenticity identification has brightened the concept of internet-of-things (IOT) in recent years. The blockchain platform is basically a security infrastructure based on the P2P networks without role-playing any governor, which guarantees the ultimate transactions [28]. The second one is the Reinforcement Learning (RL) method as the subset of machine learning techniques. Note that the detection of the vulnerable points can be considered from an attacker’s view as well, in which the target would be to define the attacking strategies to get the maximum possible destruction within the power grid. Such an issue can be especially useful in network vulnerability analysis, that is, with the aim of recognizing the worst possible destruction an attacker may insert into the grid. Hence one can execute essential precautions. Several investigate vulnerability surveys using RL as in [29] for false data injection (FDI) attacks and [30] for consecutive grid topology attacks. Some explanations need to be described for the type of cyber-attacks described here. As expressed in reference [31], considering the basic structure and approach of both the blockchain technology and the RL method, it is expected that the proposed framework can be acceptably able to cover attack types related to unauthorized access, interception, distributed denial of service (DDOS) and the balanced attack. To realize the challenges expressed in this paper, Table 1 shows the main differences between the recent investigations and the suggested approach in detail [7,26,32,33,34]. As it can be seen, the authors in [31] have tried to provide a security platform for the smart grid without considering the network’s vulnerable points. In addition, checking the uncertainty effects on the performance of the cyber-security approach against attackers pointed out in this paper can be one of the significant concerns not considered in other literature.
Given all of the above, the main contributions in this paper can be summarized as follows:
Evaluating and mitigating smart grid vulnerability with the use of making a targeted interactive framework between the smart grid and the microgrid.
Proposing a multi-layer cyber-defensive structure embedded within the grid to prevent the penetration of hackers to the critical and vulnerable areas of the smart grid.
Comparing the proposed cyber-security scheme to the other approaches proves this method’s effectiveness and validation against the targeted cyber-intrusions.
Developing an uncertainty framework based on the unscented transform (UT) method to reveal the negative effects of uncertain parameters on assessing the vulnerability indices of the smart grid.
The rest of the paper is structured as follows: Section 2 shows modeling of the vulnerability indices in relation to the smart grid. Section 3 proposes a multi-layer security approach for the smart grid. In Section 4, the stochastic framework based on UT is modeled to provide the stochastic effects. The relevant consequences on the IEEE-test system are analyzed in Section 5. Finally, the main outcome of this paper is briefly expressed in Section 6.

2. Definition of Vulnerability Indices Based on the Proposed Network

The growing demands and the structural complexity of power systems cause increases in the risk of cascading failures and blackouts in the power system [35]. These issues highlight the need for assessing vulnerable points in order to reduce the threats to society due to the involved sequence of cascading failures. In other words, the power system vulnerability can be introduced as an efficient tool to determine and measure the weakness and incidence of the lines or the other sections related to the power system with regards to the cascading events. Eventually, this paper tries to address two effective approaches to prevent large-scale blackouts from both the technical and cyber-security points of view. In this regard, there needs to be an appropriate modeling method to get the vulnerability assessment of the power grid. To this end, the case of evaluating the vulnerable sections of a power grid needs to be defined as disturbance-based indices comprising of several basic parameters computed with regards to two cases: (1) normal condition (2) operation of the power system under a simulated disturbance. Any perturbation including the transmission line outage or generation unit outage might affect the other small/large-scale sections of the power grid. Hence, assume a studied power grid with L line, B bus, and G generation unit in the first place. Then, the unexpected effects arising from kth transmission line and gth generator outages on the main sections of the grid, that is, buses, lines, and generation units can be calculated as follows:
  • Vulnerability indices of Bus
This part is aimed to represent the disturbance impacts of disconnecting k transmission lines on the grid buses by using the definition of vulnerability indices as shown in Equations (1) and (2):
B b k = 1 T V m i n , b 1 T V b , k 2 × ( 1 T V n o r m a l , b ) ( 1 T V b , k ) ( 1 T V n o r m a l , b ) ( 1 T V m i n , b ) 2
V I B b k = 1 B b k > B b b a s i c 0 B b k < B b b a s i c
where B b k is defined as the k line outage index of bus b and V I B b k indicates the bus index for the sake of disconnecting k line. It is needed to say that the variable T V b is considered as the voltage deviation and 1 T V b shows the voltage of bus b. Based on Equation (1), in the case that the outage of k line occurs, the voltage of bus b will be affected and altered from the voltage level of normal to critical, which is shown by 1 T V b k . This leads to a growing trend in the k line index ( B b k ) up to a basic level ( B b b a s i c ). Keeping this issue in mind, the b bus index ( V I B b k ) exposed to the k line disconnection will be equal to 1, if k line index overtakes from the threshold. On the contrary, the V I B b k = 0 means that the k line index is still less than the basic level. In other words, the V I B b k = 1 shows that the k line outage can affect the voltage deviation of bus b and vice versa.
  • Vulnerability indices of line
The same process related to the vulnerability indices of buses can be developed to assess the vulnerability of the grid lines under k line outage as follows:
L l k = P l k P l m a x 2 × P l k P n o r m a l , l k P l m a x P l k 2
V I L l k = 1 L l k > L l b a s i c 0 L l k < L l b a s i c
As mentioned before, a blackout over the power grid may be launched through the cascading events. For instance, in the case that the outage of k line has occurred, the power flow of the other lines of the grid might increase up to a level that the loading of lines overtakes the maximum limit. For this reason, the security control system of the power grid has to make the needed edicts to disconnect the other lines, getting to a steady-state operation. In this regard, vulnerability assessment is provided by Equation (3) in which L l k is defined as the k line outage index of the grid lines formulated based on the normal and fault conditions. Focusing on Equation (4), the V I L l k = 1 means that the k line outage will affect the power flow of line l and vice versa.
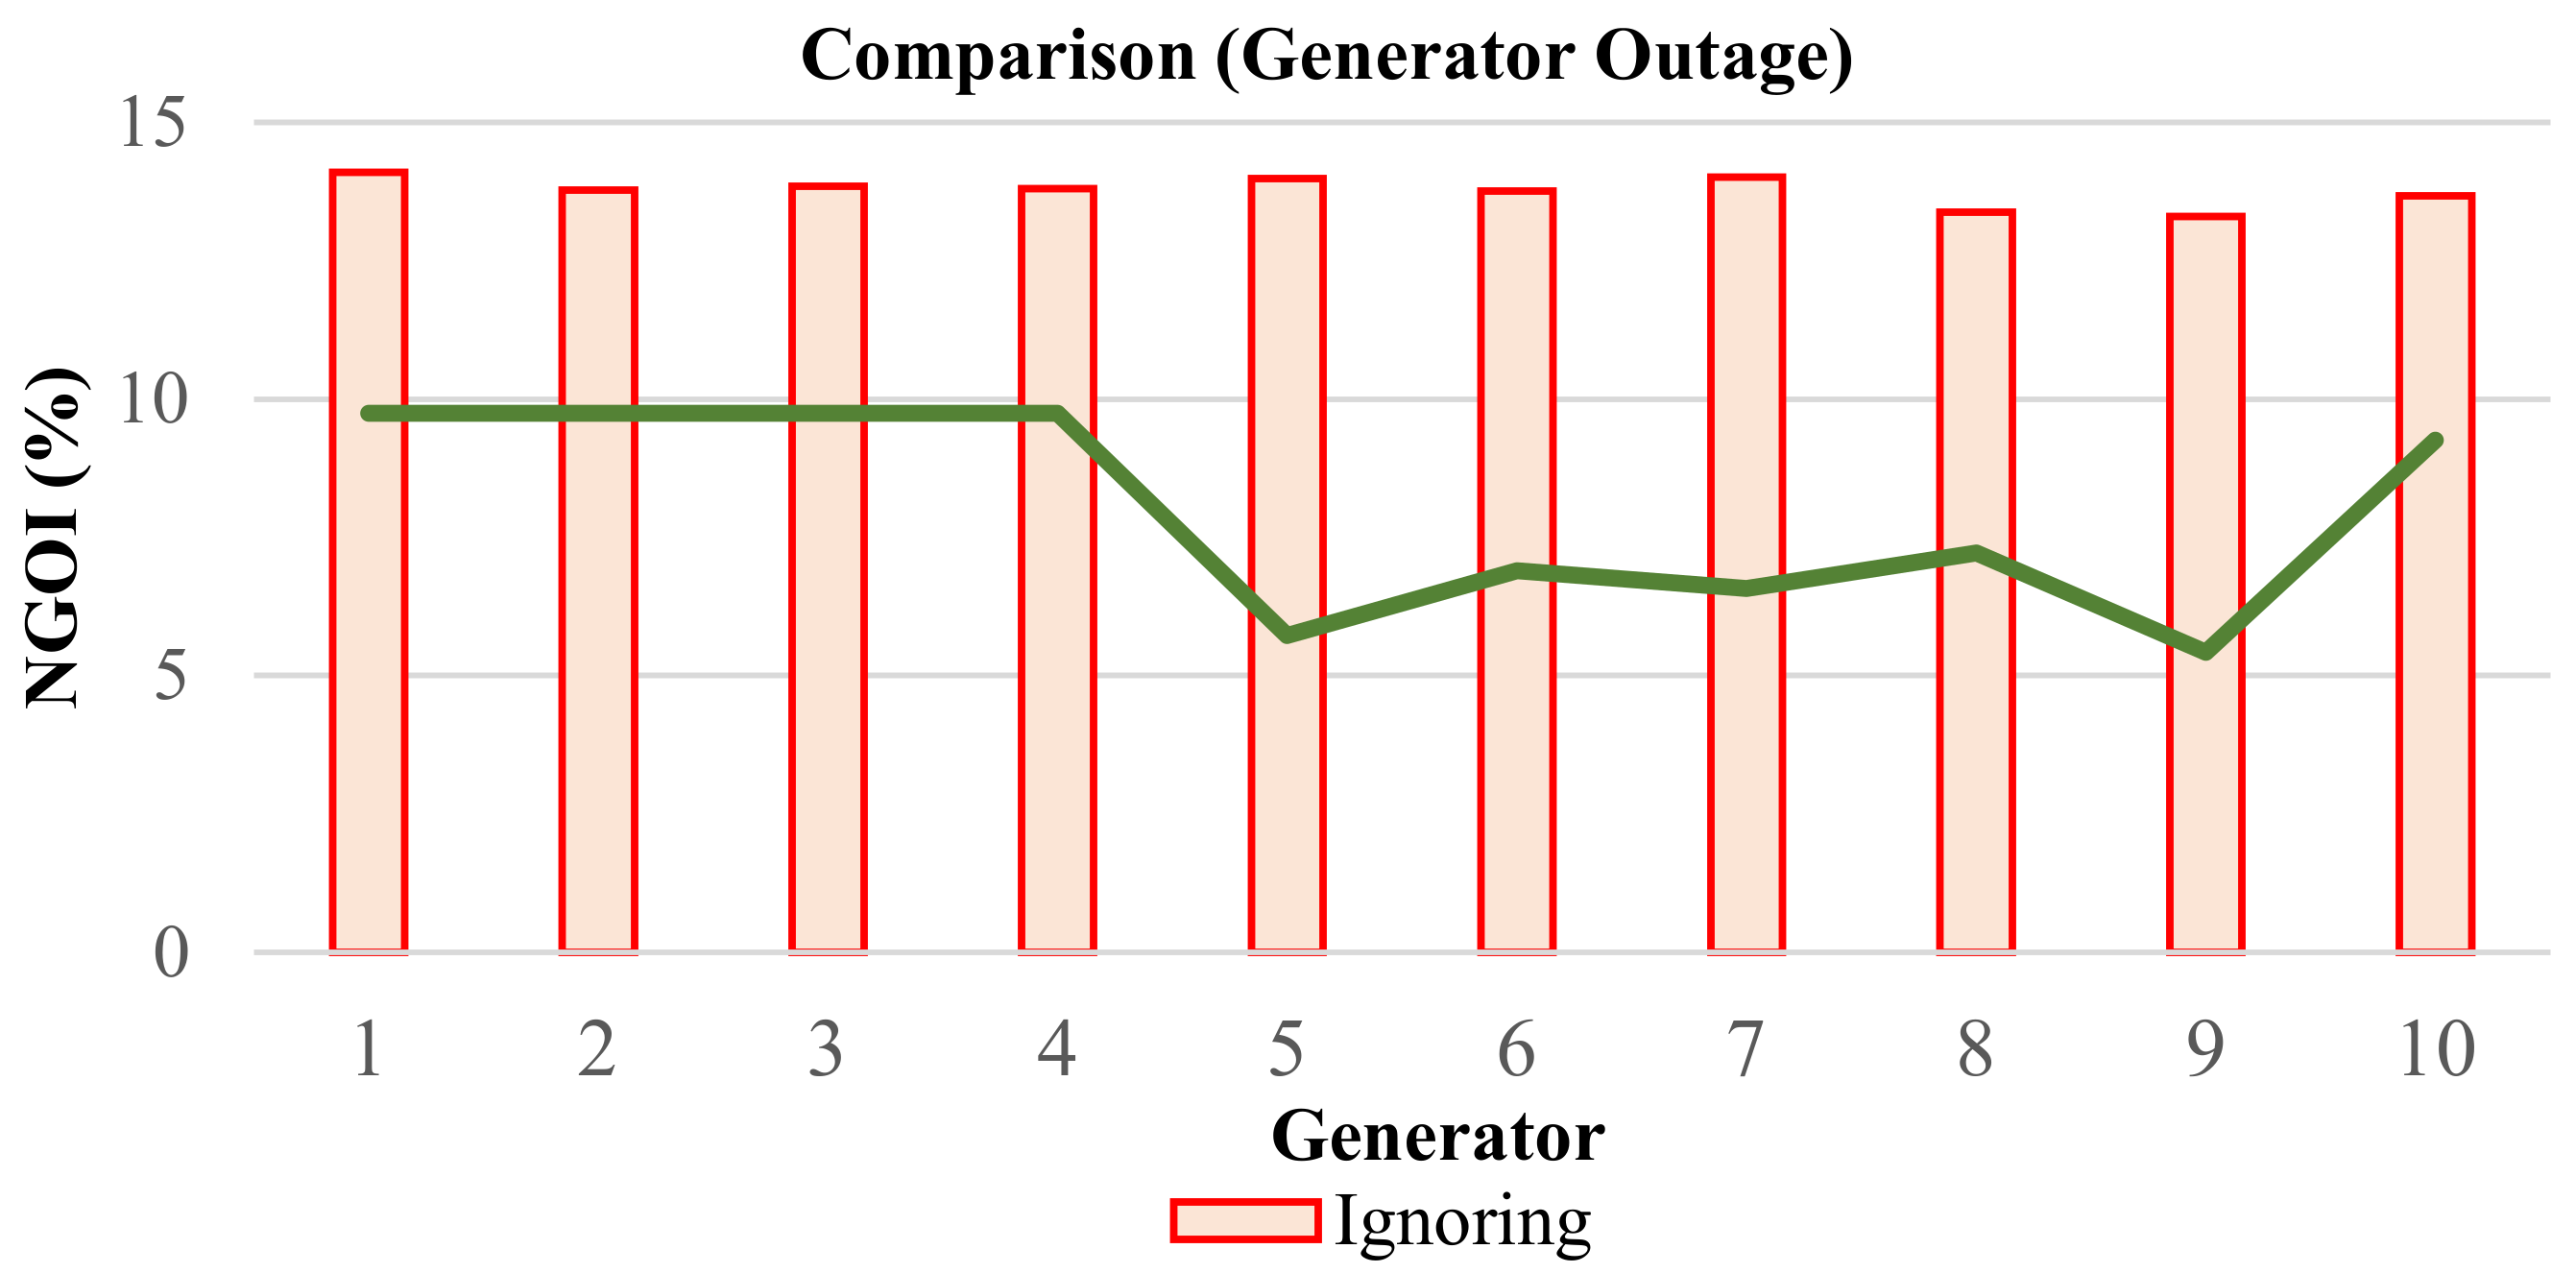
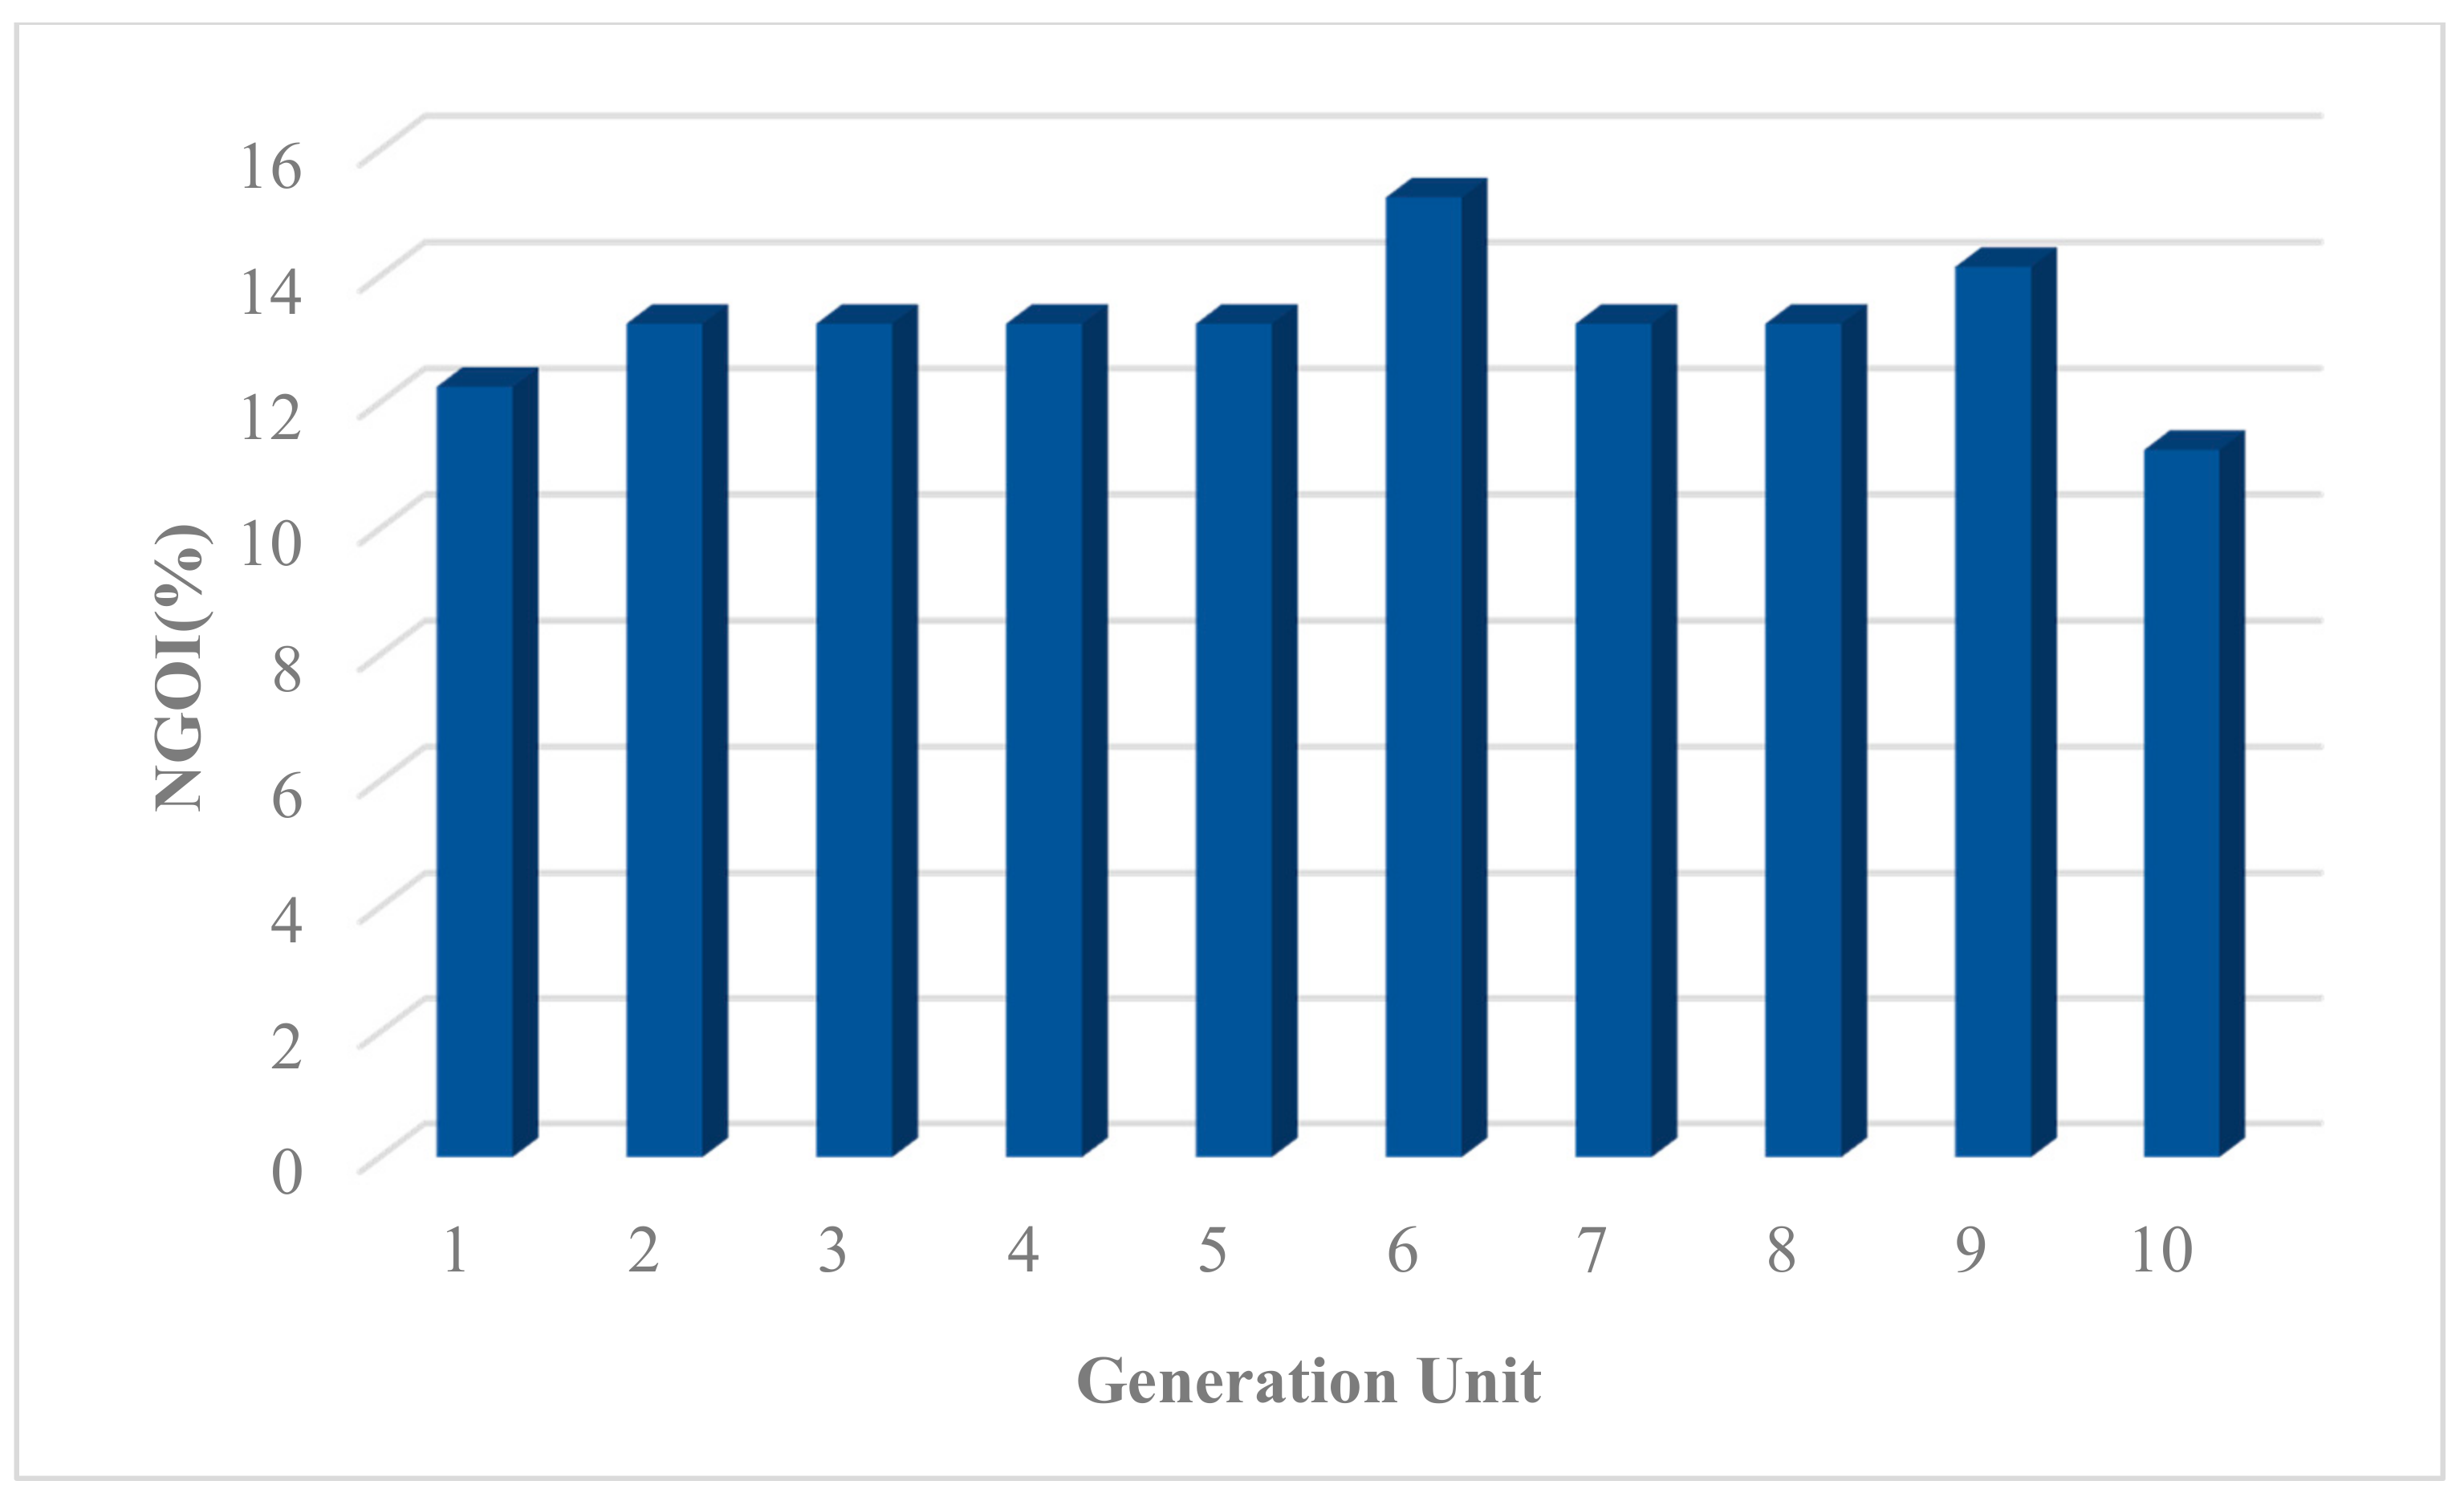
  • Vulnerability indices of generator
It can be inferred that the generation units of the grid may be affected when a k line outage happens. Hence, there needs to be defined the index of g generator ( V I G g , V I Q g ) as the disturbance effects arising from disconnecting k line. It is worth mentioning that the index of g generator comprises of active and reactive power indexes ( V I G g , V I Q g ) depending on the generated active/reactive powers pertaining to the g generator. Accordingly, Equations (5)–(8) indicate the formulation related to the indexes of g generator, which are dependent on the k line outage index of g generator ( Q g k , G g k ). It is important to say that the argument mentioned in previous sections about vulnerability indices can be developed for finding the critical points of the generation units.
G g k = P g k P n o r m a l , g k P g m a x P g m i n 2 × m a x P g m i n P g k 2 , P g k P g m a x 2
Q g k = Q g k Q n o r m a l , g k Q g m a x Q g m i n 2 × m a x Q g m i n Q g k 2 , Q g k Q g m a x 2
V I G l k = 1 G g k > G g b a s i c 0 G g k < G g b a s i c
V I Q l k = 1 Q g k > Q g b a s i c 0 Q g k < Q g b a s i c
As shown in (9), L O is defined as a logical matrix including the indexes of generators and lines with a domination of L-to-R (B + L + G). The row/column subscripts of L O are assigned to the grid assets, that is, bus, line, and generators and the disconnected lines, respectively.
k : 1 , 2 , L L O = V I B V I L V I Q , V I G
Similar to the process related to line outage, the generator outages can be simulated instead of the line outage and the vulnerability indices pertaining to the bus, line, and generation unit indexes are calculated. By doing so, the vulnerability matrix arising from the g generator outage index is provided by Equation (10).
g : 1 , 2 , G G O = V I B V I L V I Q , V I G
The network line outage index ( N L O ) can be computed as the ratio of disturbance effects caused by launching the line outage as indicated in Equation (11) in which parameter R is comprised of elements from a number of networks such as bus, line, and generation unit ( R = L + B + G ). In the same way, the network generator outage index ( N G O ) is formulated by (12), each element of which expresses the vulnerability value considering the g generator outage.
N L O = L O R
N G O = G O R
Finally, the objective function of the vulnerability index of the power grid comprises both the network line/generator outage indexes. Hence, Equation (13) is provided as the main goal of this paper which should be minimized.
N V = R N L O + N G O

The Proposed Network Formulation

In recent years, providing effective and new strategies in compliance with the modern power system standards to collapse the vulnerability indices is required. Technically, employing a security policy in the power system reduces destructive threats such as blackouts in post contingency situations. Hence, the main goal of this section concentrates on getting to an efficient framework of energy exchange between the power grid and a microgrid including some distributed energy resources with the aim of mitigating the power system vulnerability. To this end, there is a need to describe the power grid modeling in the first place. In our suggested model, the power grid is formulated to charge the electrical loads in order to minimize the total cost of generation [36,37]. For more clarification, the objective function and limits of the smart grid are literally represented in (14)–(26). Equation (14) shows the objective function including the operation cost, start-up/shot-down costs, and cost of power exchange all of which need to be minimized. Besides this, each generation unit should keep the generation capacity limits for the active/reactive powers for the sake of the fuel limit. To clarify this problem, the power generation constraints of units are formulated in Equations (18) and (19) in which the binary variable z κ g , t is modeled for the start-up/shot-down ( z κ g , t = 1   or   0 ) rates of generation units. It is significant to mention that the reserve power produced by generators can be employed to keep the power balance of the grid in the contingency condition. Hence, Equations (20) and (21) illustrate the limits of the generator’s reserve power at t. The utility constraint for the power flow of feeders may cause positive/undesirable impacts on the procedure of optimizing the power following the objective function. So, the feeder power flow is computed and modeled by (22) and (23). The bus angles of the grid are indicated by η b m a x , which should be restricted between the max/min values as shown in (24). Equations (25) and (26) represent the active/reactive power flow restrictions needed for the power grid feeders, respectively.
m i n c o s t g r i d = t g r c P t , g + S t , g + D t , g + R t M P t T S
g P t , g   l P t , l + M P t T S = P b , t L o a d t Ω T , b Ω b
g Q t G +   l Q t , l = Q b , t L o a d t Ω T , b Ω b
T V m i n T V b , t T V max t Ω T , b Ω b
P m i n z κ g , t P t , g P m a x z κ g , t t Ω T , g Ω g
Q m i n z κ g , t Q t , g Q m a x z κ g , t t Ω T , g Ω g
P t , g P t 1 , g D G + z κ g , t 1 t Ω T , g Ω g
P t 1 , g P t , g D G z κ g , t t Ω T , g Ω g
P l = T V b T V m R l X l η b b Ω b , m Ω m , l Ω l
Q l = 1 + 2 T V b X l 0 T V b T V m X l R l η b b Ω b , m Ω m , l Ω l
η b m i n η b , t η b m a x t Ω T , b Ω b
P l m a x P l , t P l m a x t Ω T , l Ω l
Q l m a x Q t , l Q l m a x t Ω T , l Ω l
As mentioned before, the microgrid is proposed as a security strategy to get the minimum vulnerability indices. In other words, the power grid can settle down the energy scheduling for grid vulnerability mitigation by buying/selling the surplus power to a microgrid in contingency conditions. To clarify the power transaction amid microgrid and utility, it is vital to model the central form of the microgrid construction [38,39,40]. The proposed microgrid model consists of the battery and some distributed generations (DGs) such as Wind Park, photovoltaics, and tidal units, as well as some islanding loads at far areas [41,42]. The microgrid ought to be able to dispatch power among DGs, aiming to satisfy the fitting function (27) and the relevant constraints. About the event area in the grid, the microgrid tries to transfer the surplus power to the power grid while its operating costs related to DGs and transaction costs should be minimized as indicated in (27). The generation power of each DG is formulated for wind, tidal, and photovoltaic units in (28)–(31). Restrictions of the storage unit to meet power balance and restraints of charging/discharging rate are modeled by (32)–(35). Equation (31) shows the equivalence between loads and generated powers within the microgrid. In Equations (32) and (33), the positive value of P t B shows that the power is flowing from the grid toward the batteries [17,42]. The time slot ∆t is assumed to be 1 since the analysis is performed for each hour of the time horizon. P t B covers both charging and discharging status of the storage, where each one is limited by its upper and lower value and a binary variable to not allow the storage to be charged and discharged at one time. The positive value of power transactions ( M P t T S ) means the energy value received from the power grid and visa verse.
m i c r o g r i d = m i n t Ω T R W t P t W + R T t P t T I + R V t P t P V + R B t P t B R t M P t T S
P t W = 1 2 S C K ( U t V )   3                         t Ω T
P t T I = 0     0 X t V X r a t e d V 0.5 P γ λ X t V 3 X c u t i n V X t V X r a t e d V t Ω T P r a t e d T I X r a t e d V X t V
P t P V = Q × E t P V Z × ( 1 R L l o s s ) t Ω T
P t T I + P t W + P t P V + P t B + M P t T S = P t l o a d S t Ω T
V t B = V t 1 B + P   t   B Δ t η B a t t Ω T
P t B = P   t   c h P   t   d i s t Ω T
P min P t B P max t Ω T
V min V t B V max t Ω T

3. Multi-Layer Security Approach Based on Vulnerability Indices

As mentioned in the previous section, identifying the vulnerable points of the power system based on the aforementioned formulation and studying these points would be necessary to better monitor the security control system of the network considering an appropriate security platform. Generally, the main aim of this paper is to evaluate and find the critical points of the network, which lead to widespread instability and cascading failures in the power grid under intentional and random cyber-attacks. Hence, the first and perhaps the most significant concern is to prevent the cascading failures and blackouts in the power system from the cyber-attack point of view. In such cases, cyber-hackers can intelligently get their malicious goals by targeting the vulnerable points of the grid for cyber-attacks. In other words, by exposing these sensitive points of the grid to invasion, attackers may take the many technical and financial consequences, that is, blackouts within the smart grid with regards to suffering the negligible cost of the adversary attack. To overcome this problem, there is a need to provide effective and efficient security architecture to protect the vulnerable points of the smart grid against the malicious targeting of cyber-attacks. To do so, this article proposes a multi-layer security scheme concerning the critical areas, which are specified by the vulnerability assessment of the smart grid. For more clarification, this approach is designed based on two cyber-security defense mechanisms consisting of the blockchain architecture-based public defense and the RL-based private defense within the smart grid. It is significant to say that the private defense of security is aimed at covering only some significant and sensitive areas of the smart grid to prevent cyber-unauthorized accesses. Figure 1 represents the relationship of both public and private layers to the smart grid in order to clear the proposed framework. This means that the vulnerable areas of the grid are secured not only by the public defense but also are placed under cover by the second layer named the private security defense.

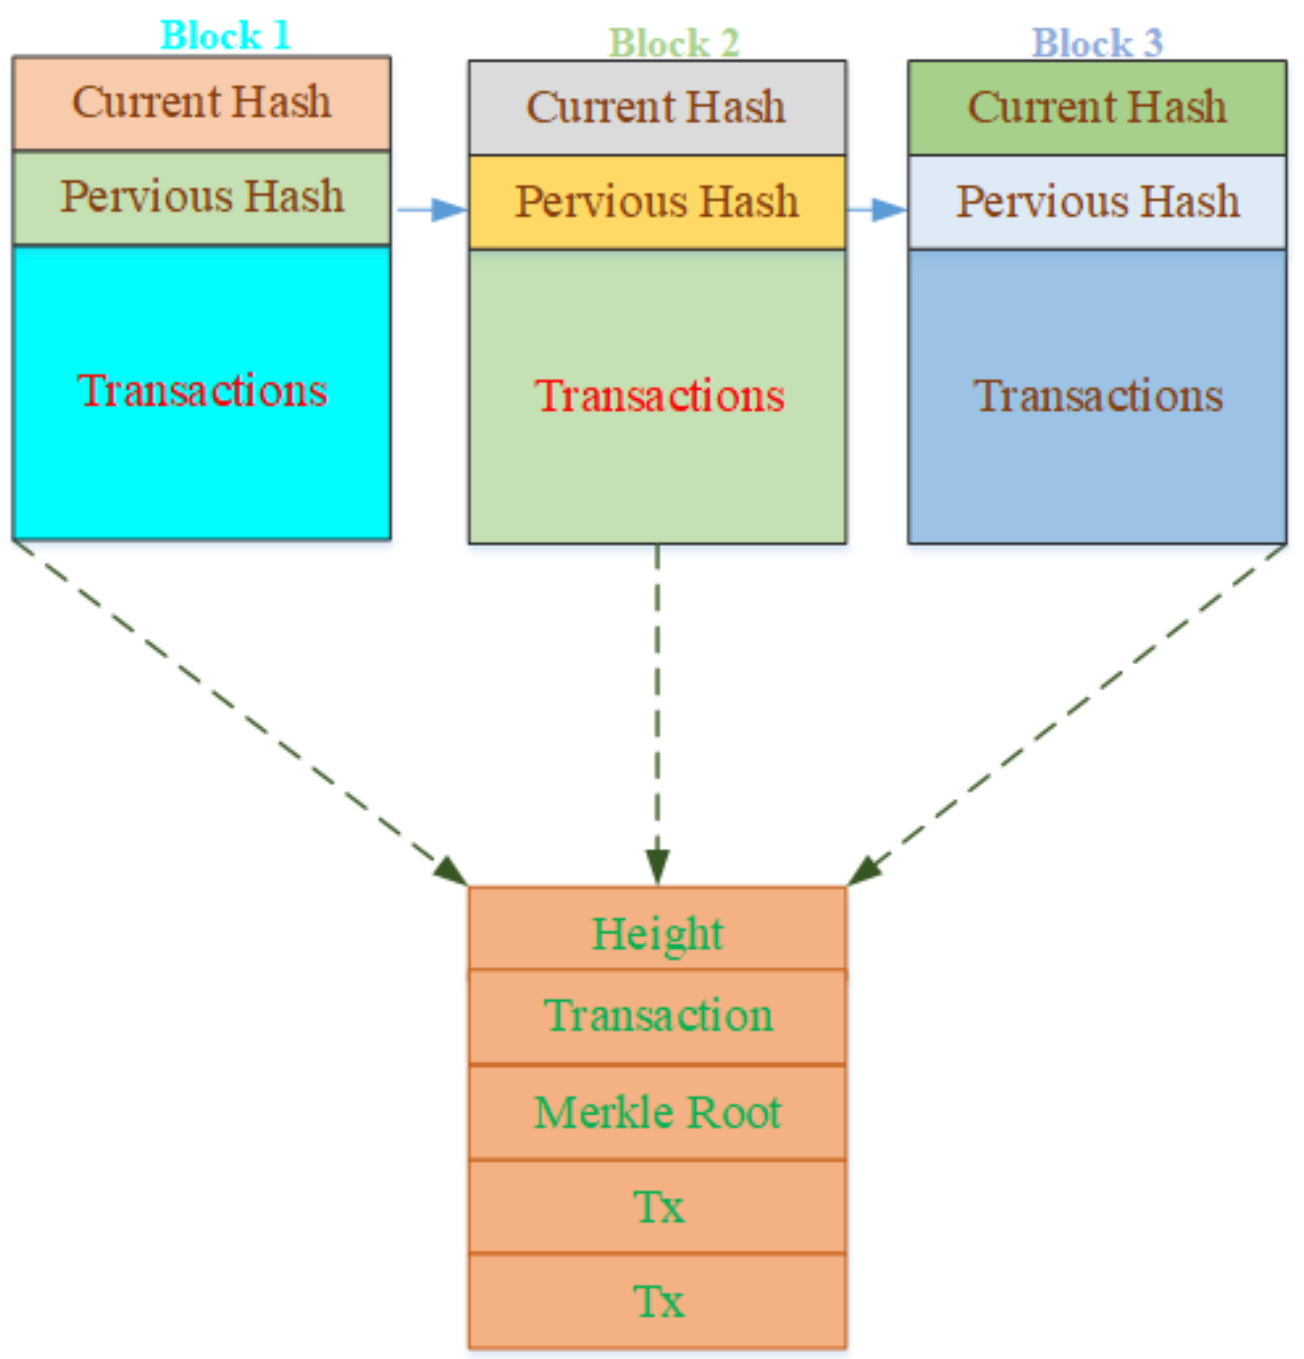
3.1. The Blockchain Architecture-Based Public Defense

This part tries to express the first layer of the proposed security mechanism designed concerning the blockchain-structure-based data exchanging within the smart grid. In this regard, it is necessary to first describe the performance of the blockchain architecture aiming to get a secured effective scheme within the modern electrical grid. In recent years, some investigations have advocated that the applications of blockchain technology have embraced much attention [40].
The blockchain structure is executed for different stages including the distributed and fault-tolerant systems wherein every node is allowed to share its data without a specific control system. However, there are some communication restrictions for broadcasting data that obey the network graph based on the graph theory. In this way, each node has a channel with its neighbors in a bidirectional manner that Figure 2 shows. In the same vein, the two below constraints (36, 37) must be satisfied. Performing this theory gives rise to disproving the virtual nodes; therefore, each node is active in its specific location.
λ x ( x , y ) = λ x ( y , x )
N ( x ) = N i n ( x ) = N o u t ( x )
The constraint (36) is representative of the bidirectional network, and (36) is the set of neighbors of x .
This framework can be useful to prevent the penetration of hackers who aim to manipulate the network data. This means that the blockchain system is aimed at deactivating adversarial strategies related to attackers with the use of honest nodes, which are capable of making high computational attempts [41]. In the rest, the fundamental structure of the blockchain network is explained to elaborate on validating the security behavior of such systems to overcome the malicious targets of attackers.

Blockchain Structure

The one of main features pertaining to the blockchain mechanism is to exchange data among nodes in a decentralized situation. Such systems can align to provide the needed conditions for agents that desire to participate in the transactions within the trustless system. On the other hand, the decentralized blockchain platform will basically let the nodes communicate with each other to validate the legitimacy of new transactions within the consensus algorithm. Besides this, note that the information released by nodes needs to be crypto graphed in such a security process. In view of these facts, the blockchain system has some significant advantages compared to the centralization-based security systems as follows: 1- Validating trades related to each node performed by a consensus algorithm. 2- Organizing nodes in form of the peer-to-peer (P2P) structure, as indicated in Figure 1, without any architecture to connect them in the network [42]. Regarding the above argument, the structure of the blockchain system is basically designed using three main sections, consisting of the decentralized network, consensus algorithm, and cryptographic process. The basic construction of the decentralized network is to improve the message exchange among nodes for keeping the distributed ledgers assigned to any node. Generally, such a structure is based on a P2P construction in order to leave/join from/to the network independently. It is axiomatic that the decentralization-based network architecture is able to reduce the failures of the nodes and connection [43]. As a second part, the blockchain process needs to have an effective consensus protocol organized through P2P-based construction to validate transactions related to every node. According to the consensus procedure, the messages given from the P2P structure should be registered in the ledgers. In addition, the consensus protocol according to the received blocks is aimed to get an appropriate agreement with regard to the association of them. This consensus protocol can guarantee new transactions being added to the network in such a way that has no conflict with the other transactions within the system. Henceforth, the fresh transactions are located in a block that needs to be submitted to the blockchain process with the aim of confirming through the validation mechanism. The cryptographic process is one of the most significant parts of blockchain technology, which is considered to get a safe environment for data and records exchanged among nodes. For more clarification, it is needed to describe the data structure in each node. The block is established in each node in order to retain a growing list of records made by the distributed database of the blockchain and there is a need to secure the network against malicious hackers by using continual verification. In other words, each node joined to the network is able to view its block including the list of transactions inserted in the ledger. Figure 3 shows a block shape in blockchain technology. Focusing on this figure, it can be realized that a block made by a node consists of the transactions, timestamp, the data related to the previous block, and a tree chart of transactions named Merkle root.
As mentioned before, it is necessary that the data block is secured by each node to make an obstacle for the invalid nodes. To do so, all nodes should reflect an encryption system according to the data label of the block for generating current/amenable hash addresses (HAs). To elaborate on the generation process of the previous/current HAs, in a network are some nodes, each node in iteration i bounds up to generate a HA (current HA) considering its hash function and keeps an HA (previous HA) made by the adjacent nodes in iteration i-1. Each node saves both the recent and current HAs into its data block. This trend makes two general results including validity and confirmation of the data block. It is significant to mention that the HAs are generated in range of the 32-bit compounded words concerning different hash functions [44], that is, SHA-512, SHA-384, SHA-256, SHA-224, and SHA-1, consisting of letters and numbers {0–9, A-F}.

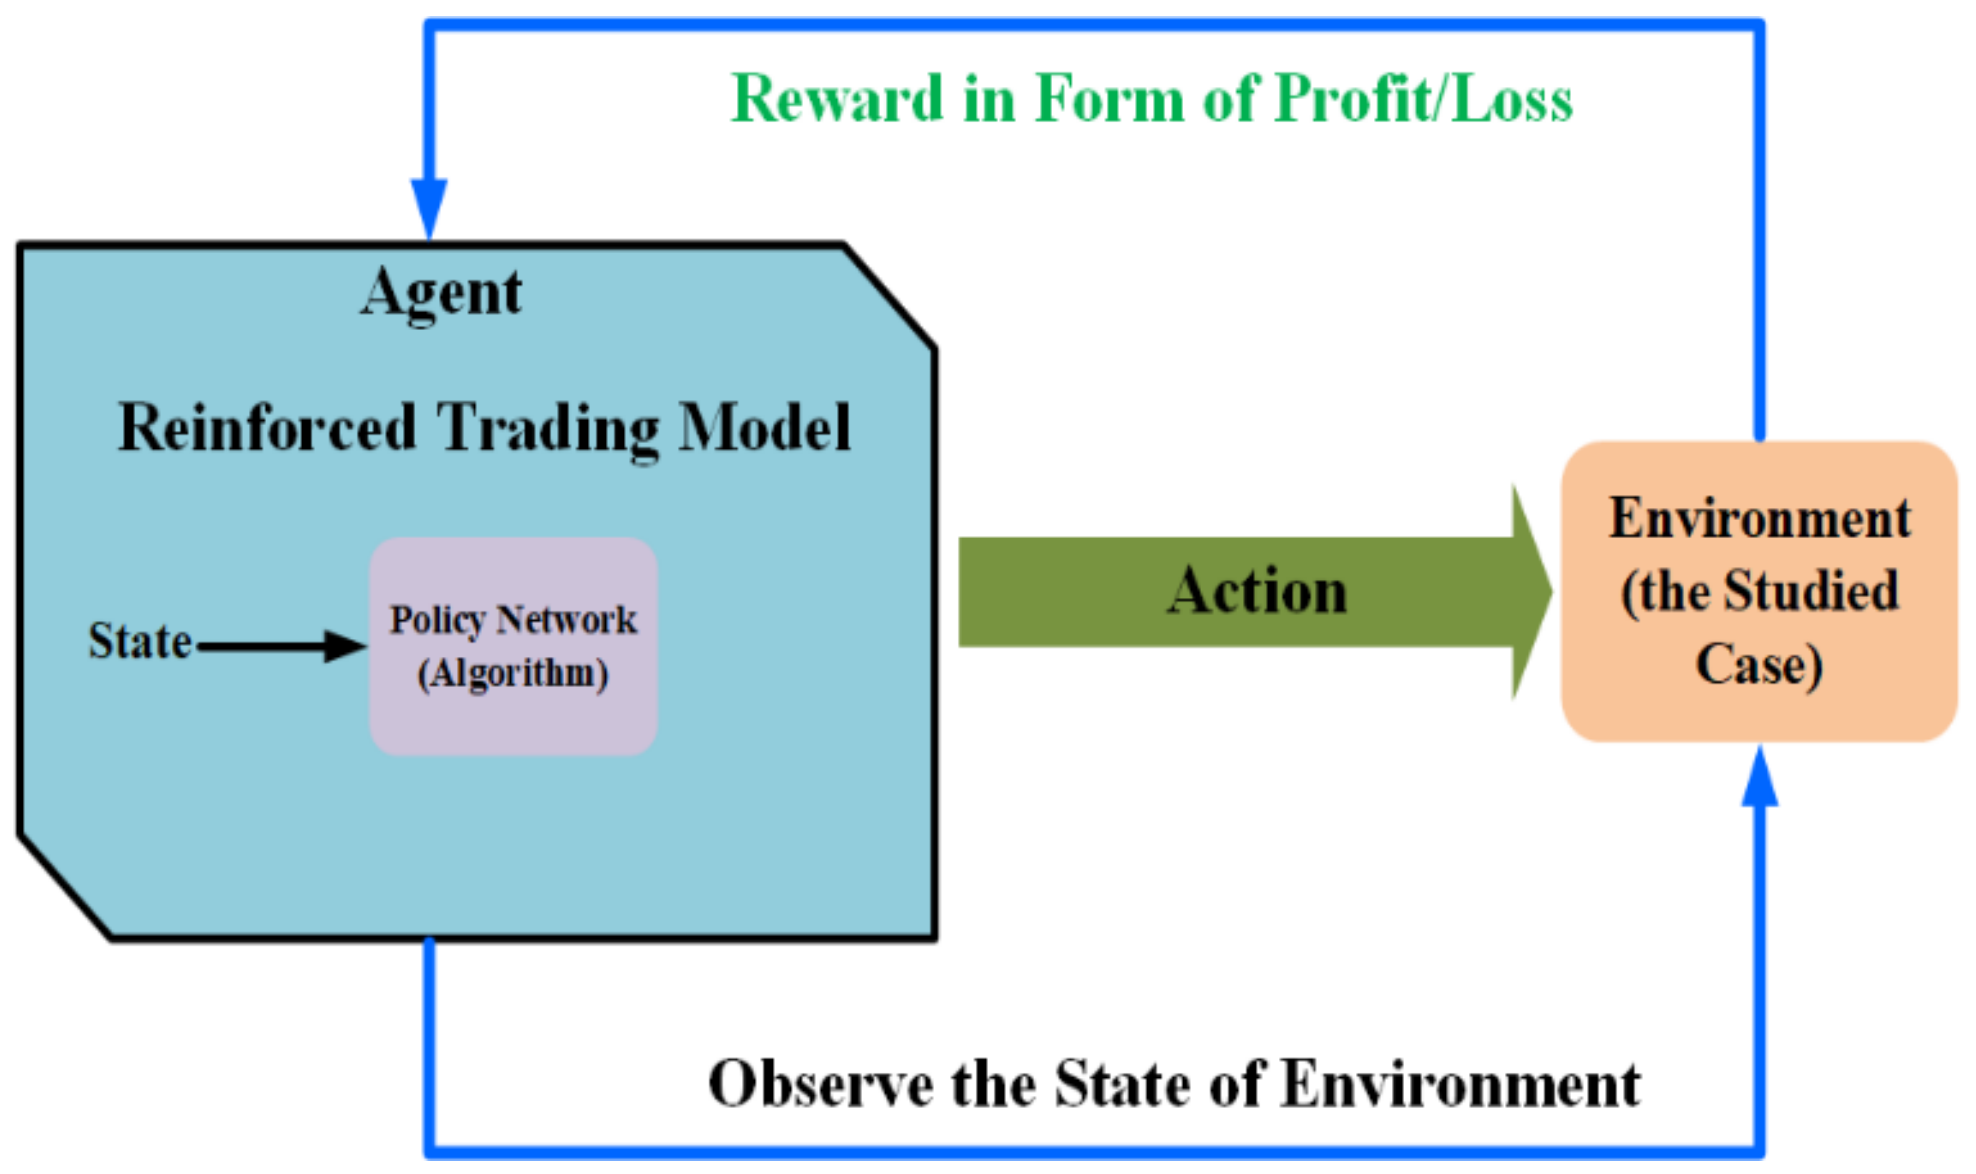
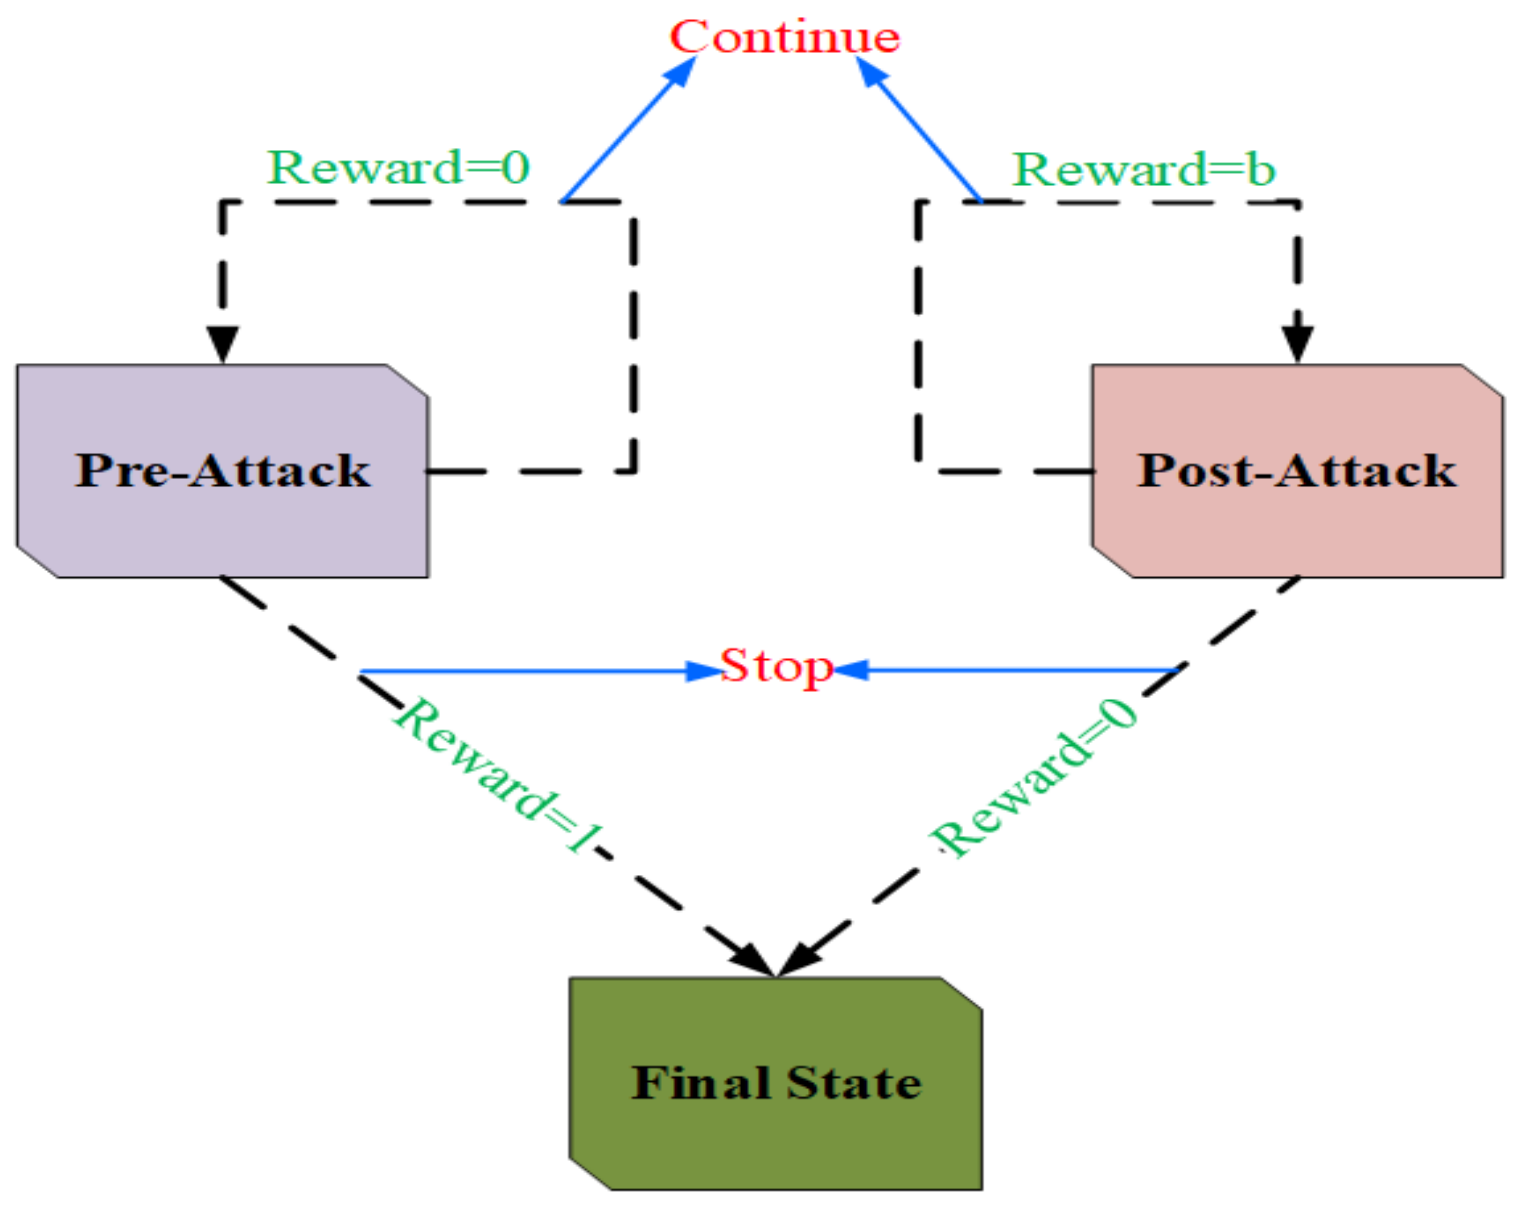
3.2. Reinforcement Learning-Based Private Defense

The private defense as the second security layer is designed and embedded for the significant areas assessed by the vulnerability indices of the power grid. With the descriptions mentioned before, this section is dedicated to providing the details of the private defense scheme organized based on the features of the learning machine method. In recent years, sundry methods considering the learning machine theory have been proposed to detect cyber-attacks, that is, supervised learning, RL, and unsupervised learning. The recent investigations have shown that reinforcement-based detection methods are more effective and reliable schemes than the other methods due to interaction with the environment [39]. The fundamental framework of the RL method is represented in Figure 4. As can be seen in this figure, such an approach comprises of two main parts: (1) environment (2) agent. For more clarification about the detection process, note that The RL method is generally executed based on two main phases: (1) learning phase (2) detection phase. In the first phase, the agent tries to recognize the environment with the use of opting for sundry actions related to the environment observation. By doing so, the agent would receive different rewards depending on the action selection. This trend is stopped when the agent takes the maximum reward, which results in the best action.
It is essential to say that the detection method function needs to be defined based on the Partially Observable Markov Decision Processes (POMDP) problem as described in [45]. In this regard, the objective function of this method is defined to get into the attack alarm concerning the minimum detection delay. To this end, the POMDP concept-based relevant scheme to detect attack is defined in accordance with Figure 5. Suppose that the attacker trends to attack the system considering the unknown method at time κ. Regarding the unknown attack strategy, the relevant states are defined by the “pre-attack”, “post-attack” and “final” states. As it can be seen in Figure 5, to transfer the agent from the “pre-attack”, “post-attack” states to “final” states, there are two permissible actions including “continue”, and “stop”. Hence, the attack alarm occurs when the agent takes a “final” state for the sake of opting for the “stop” action. If so, the agent would keep the “pre-attack” state using the selection of the “continue” action. As mentioned before, the agent will take the rewards 1 and 0 regarding the relevant action. On the other hand, the reward b is defined as the “continue” action selected by the agent in the “post-attack” state. Keeping this in mind, the fitting function of the agent is developed to decline the summation of the penalty coefficients arising from action choice as shown in Equation (38).
min P p e n = E κ ( r e t | t s < T t ) + t = T b | t s > T t
Wherein the objection function is dependent on the stopping time (ts) and the expected value of the penalty coefficient (Ppen). According to the attack time and the received reward, the objective function is defined in terms of ts < T and ts > T. For more clarification, two underlying phases related to this approach can be seen in Algorithms 1 and 2. Algorithms 1 describes the trend of obtaining random action-observation pairs in a pseudo-code manner. Based on the learning phase in the random action-observation pair section, there is a need to first describe the arbitrary action-observation pair (P (o, a)) named the action value. Based on the learning phase, there is a need to first describe the arbitrary action-observation pair (P (o, a)) named the action value. As a next stage, the arbitrary action and observation are necessary to define in the “pre-attack” state (U) at time 1. Firstly, the observation signal (ot+1) is computed regarding the estimate of likelihood φt and Xt at time t + 1. To describe ot+1, the optimal action (at+1) is obtained based on the ε-greedy policy in order to select the best action. It is important to say that the current P will be updated with the use of the SARSA algorithm to carry out well over the PODMP problem [11]. Finally, to apply the second phase, there is a need to save P in the Y table.
Algorithm 1: Learning phase framework.
1-Pick up random action-observation pair (Reset P (o, a))
2- for s = 1:S (Episode)
3- t = 0
4- U = “pre-attack” state
5- Choose “continue” command and an observation relaying to the “before-attack” state.
6- for t = 1:t
7- t = t + 1
8- if at = “stop” and t < T
9- rt =1.
10- Ut = “final” sate.
11- Pt (ot, at) = P (ot, at) + 𝛼 (rt-Pt (ot, at)).
12- end
13- if at = “continue” and t > T
14- rt =b.
15- Ut = “post-attack” sate.
16- else
17- r = 0.
18- end
19- Take Dt and evaluate the observation signal (ot + 1)
20- Select the optimal action (at + 1) according to the observation signal (ot + 1) using ε-greedy policy.
21- Revise the action (Pt + 1) by relaying to SARSA control:
22- Pt (ot, at) = P (ot, at) + 𝛼 (rt + Pt + 1 (ot + 1, at + 1)-Pt (ot, at)).
23- Update Y table.
24- ot = ot + 1
25- at = at + 1
26- end
27- end
Algorithm 2: Detection phase framework.
1-Feed Y according to the learning phase.
2- U = “pre-attack” state
3- Opt “continue” action and an observation relaying to the “pre-attack” state.
4- for t = 1:t
5- t = t + 1
6- if at = “stop”
7- ts = t  (the stopping time).
8- Alarm attack.
9-   end
10- Find Dt and evaluate observation signal (ot + 1)
11- Choose the optimal action (at + 1) according to the observation signal (ot + 1) by ε-greedy policy.
12- Update the action value (Pt + 1) by relaying to SARSA:
13- at = at + 1
14- end
After the learning phase that is executed in the pseudo-code of Algorithm 1, the newly recorded data are compared with the same condition in table y. The end of the process will detect false data. This trend is shown in Algorithm 2 as pseudo-code. The second phase is designed based on the Y table obtained in the previous phase as represented in Algorithm 2. In fact, this phase is aimed at raising alarm about the cases of the data manipulation with the aim of minimizing the stopping time ts. Overall, the proposed method procedure indicates that such a learning agent is able to detect the attack in minimum stopping time. Therefore, considering the RL method based on a smart grid, the relevant devices measure the needed data from the smart grid such as voltage, bus, angle, power generation, load, etc. to analyze energy management of the electrical grid in the first place. Then, these data, in order to detect false data, are assessed by the learning process.

4. Uncertainty Modeling

It is vital to provide a precise analysis of the noteworthy impacts of the random variables on the power grid performance [46,47,48,49,50]. This part tries to represent the modeling of the uncertainty impacts related to the renewable resource and loads with the use of the UT method. There is a need to mention that wind speed, solar radiation, tidal current, and demand and correlation among them can be modeled by the proposed method. The UT model is shown by F = f ^ R in which the output of uncertainty function (U) is calculated by using 2b + 1 points. According to the average value and the standard deviation of variables indicated by z   and   A , the normal distribution function is provided for each variable. The modeling procedure of the UT method is simulated in (1) to (3):
Step 1: 2b + 1 points are computed with the use of (39)–(41) as below:
R 0 = z
R k = z + p 1 W 0 A a a k k = 1 , 2 , , b
R k + c = z p 1 W 0 A a a k k = 1 , 2 , , b
In Equations (37)–(39), A a a indicates the covariance matrix and R ¯ = z .
Step 2: Weights pertaining to all points determined in (40) and (41) are calculated by (42):
W k = 1 W 0 2 c k = 1 , 2 , , 2 c
It is important to note that the sum of the weights should be equal to 1.
Step 3: The points defined by step 1 are inserted into the nonlinear function F k = f ^ R k and then, the output values are calculated as follows:
F ¯ = k = 0 2 p W k F k
P F F = k = 1 2 p W k F k F ¯ F k F ¯ T

5. Simulation Results

To prove and validate the explanations described in previous sections, it is significant that the outcome of this article resulted according to the vulnerability analysis for technical and cyber-aspects. To this end, we try to first execute a microgrid deployment into the smart grid structure in normal and contingency conditions. From a technical standpoint, this section will examine and assess the critical areas of the smart grid and represent the overthrow of the vulnerability indices for the sake of exchanging power between the microgrid and the grid in the most proper time. In the case of the second viewpoint, we check the successful probability of the launching attack in the smart grid regarding the multi-layer-based proposed security scheme compared to the other approaches. It is axiomatic that the smart grid structure comprises fossil fuel, buses, feeders, and loads, all of which are located in the IEEE 24-bus case study. Figure 6 shows the single line schematic of the IEEE 24-bus grid. The technical characteristics of smart grid and microgrid are taken by [37,39], respectively. Table 2 also expresses some parameters related to each bus that are part of a criterion for assessing the vulnerability. It should be mentioned that each of the buses is also a node that connects the blockchain platform to the smart grid [44]. In addition, the microgrid aims to supply the load demands embedded in the far away from the grid with the use of some renewable resources, including photovoltaic, wind unit, tidal unit, and storage. The point of common coupling (PCC) will be in the place of the bus if the operation of the bus is the responsibility of RES. On the other hand, the primary controller sends out the command of islanding mode when the voltage security margin is endangered; however, the aim of the simulation is to improve the vulnerability through the RESs. Therefore, the scenarios are designed to realize the aim of the investigation.
For more clarification about the above concepts, we try to first find and assess the vulnerable areas related to the smart grid taking into account the objective functions (13), (14), and (27) and the relevant constraints (3–13) and (15–35) based on case (I). Then, we implement the multi-layer security platform proposed in Section 3 on the vulnerable points of the smart grid and prove the usefulness of this framework compared to other methods in case II. In addition, case III aims to fulfill the modeling of uncertain parameters in accordance with relations (39– 44) and examinants its effects on the vulnerability assessment process. Simulation executed utilizing a computer with 4 GHz processor, core i7, and 16 GB of RAM in GAMS software environment using CPLEX solver for MILP problems, which is linked with MATLAB software.
Case I: Assessing and relieving the vulnerability indices in the smart grid
Case II: validating the multi-layer based proposed security approach
Case III: the impact of uncertainty on the vulnerable points of the studied case

5.1. Assessing and Relieving the Vulnerability Indices in the Smart Grid

This part is focused on the microgrid’s effectiveness at reducing the smart grid vulnerability when an unexpected outage of the sundry equipment, including the lines and generation unit, happens [51,52,53]. To do so, we implemented the smart grid structure considering a special microgrid in the first place and provided information on how the power is transferred between them. These results can be seen in Figure 7 and Figure 8. Assume that the positive value of power represents the power exchanging from the microgrid to the smart grid and vice versa. As it can be seen in Figure 7, the microgrid transfers the different ranges of power to the smart grid during the 24-h scheduling horizon. Such power fluctuations may have resulted from reasons such as the profile of loads located in the smart grid and the vulnerable areas of the grid. For instance, the maximum exchanging power is taken to be nearly 92 kW in hour 21 due to the load-peak at the same time. On the contrary, the power broadcasted from the microgrid to the smart grid shows a marked decline of almost 34 kW at hour 4. As it is mentioned in a previous part, the microgrid comprises the PV, WT, and tidal units. In addition, the battery system is used to satisfy the power balance in uncertain conditions pertaining to renewable resources. Hence, the output power of these units is represented in the form of generation power percent in Figure 8. It is clear that the range of utilizing PV units to supply the load demands and the needed power transaction is almost from t = 7 to t = 16. Changing the generation power percent related to each unit is dependent on the energy price and the relevant unit capacity at each hour as indicated in Figure 8. This topic needs to be opened up for economic discussion, the results of which are indicated in Table 3. Comparing the smart grid operation incorporating microgrid to the ignoring connection link can reveal that this framework is useful to reduce the operation cost of both parties. Results are clear that the considered structure leads to achieving a marked cost decline from 7,087,396,670 ¢ to 2,208,945,142¢. This means that the microgrid can have notable effectiveness at scheduling in critical situations within the smart grid.
For the aforementioned reasons, we decide to accomplish such a scheduling framework aiming to dwindle the significant effects of the smart grid vulnerability. To prove this, there is a need to first carry out the vulnerability modeling of the grid to get the assessment and finding of the different vulnerable areas within the smart grid. To this end, we implement the formulation of vulnerability indices, which is defined in (1)–(13) and the relevant results are demonstrated in Figure 9 and Figure 10. It is significant to say that the vulnerability rate pertaining to each piece of equipment is calculated for the condition in which all lines and generators are separately eradicated in the grid structure for any reason. Keeping this issue in mind, the vulnerability rate related to each generation unit named NGO index can be seen in Figure 9. Regarding the relevant consequence, the points marked by multiplication sign reply to the generation units taken at approximately high vulnerability rate arising from the outage of lines and generators compared to the other units. In other words, the NGO indices related to the G1, G2, G3, G4, and G10 take up to a level that has overtaken the threshold. This means that a failure in any area of the grid can have more effect on these areas identified as the more sensitive and vulnerable points than the other areas. In the same way, the NLO index indicating the vulnerability rate of each line is computed in accordance with Figure 10. As can be seen in this figure, some lines take more NLO index than the threshold, which is a compelling reason to highlight the vulnerable lines.
Following the vulnerable areas of the smart grid, reducing the grid vulnerability with the use of the defined points can be guaranteed by the interconnected microgrid and smart-grid-based framework against unexpected events. In other words, such an energy management framework can be trustworthy to prevent cascading failures and blackouts with the use of injecting power at the proper times within the smart grid. To prove this proposition, we carry out the smart grid under different events considering the microgrid and compared to the scenario of ignoring the microgrid within the grid. By doing so, the comparative results for considering and ignoring the microgrid are provided in Figure 11, Figure 12, Figure 13 and Figure 14. The outage of simulation shows that the microgrid leads to get a marked decline for the NGO indices ranging from 28% to 57% as represented in Figure 11. Similarly, for the generator outage, comparing the NLO indices for scenarios of ignoring and considering microgrid proves the microgrid’s effectiveness at reducing the line vulnerability of the smart grid (see Figure 12). Moreover, Figure 13 and Figure 14 show the comparison of the total cost of the smart grid for the relevant scenarios including the outage of all lines and generators, separately. As it can be seen, the total cost of the grid takes the least detriment using the proposed framework when occurring different events.

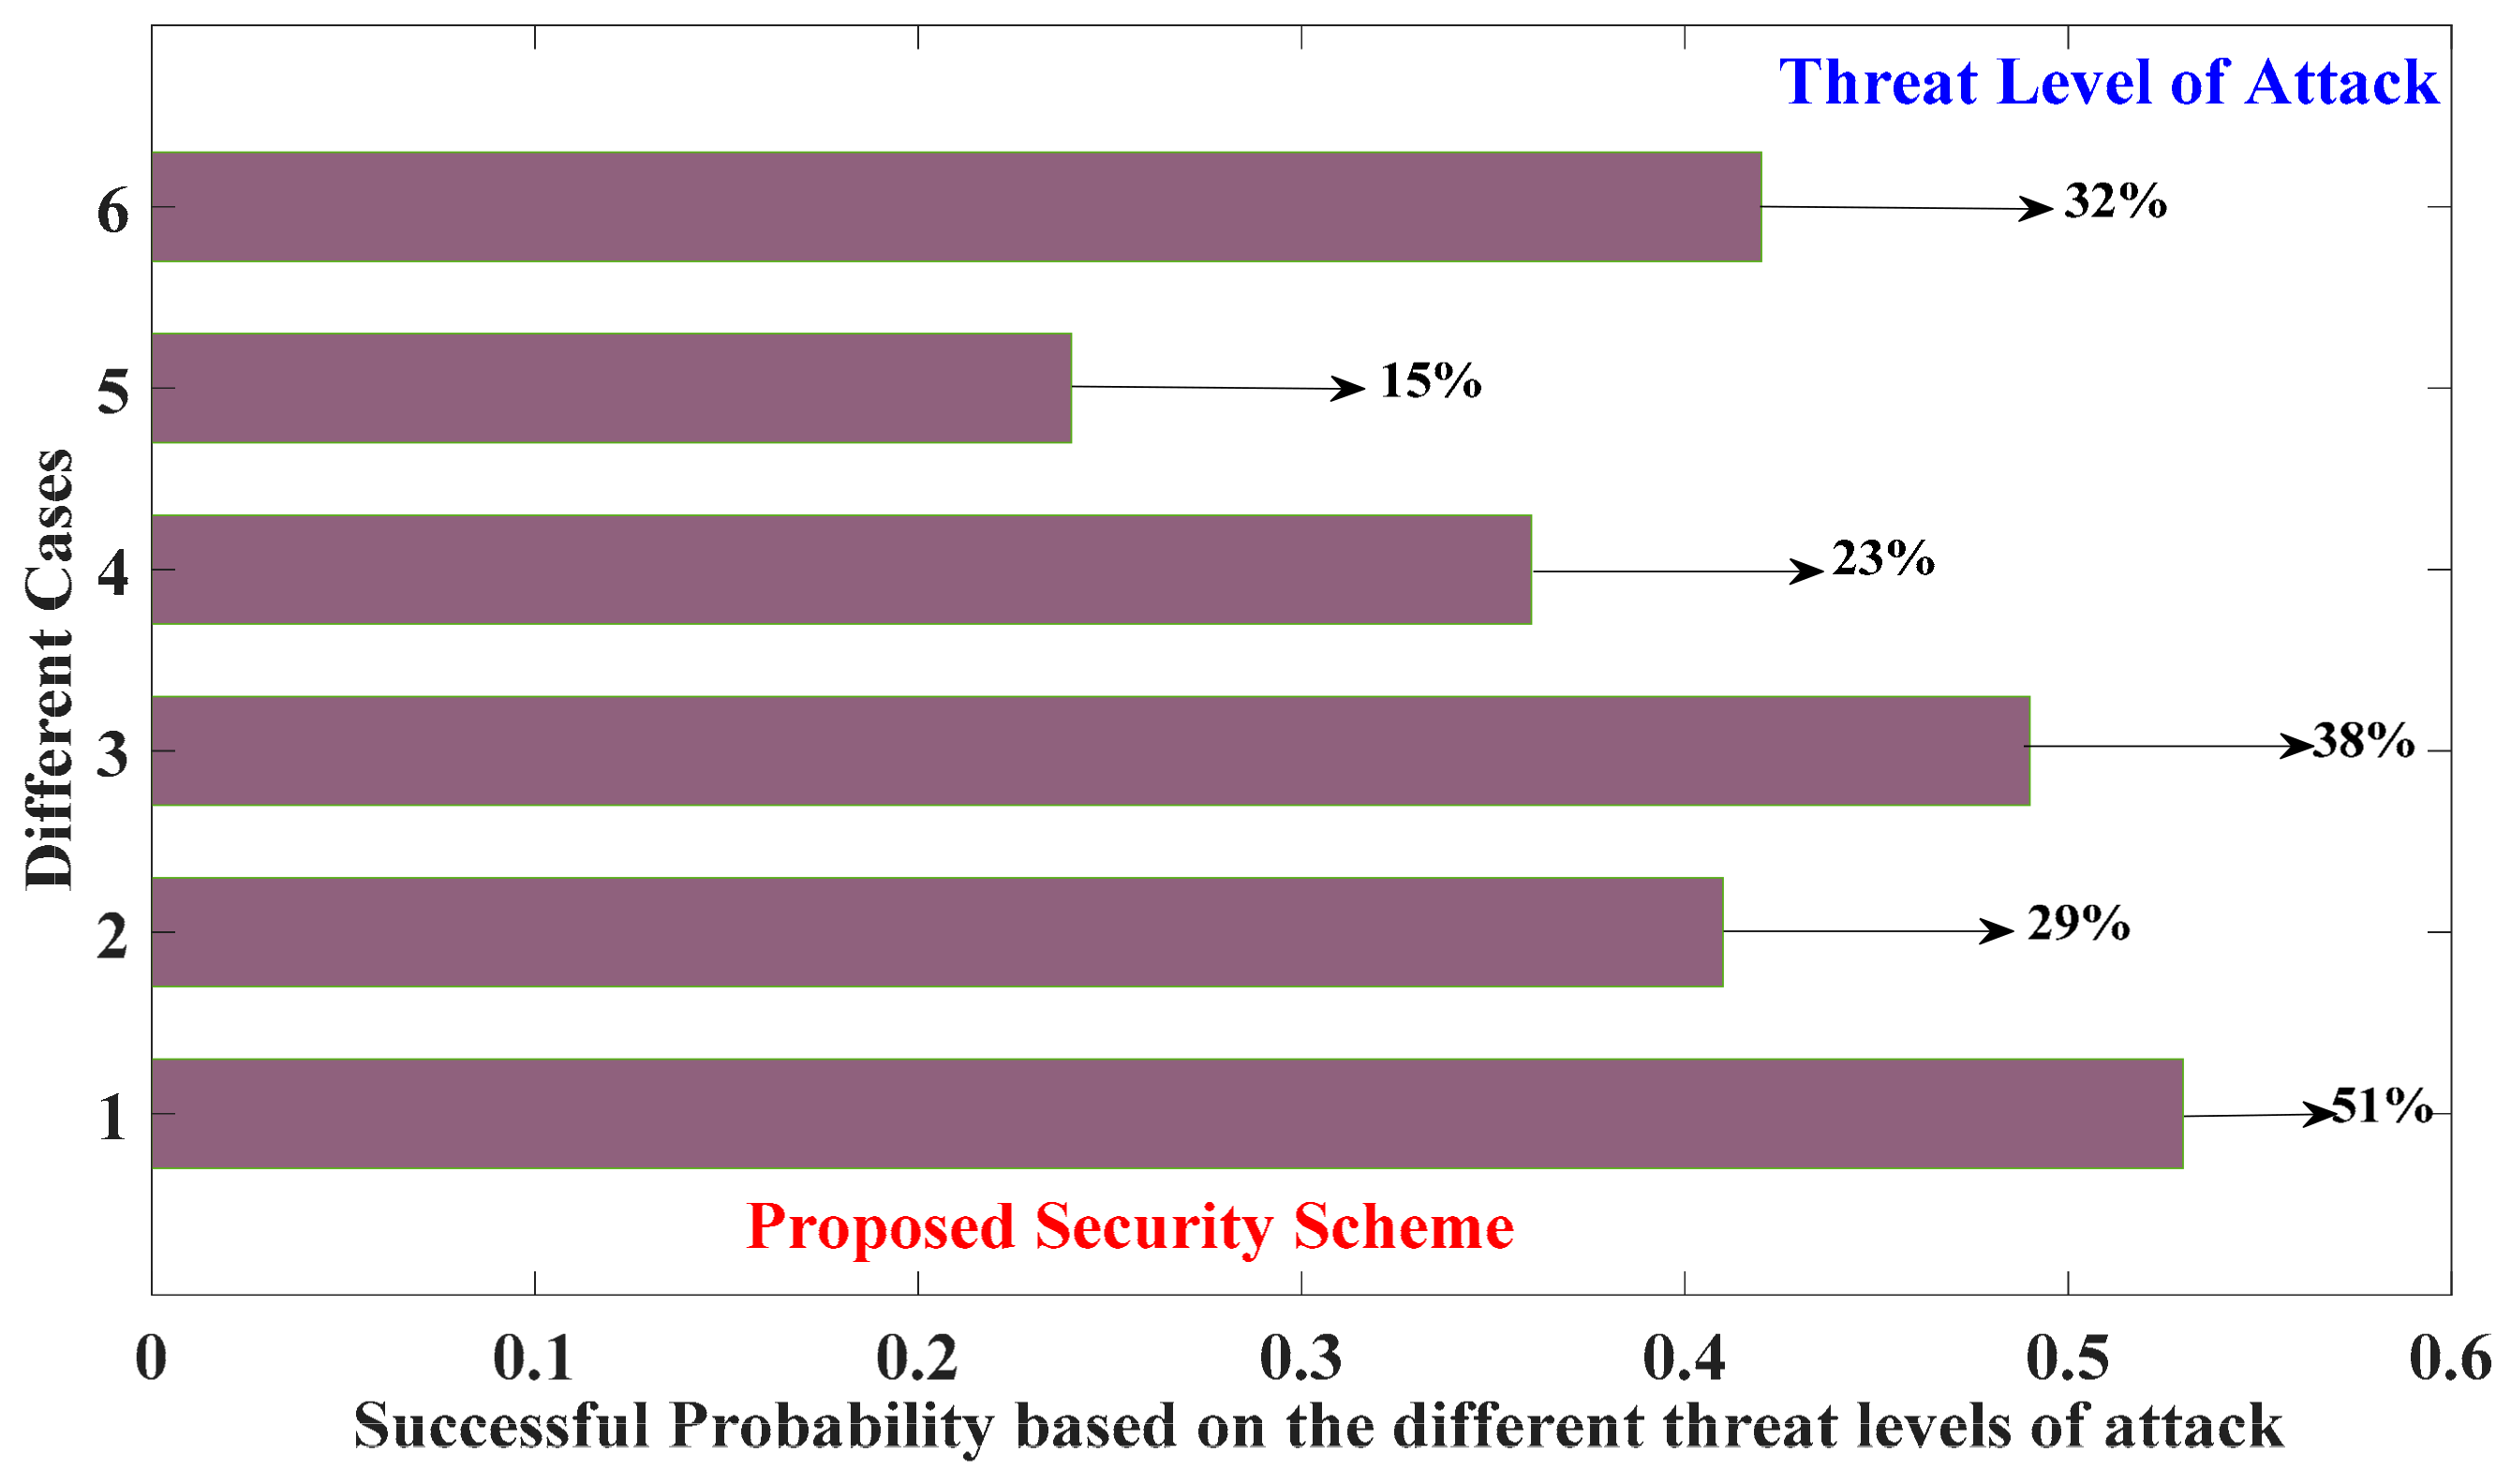
5.2. Validating the Multi-Layer Based Proposed Security Approach

This section is dedicated to illustrating and validating the efficiency of the multi-layer security approach against cyber-attacks. To this end, we try to use the probability computing approach to reveal the probability of successful attacks. In addition, validating this method is represented by comparing to the other methods such as single-layer security based on machine learning and blockchain concepts. As it was said in previous sections, the blockchain technology in this approach is utilized to secure and cover over the network as the public defense in the first place. On the other hand, the machine-learning-based private defense as the second layer is obliged to only safe the vulnerable and sensitive points of the grid to prevent the unauthorized access of hackers. Keeping this brief description in mind, it is needed to first provide how the blockchain system can secure the network. In this paper, we focus on an attack of FDI type in order to calculate the probability and assess the functionality of the blockchain. It is significant to say that such attacks do not interrupt the network but they will lead to misgiving. Hence, the attacker tries to penetrate the network for an FDI attack. This work can be carried out everywhere in the network. When making a cyber-penetration within the network, it is needed to compute the probability of an attack launched by hackers. Hence, the successful probability of attacks for carrying out destruction can be achieved in the following:
λ = h ( X d + c ) h ( X d )
P a = 1 3 k = 1 n k
where, 0 k 1 , k = 1 ,   2 ,   ,   n ,   ,   N .
In the above equation, ⋋ is the attack vector, c is a factor that defines the alternation of data due to the attack Xd defines the data of the system. As h() shows the function of the measurement device based on the relevant data can be different for each device. The success probability of attack ( P a ) can be computed by Equation (46) in which n is the number of attacks and ⋋ indicates the occurring probability of attack in iteration k for the system. In addition, the attack needs to update its data to delude the system’s devices.
According to the argument aforementioned, the Sabotage probability in the network is dependent on the type of cyber-security scheme considered for preventing attacks. Firstly, we implement three cases based on the security approach including, case1: the single-layer security schemes based on the machine learning method, case 2: the block-chain-based single-layer security case 3: the multi-layer based proposed security method. Moreover, we try to prove the proposed security framework (case 3) in order to prevent the attack in vulnerable areas of the network structure compared to the other cases. In the first step, we as an FDI attack apply the incorrect data to the measurement devices based on (45) in order to monitor these data for the network operator. This process continues for iteration number 100 under launching three cases based on the security scheme (second step). As the last step, we compute the successful probability of attack for three schemes considering Equation (46). For instance, regarding the reinforcement learning method (case 1), the occurring probability of attack will be 1 if not detected by the RL method. This description can be expanded for other cases in order to calculate the attack probability in system. In this regard, by launching a FDI attack in the network, the successful probabilities of this attack for three cases are calculated and represented in Figure 15. It can be seen in this figure, by increasing the percentage of iteration, the successful probability of attack in the proposed method is more downtrend than case 1 and case 2 for the various iterations. This means that the double-layer-based proposed security framework can be a hard barrier for hackers to gain access to the critical points within the network. On the other hand, according to Table 4, the security system can decrypt more data by merging blockchain and RL compared with the two others. As expressed in previous sections, the penetration of cyber-attacks to the blockchain system depends on the needed computational power to solve the mathematical function named consensus approach among nodes of network [45]. Hence, evaluating the studied case for the different threat levels of attack concerning its computational power may prove the proposed security framework’ effectiveness. To do so, we consider randomly the different power percentages of attack including 15%, 23%, 32%, 29%, 38% and 51% and indicate the relevant consequence by Figure 16. It can be deducted that the occurring probability of attack under the suggested framework for most cases takes a decreasing percentage less than 50%. This means that the double-layer security structure may remarkably be trustable to cover the exchanging data of grid against the targeted cyber-attacks. All to all, developing such scheme in the smart grid leads to decline the cascading failures and blackouts, which are happened through making the cyber-attacks in the vulnerable regions of the grid assessed by the relevant indices (refer to Section 2).

5.3. The Effect of Uncertainty on the Vulnerable Points of the Studied Case

This part tries to express how the uncertainty effects can be significant on achieving over goals considered in this paper. On the other hand, concerning the uncertainty model for scheduling the energy management of the smart grid based on the proposed framework is a must. Moreover, it is needed to check how the uncertainty modeling can change the vulnerability rates of different areas within the grid. To realize this issue, we deploy the UT method based on uncertain parameters in the energy scheduling of the smart grid regarding the proposed framework. In addition, we provide the consequence related to uncertainty impacts on the different significant aspects including the power exchange between two the electrical grids, financial management of the smart grid and the vulnerability indices, which is the most important goal in this section. Hence, Figure 17, Figure 18 and Figure 19 indicate the relevant results of uncertainty modeling. As it was mentioned before, the power exchange between the microgrid and the smart grid is determined concerning different criteria aiming to get the vulnerability rate reduction. Figure 17 shows the power injection of the microgrid to the smart grid for both deterministic and stochastic scenarios, respectively. According to Figure 17, altering energy exchange in the stochastic model compared to scenario one proves that it is necessary to think about the uncertainty modeling in scheduling to get effective and accurate energy management. The important facts about the various situations will be twigged by observing Figure 17a,b. The cumulative diagram of power exchange across 24 h between stochastic and normal manners have a lot of conflict with each other (Figure 17b), although the difference between them is insignificant for 24 h in a one by one manner (Figure 17a). It is inferred that we should watch out for failure in schedules if we ignore the impact of uncertainty. Hence, we try to indicate the results related to case I for uncertainty state as shown by Figure 20 and Figure 21. In addition, the strategy’s effectiveness proposed in part I in order to reduce the costs is obviously proven based on the uncertainty by Table 5. As a second goal, Figure 19 shows the comparison of the NGO and NLO indexes related to the study case in both uncertainty and deterministic scenarios. For instance, we assume that the outages of lines 22, 15, and the generation unit 15 happened within the smart grid and the relevant vulnerability indexes on a case-by-case basis are represented. The consequences indicate that the uncertainty model causes varied changes ranging from 2%, 3.5%, and 10% in the vulnerability rates of the smart grid compared to scenario one, respectively. This results in the microgrid’s effectiveness at preventing the cascading events in the smart grid, which will be seen if the uncertainty effects are modeled using the UT method. Comparing the costs pertaining to microgrid and the smart grid in the uncertain condition with the normal one (refer to Figure 18), it is seen that the costs of microgrid, smart grid, and total cost take higher fluctuations, which are 2%, 23%, and 1.4%, respectively (see Figure 18). To sum, the smart grid is better to make use of the uncertainty framework to assess the vulnerable areas in the grid and to get effective scheduling in the bargaining power with the microgrid.

6. Conclusions

This paper proposed a targeting framework to reduce the vulnerability indices of the smart grid. To actualize this target, two separate approaches have been deployed. The first approach addresses reducing vulnerability indices in terms of technical criteria. The second one focused on providing a cyber-security protocol to make an obstacle against the penetration of cyber-hackers. In the technical approach, the microgrid prevented the occurrence of cascading outages with the use of making a bilateral energy exchange with the smart grid. The most obvious finding to emerge from this part is a significant reduction in the network vulnerability indices owing to the cooperating microgrid. In the security respect, a multi-layer cyber-security protocol has been performed in this investigation. As already mentioned, the detection of the vulnerable points can be considered from an attacker’s view as well. This can be an important issue for future research. One of the more significant findings to emerge from this part is the effectiveness of the proposed multi-layer protocol in comparison with the other approaches. On the other hand, the measuring of network vulnerability would be incorrect if the uncertainty parameter is not taken into account. For the future scope of this work, the recent vulnerability-scoring models can be considered in other to provide an accurate method in the study or in future works. In the same vein, the utility of the adopted multi-layer method includes merged blockchain, and RL can compare to other state-of-the-art approaches such as smart grids cyber security toolbox. In future works, the authors would make use of new advanced cybersecurity software such as SGIS to check information security.

Author Contributions

J.C.: Conceptualization, Validation, Investigation, Writing—Review & Editing. M.A.M.: Conceptualization, Methodology, Software, Validation, Investigation, Visualization, Supervision, Writing—Original Draft, Writing—Review & Editing. U.D.: Conceptualization, Investigation, Visualization, Writing—Review & Editing. M.R.: Conceptualization, Investigation, Visualization, Writing—Review & Editing. S.H.S.: Conceptualization, Investigation, funding acquisition, Visualization, Writing—Review & Editing. S.A.O.: Conceptualization, Investigation, funding acquisition, Visualization, Writing—Review & Editing. A.A.: Conceptualization, Investigation, Visualization, Writing—Review & Editing. All authors have read and agreed to the published version of the manuscript.

Funding

This research received no external funding.

Institutional Review Board Statement

Not applicable.

Informed Consent Statement

Not applicable.

Data Availability Statement

The data supporting reported results are available in the manuscript.

Acknowledgments

This project was supported by Researchers Supporting Project number (RSP-2021/385), King Saud University, Riyadh, Saudi Arabia. Furthermore, the authors would like to thank the Estonian Centre of Excellence in Zero Energy and Resource Efficient Smart Buildings and Districts, ZEBE, grant TK146, funded by the European Regional Development Fund to support this research. This work is partially supported by (1) scientific research project of Fuzhou Polytechnic under Grant FZYKJRCQD202101 (2) Fujian Key Laboratory of New Energy Generation and Power Conversion under Grant KLIF-202102 (3) Key research topics of educational reform of Fuzhou Polytechnic under Grant 2021jgkt001.

Conflicts of Interest

The authors declare no conflict of interest.

Nomenclature

Sets/Indices
l / Ω l Set/index for feeder
g / Ω g Set/index for power unit
t / Ω T Set/index for hour
b , m / Ω b , m Set/index of bus bar
Limitations
Z Solar energy
R L l o s s PV losses
U t V /SWind speed/density
X c u t i n V , X r a t e d V Tidal cut-in speed and rated speed
Q Direct irradiation
γ Water density
P Seawater density
λ Brushed area of the turbine blades
C Rotor blade area
X l , R l , X l 0 Technical characteristics of line
S t , g , D t , g Unit start-up, shut down
E t P V PV Capacity
P   g , t     , Q   g , t     Smart grid demand
R t Power transaction price
X t V Current speed of tidal
P r a t e d T I Rated generation of tidal
V min , V max High/low limits for storage system
P   t l o a d S Microgrid demand
P m i n , P m a x Active power limitations
P l m i n , P l m a x Line active power limitations
Q l m i n , Q l m a x Line reactive power limitations
Q m i n , Q m a x Reactive power limitations
D G + , D G Up/down Limits of reserve
T V min , T V max Limits of voltage
η b m i n , η b m a x Limits of angle
P b , t L o a d Smart grid active demand in each bus
Q b , t L o a d Smart grid reactive demand in each bus
r c Generation price of the generator.
R W t , R T t , R V t , R B t Bidding offer for WT, tidal, PV and battery
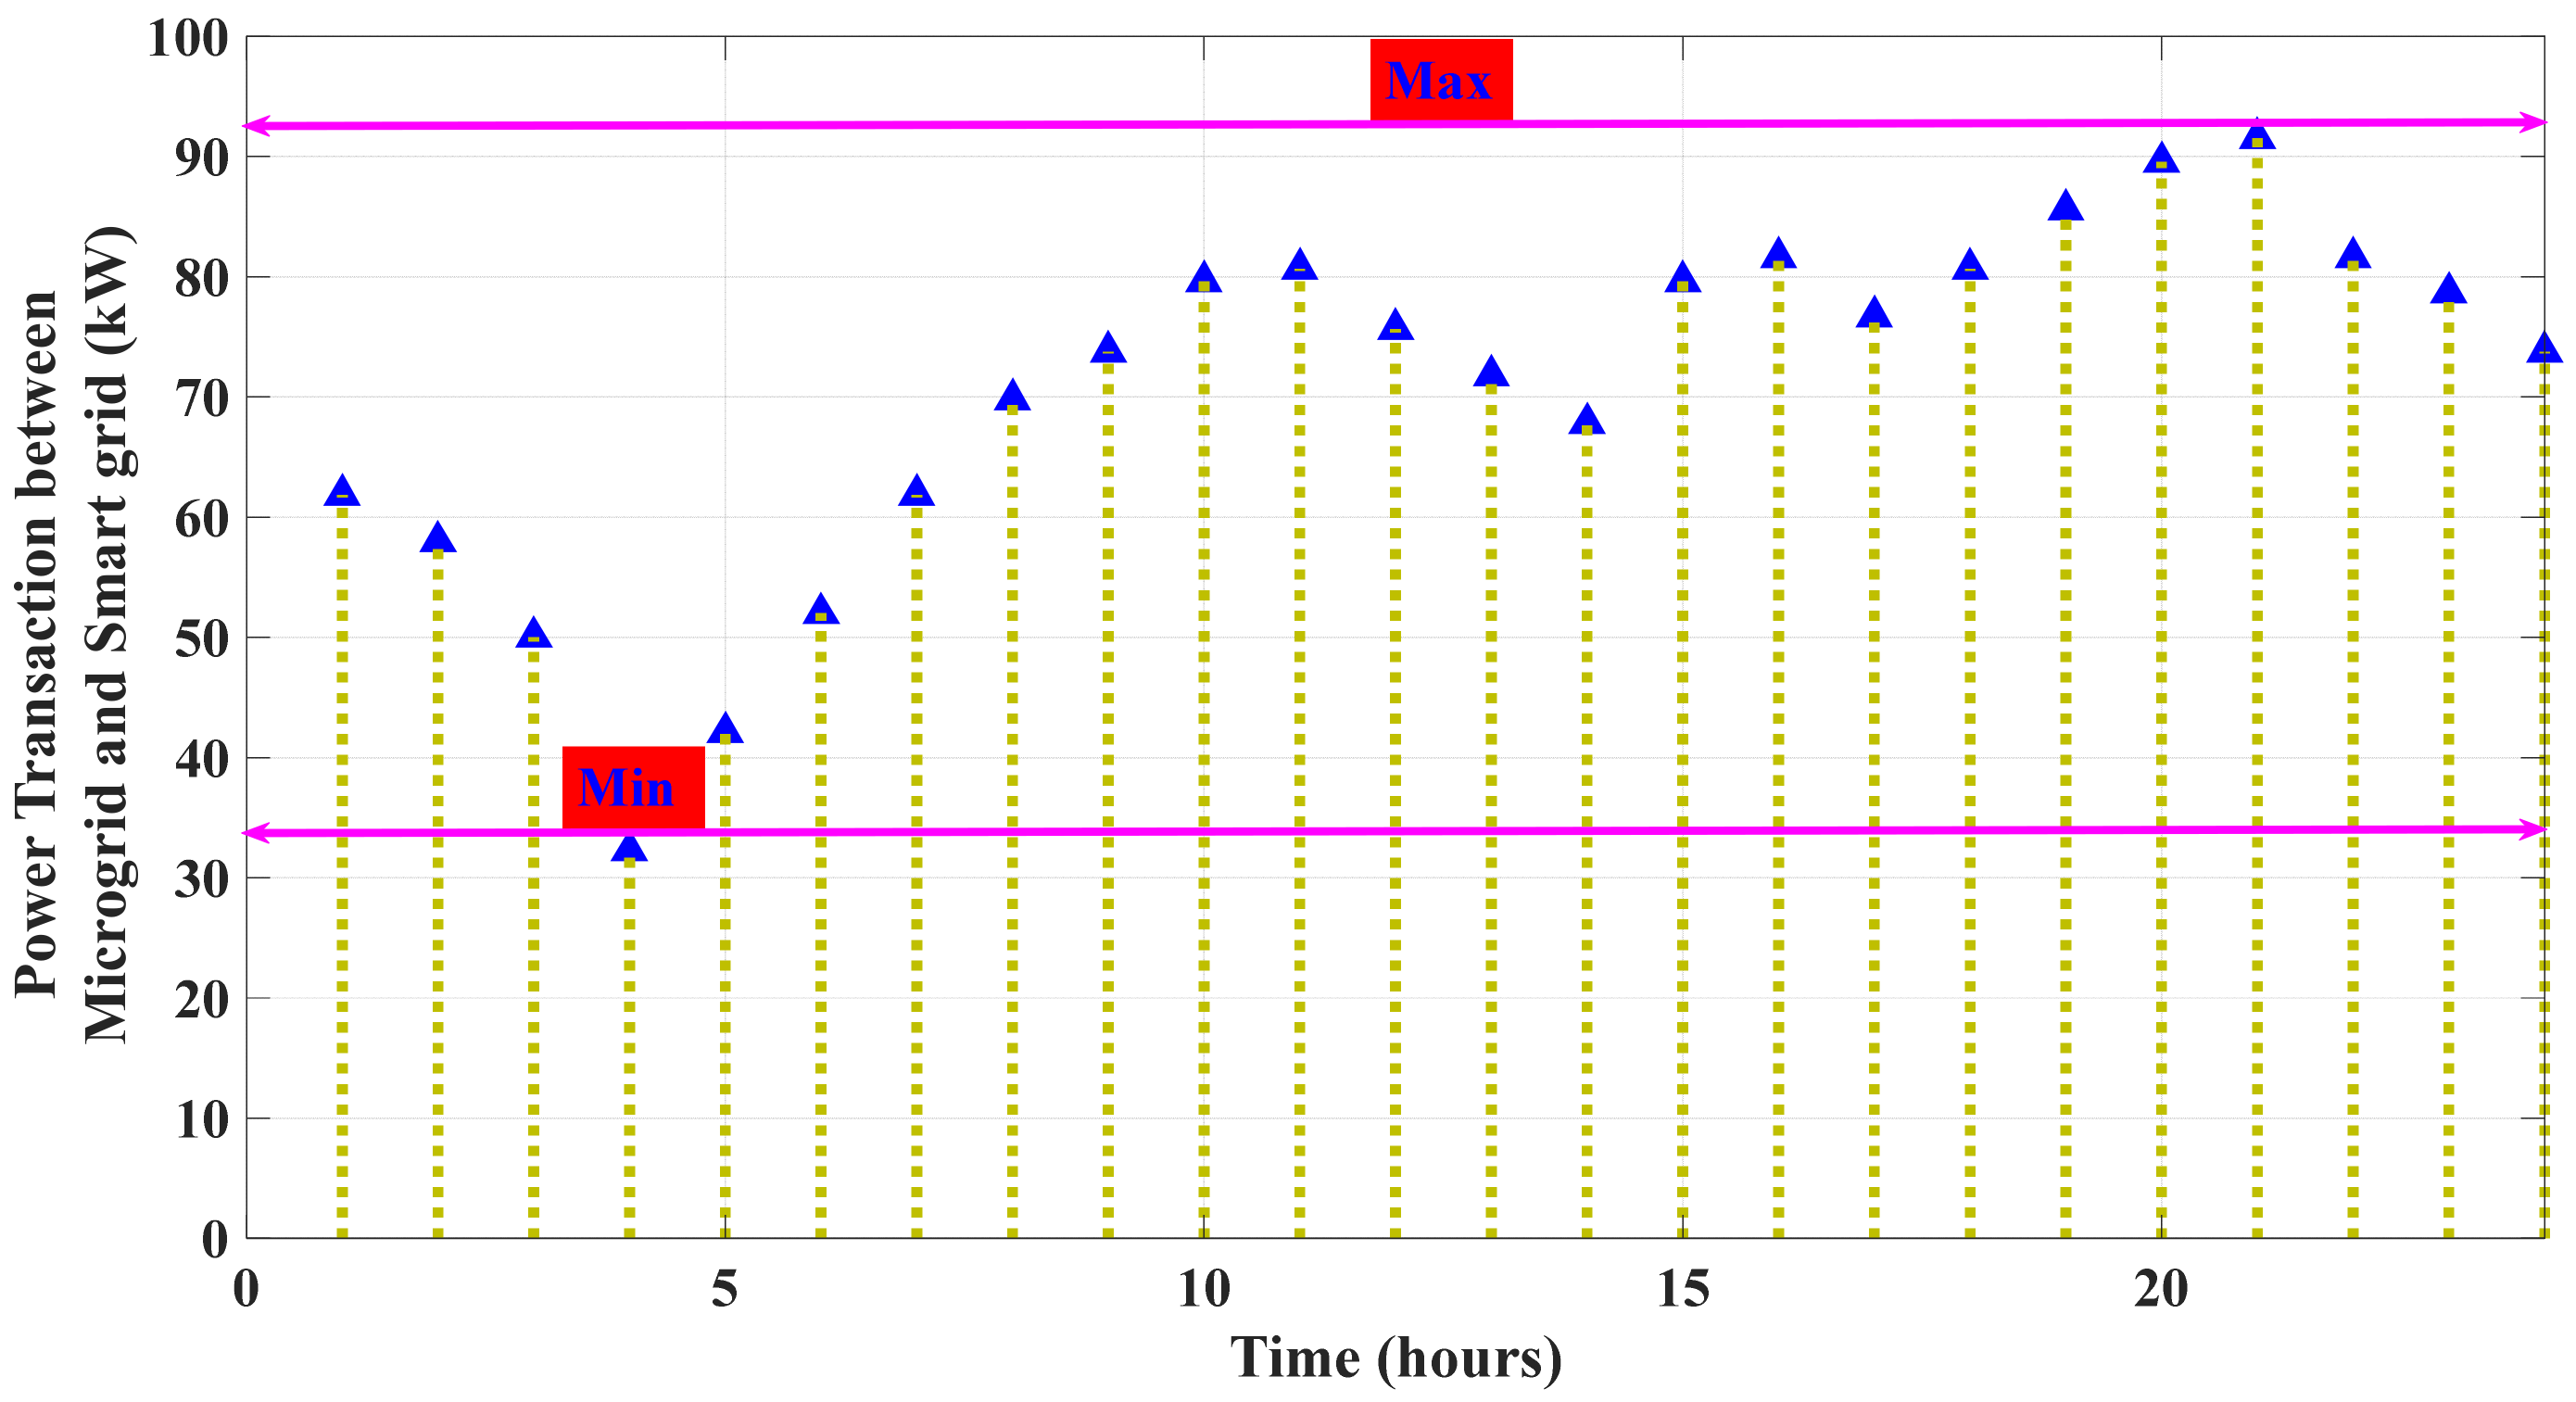
P g max , P g min , Q g max , Q g min High or low limit of the power transaction
z , w Mean and variance
W 0 weight of the mean value
A a a covariance matrix
cNumber of uncertain parameters
R vector of stochastic inputs
Variables
P   t   B , P t W , P t T I , P t P V Generation amount of storage, WT, tidal and PV
B b k Line outage index of bus b
V I B b k Bus index
L l k Line outage index of line l
V I L l k line index
G g k unit outage active index of line l
V I G g k unit index
Q g k unit outage reactive index of line l
V I Q g k unit index
Q t , g , Q l , t Generator and feeder reactive power at time t.
P t , g , P l , t Generator and line active power at time t.
M P   t   T S Power trade between microgrid and smart grid.
P t c h , P t d i s Charging/Discharging rate.
z κ t , g Binary variables of the generator.
T V b , η b Bus voltage or angle.
V   t   B Energy of battery.
m i n c o s t g r i d , m i c r o g r i d Operation cost functions of smart grid and microgrid.

References

  1. Tan, H.; Yan, W.; Ren, Z.; Wang, Q.; Mohamed, M.A. A robust dispatch model for integrated electricity and heat networks considering price-based integrated demand response. Energy 2022, 239, 121875. [Google Scholar] [CrossRef]
  2. Avatefipour, O.; Al-Sumaiti, A.S.; El-Sherbeeny, A.M.; Awwad, E.M.; Elmeligy, M.A.; Mohamed, M.A.; Malik, H. An Intelligent Secured Framework for Cyberattack Detection in Electric Vehicles’ CAN Bus Using Machine Learning. IEEE Access 2019, 7, 127580–127592. [Google Scholar] [CrossRef]
  3. Abedi, A.; Gaudard, L.; Romerio, F. Review of major approaches to analyze vulnerability in power system. Reliab. Eng. Syst. Saf. 2019, 183, 153–172. [Google Scholar] [CrossRef]
  4. Mohamed, M.A.; Chen, T.; Su, W.; Jin, T. Proactive Resilience of Power Systems against Natural Disasters: A Literature Review. IEEE Access 2019, 7, 163778–163795. [Google Scholar] [CrossRef]
  5. Liu, Y.; Jin, T.; Mohamed, M.A.; Wang, Q. A Novel Three-Step Classification Approach Based on Time-Dependent Spectral Features for Complex Power Quality Disturbances. IEEE Trans. Instrum. Meas. 2021, 70, 1–14. [Google Scholar] [CrossRef]
  6. Shahzad, U. Vulnerability Assessment in Power Systems: A Review. J. Electr. Eng. Electron. Control. Comput. Sci. 2021, 7, 17–24. [Google Scholar]
  7. Doorman, G.; Uhlen, K.; Kjølle, G.; Huse, E. Vulnerability Analysis of the Nordic Power System. IEEE Trans. Power Syst. 2006, 21, 402–410. [Google Scholar] [CrossRef]
  8. Velloso, A.; Van Hentenryck, P. Combining Deep Learning and Optimization for Preventive Security-Constrained DC Optimal Power Flow. IEEE Trans. Power Syst. 2021, 36, 3618–3628. [Google Scholar] [CrossRef]
  9. Mohamed, M.A.; Al-Sumaiti, A.S.; Krid, M.; Awwad, E.M.; Kavousi-Fard, A. A Reliability-Oriented Fuzzy Stochastic Framework in Automated Distribution Grids to Allocate m-PMUs. IEEE Access 2019, 7, 33393–33404. [Google Scholar] [CrossRef]
  10. Song, H. Static analysis of vulnerability and security margin of the power system. In Proceedings of the 2005/2006 IEEE/PES Transmission and Distribution Conference and Exhibition, IEEE, Dallas, TX, USA, 21–24 May 2006; pp. 147–152. [Google Scholar]
  11. Yu, X.; Singh, C. A practical approach for integrated power system vulnerability analysis with protection failures. IEEE Trans. Power Syst. 2004, 19, 1811–1820. [Google Scholar] [CrossRef]
  12. Mohseni-Bonab, S.M.; Kamwa, I.; Moeini, A.; Rabiee, A. Vulnerability Assessment in Power Systems: A Review and Representing Novel Perspectives. In Proceedings of the 2020 IEEE Power & Energy Society General Meeting (PESGM), IEEE, Montreal, QC, Canada, 2–6 August 2020; pp. 1–5. [Google Scholar]
  13. Ernster, T.A.; Srivastava, A.K. Power system vulnerability analysis-towards validation of centrality measures. In Proceedings of the PES T&D 2012, IEEE, Orlando, FL, USA, 7–10 May 2012; pp. 1–6. [Google Scholar]
  14. Bulat, H.; Franković, D.; Vlahinić, S. Enhanced Contingency Analysis—A Power System Operator Tool. Energies 2021, 14, 923. [Google Scholar] [CrossRef]
  15. Tordecilla, R.D.; Juan, A.A.; Montoya-Torres, J.R.; Quintero-Araujo, C.L.; Panadero, J. Simulation-optimization methods for designing and assessing resilient supply chain networks under uncertainty scenarios: A review. Simul. Model. Pract. Theory 2021, 106, 102166. [Google Scholar] [CrossRef]
  16. Donde, V.; Lopez, V.; Lesieutre, B.; Pinar, A.; Yang, C.; Meza, J. Severe Multiple Contingency Screening in Electric Power Systems. IEEE Trans. Power Syst. 2008, 23, 406–417. [Google Scholar] [CrossRef]
  17. Min, L.; Alnowibet, K.A.; Alrasheedi, A.F.; Moazzen, F.; Awwad, E.M.; Mohamed, M.A. A stochastic machine learning based approach for observability enhancement of automated smart grids. Sustain. Cities Soc. 2021, 72, 103071. [Google Scholar] [CrossRef]
  18. Abedi, A.; Hesamzadeh, M.R.; Romerio, F. Adaptive robust vulnerability analysis of power systems under uncertainty: A multilevel OPF-based optimization approach. Int. J. Electr. Power Energy Syst. 2022, 134, 107432. [Google Scholar] [CrossRef]
  19. Ramadan, H.S.; Helmi, A. Optimal reconfiguration for vulnerable radial smart grids under uncertain operating conditions. Comput. Electr. Eng. 2021, 93, 107310. [Google Scholar] [CrossRef]
  20. Athari, H.; Wang, Z. Enhanced AC quasi-steady state cascading failure model for grid vulnerability analysis under wind uncertainty. In Proceedings of the 52nd Hawaii International Conference on System Sciences, Maui, HI, USA, 8 January 2019. [Google Scholar]
  21. Kritikos, K.; Papoutsakis, M.; Ioannidis, S.; Magoutis, K. Towards Configurable Vulnerability Assessment in the Cloud. In Proceedings of the 2019 IEEE 24th International Workshop on Computer Aided Modeling and Design of Communication Links and Networks (CAMAD), IEEE, Limassol, Cyprus, 11–13 September 2019; pp. 1–6. [Google Scholar]
  22. Abedi, A.; Gaudard, L.; Romerio, F. Power flow-based approaches to assess vulnerability, reliability, and contingency of the power systems: The benefits and limitations. Reliab. Eng. Syst. Saf. 2020, 201, 106961. [Google Scholar] [CrossRef]
  23. Chu, Z.; Zhang, J.; Kosut, O.; Sankar, L. Vulnerability assessment of large-scale power systems to false data injection attacks. In Proceedings of the 2020 IEEE International Conference on Communications, Control, and Computing Technologies for Smart Grids (SmartGridComm), IEEE, Tempe, AZ, USA, 11–13 November 2020. [Google Scholar]
  24. Mishra, S.; Anderson, K.; Miller, B.; Boyer, K.; Warren, A. Microgrid resilience: A holistic approach for assessing threats, identifying vulnerabilities, and designing corresponding mitigation strategies. Appl. Energy 2020, 264, 114726. [Google Scholar] [CrossRef] [Green Version]
  25. Motto, A.; Arroyo, J.; Galiana, F. A Mixed-Integer LP Procedure for the Analysis of Electric Grid Security under Disruptive Threat. IEEE Trans. Power Syst. 2005, 20, 1357–1365. [Google Scholar] [CrossRef]
  26. Veloza, O.P.; Cespedes, R.H. Regulatory mechanisms to mitigate the vulnerability of power systems to blackouts. In Proceedings of the 2006 IEEE/PES Transmission & Distribution Conference and Exposition: Latin America, IEEE, Caracas, Venezuela, 15–18 August 2006; pp. 1–6. [Google Scholar]
  27. Feng, Z.; Ajjarapu, V.; Maratukulam, D. A comprehensive approach for preventive and corrective control to mitigate voltage collapse. IEEE Trans. Power Syst. 2000, 15, 791–797. [Google Scholar] [CrossRef]
  28. Mohamed, M.A.; Almalaq, A.; Abdullah, H.M.; Alnowibet, K.A.; Alrasheedi, A.F.; Zaindin, M.S.A. A Distributed Stochastic Energy Management Framework Based-Fuzzy-PDMM for Smart Grids Considering Wind Park and Energy Storage Systems. IEEE Access 2021, 9, 46674–46685. [Google Scholar] [CrossRef]
  29. Chen, Y.; Huang, S.; Liu, F.; Wang, Z.; Sun, X. Evaluation of Reinforcement Learning-Based False Data Injection Attack to Automatic Voltage Control. IEEE Trans. Smart Grid 2018, 10, 2158–2169. [Google Scholar] [CrossRef]
  30. Yan, J.; He, H.; Zhong, X.; Tang, Y. Q-Learning-Based Vulnerability Analysis of Smart Grid against Sequential Topology Attacks. IEEE Trans. Inf. Forensics Secur. 2017, 12, 200–210. [Google Scholar] [CrossRef]
  31. Sayeed, S.; Hector, M. Assessing blockchain consensus and security mechanisms against the 51% attack. Appl. Sci. 2019, 9, 1788. [Google Scholar] [CrossRef] [Green Version]
  32. Ferrag, M.A.; Maglaras, L. DeepCoin: A Novel Deep Learning and Blockchain-Based Energy Exchange Framework for Smart Grids. IEEE Trans. Eng. Manag. 2020, 67, 1285–1297. [Google Scholar] [CrossRef] [Green Version]
  33. Mohamed, M.A.; Hajjiah, A.; Alnowibet, K.A.; Alrasheedi, A.F.; Awwad, E.M.; Muyeen, S.M. A Secured Advanced Management Architecture in Peer-to-Peer Energy Trading for Multi-Microgrid in the Stochastic Environment. IEEE Access 2021, 9, 92083–92100. [Google Scholar] [CrossRef]
  34. Bera, B.; Saha, S.; Das, A.K.; Vasilakos, A.V. Designing blockchain-based access control protocol in iot-enabled smart-grid system. IEEE Internet Things J. 2021, 8, 5744–5761. [Google Scholar] [CrossRef]
  35. Moeini, A.; Kamwa, I.; de Montigny, M.; Lenoir, L. Application of Battery Energy Storage for network vulnerability mitigation. In Proceedings of the 2016 IEEE/PES Transmission and Distribution Conference and Exposition (T&D), IEEE, Dallas, TX, USA, 3–5 May 2016; pp. 1–5. [Google Scholar]
  36. Mohamed, M.A.; Awwad, E.M.; El-Sherbeeny, A.M.; Nasr, E.A.; Ali, Z.M. Optimal scheduling of reconfigurable grids considering dynamic line rating constraint. IET Gener. Transm. Distrib. 2020, 14, 1862–1871. [Google Scholar] [CrossRef]
  37. Zou, H.; Tao, J.; Elsayed, S.K.; Elattar, E.E.; Almalaq, A.; Mohamed, M.A. Stochastic multi-carrier energy management in the smart islands using reinforcement learning and unscented transform. Int. J. Electr. Power Energy Syst. 2021, 130, 106988. [Google Scholar] [CrossRef]
  38. Chabok, H.; Roustaei, M.; Sheikh, M.; Kavousi-Fard, A. On the assessment of the impact of a price-maker energy storage unit on the operation of power system: The ISO point of view. Energy 2020, 190, 116224. [Google Scholar] [CrossRef]
  39. Yin, F.; Hajjiah, A.; Jermsittiparsert, K.; Al-Sumaiti, A.S.; Elsayed, S.K.; Ghoneim, S.S.; Mohamed, M.A. A secured social-economic framework based on PEM-blockchain for optimal scheduling of reconfigurable interconnected microgrids. IEEE Access 2021, 9, 40797–40810. [Google Scholar] [CrossRef]
  40. Ding, S.; Cao, Y.; Vosoogh, M.; Sheikh, M.; Almagrabi, A. A Directed Acyclic Graph Based Architecture for Optimal Operation and Management of Reconfigurable Distribution Systems with PEVs. IEEE Trans. Ind. Appl. 2020, 1. [Google Scholar] [CrossRef]
  41. Xiao, L.; Li, Y.; Han, G.; Liu, G.; Zhuang, W. PHY-Layer Spoofing Detection With Reinforcement Learning in Wireless Networks. IEEE Trans. Veh. Technol. 2016, 65, 10037–10047. [Google Scholar] [CrossRef]
  42. Kiros, S.; Khan, B.; Padmanaban, S.; Haes Alhelou, H.; Leonowicz, Z.; Mahela, O.P.; Holm-Nielsen, J.B. Development of Stand-Alone Green Hybrid System for Rural Areas. Sustainability 2020, 12, 3808. [Google Scholar] [CrossRef]
  43. Sheikh, M.; Aghaei, J.; Rajabdorri, M.; Shafie-khah, M.; Lotfi, M.; Javadi, M.S.; Catalão, J.P. Multiobjective Congestion Management and Transmission Switching Ensuring System Reliability. In Proceedings of the 2019 IEEE International Conference on Environment and Electrical Engineering and 2019 IEEE Industrial and Commercial Power Systems Europe (EEEIC/I&CPS Europe), IEEE, Genova, Italy, 11–14 June 2019; pp. 1–5. [Google Scholar]
  44. Kurt, M.N.; Ogundijo, O.; Li, C.; Wang, X. Online Cyber-Attack Detection in Smart Grid: A Reinforcement Learning Approach. IEEE Trans. Smart Grid 2019, 10, 5174–5185. [Google Scholar] [CrossRef] [Green Version]
  45. Shetty, S.; Kamhoua, C.A.; Njilla, L.L. (Eds.) Blockchain for Distributed Systems Security; John Wiley & Sons: Hoboken, NJ, USA, 2019. [Google Scholar]
  46. Ma, H.; Liu, Z.; Li, M.; Wang, B.; Si, Y.; Yang, Y.; Mohamed, M.A. A two-stage optimal scheduling method for active distribution networks considering uncertainty risk. Energy Rep. 2021, 7, 4633–4641. [Google Scholar] [CrossRef]
  47. Mohamed, M.A.; Mirjalili, S.; Dampage, U.; Salmen, S.H.; Obaid, S.A.; Annuk, A. A Cost-Efficient-Based Cooperative Allocation of Mining Devices and Renewable Resources Enhancing Blockchain Architecture. Sustainability 2021, 13, 10382. [Google Scholar] [CrossRef]
  48. Tan, H.; Ren, Z.; Yan, W.; Wang, Q.; Mohamed, M.A. A Wind Power Accommodation Capability Assessment Method for Multi-Energy Microgrids. IEEE Trans. Sustain. Energy 2021, 12, 2482–2492. [Google Scholar] [CrossRef]
  49. Rezaei, M.; Dampage, U.; Das, B.K.; Nasif, O.; Borowski, P.F.; Mohamed, M.A. Investigating the Impact of Economic Uncertainty on Optimal Sizing of Grid-Independent Hybrid Renewable Energy Systems. Process 2021, 9, 1468. [Google Scholar] [CrossRef]
  50. Mohamed, M.A.; Abdullah, H.M.; El-Meligy, M.A.; Sharaf, M.; Soliman, A.T.; Hajjiah, A. A novel fuzzy cloud stochastic framework for energy management of renewable microgrids based on maximum deployment of electric vehicles. Int. J. Electr. Power Energy Syst. 2021, 129, 106845. [Google Scholar] [CrossRef]
  51. Markakis, E.; Nikoloudakis, Y.; Pallis, E.; Manso, M. Security assessment as a service cross-layered system for the adoption of digital, personalised and trusted healthcare. In Proceedings of the 2019 IEEE 5th World Forum on Internet of Things (WF-IoT), IEEE, Limerick, Ireland, 15–18 April 2019; pp. 91–94. [Google Scholar]
  52. Mell, P.; Scarfone, K.; Romanosky, S. Common Vulnerability Scoring System. IEEE Secur. Priv. 2006, 4, 85–89. [Google Scholar] [CrossRef]
  53. Nikoloudakis, Y.; Pallis, E.; Mastorakis, G.; Mavromoustakis, C.X.; Skianis, C.; Markakis, E.K. Vulnerability assessment as a service for fog-centric ICT ecosystems: A healthcare use case. Peer-to-Peer Netw. Appl. 2019, 12, 1216–1224. [Google Scholar] [CrossRef]
Figure 1. The multi-layer security process.
Applsci 11 09972 g001
Figure 2. Bidirectional channel among nodes: (a) bidirectional form. (b) neighbors set.
Applsci 11 09972 g002
Figure 3. A block construction in blockchain.
Applsci 11 09972 g003
Figure 4. The reinforcement learning approach.
Applsci 11 09972 g004
Figure 5. The attack detection scheme.
Applsci 11 09972 g005
Figure 6. Single line schematic of IEEE 24-bus grid.
Applsci 11 09972 g006
Figure 7. The power exchanging between microgrid and the smart grid.
Applsci 11 09972 g007
Figure 8. The generation power of each unit.
Applsci 11 09972 g008
Figure 9. The NGO indexes of generators.
Applsci 11 09972 g009
Figure 10. The NLO indexes of lines.
Applsci 11 09972 g010
Figure 11. The NGO indexes of generators for different scenarios.
Applsci 11 09972 g011
Figure 12. The NLO indexes of lines for different scenarios.
Applsci 11 09972 g012
Figure 13. The total cost under the line outage.
Applsci 11 09972 g013
Figure 14. The total cost under the generation unit outage.
Applsci 11 09972 g014
Figure 15. Assessing the successful probability of attack for different cases.
Applsci 11 09972 g015
Figure 16. Assessing the double-layer security scheme.
Applsci 11 09972 g016
Figure 17. The comparison of power exchange: (a) the power transaction in 24 h, (b) cumulative changes across 24 h.
Applsci 11 09972 g017
Figure 18. The comparison of vulnerability indices.
Applsci 11 09972 g018
Figure 19. The operation costs of smart grid (a) and microgrid (b) in stochastic and normal conditions.
Applsci 11 09972 g019
Figure 20. The vulnerability indices arising from line outage in uncertainty condition.
Applsci 11 09972 g020
Figure 21. The vulnerability indices arising from generation unit outage in uncertainty condition.
Applsci 11 09972 g021
Table 1. Categorization of the difference approaches.
Machine LearningBlockchainVulnerabilityUncertaintyElectrical Grid
[7]
[26]
[32]
[33]
[34]
Proposed Model
Table 2. The bus and demand parameters.
Bus NumberVminVmaxPd (MW)Qd (MVAR)
10.951.0510822
20.951.059720
30.951.0518037
40.951.057415
50.951.057114
60.951.0513628
70.951.0512525
80.951.0517135
90.951.0517536
100.951.0519540
110.951.0500
120.951.0500
130.951.0526554
140.951.0519439
150.951.0531764
160.951.0510020
170.951.0500
180.951.0533368
190.951.0518137
200.951.0512826
210.951.0500
220.951.0500
230.951.0500
240.951.0500
Table 3. Comparison among different conditions.
Conditions/Costs (¢)Smart GridMicrogridTotal
With connection link2,197,716,34311,228,799.152,208,945,142
Without connection link7,007,211,26580,185,404.847,087,396,670
Table 4. Comparison among cases based on calculated hash rate.
Different CasesPC TypeEvaluation Time Calculation of Data Block (Data Packet)
The single-layer security schemes based on machine learning method-Detection delay = 3 Second
The blockchain-based single-layer security512-HA1 k hash (Kh) per second
The multi-layer based proposed security method256-HA2 k hash (kh) per second
Table 5. Comparison among different conditions for uncertainty state.
Conditions/Costs (¢)With Connection LinkWithout Connection Link
Smart grid2,230,789,3937,058,134,347
Microgrid14,589,325.1583,172,312.71
Total2,245,378,7187,141,306,660
Publisher’s Note: MDPI stays neutral with regard to jurisdictional claims in published maps and institutional affiliations.

