
Research on Residual Life Estimation Method for KMN Steel Based on Nonlinear Ultrasonic Testing


1
Institute of Process Equipment and Control Engineering, Zhejiang University of Technology, Hangzhou 310023, China
2
School of Mechanical Engineering, Shandong University, Jinan 250012, China
*
Author to whom correspondence should be addressed.
Appl. Sci. 2021, 11(23), 11385; https://doi.org/10.3390/app112311385
Submission received: 17 October 2021
/
Revised: 18 November 2021
/
Accepted: 24 November 2021
/
Published: 1 December 2021
(This article belongs to the Collection Nondestructive Testing (NDT))
Abstract
:The testing of KMN steel bending fatigue with different cycles was carried out using a nonlinear ultrasonic detector to obtain its nonlinear coefficient. The experimental results show that the nonlinear coefficient first increases and then decreases with an increase in fatigue cycles. The relationship between the propagation of the micro-cracks inside the material and the nonlinear coefficient was researched by microscopic analysis in the dangerous position of the specimens. As the fatigue cycles increase, the microstructure of the specimen gradually deteriorates and cracks occur, which proves that nonlinear ultrasonic detection can be used to characterize the initiation of micro-cracks in the early fatigue stages of the material and that the nonlinear coefficient β of the material can be used to reflect the fatigue damage degree and fatigue life of the interior of the material. An analysis of the numerical statistics of the fatigue cracks inside the specimens was carried out, and the extreme value of fatigue cracks was calculated using the Gumbel distribution. An empirical formula for the nonlinear coefficient and crack growth size of KMN steel was established and then a method for estimating the fatigue life of KMN steel based on nonlinear ultrasonic testing was proposed.
1. Introduction
KMN steel is a type of centrifugal compressor rotor material, which has high strength, toughness and good corrosion resistance. With the continuous increase in the speed of large-scale centrifugal compressors, the complex service environment and long service time have increasingly higher requirements for the life of the key component of the centrifugal compressor—the impeller. Therefore, there is an urgent need for effective detection and characterization of the fatigue damage degree of the impeller. Early damage and performance degradation of materials account for 80–90% of the entire fatigue life. Conventional non-destructive testing methods can only detect macroscopic defects (cracks, inclusions, pores, etc.) in materials, and the response to early damage changes in materials and structures is generally relatively small. Moreover, it is impossible to detect small-scale damage such as micro-defects and micro-cracks, especially damage hidden inside materials.
Recent studies have shown that the early performance degradation of material damage can cause the generation of nonlinear harmonics in the process of acoustic wave propagation [1,2,3,4]. Therefore, nonlinear ultrasonic testing technology overcomes the shortcomings of traditional non-destructive testing methods and can effectively characterize micro-defect damage and recessive damage [5,6]. Related scholars have conducted a large number of experimental studies on nonlinear ultrasonic detection technology and characterization methods [7,8,9,10]. In 1997, Jhang et al. [11] conducted a non-linear ultrasonic detection study on the early mechanical performance degradation of materials. In 1998, Nagy et al. [12] used nonlinear ultrasonic tests to evaluate the performance degradation of materials from cracks to fractures and predict the fatigue life of the materials. In 2010, Kawashima [13] used a nonlinear scanning system to detect non-metallic inclusions in continuum cast steel. In 2011, Viswanath [14] found that nonlinear coefficients can be used to characterize the degradation of mechanical properties of materials under tensile loads. In 2012, Cremer et al. [15] used nonlinear ultrasonic technology to observe the evolution of ultra-high cycle fatigue damage in aluminum alloy welded joints in situ. In 2015, Li et al. [16] conducted non-linear, ultrasonic, in situ observations of the ultra-high cycle fatigue characteristics of aluminum alloys and found that the ultrasonic nonlinear coefficients are more sensitive to fatigue damage (such as crack initiation and growth). In addition, they found that there is a good correlation between the ultrasonic nonlinear coefficient and the stiffness and plastic strain of the specimen. In 2016, Zhu [17] detected fatigue cracks using sonic infrared imaging. Experimental results show that the increase of the crack length will enhance the crack heating response, and the logarithmic relationship between the response signal and the crack length has a better linearity compared to others. In 2017, Yang [18] adopted the threshold segmentation, morphological processing, feature identifications as well as feature extraction and proposed a detection method with pertinence to the precision casting crack characteristics. In 2018, Shi [19] applied eddy current pulsed thermography (ECPT) for quantitative crack detection based on derivative analysis of temperature variation. The experimental verification showed that the crack sizes could be quantitatively detected with errors of less than 1%. In 2020, Xue [20] studied the influence of crack shape on eddy current detection signal. The general finite element analysis software is used as the simulation calculation tool to study the influence of different crack shape on eddy current detection signal size. In 2020, Cao [21] proposed a crack defect detection method of lead seal of high voltage cable by means of the eddy current detection technology. The results show that the eddy current detection technology can effectively detect whether a crack exists in the lead seal or not.
In summary, nonlinear ultrasonic testing technology is highly sensitive to small defects and internal defects and can be monitored online. However, the current research has not established the mapping relationship between the nonlinear coefficients and the fatigue damage and fatigue crack size and lacks data on the use of nonlinear ultrasonic testing to quantitatively estimate the fatigue life of a material.
2. Materials and Methods
KMN steel is a low-alloy high-strength steel with a grade of 15Cr2Mo1. Its mechanical properties and chemical composition are shown in Table 1 and Table 2. The heat treatment process is shown in Table 3.
The heat treatment process of KMN steel involves quenching at 980 ± 10 °C for 1–1.5 h followed by oil cooling then tempering at 700–750 °C for 1.5–2 h before air cooling. The metallographic specimen of KMN is corroded by nitric acid alcohol. The microstructure of KMN is shown in Figure 1. The metallographic structure is mainly needle-like and lath-like martensite with some tiny inclusions.
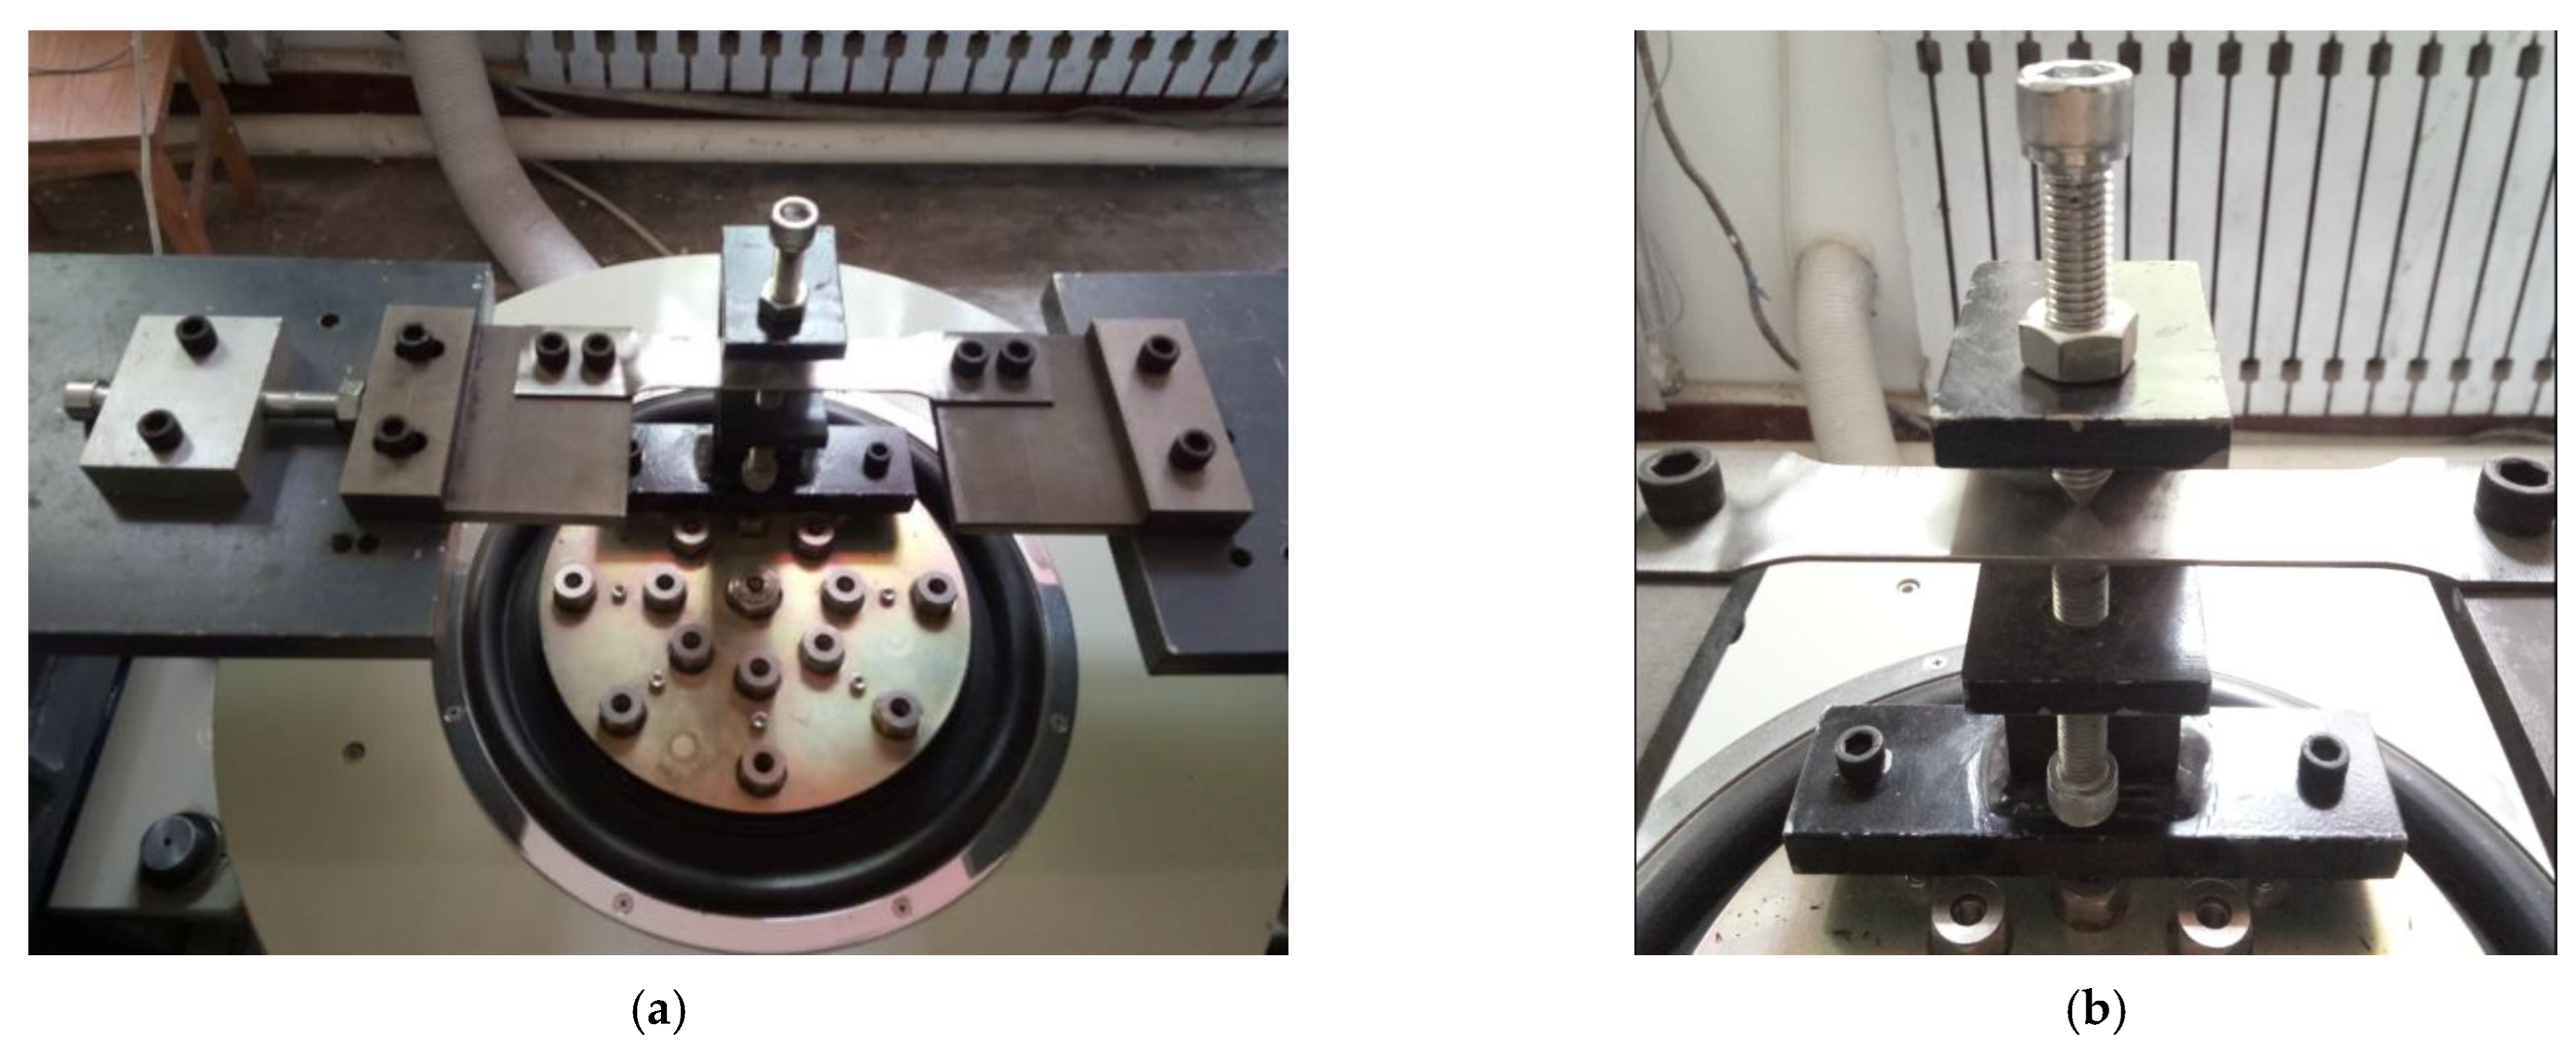
First, an ET-10d-240 vibration test bench was used to carry out fatigue tests on KMN specimens with different cycles. Fatigue specimens with different degrees of damage were obtained for non-linear ultrasonic testing, as shown in Figure 2. Before the fatigue test, the surface of the specimen was mechanically polished until no obvious scratches were visible to the naked eye. The surface condition of each specimen was kept consistent.
Then, the nonlinear ultrasonic testing of the KMN fatigue specimen was studied. In the experiment, the longitudinal wave oblique incidence method was used to excite and receive an ultrasonic Lamb wave in S1-S2 mode. The experimental equipment for the ultrasonic Lamb wave excitation and the measurement is shown in Figure 3 [22]. The RitecSNAP system can generate a pulse signal. The signal is transmitted to the ultrasonic piezoelectric transducer after passing through the attenuator. The transducer generates an ultrasonic vibration and is incident on the KMN specimen at a specific angle. After propagation, it reaches the receiving transducer, and the received signal is amplified and input into the oscilloscope.
The RitecSNAP ultrasonic system was used to perform ultrasonic Lamb wave nonlinear measurements on KMN specimens with different bending fatigue damage. During the experiment, a narrowband piezoelectric transducer (2.25 MHz, Olympus NDT Panametrics, A543S) with a center frequency of 2.25 MHz was used as the transmitting probe and a broadband piezoelectric transducer (5 MHz, Olympus NDT, V544) with a center frequency of 5 MHz was used as the receiving probe. The incident angle is 27° and the Lamb wave signal excited at such a frequency and angle meets both the phase velocity and group velocity matching conditions. The corresponding low-pass filter is 2 MHz, and the high-pass filter is 4 MHz. In the experiment, a gain of 20 dB and an attenuation of 3 dB were used. The frequency of the excitation signal is 2.2 MHz. The probes at both ends are fixed by a special fixture, and the pressure of the probe base surface is controlled at a relatively similar level during each measurement. The coupling agent between the transducer and the plexiglass wedge and between the plexiglass wedge and the specimen is glycerin. Because the coupling layer is very thin, the material nonlinearity of the coupling agent can be ignored. Secondly, considering that the plexiglass wedge also has an elastic nonlinear effect on the material, in order to reduce its influence, the propagation distance of the longitudinal wave excited by the transducer in the plexiglass wedge should be shortened as much as possible. In addition, because a narrowband ultrasonic transducer is used to excite the Lamb wave signal, the angle of incidence of the plexiglass wedge can be precisely controlled, the signal incident and propagating in the specimen is quite pure, and the received signal contains fundamental frequency and high-order mode Lamb waves; these signals can be simply processed by fast Fourier transform (FFT) and then the amplitude of the fundamental frequency Lamb wave and the amplitude of the double frequency Lamb wave can be decomposed [23].
3. Results
3.1. β-N Curve
The RitecSNAP ultrasonic system is used to perform nonlinear ultrasonic testing on KMN bending fatigue specimens with different fatigue cycles. The relationship curve between the normalized nonlinear ultrasonic coefficient β/β0 and the fatigue cycles is obtained as shown in Figure 4. It can be found that the nonlinear coefficient of the bending fatigue test increases first and then decreases with the increase in the fatigue cycle. At the very beginning of fatigue (about before 3 × 10⁵ cycles), cracks begin to initiate and the nonlinear coefficient β increase slightly. In the early stage of fatigue (before 106 cycles), the nonlinear coefficient β gradually increases with the increase of fatigue cycles, and the nonlinear coefficient reaches a peak as the cracks start to grow (about 106 cycles). In the later stages of fatigue (after 106 cycles), the non-linear coefficient β begins to decrease. This shows that there is a certain corresponding relationship between the nonlinear coefficient β of the material and the fatigue damage of the specimen. With the increase in the fatigue cycle, the fatigue damage inside the specimen also accumulates. When the ultrasonic Lamb wave in S1-S2 mode propagates inside the specimen, the second harmonic wave excited by the sound wave at the damage sites will also increase, and finally the nonlinear coefficient β of the material will continue to increase. With the increase in fatigue damage inside the specimen, the growing cracks increase the attenuation coefficient of the material, resulting in a decrease in the nonlinear coefficient, which is also the reason why the nonlinear coefficient decreases in the late stages of fatigue.
3.2. Microscopic Morphology Analysis
The dangerous position of the KMN-I bending fatigue specimen was dissected, and its microscopic appearance was observed. The study found that, as the number of fatigue cycles increases, the microstructure of the specimen gradually deteriorates, as shown in Figure 5.
Figure 5a is the original specimen. The material matrix is relatively flat and has no obvious defects. Corresponding to the material in Figure 4, the non-linear coefficient β is low. As the number of fatigue cycles increases, we can see from Figure 5b that there are small defects, such as holes and pits inside the material, corresponding to the slight increase in the nonlinear coefficient β at this time in Figure 4. From Figure 5c we can see that there are micro-cracks in the material matrix. Corresponding to Figure 4, the nonlinear coefficient β of the material at this time has obviously increased and reached its peak value. With a further increase in fatigue cycles, the internal cracks of the specimen continue to grow, as shown in Figure 5d. The occurrence of cracks increases the attenuation coefficient of the material, resulting in a decrease in the nonlinear coefficient. Correspondingly, the nonlinear ultrasonic coefficient β begins to decrease at this time in Figure 4. It is proven [22,24] that there is indeed a relationship between the material’s nonlinear coefficient β and the material’s internal damage, and the material’s nonlinear coefficient β can be used to reflect the fatigue damage degree and fatigue life of the material.
3.3. Micro-Cracks Statistics
As the number of fatigue cycles increases, the microstructure of the specimen shows microscopic defects, such as holes and pits and further micro-cracks, form. The micro-cracks continue to grow and eventually lead to the failure of the material. Therefore, the increase in fatigue cycles leads to the initiation and propagation of fatigue cracks. Combined with the microstructure analysis of the dangerous section of the KMN bending fatigue specimen, the number and length of fatigue cracks in the 10-standard field (500 × 500 μm) of view of each specimen are counted, as shown in Table 4, where the equivalent crack length refers to the sum of all crack lengths in the field of view. Since the received signal of the nonlinear ultrasonic Lamb wave is the sum of the second harmonic generated by all defects in the sampling area, it is more reasonable to use the equivalent crack length in the research process than the single crack length. It can be seen from Figure 6 that the number of cracks, the maximum crack length and the equivalent crack length all increase with the increase in the number of fatigue cycles, reflecting the process of continuous crack propagation inside the specimen.
The mapping relationship between the micro cracks inside the KMN bending fatigue specimen and the measured nonlinear coefficients is further analyzed, and the corresponding curve (i.e., the β-a curve) between the equivalent crack length of the material and the nonlinear coefficient is established, as shown in Figure 7. Due to the decrease of the nonlinear coefficient caused by the internal signal attenuation of the material in the late fatigue stage (after 106 cycles), we focus on the analysis of the corresponding relationship in the early stage of fatigue. It can be seen from Figure 7 that, as the effective length of the crack increases, the nonlinear coefficient of the material is also increasing. Especially in the initial stage of fatigue crack initiation, the nonlinear coefficient is very sensitive to the effective size change of the fatigue crack. Therefore, we can use the change of the nonlinear coefficient to reflect the initiation process of fatigue micro-cracks in the material at the early stages of fatigue.
4. Discussion
4.1. Micro-Cracks Statistics
The micro-cracks inside the specimen continue to merge during the expansion process and finally form a main crack and cause fatigue failure. The main crack is the main factor that affects the fatigue life of the material. Since only a few small areas are selected for statistics when observing the microstructure of the specimen section, the main crack (that is, the extreme value of the crack length) may not be in the observational field of view, so we must find the value of all the cracks in the dangerous area of the specimen. The extreme value can better reflect the fatigue degree of the specimen. The Gumbel distribution is the main form of the extreme value distribution. Its principle is that, when the random variable is large enough, it obeys the exponential law distribution, then the Gumbel distribution is the limit distribution for its maximum value distribution [25]. We introduce the Gumbel distribution into the process of finding the crack’s extreme value, measure the largest crack size in a small range through random small specimen data, and then extrapolate to estimate the largest crack size in a large range [26,27], and its distribution function is shown as:
Among them, G(amax) is the probability that the maximum crack size is less than or equal to amax; φ and λ are the scale parameter and the position parameter, respectively. The maximum crack size amax in different volumes can be estimated by Equation (2):
Among them, T is the return period, and the calculation formula is as follows:
Among them, V0 is the standard detection volume, and V is the control volume. V0 can be obtained by Equation (4):
Among them, S0 is the standard inspection field of view area; h is the average value of the crack size. h can be obtained by Equation (5):
Among them, amax,i is the largest crack size in the standard field of view obtained from the i-th observation in µm.
The selection of the control volume is very important for the extreme value calculation. In this paper, the area where the stress is higher than 0.9σmax in the specimen is defined as the control volume. For the plate specimen in the bending fatigue test, the maximum stress σmax of the test is located on the surface in the middle of the specimen and the internal stress in the section is inversely proportional to the distance from the specimen’s surface. The closer to both ends of the specimen, the smaller the stress. When the stress is equal to 0.9σmax, the x-axis coordinates are −lx and lx, respectively, and the control volume of the specimen is:
For KMN steel, E = 205 GPa, ρ = 7840 kg·m−3, f = 20 kHz, and the specimen size are shown in Figure 8. For the plate specimens in the bending fatigue test, it can be simplified as a uniform cross-sectional beam subjected to a concentrated load in the middle. By substituting the parameters when the static fatigue specimen stress is higher than 0.9σmax into Equations (7) and (8), we can calculate that lx = 16.24 mm and V = 1949 mm3. By combining Equations (3)–(5), we can calculate that h = 17.27 μm and T = 1.3 × 10⁷.
The parameter estimation methods of the Gumbel distribution mainly include the moment estimation method, least square method and maximum likelihood method. Among them, the moment estimation method is the most convenient to solve and has the highest accuracy. Therefore, we used the moment estimation method to calculate the two parameters δ and λ in Equation (1) [28]. Among them, the moment estimates of the mean and variance of the crack size are:
According to the moment estimation method of the Gumbel distribution, λ and δ are obtained as:
By substituting these into Equation (1), the corresponding internal crack extreme values of bending fatigue specimens under different fatigue cycles can be obtained, as shown in Table 5.
4.2. Residual Life Estimation Model
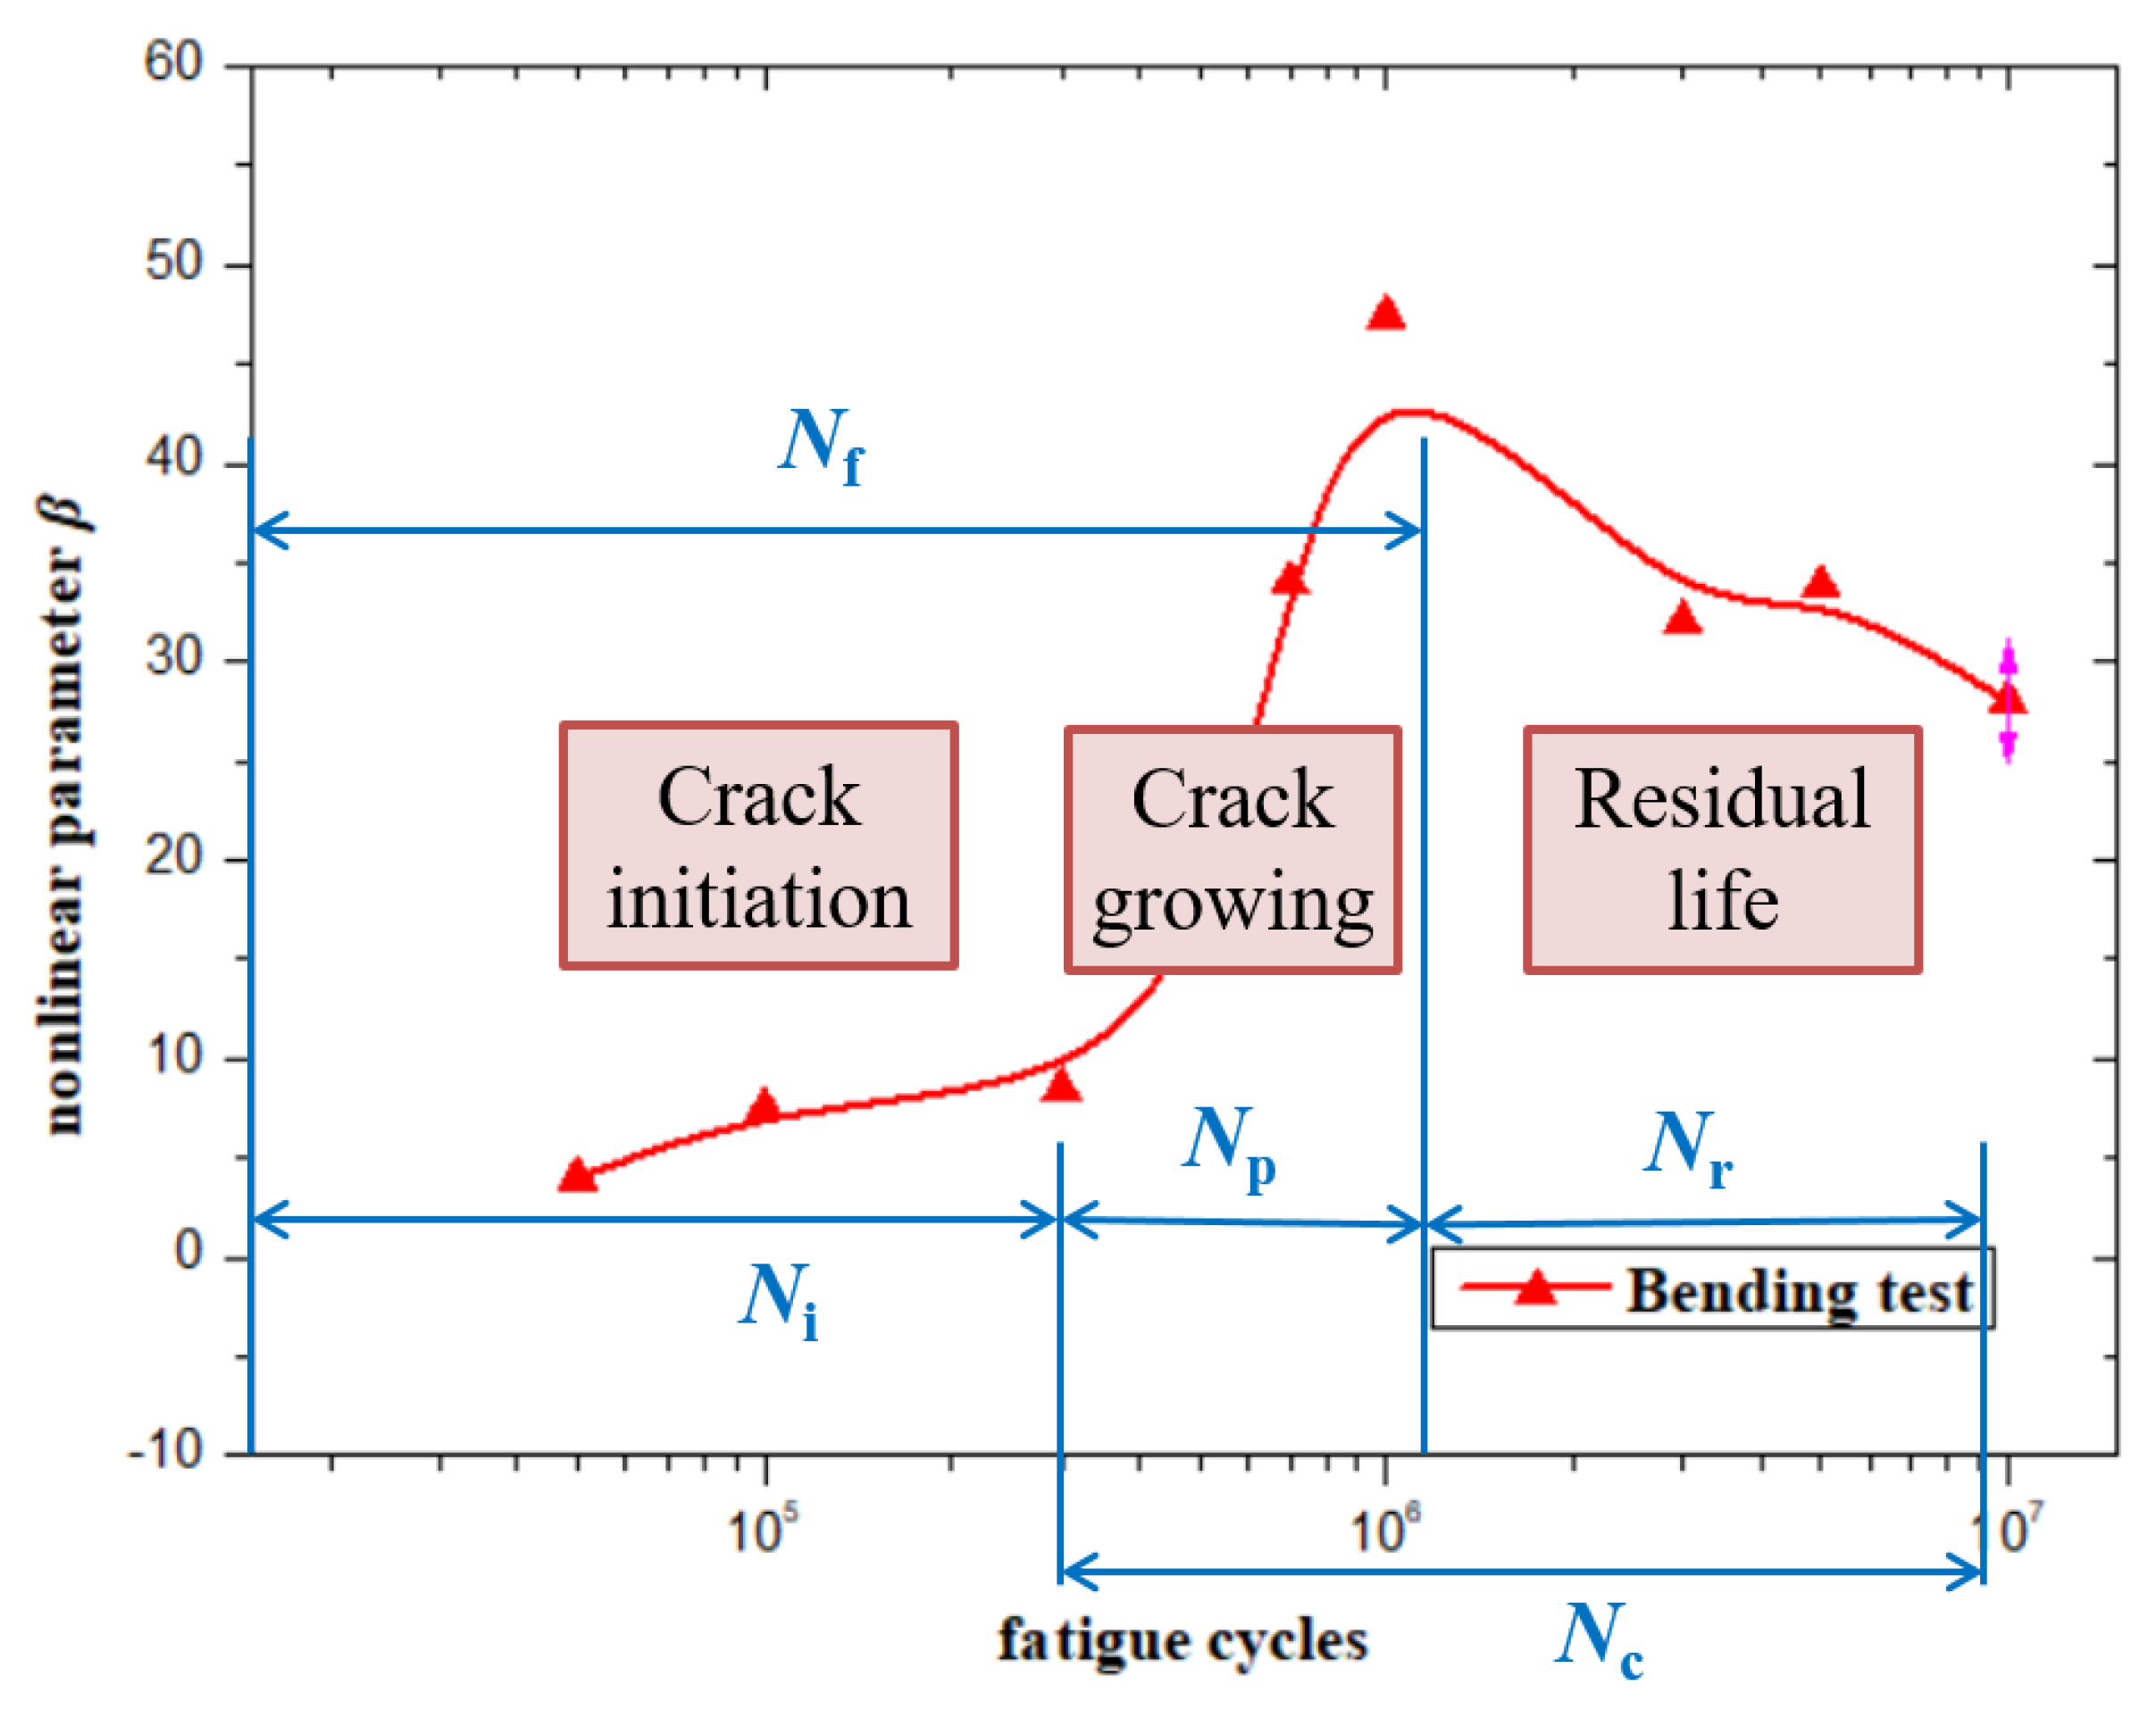
The fatigue failure process of the impeller material can be divided into three stages, namely the fatigue crack initiation stage, the fatigue crack growing stage and the residual life stage. The corresponding fatigue cycles are Ni, Np and Nr. The relationship between them is shown in Figure 9. Therefore, the essence of the residual life evaluation method based on nonlinear ultrasonic testing is to obtain the equivalent crack size of the impeller after service using nonlinear ultrasonic testing and micro-crack size statistics and then calculate the residual life of the impeller at this time through the fatigue crack growth formula.
The main cause of blade fatigue failure is wake-induced vibration. Force analysis was conducted on the impeller, and the fatigue load can be simplified into the following models. When the blades of the semi-open impeller were impacted by the wake, the blades were subjected to vibration loads or forced vibration. When the blades of the closed impeller were impacted by the wake, the blades were subjected to a three-point bending load fixed at both ends. On the basis of the KMN bending fatigue test in this paper, two sets of KMN specimens for vibration fatigue test and tensile bending fatigue test are added. Their normalized nonlinear coefficients and the estimated values of their extreme fatigue crack are obtained and then the relationship curve between the KMN nonlinear coefficient and the equivalent crack length is obtained, as shown in Figure 10.
Fitting the data points in the figure, we can establish the empirical formula of the impeller material KMN-I nonlinear coefficient and the equivalent crack length at the early fatigue stage (before 106 cycles):
where ae is the equivalent crack length. The correlation coefficient is r = 0.79. After the nonlinear ultrasonic testing of the blades in service, the corresponding non-linear coefficients are obtained and substituted into the empirical formula to obtain the equivalent crack size inside the blades at this time. Assuming that the crack propagation conforms to the Paris formula, according to the fatigue assessment formula adopted in GB/T19624-2004 “Safety Assessment of Pressure Vessels Containing Defects in Use” [29,30]:
Among them, ac is the critical crack size, aN is the crack growth size, ai is the crack initiation size, Nc is the fatigue cycles when the fatigue crack propagates from ai to ac, and Np is the fatigue cycles when the fatigue crack propagates from ai to aN. Equation (16) can be used to obtain the number of fatigue cycles for the crack to propagate from aN to ac; that is, the residual life Nr in cycles of the impeller. For Cr-Mo steel, C, m, and ΔK are 2.0 × 10⁻¹¹, 2.5, and 3.3 MPa, respectively. The fracture toughness of the impeller material KMN is K1C = 172.34 MPa·, and the critical crack size ac can be calculated by Equation (17):
Combining the above findings, we can propose a method for evaluating the residual life of an impeller based on nonlinear ultrasonic testing. The specific steps are as follows:
- (1)
- Perform nonlinear ultrasonic testing of the impeller in service to obtain the non-linear coefficient of the impeller at a particular point in time;
- (2)
- Use the β–ae empirical formula to obtain the corresponding equivalent crack size;
- (3)
- Combined with the fatigue crack growth life formula, the fatigue crack growth life of the impeller at this time is obtained, and then the residual life of the impeller is obtained.
4.3. Verify
Next, estimate the residual life of another set of KMN specimens to verify the effectiveness of the method. The nonlinear ultrasonic test is performed on the KMN fatigue specimen and the nonlinear coefficient is measured. The equivalent crack length at the early fatigue stage (before 106 cycles) is obtained using the empirical formula Equation (13). The fatigue life Np and residual life Nr of the specimen at this time are calculated by Equations (14)–(16). The very high cycle fatigue initiation life model of KMN steel established by our research group in the early stage is shown in Equation (18) [31]. The prediction results are compared with the actual fatigue test results, as shown in Table 6.
where Ni is the initiation life of the crack, Ws is the specific fracture energy, G is the shear modulus of the KMN-I matrix, l is the semilength of the slip band and ν is Poisson’s ratio. l is about half the grain size (10 μm). The specific fracture energy of low carbon steel (Ws ≈ 3.8 × 10⁵ N·m−1) was used in this study.
It can be seen from Table 6 that there is a certain error between the KMN fatigue life estimated by the nonlinear ultrasonic testing method and the test result, because the dispersion of the fatigue test is relatively large. Especially in the high cycle fatigue stage, the fatigue life under the same stress level may vary several times or even ten times. The safety factor of fatigue life is usually greater than 2, so we believe that the relative error is within the allowable range of engineering errors. The error is particularly low when the number of fatigue cycles is high. The effectiveness of this method is proven, so nonlinear ultrasonic testing can be used to estimate the residual life of KMN steel.
5. Conclusions
Nonlinear ultrasonic testing was used to calculate the relationship curve between the nonlinear coefficient and number of fatigue cycles of KMN steel. The experimental results show that:
- (1)
- The non-linear coefficient of the material first increases and then decreases with an increase in the number of fatigue cycles. Through a microanalysis of the section of the dangerous position of the specimen, it was found that, as the fatigue cycle increases, the microstructure of the specimen gradually deteriorates and micro-cracks occur.
- (2)
- The relationship between the growth of micro-cracks inside the material and the nonlinear coefficient was studied, and it was shown that nonlinear ultrasonic testing can be used to characterize the initiation of early micro-cracks due to material fatigue and that the material’s nonlinear coefficient β can be used to reflect the internal fatigue damage degree and fatigue life of the material.
- (3)
- Numerical statistics of the fatigue cracks inside the specimen were carried out, and the extreme value of the fatigue cracks was calculated using the Gumbel distribution. An empirical formula for the relationship between the nonlinear coefficient of KMN steel and the equivalent crack length at the early fatigue stage (before 106 cycles) was established, and then a method for estimating the residual fatigue life of KMN steel based on nonlinear ultrasonic testing was proposed and verified.
Author Contributions
P.W. contributed to formal analysis, and edited the manuscript; W.W. contributed to methodology and performed data curation; S.Z. completed the experiment. Z.G. was involved in project administration. All authors have read and agreed to the published version of the manuscript.
Funding
This research was funded by National Natural Science Foundation of China (Grant No. 51905484) and Zhejiang Province Public Welfare Technology Application Research Project (Grant No. LGG20E050018).
Institutional Review Board Statement
Not applicable.
Informed Consent Statement
Not applicable.
Data Availability Statement
Not applicable.
Acknowledgments
Thanks for the test equipment provided by Shandong University.
Conflicts of Interest
The authors declare no conflict of interest.
References
- Cantrell, J.H. Substructural organization, dislocation plasticity and harmonic generation in cyclically stressed wavy slip metals. Proc. R. Soc. A 2004, 460, 757–780. [Google Scholar] [CrossRef]
- Herrmann, J.; Kim, J.Y.; Jacobs, L.J.; Qu, J.; Littles, J.W.; Savage, M.F. Assessment of material damage in a nickel-base superalloy using nonlinear Rayleigh surface waves. J. Appl. Phys. 2006, 99, 1479–1488. [Google Scholar] [CrossRef]
- Kim, J.Y.; Jacobs, L.J.; Qu, J.; Littles, J.W. Experimental characterization of fatigue damage in a nickel-base superalloy using nonlinear ultrasonic waves. J. Acoust. Soc. Am. 2006, 120, 1266–1273. [Google Scholar] [CrossRef]
- Ohtani, T. Acoustic damping characterization and microstructure evolution during high-temperature creep of an austenitic stainless steel. Metall. Mater. Trans. A 2005, 36, 2967–2977. [Google Scholar] [CrossRef]
- Yan, B.; Wu, B.; Zeng, X.; He, C. FEM simulation and experimental study of fatigue damage measurement in magnesium using nonlinear ultrasonic. In Proceedings of the Mechanic Automation and Control Engineering (MACE), Wuhan, China, 26–28 June 2010; pp. 5903–5906. [Google Scholar]
- Zhou, Z.; Liu, S. Research, application and development of nonlinear non-destructive testing technology. J. Mech. Eng. 2011, 47, 2–11. [Google Scholar] [CrossRef]
- Biwa, S.; Hiraiwa, S.; Matsumoto, E. Pressure-dependent stiffnesses and nonlinear ultrasonic response of contacting surfaces. J. Solid Mech. Mater. Eng. 2009, 3, 10–21. [Google Scholar] [CrossRef]
- Lee, T.H.; Jhang, K.Y. Experimental investigation of nonlinear acoustic effect at crack. NDT E Int. 2009, 42, 757–764. [Google Scholar] [CrossRef]
- Chen, X.; Shen, C.; Jacobs, L. A method for detecting micro-cracks based on nonlinear ultrasonic harmonic amplitude ratio. J. Wuhan Univ. (Eng. Sci. Ed.) 2007, 40, 61–65. [Google Scholar]
- Chen, Z.; Shi, Y.; Zhao, H.; Wang, Y.; Zhang, N. Nonlinear ultrasonic detection and imaging technology for micro-defects. Chin. J. Acoust. 2010, 35, 9–13. [Google Scholar]
- Jhang, K.Y.; Kim, K.C. Evaluation of material degradation using nonlinear acoustic effect. Ultrasonics 1997, 37, 39–44. [Google Scholar] [CrossRef]
- Nagy, P.B. Fatigue damage assessment by nonlinear ultrasonic materials characterization. Ultrasonics 1998, 36, 375–381. [Google Scholar] [CrossRef]
- Kawashima, K.; Ito, T.; Nagata, Y. Detection and Imaging of Nonmetallic Inclusions in Continuously Cast Steel Plates by Higher Harmonics. Jpn. J. Appl. Phys. 2010, 49, 07HC11. [Google Scholar] [CrossRef]
- Viswanath, A.; Rao, B.P.C.; Mahadevan, S.; Parameswaran, P.; Jayakumar, T.; Raj, B. Nondestructive assessment of tensile properties of cold worked AISI type 304 stainless steel using nonlinear ultrasonic technique. J. Mater. Process. Technol. 2011, 211, 538–544. [Google Scholar] [CrossRef]
- Cremer, M.; Zimmermann, M.; Christ, H.J. In-situ characterization of the damage evolution of welded aluminum alloy joints during very high cycle fatigue (VHCF) with nonlinear ultrasonic technique. Suppl. Proc. Mater. Prop. Charact. Model. 2012, 1, 839–846. [Google Scholar]
- Li, W.; Cui, H.; Wen, W.; Su, X.; Engler-Pinto, C.C., Jr. In situ nonlinear ultrasonic for very high cycle fatigue damage characterization of a cast aluminum alloy. Mater. Sci. Eng. A 2015, 645, 248–254. [Google Scholar] [CrossRef]
- Zhu, J.; Min, Q.; Feng, F.; Xu, C. Experimental investigation into probability of detection for fatigue cracks in sonic IR imaging. In Proceedings of the 2016 IEEE Far East NDT New Technology & Application Forum (FENDT), Nanchang, China, 22–24 June 2016; IEEE: Piscataway, NJ, USA, 2016; pp. 218–222. [Google Scholar]
- Yang, S.; Sun, Z.; Sun, Q.; Wang, Y.; An, S. Study on detection system of precision casting cracks based on image processing. In Proceedings of the Ninth International Conference on Digital Image Processing (ICDIP 2017), Hong Kong, China, 21 July 2017; Volume 10420, p. 104201A. [Google Scholar]
- Shi, Z.; Xu, X.; Ma, J.; Zhen, D.; Zhang, H. Quantitative detection of cracks in steel using eddy current pulsed thermography. Sensors 2018, 18, 1070. [Google Scholar] [CrossRef] [Green Version]
- Xue, L.; Luo, S.; Li, J.; Li, J. Study on the relationship between the shape of stress crack and its detection signal. In Proceedings of the 2020 3rd International Conference on Electron Device and Mechanical Engineering (ICEDME), Suzhou, China, 1–3 May 2020; IEEE: Piscataway, NJ, USA, 2020; pp. 233–235. [Google Scholar]
- Cao, J.P.; Sun, X.T.; Wang, S.H.; Lu, F.Z.; Tang, Z.F. Research on Crack Detection of High Voltage Cable Lead Sealing Based on Eddy Current Technology. High Volt. Appar. 2020, 56, 168–175. (In Chinese) [Google Scholar]
- Chen, B.; Wang, C.; Wang, P.; Zheng, S.; Sun, W. Research on fatigue damage in high-strength steel (FV520B) using nonlinear ultrasonic testing. Shock. Vib. 2020, 2020, 8847704. [Google Scholar] [CrossRef]
- Xiang, Y. Research on Nonlinear Ultrasonic Guided Wave Evaluation Method for Early Damage of High Temperature Components. Ph.D. Thesis, School of Mechanical and Power Engineering, East China University of Science and Technology, Shanghai, China, 2011. [Google Scholar]
- Wang, P.; Zhou, Q.; Chen, B.; Zheng, S.; Wang, C.; Gao, Z. Research on high cycle fatigue damage characterization of FV520B steel based on the nonlinear Lamb wave. J. Strain Anal. Eng. Des. 2021. [Google Scholar] [CrossRef]
- Li, S. Very High Cycle Fatigue Properties of High Strength Steels: Effects of Nonmetallic Inclusions; Metallurgical Industry Press: Beijing, China, 2010. [Google Scholar]
- Sun, C.; Lei, Z.; Xie, J.; Hong, Y. Effects of inclusion size and stress ratio on fatigue strength for high-strength steels with fish-eye mode failure. Int. J. Fatigue 2013, 48, 19–27. [Google Scholar] [CrossRef] [Green Version]
- Li, W.; Sakai, T.; Wakita, M.; Mimura, S. Influence of microstructure and surface defect on very high cycle fatigue properties of clean spring steel. Int. J. Fatigue 2014, 60, 48–56. [Google Scholar] [CrossRef]
- Dong, S. Statistical analysis of parameter estimation methods of Gumbel distribution. J. Hydraul. Eng. 1989, 11, 35–42. [Google Scholar]
- Ni, X.; Li, X.; Wang, X. General Modification and Application of Paris Formula for Fatigue Crack Growth Law. Press. Vessel. 2006, 23, 8–15. [Google Scholar]
- GB/T 19624-2004. Safety Assessment for In-service Pressure Vessels Containing Defects. Beijing, China, 1-6-2005. Available online: https://max.book118.com/html/2017/0528/109982115.shtm (accessed on 16 October 2021).
- Wang, P.; Wang, W.; Zhang, M.; Zhou, Q.; Gao, Z. Effects of Specimen Size and Welded Joints on the Very High Cycle Fatigue Properties of Compressor Blade Steel KMN-I. Coatings 2021, 11, 1244. [Google Scholar] [CrossRef]
Figure 1.
Microstructure of the KMN steel.

Figure 2.
Fatigue testing machine and fixtures. (a) Tension and bending fatigue test. (b) Bending fatigue test.
Figure 2.
Fatigue testing machine and fixtures. (a) Tension and bending fatigue test. (b) Bending fatigue test.

Figure 3.
Nonlinear ultrasonic testing system. (a) RitecSNAP ultrasonic system. (b) Specimen and probes. (c) Fixture.
Figure 3.
Nonlinear ultrasonic testing system. (a) RitecSNAP ultrasonic system. (b) Specimen and probes. (c) Fixture.


Figure 4.
The relationship curve between normalized nonlinear coefficient and fatigue cycles under bending fatigue (A–D corresponds to four test points of different fatigue cycles).
Figure 4.
The relationship curve between normalized nonlinear coefficient and fatigue cycles under bending fatigue (A–D corresponds to four test points of different fatigue cycles).

Figure 5.
SEM microscopic morphology of KMN bending fatigue specimens. (a) The cross-sectional morphology of the specimen at point A in Figure 4; (b) The cross-sectional morphology of the specimen at point B in Figure 4; (c) The cross-sectional morphology of the specimen at point C in Figure 4; (d) The cross-sectional morphology of the specimen at point D in Figure 4; (e) The cross-sectional morphology of the specimen in 3k magnification; (f) The cross-sectional morphology of the specimen in 3k magnification.


Figure 6.
The relationship curve between equivalent crack length and fatigue cycles under bending fatigue.
Figure 6.
The relationship curve between equivalent crack length and fatigue cycles under bending fatigue.

Figure 7.
The relationship curve between equivalent crack length and normalized nonlinear coefficient under bending fatigue.
Figure 7.
The relationship curve between equivalent crack length and normalized nonlinear coefficient under bending fatigue.

Figure 8.
KMN bending specimen size and control volume (in mm).

Figure 9.
Schematic diagram of bending fatigue failure process and residual life (Nf is the fatigue cycles of the impeller after service).
Figure 9.
Schematic diagram of bending fatigue failure process and residual life (Nf is the fatigue cycles of the impeller after service).

Figure 10.
The relationship curve between normalized nonlinear coefficient and equivalent crack length under bending fatigue.
Figure 10.
The relationship curve between normalized nonlinear coefficient and equivalent crack length under bending fatigue.


Table 1.
Mechanical properties of KMN.
| Mechanical Properties | Rm (MPa) | Rp0.2 (MPa) | E (GPa) | ρ (kg/m3) | HV (kgf·mm−2) |
|---|---|---|---|---|---|
| KMN | 1193 | 1072 | 205 | 7840 | 335 |
Table 2.
Chemical composition of KMN (wt.%).
| Chemical Composition | C | Mn | Si | Mo | Cr | P | S |
|---|---|---|---|---|---|---|---|
| KMN | 0.13–0.18 | 0.5–0.8 | 0.17–0.37 | 0.9–1.1 | 2.2–2.5 | ≤0.030 | ≤0.030 |
Table 3.
Heat treatment process of KMN.
| Heat Treatment | Temperature (°C) | Holding Time (h) | Cooling Method |
|---|---|---|---|
| Quenching | 970 ± 10 | 2.5–3 | Oil cooling |
| Tempering | 570 ± 10 | 4–5 | Air cooling |
Table 4.
Statistics of internal micro-cracks and equivalent crack length of KMN bending fatigue specimens.
Table 4.
Statistics of internal micro-cracks and equivalent crack length of KMN bending fatigue specimens.
| Fatigue Cycle | 5 × 10⁴ | 105 | 5 × 10⁵ | 7 × 10⁵ | 106 | 5 × 10⁶ | 107 |
|---|---|---|---|---|---|---|---|
| Number of cracks | 0 | 0 | 1 | 3 | 4 | 6 | 12 |
| Crack length /μm | 0 | 0 | 8 | 6, 7, 12 | 4, 8, 18, 26 | 10, 12, 14, 16, 25, 30 | 5, 7, 8, 9, 10, 11, 11, 12, 13, 25, 31, 58 |
| Equivalent crack length/μm | 0 | 0 | 8 | 25 | 56 | 107 | 181 |
Table 5.
Statistics of internal micro-cracks and crack extreme estimation of KMN bending fatigue specimens.
Table 5.
Statistics of internal micro-cracks and crack extreme estimation of KMN bending fatigue specimens.
| Fatigue Cycle | 5 × 10⁴ | 1 × 10⁵ | 5 × 10⁵ | 7 × 10⁵ | 1 × 10⁶ | 5 × 10⁶ | 1 × 10⁷ |
|---|---|---|---|---|---|---|---|
| Number of cracks | 0 | 0 | 1 | 3 | 4 | 6 | 12 |
| Crack length /μm | 0 | 0 | 8 | 12, 6, 7 | 18, 8, 4, 26 | 30, 12, 25, 10, 14, 16 | 10, 9, 7, 31, 13, 8, 11, 25, 58, 5, 11, 12 |
| Maximum crack length/μm | 0 | 0 | 8 | 12 | 26 | 30 | 58 |
| Crack extreme estimation/μm | 0 | 0 | 8 | 47.96 | 92.95 | 115.33 | 202.15 |
Table 6.
Comparison of test results and model prediction results of KMN steel residual life.
| Specimen No. | β | a /μm | Model Prediction Results Ni + Np /Cycle | Test Results Nf /Cycle | Relative Error | Residual Life Nr /Cycle |
|---|---|---|---|---|---|---|
| 1# | 10.19 | 32.37 | 1.72 × 10⁶ | 7 × 10⁵ | 146% | 1.08 × 10⁶ |
| 2# | 8.5 | 22.90 | 1.1 × 10⁶ | 7 × 10⁵ | 57% | 2.7 × 10⁶ |
| 3# | 11.86 | 39.62 | 1.98 × 10⁶ | 1 × 10⁶ | 98% | 1.82 × 10⁶ |
| 4# | 11.58 | 39.68 | 1.99 × 10⁶ | 1 × 10⁶ | 99% | 1.81 × 10⁶ |
| 5# | 12.2 | 42.95 | 2.08 × 10⁶ | 1 × 10⁶ | 108% | 1.72 × 10⁶ |
| 6# | 18.32 | 72.81 | 2.54 × 10⁶ | 3 × 10⁶ | 15% | 1.26 × 10⁶ |
| 7# | 14.52 | 55.16 | 2.32 × 10⁶ | 3 × 10⁶ | 23% | 1.48 × 10⁶ |
Publisher’s Note: MDPI stays neutral with regard to jurisdictional claims in published maps and institutional affiliations. |
© 2021 by the authors. Licensee MDPI, Basel, Switzerland. This article is an open access article distributed under the terms and conditions of the Creative Commons Attribution (CC BY) license (https://creativecommons.org/licenses/by/4.0/).
Share and Cite
MDPI and ACS Style
Wang, P.; Wang, W.; Zheng, S.; Gao, Z. Research on Residual Life Estimation Method for KMN Steel Based on Nonlinear Ultrasonic Testing. Appl. Sci. 2021, 11, 11385. https://doi.org/10.3390/app112311385
AMA Style
Wang P, Wang W, Zheng S, Gao Z. Research on Residual Life Estimation Method for KMN Steel Based on Nonlinear Ultrasonic Testing. Applied Sciences. 2021; 11(23):11385. https://doi.org/10.3390/app112311385
Chicago/Turabian StyleWang, Pengfei, Weiqiang Wang, Sanlong Zheng, and Zengliang Gao. 2021. "Research on Residual Life Estimation Method for KMN Steel Based on Nonlinear Ultrasonic Testing" Applied Sciences 11, no. 23: 11385. https://doi.org/10.3390/app112311385
Note that from the first issue of 2016, this journal uses article numbers instead of page numbers. See further details here.