Article

Power Efficiency Improvement of a Boost Converter Using a Coupled Inductor with a Fuzzy Logic Controller: Application to a Photovoltaic System

by
Nabil Abouchabana
1,2,*,
Mourad Haddadi
2,
Abdelhamid Rabhi
3,
Alfio Dario Grasso
4 and
Giuseppe Marco Tina
4
1
LACOSERE Laboratory (Laboratoire des Semi-Conducteurs et des Matériaux Fonctionnels), Amar Telidji University, BP 37G, Ghardaia Road, Laghouat 03000, Algeria
2
LDCCP Laboratory (Laboratoire des Dispositifs de Communication et de Conversion Photovoltaïque), Ecole Nationale Polytechnique, 10 Avenue H. Badi BP 182, El Harrach 16200, Algeria
3
MIS Laboratory (Modélisation, Information and Systèmes), University of Picardie Jules Verne, 33 rue Saint Leu, CEDEX 1, 80039 Amiens, France
4
Department of Electrical, Electronics and Informatics Engineering, University of Catania, 95125 Catania, Italy
*
Author to whom correspondence should be addressed.
Appl. Sci. 2021, 11(3), 980; https://doi.org/10.3390/app11030980
Submission received: 1 December 2020 / Revised: 18 January 2021 / Accepted: 19 January 2021 / Published: 22 January 2021

Abstract

:
DC/DC converters are widely used in photovoltaic (PV) systems to track the maximum power points (MPP) of a photovoltaic generator (PVG). The variation of solar radiation (G) and PV cells temperature (T) affect the power efficiency of these DC/DC converters because they change the MPP, thus a sizing adaptation of the component values in these DC/DC converters is needed. Power loss in the inductor due to core saturation can severely degrade power efficiency. This paper proposes a new method that allows to adapt the inductor values according to the variable output power of the PV array in order to minimize losses and improve the converter power efficiency. The main idea is to replace the DC/DC inductor with a coupled inductor where the DC/DC inductor value is adjusted through an additional winding in the magnetic core that modulates the magnetic field inside it. Low current intensities from the PVG supply this winding through a circuit controlled by a fuzzy logic controller in order to regulate the second winding current intensity. Experimental results show a significant improvement of the power efficiency of the proposed solution as compared to a conventional converter.

1. Introduction

It is very apparent that the interest in photovoltaic power generation has strongly increased in recent years. Numerous studies and works have been done on this thematic to improve their production [1]. A non-linear I = f(V) curve characterizes the photovoltaic generators (PVG) with different points of maximum power (see Figure 1 and Figure 2), [1,2].
PV cells temperature (T) and solar radiation (G) influence this characteristic [3,4,5], which change the electrical power produced by such PVG. To remedy the latter problem, specific control techniques were proposed and developed from 1968 until now in such a manner that these PVG produce their maximum electrical power [1,2,3,4,5,6,7].
This type of control is called Maximum Power Point Tracking (MPPT) where the main function provided by the designed control laws is to ensure to extract the maximum power point (MPP) all the time. This is generally assured by DC/DC converters [8,9,10,11,12,13] (see Figure 1).
Many MPPT strategies have been proposed in the literature to extract the maximum power for the PV systems [1,2,7] ranging from classical techniques like perturb and observe (P&O) and Incremental Conductance (IC) [3] to artificial and intelligent techniques [14].
Generally, the DC/DC converters element sizing is made for a fixed and known power supply. The DC/DC power output and the DC/DC power efficiency are high only for a good sizing of these elements [8,9,10,11,12,13,14,15,16,17,18]. The main element hardly affecting these two parameters is the power loss due to core saturation of the inductor. The sizing of inductor value in a DC/DC converter becomes difficult for a variable power supply, as in the case of a PV system under different levels of radiation and temperature change [2,8].
Most of the proposed modifications and improvements are applicable for a converter with fixed nominal values. In practice another problem appears on the power efficiency of the converter in PV applications under varying conditions and this issue is not well addressed in the literature. To the best of our knowledge, the efficiency improvement of the DC/DC converter for PV applications in practice is strongly related to the structure and the size of the inductor of the converter. In [12] a micro-scale topology was applied for a MPPT DC/DC converter without using an inductor but it is applicable only for very low power systems.
In this paper, the main purpose is to improve the efficiency of a boost converter for PV applications and to reduce core losses in the inductor. In particular, a new DC/DC Boost converter topology using a variable inductor is proposed and tested in a PV application in order to maximize the power efficiency and minimize power losses.
In [16] a solution is proposed to improve the power efficiency for a buck converter with a suitable inductor using a coupled inductor. In the proposed topology, only simulation results were presented without carrying out experimental validation. The purpose of this paper is to experimentally validate the same idea and extend it for a boost converter in PV systems.
The paper is structured as follows. In Section 2 we recall the PVG characteristics and how to connect it to a load through a DC/DC converter and the operation of a boost converter. The proposed topology and analysis of the coupled inductor is also presented. Simulation and experimental result of the proposed boost converter for PV applications compared to a conventional topology are detailed. Section 4 is devoted to analysis, discussions and comments of the proposed solution. Finally, Section 5 reports concluding remarks.

2. Materials and Methods

It is well known that the PVG power production has a strong variation caused by solar radiation changes, temperature changes, or load variation, as summarized in Figure 2 [2,3].

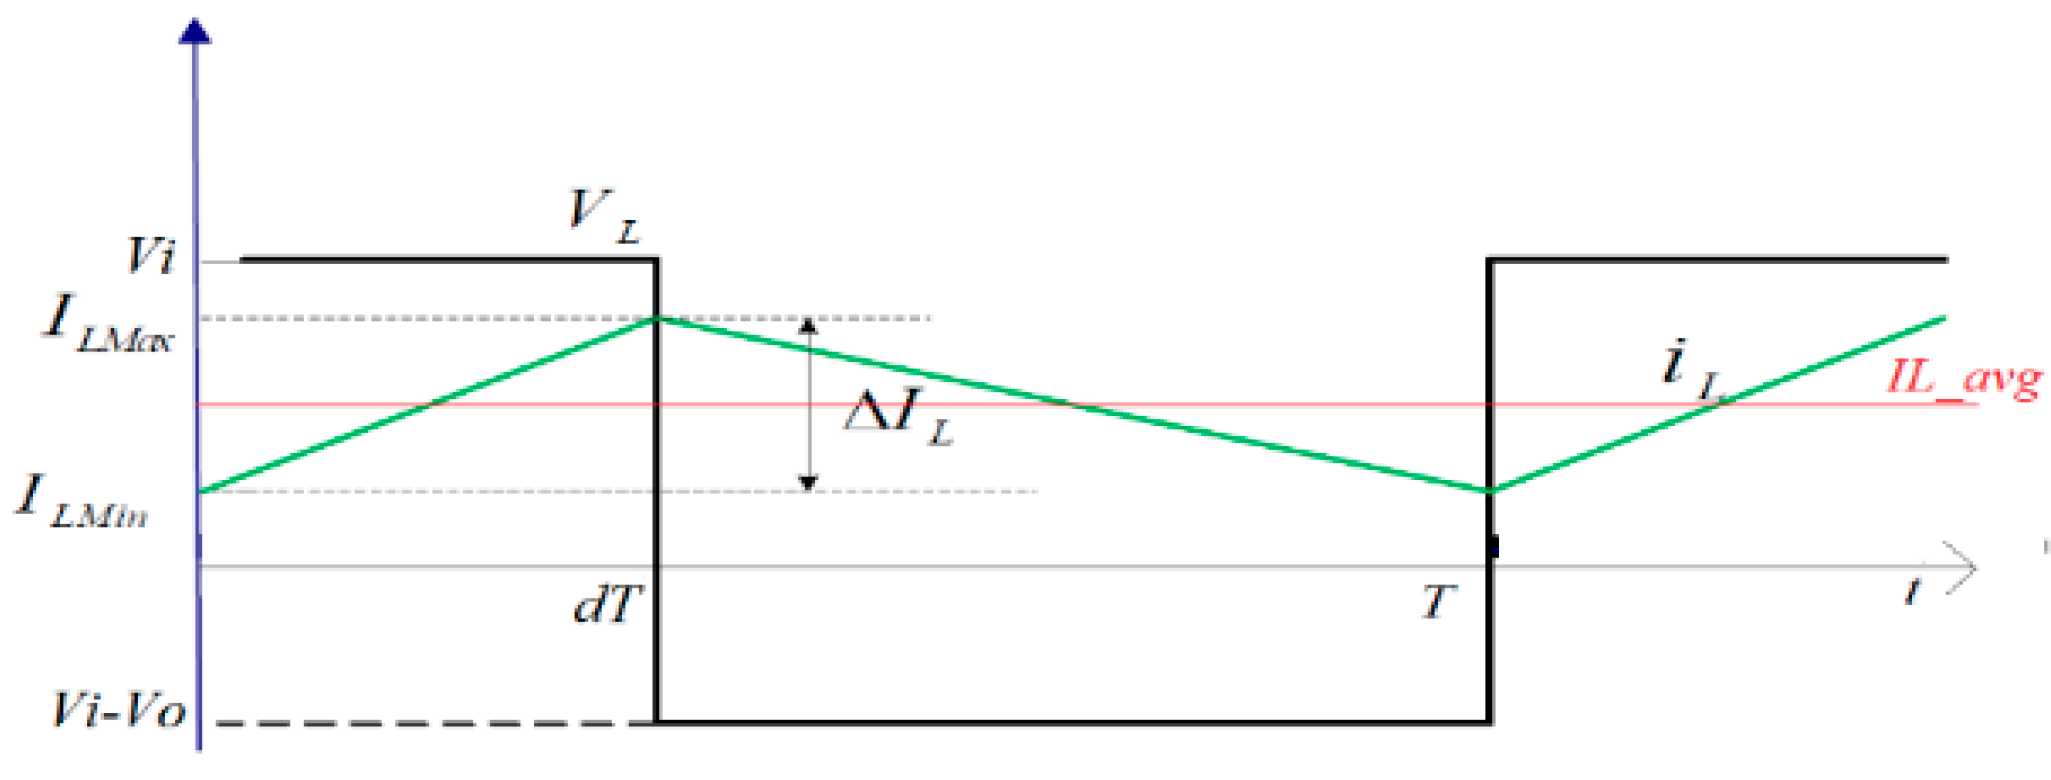
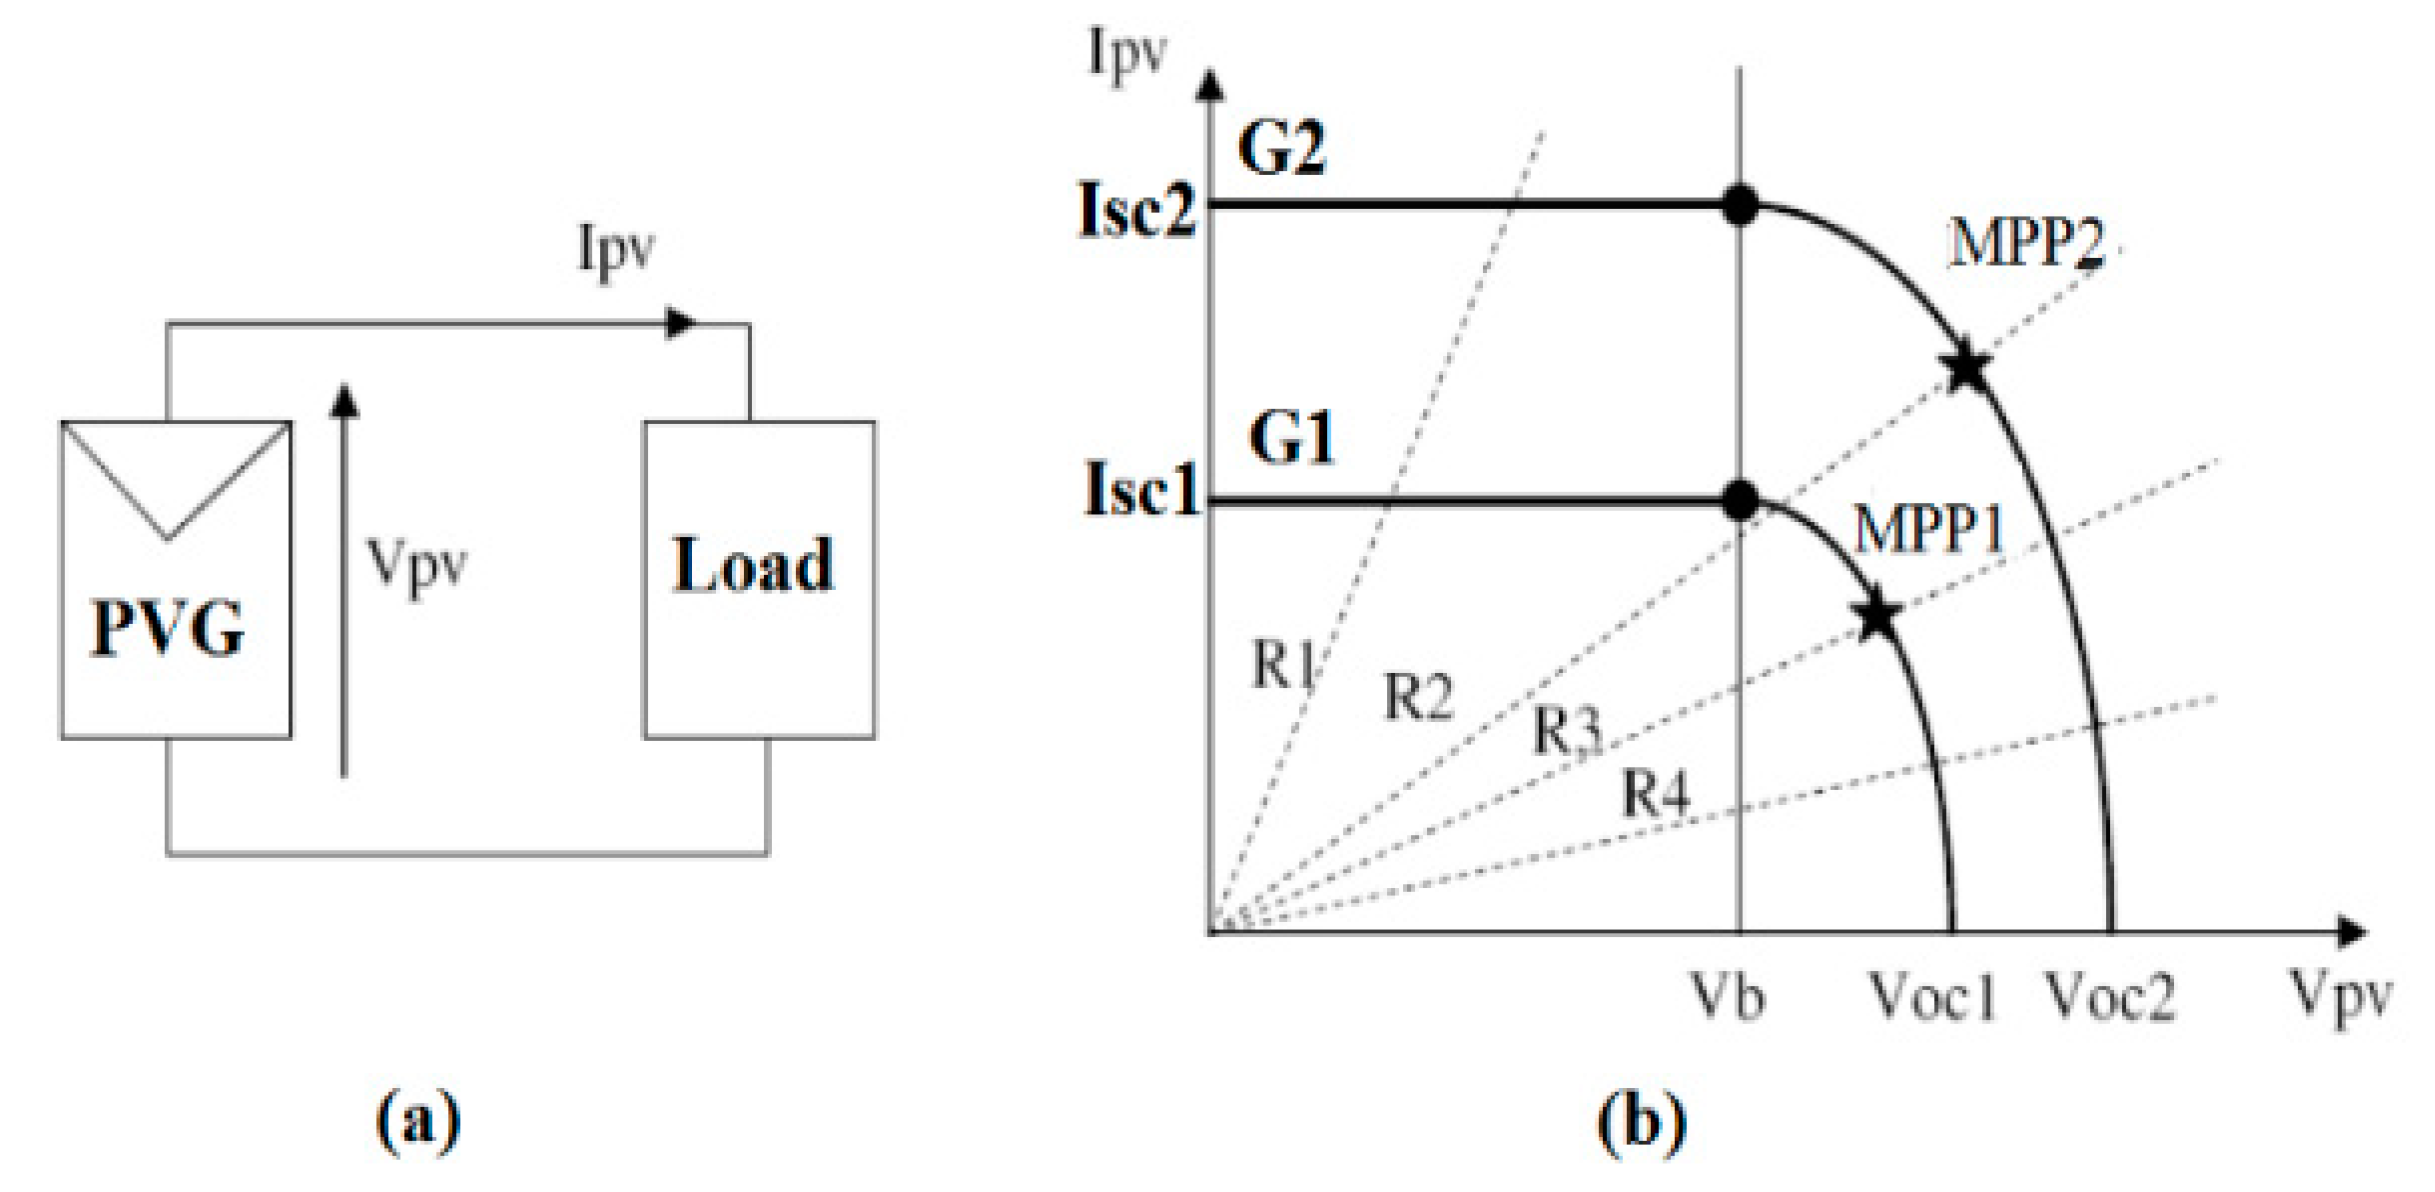
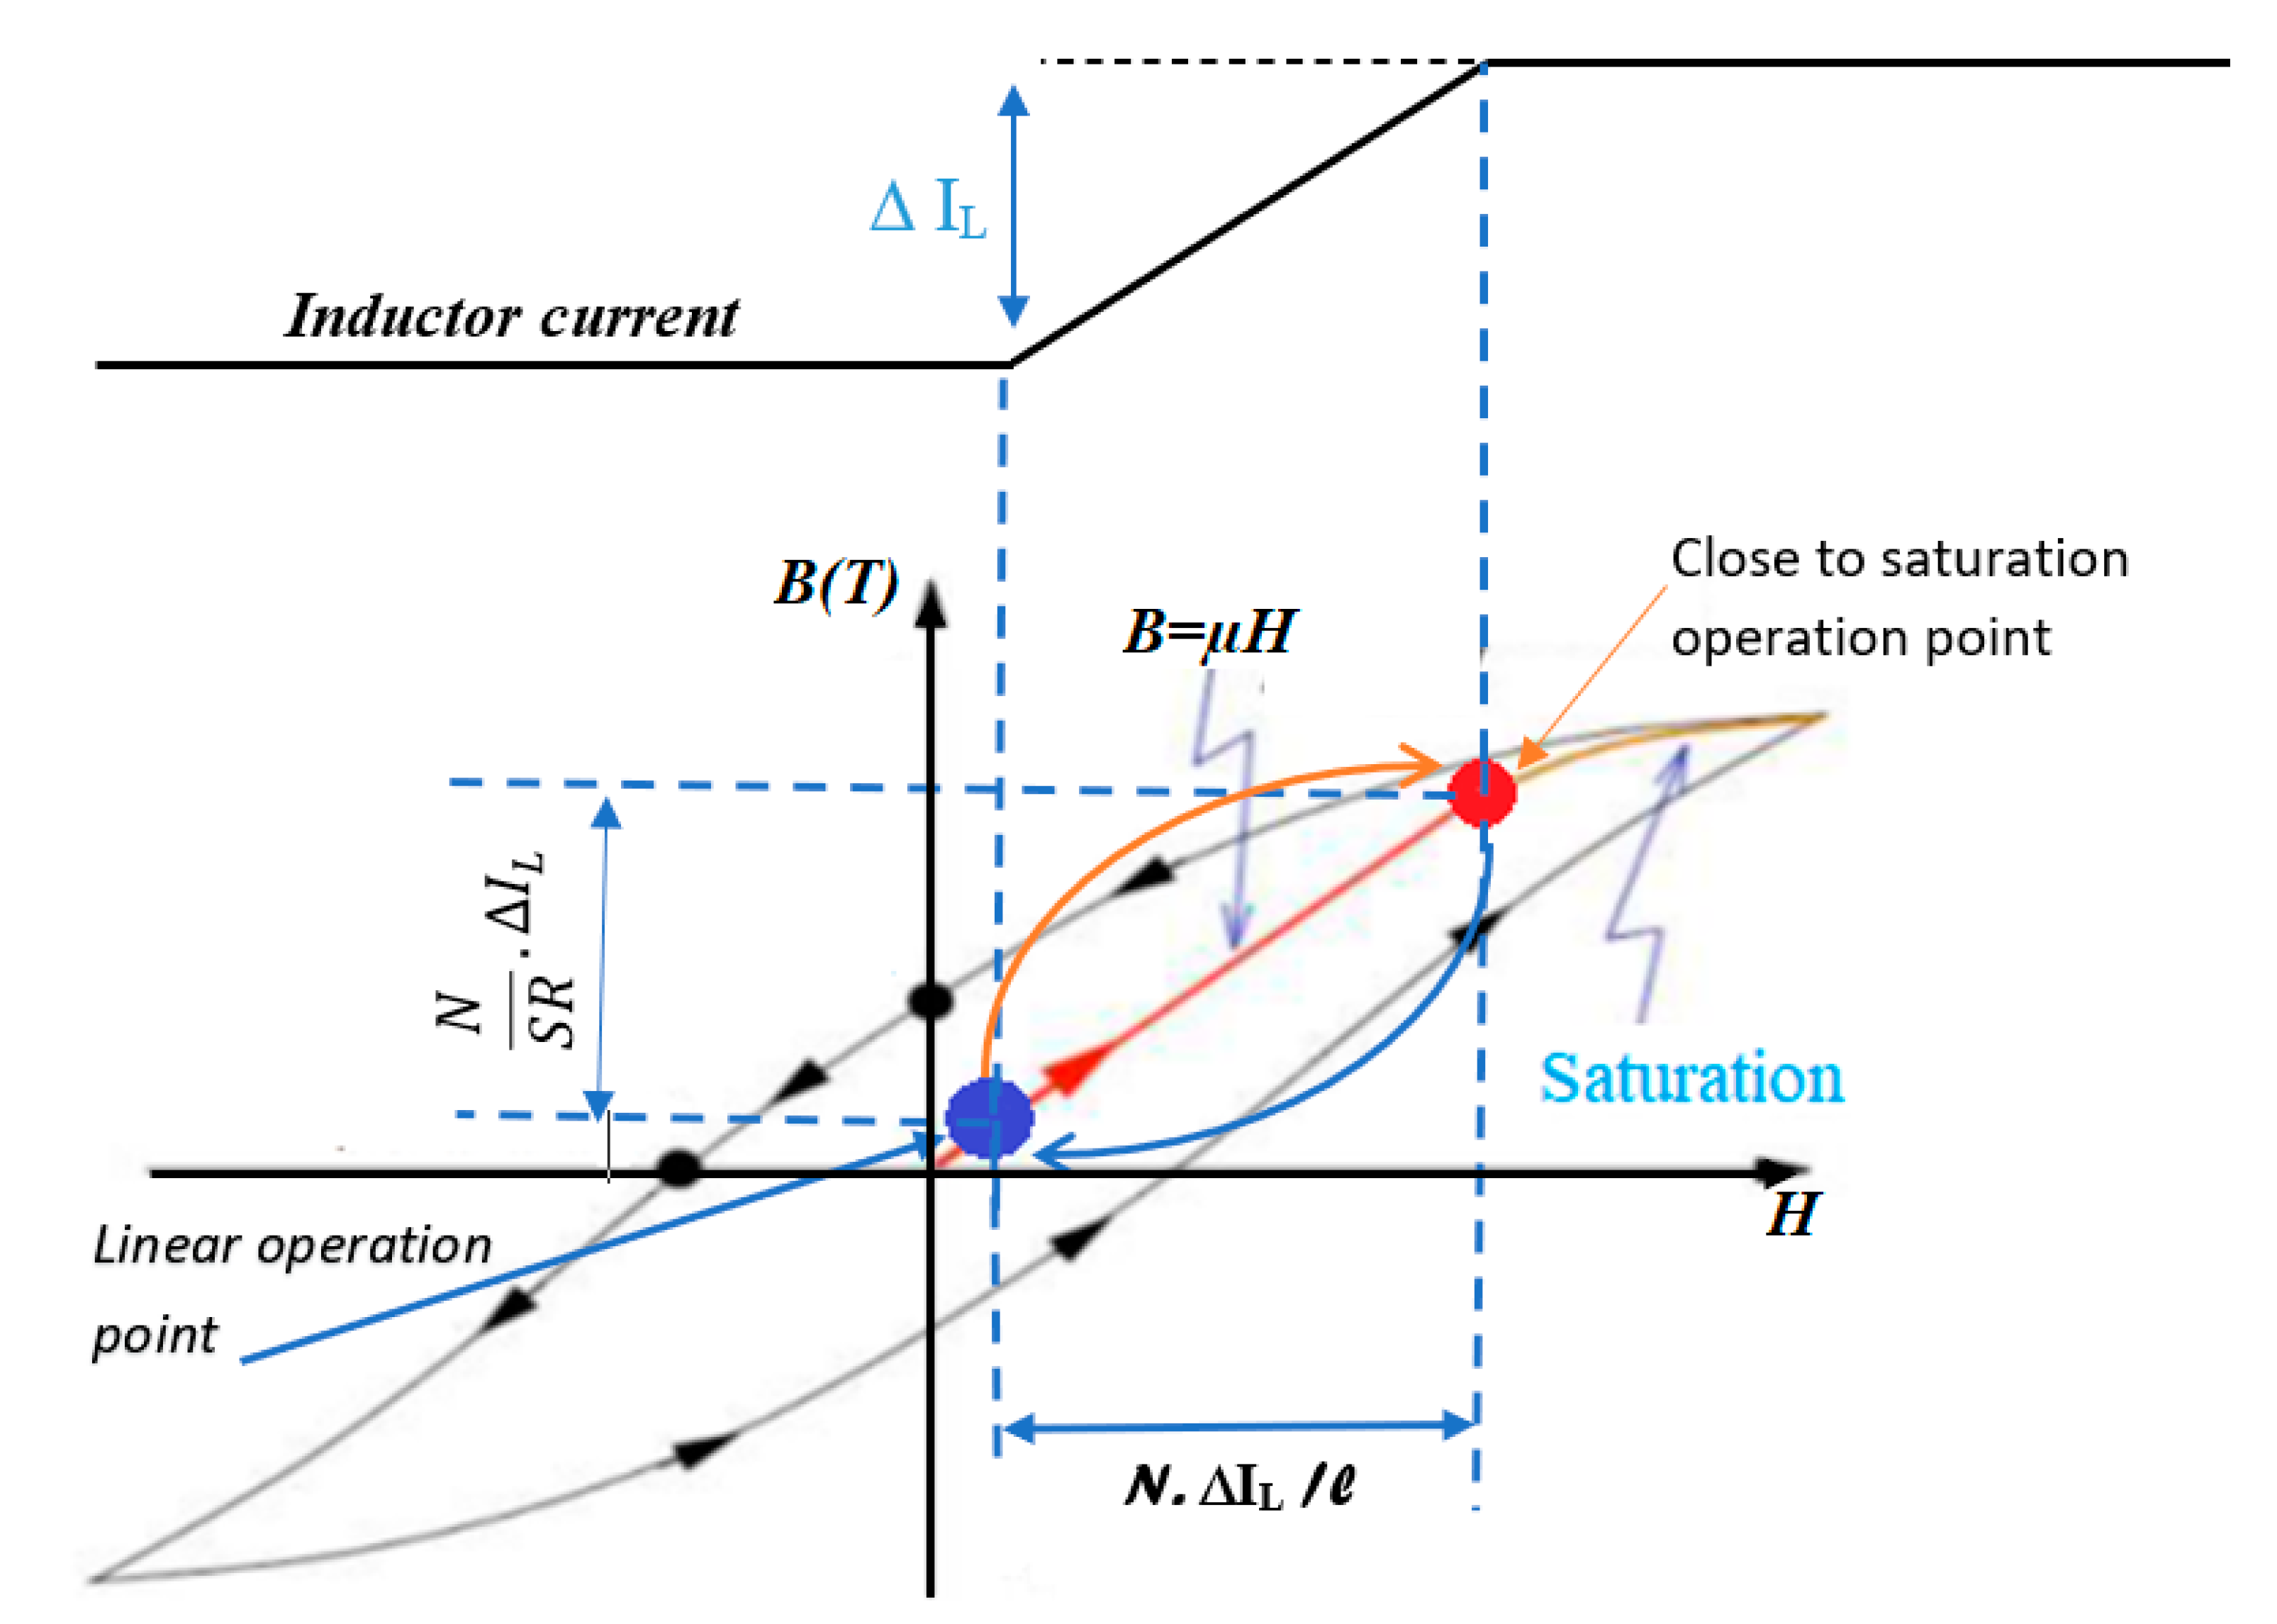
2.1. Inductor Sizing in a Conventional Boost Converter for PV Applications

As we can see from Figure 2, the operating point of the PVG strongly depends on the solar radiation (G) and the characteristics of the associated load (R1, R2, R3, and R4 in Figure 2) [2,3,11]. For a given radiation value, there is a particular operating point, called “Maximum Power Point” (MPP), noted MPP1 and MPP2 in Figure 2, which leads to getting the maximum power from the PVG. We can observe that there is a difference between the MPP that the PVG can produce and the power transferred to the load in direct connection mode.
The commonly adopted solution to solve this problem is to introduce a static converter to force the PVG working in its MPP, which acts like a source-load adapter [3,15,16], as shown in Figure 1.
The action to the DC/DC converter to track the maximum power point is delivered by the MPPT controller for any climate condition. The converter structure is chosen depending on the load and the generated PVG voltage. Among the various methods adopted to get MPP, the P&O method is widely adopted. It requires the measurement of the PVG output voltage Vpv and output current Ipv. It detects the MPP and gives the output voltage where the power is maximum [1,6].
In our case, we use a boost topology controlled by the P&O_MPPT controller to ensure the adaptation between the load and the PV generator. The electric circuit of the boost converter is shown in Figure 3. The operation of the boost converter in the continuous conduction mode is described in detail in the Appendix A.
The sizing of the components in the boost converter depends on the input voltage Vi, and the input current Ii. The components to be sized and selected accordingly are the inductance of the inductor L, the diode D, the values of capacitors C1 and C2, and the switching transistor K. When these components are properly chosen, the energy loss can be neglected [18,19]. The element mainly influencing the boost converter losses is the inductor because its sizing depends directly on the input voltage as well as on the input current. In the case of PV applications, the voltage and current changes depend on climate parameters G and T.

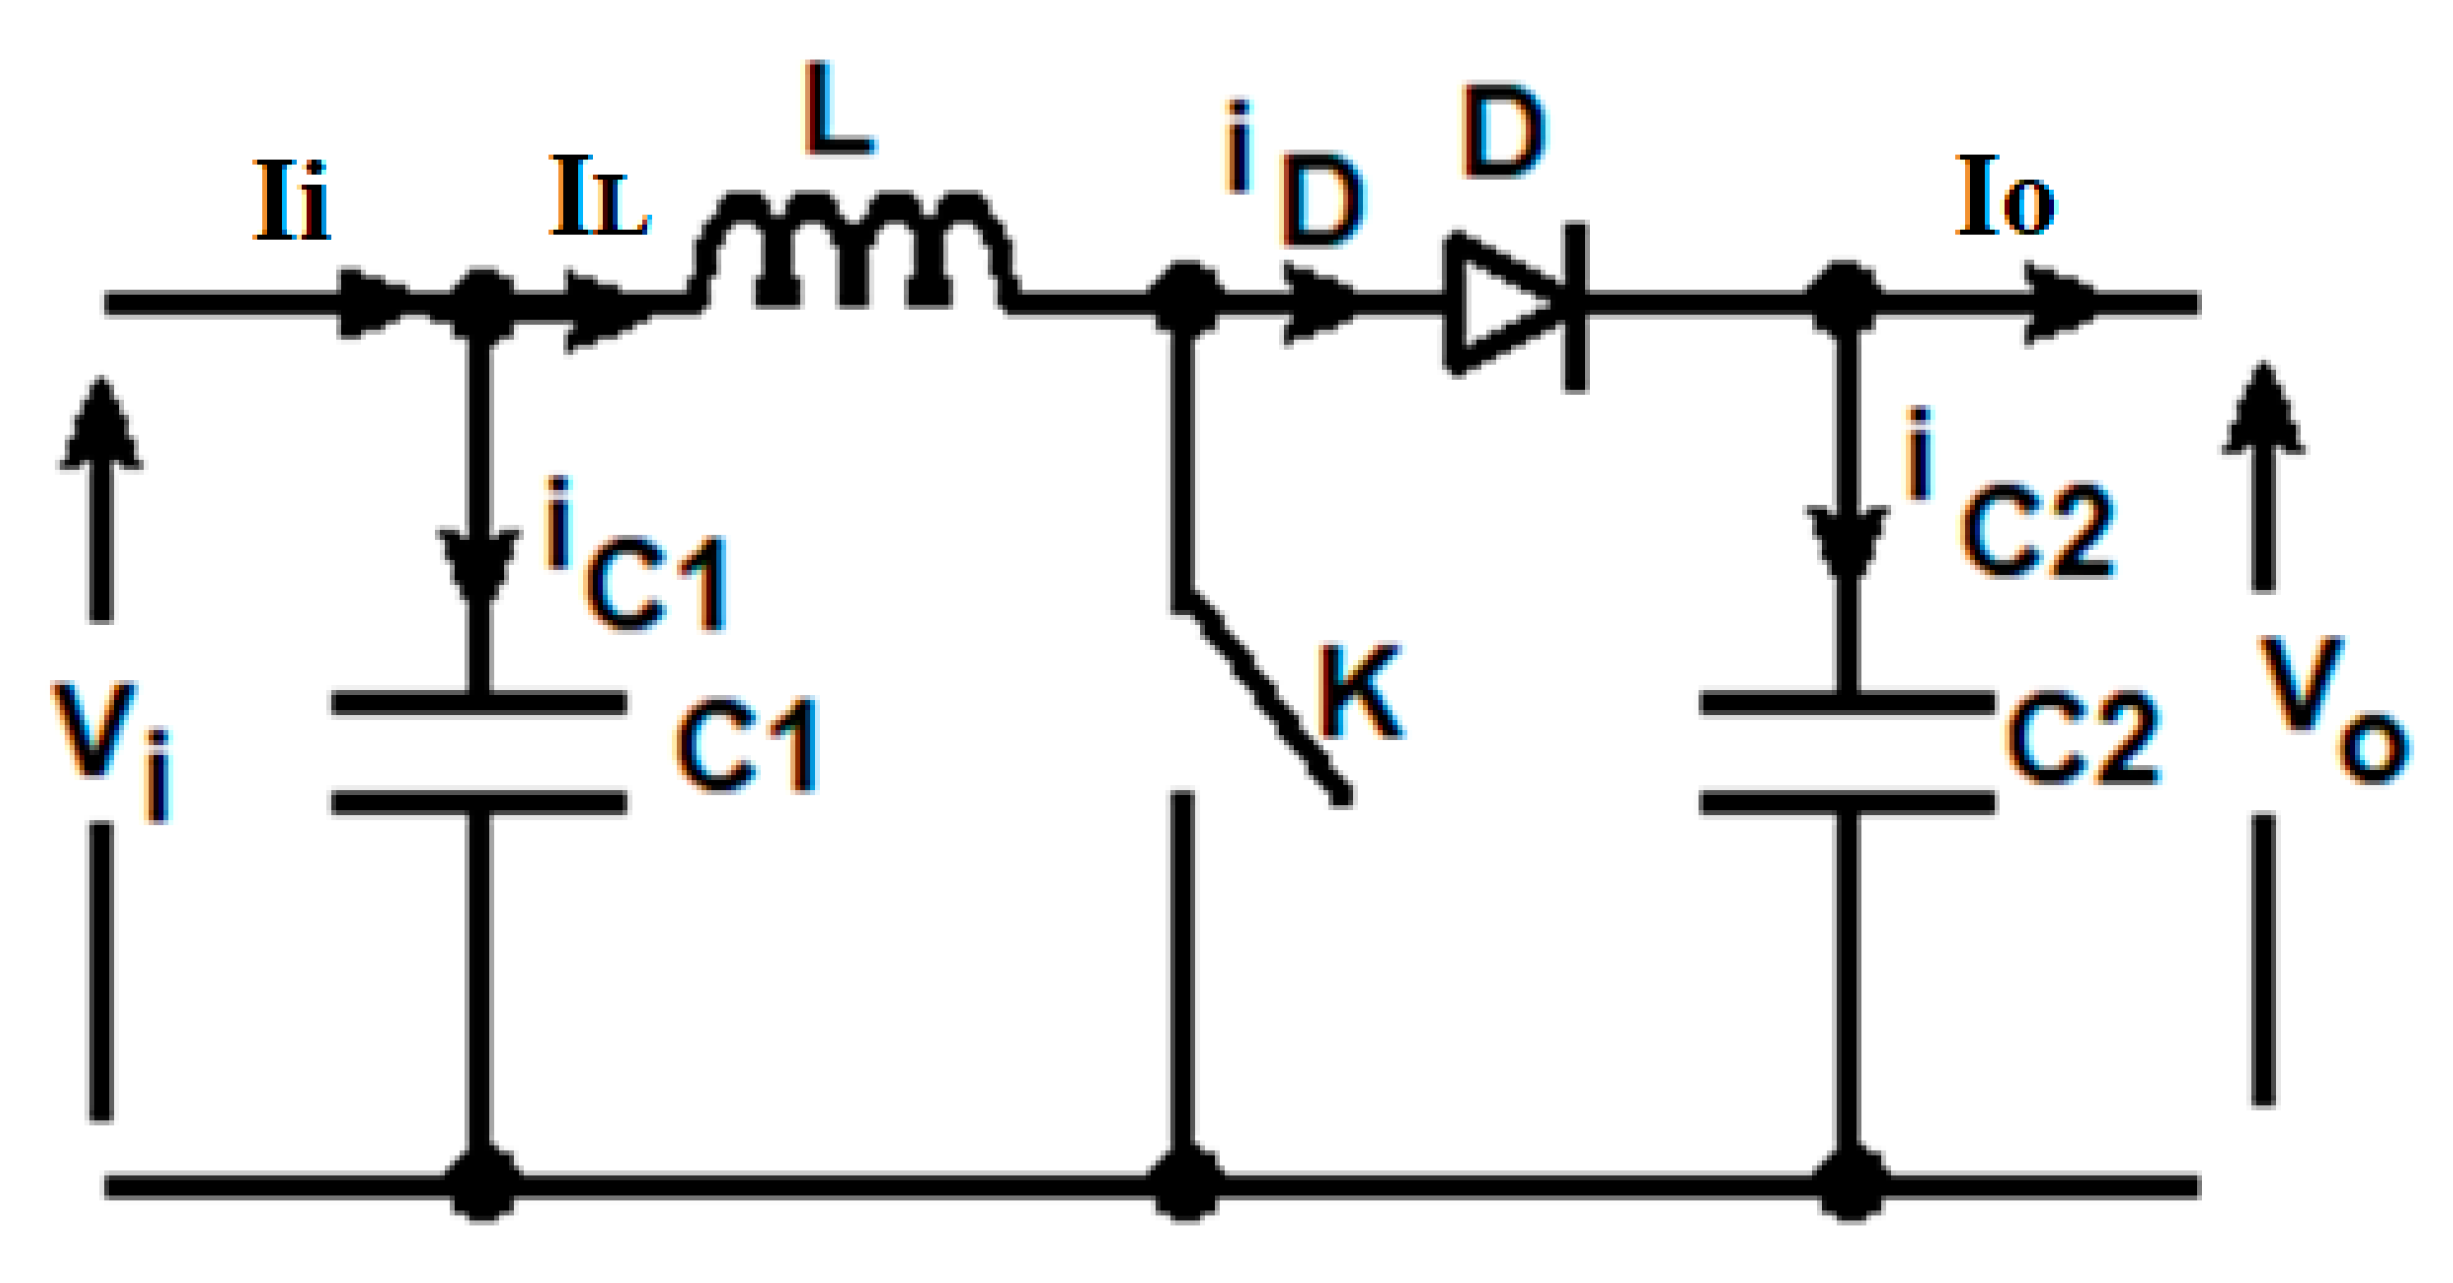
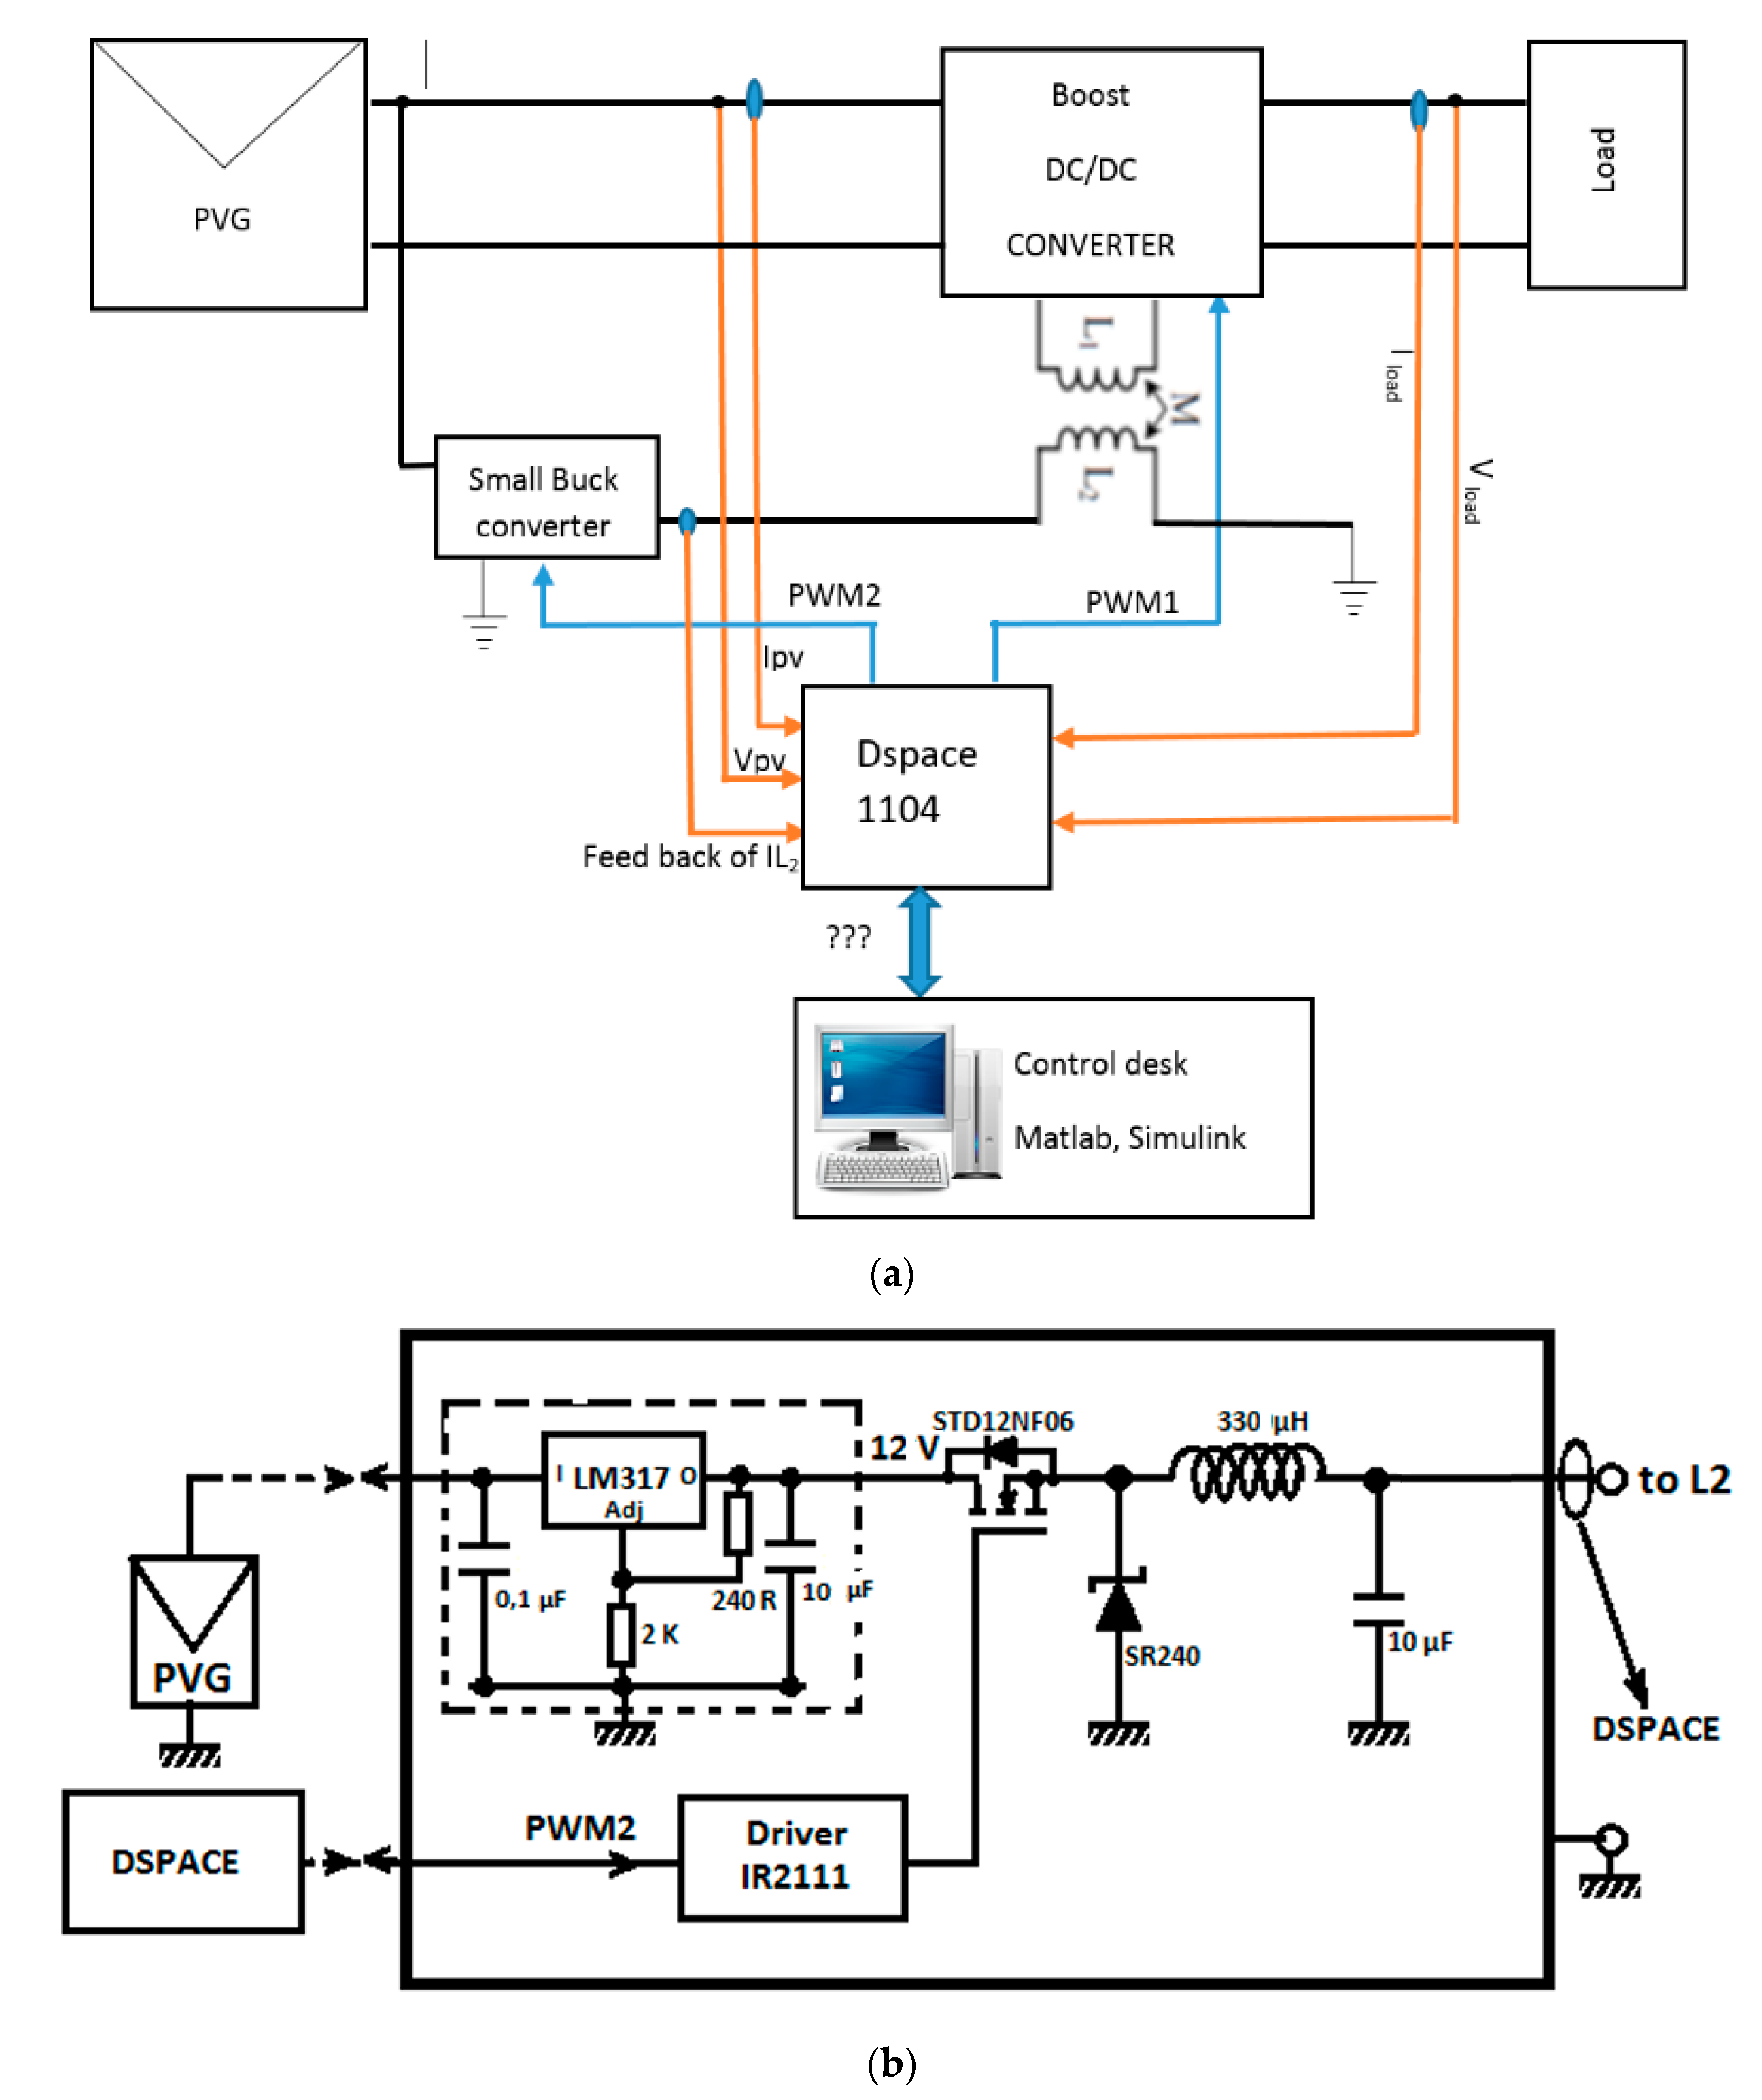
2.2. Proposed DC/DC Converter

The sizing of conventional DC/DC converter components is heavily based on the nominal input power. In Table 1, a pre-sizing of inductor values for different current values and duty cycle values is given by Equation (A13) in the Appendix A. It can be observed that the optimal value of the inductor heavily varies according to the input current and to the duty cycle value. It is clear that the duty cycle changes because of the MPPT controller. In Table 1, the values of the table are calculated using Vi = 42 V (the value of Vi corresponds to the nominal MPP value of a SANYO HIP-215NKHE5 PV panel, which will be used in experimental measurements) with three values of duty cycle (d = 0.1, 0.5 and 0.9) for different current levels at a switching frequency 20 kHz and a ripple of 10%.
Indeed, the sizing of the inductor becomes a tedious task for PV applications where the current varies steadily, and using only one value of the inductance results in power loss. To reduce this power loss, the inductor can be sized for the maximum current. However, this design choice results in an increased cost and more area occupation.
In the following section we propose a solution to fix the above-mentioned problem. We propose to adaptively adjust the inductor value through an auxiliary circuit in order to maximize the power efficiency of the converter. The new proposed topology is presented in Figure 4 where a coupled inductor, L1–L2, is adopted instead of a simple inductor.
To realize the coupled inductor, a second coil is introduced to the inductor magnetic core, as described in the next subsection. The two electromagnetic fields created by the two coils constitute the total electromagnetic field in the core. Any change in the electromagnetic fields results in a change in the inductors values. To benefit from this feature, an external circuit is added to make L1 adaptive to the input current, Ii. The current I2 that flows through L2 is controlled to generate a variable electromagnetic field, therefore changing the value of L1. The reference current I2ref that I2 must follow is calculated based only on the measured current Ii.

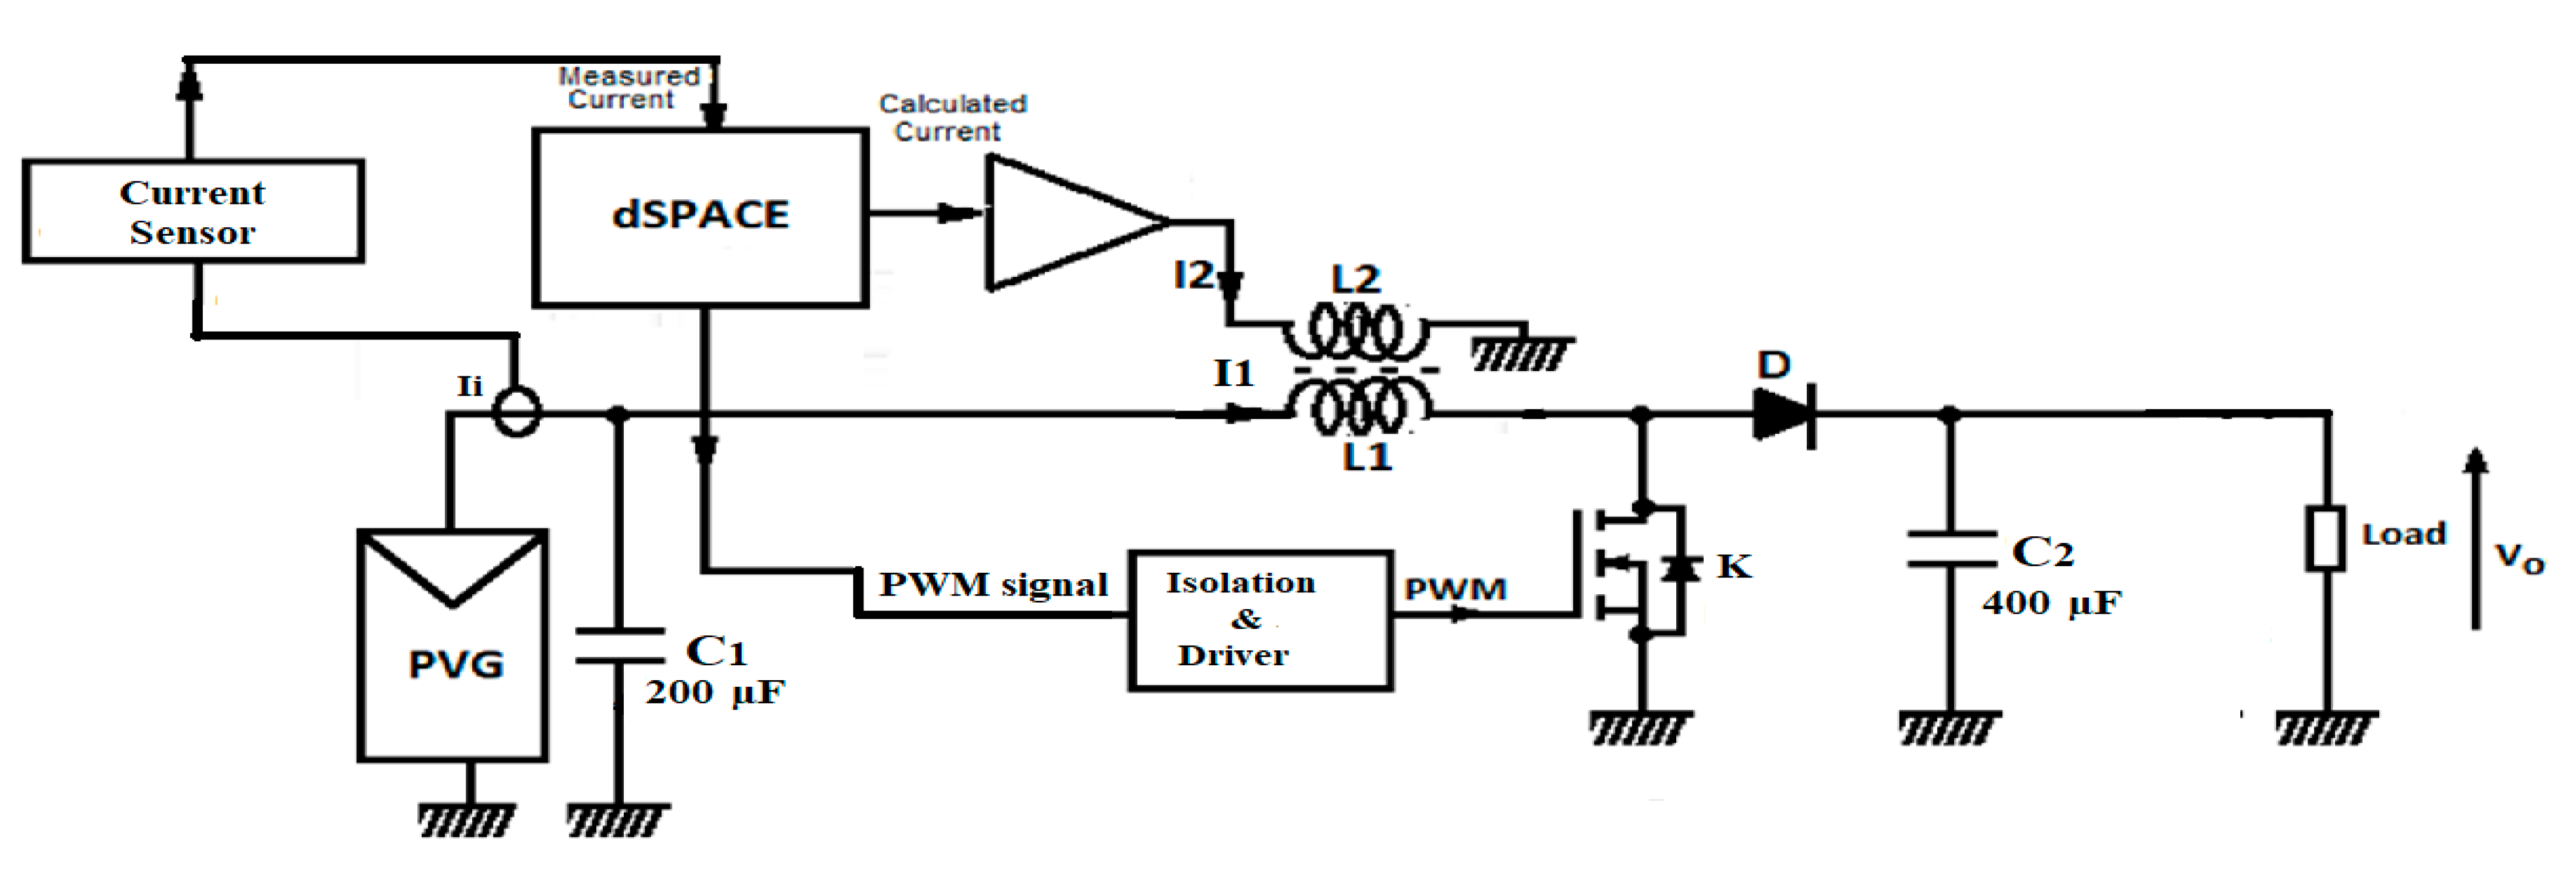
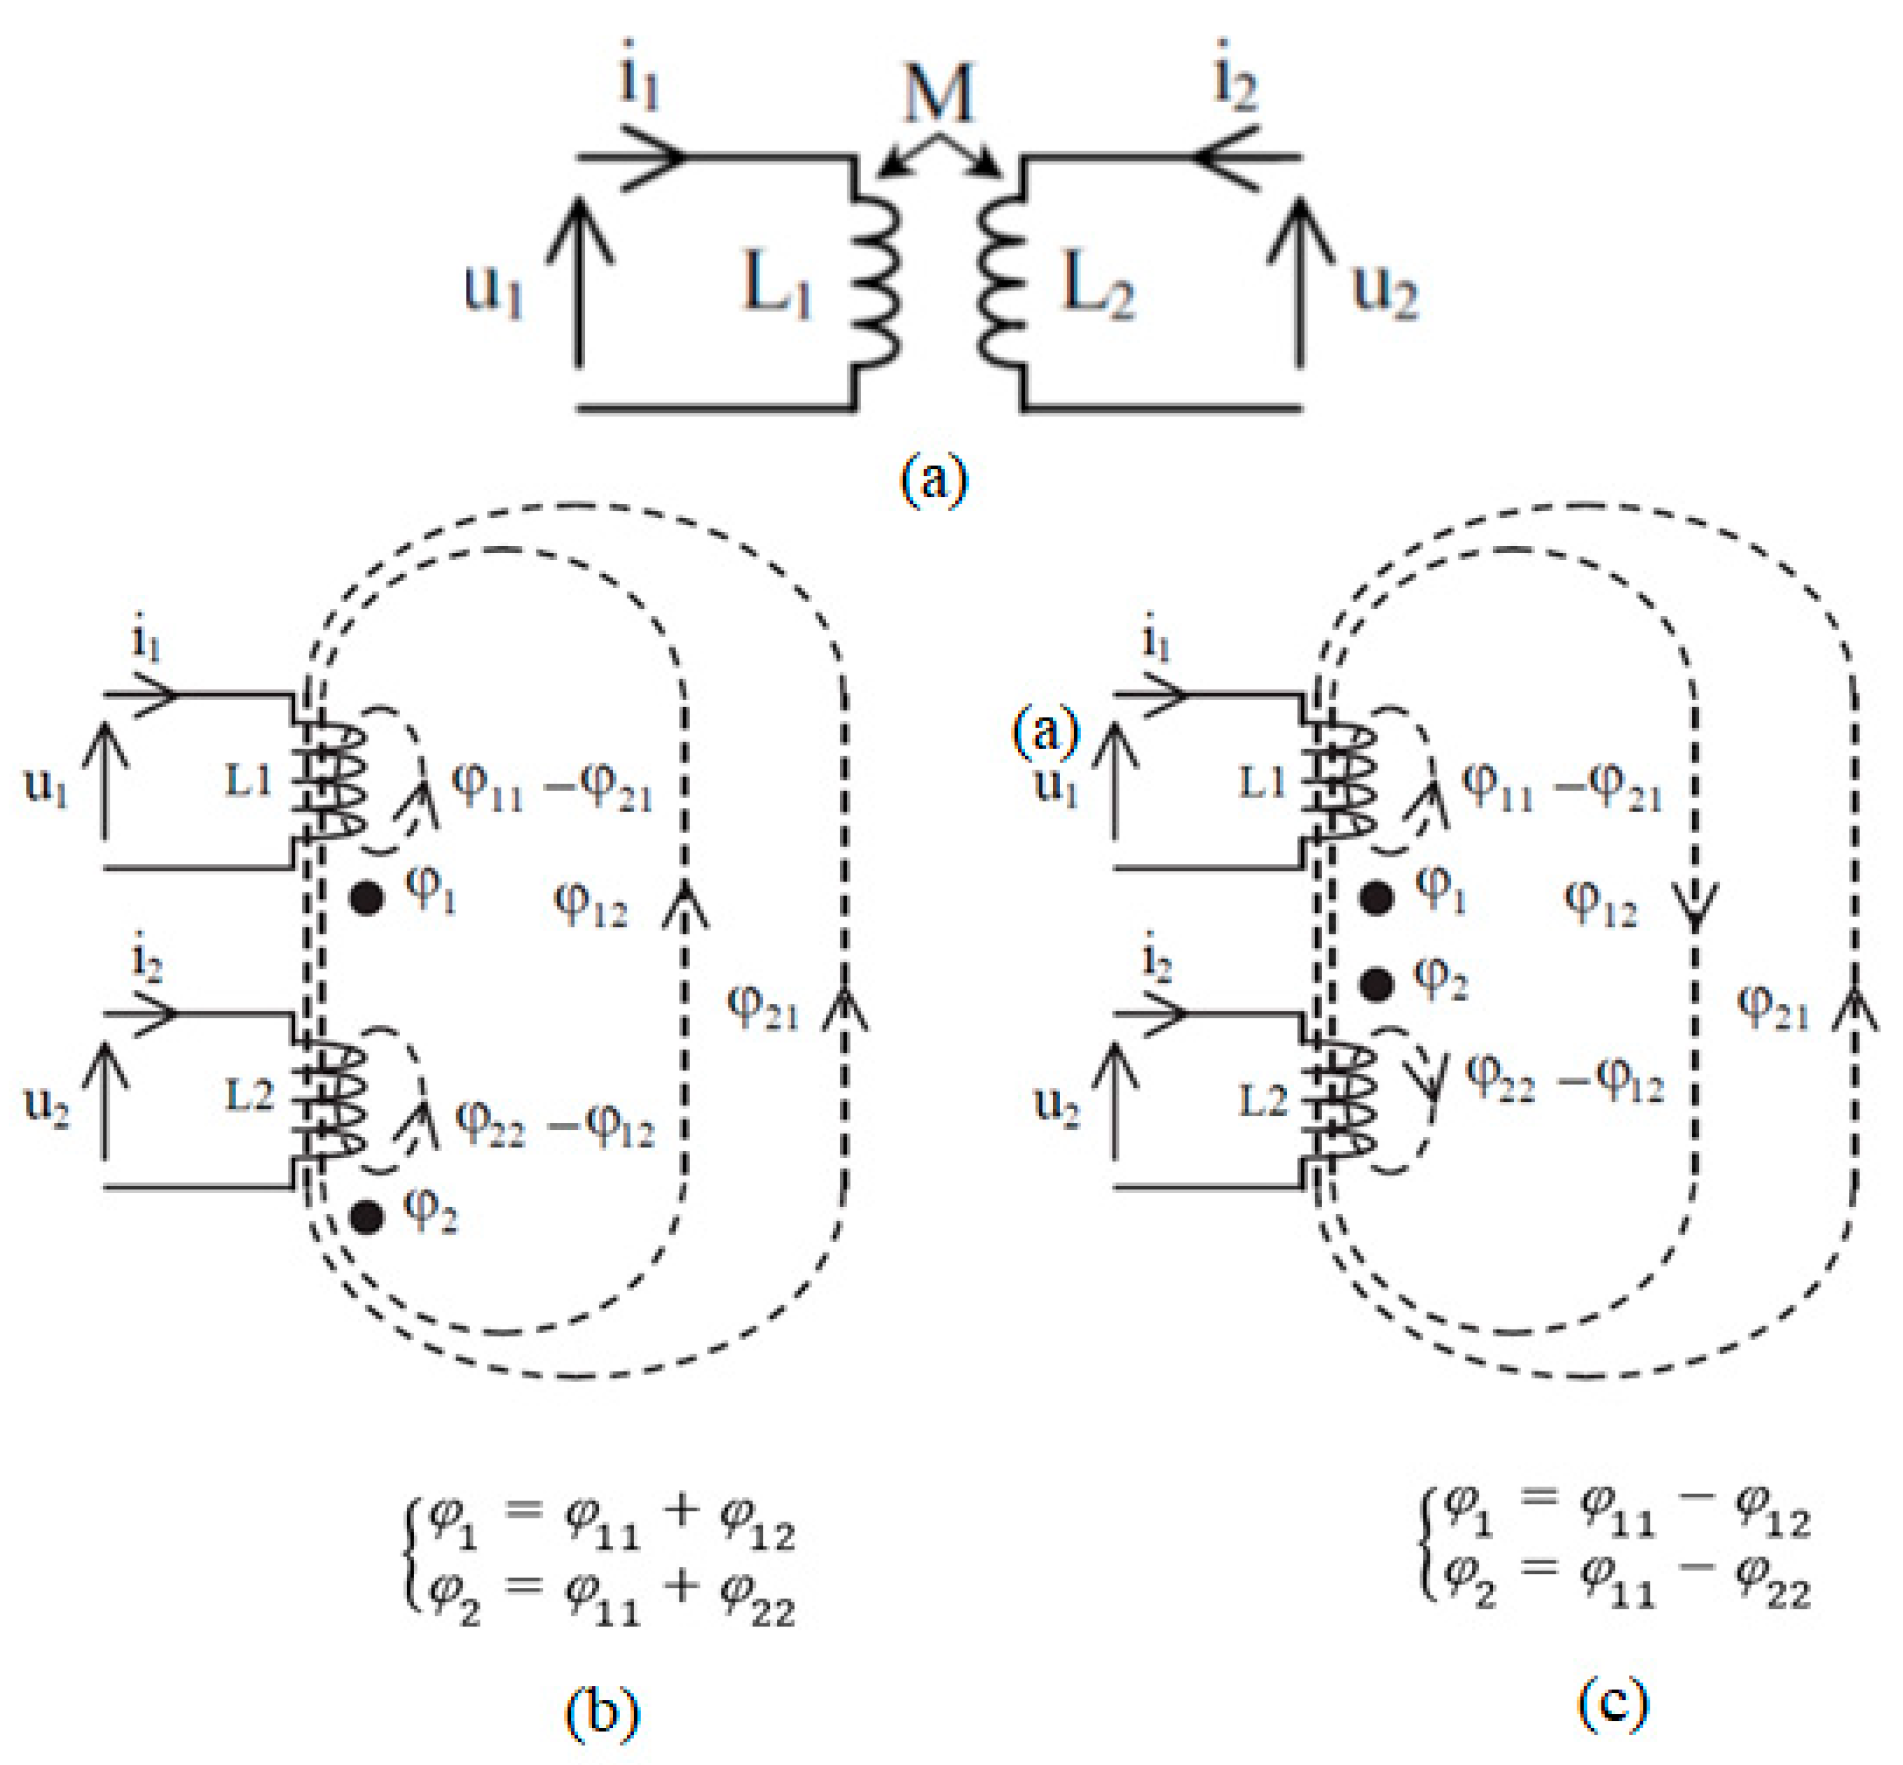
2.2.1. Coupled Inductor Analysis and Implementation

A power inductor is composed of a winding and a magnetic core [19,20], as shown in Figure 5. The winding is typically made up of round Litz copper wire, which can pass a high current at a given voltage. The role of the magnetic core is to channel the magnetic field lines in order to transfer or to store energy. Materials with high permeability, supporting a significant induction field without saturation and with low losses at the target switching frequency are required. In our application, the coupled inductor is made of the magnetic core ETD 49 [21] and a copper winding.
Inductor losses occur from two sources, namely the losses in the core and the losses generated in the windings. Winding losses are due to the wire resistance, R, and are evaluated by Ampere’s law Ploss_wdg= Ri2. In this study ohmic winding losses are not considered and the focus is mainly on the core losses. Based on theory and empirical tests [16,17,18,19,20] core losses depend directly on the hysteresis loop and to the maximum flux, Bmax. Consequently, we must avoid flux saturation on the core to avoid losses.
The hysteresis characteristic of an inductor is presented in Figure 6. Depending on the inductor core size, it is known that in B = f(H) characteristics, the linear region can be long or short. When the core size increases, the achieved maximum current in the linear region increases as well. To avoid a complicated theoretical approach, we reduce the hysteresis loop to a linear relationship between flux, B, and magnetic field, H. In the conventional power converters, under all operating conditions of the PVG, the inductor operation point needs to meet the linear region of the B-H curve [17,18,19,20].
The sensing of the PV current in Figure 6 allows us to know the operating point position of the inductor on the hysteresis characteristic. Indeed, since the total flux is given by [17,18,19,20]
φ T = N 2 i
where is the reluctance of the magnetic core, N is the coil number of turns, and the inductance, L, is defined as the ratio between the total flux, φ T , and the current, i flowing in the winding
L =   φ T i
The flux is therefore proportional to the current that flows into the inductor. Consequently, the inductor core is sized to function in the linear region where the maximum dissipated current into the inductor does not exceed one third (1/3) of the nominal PVG current. This means that the inductor could operate in the saturation zone when the PVG current increases, as shown in Figure 6.
To avoid saturation, we propose to add a second coil in order to produce an additional flux in the magnetic core. The latter can be added or subtracted from the first one, depending on the direction of the second flux.
The basic model of a coupled inductor is shown in Figure 7. The coil L1 traversed by the current i1 produces the flux φ 11 self-induction through each turn of L1 and the mutual flux φ 21 through each turn of L2. Similarly, the coil L2 traversed by the current i2 produces the self-induction flux φ 22 through each turn of L2 and the mutual flux φ 12 through each turn of L1. Fluxes φ 11 , φ 21 and fluxes φ 21 , φ 22 are added to each part (Figure 7b), or subtracted (Figure 7c), according to the positive direction of currents chosen arbitrarily, and the winding of the coils direction [17,18,19,20].
Assuming that the flux coil is the same for each turn, the total flux is given by
{ φ 1 Tot = φ 11 Tot + a   φ 12 Tot =   L 1 i 1 + M i 2 φ 2 Tot = a φ 21 Tot + φ 22 Tot =   M i 1 + L 2 i 2
where N1, L1 and i1 (N2, L2 and i2) are the number of turns, self-inductance and current of the first (second) coil, parameter a is equal to 1 or −1 for additive or subtractive case, respectively, and M is the mutual inductance between L1 and L2. Note that the sign of M is equal to that of a.
Figure 8a depicts the assembly of the studied coupled inductor based on an ETD 49 magnetic core, whereas Figure 8b shows the assembled device used in experimental measurements. Note that in the application of the standard inductor we use the same assembly where we use only one coil.

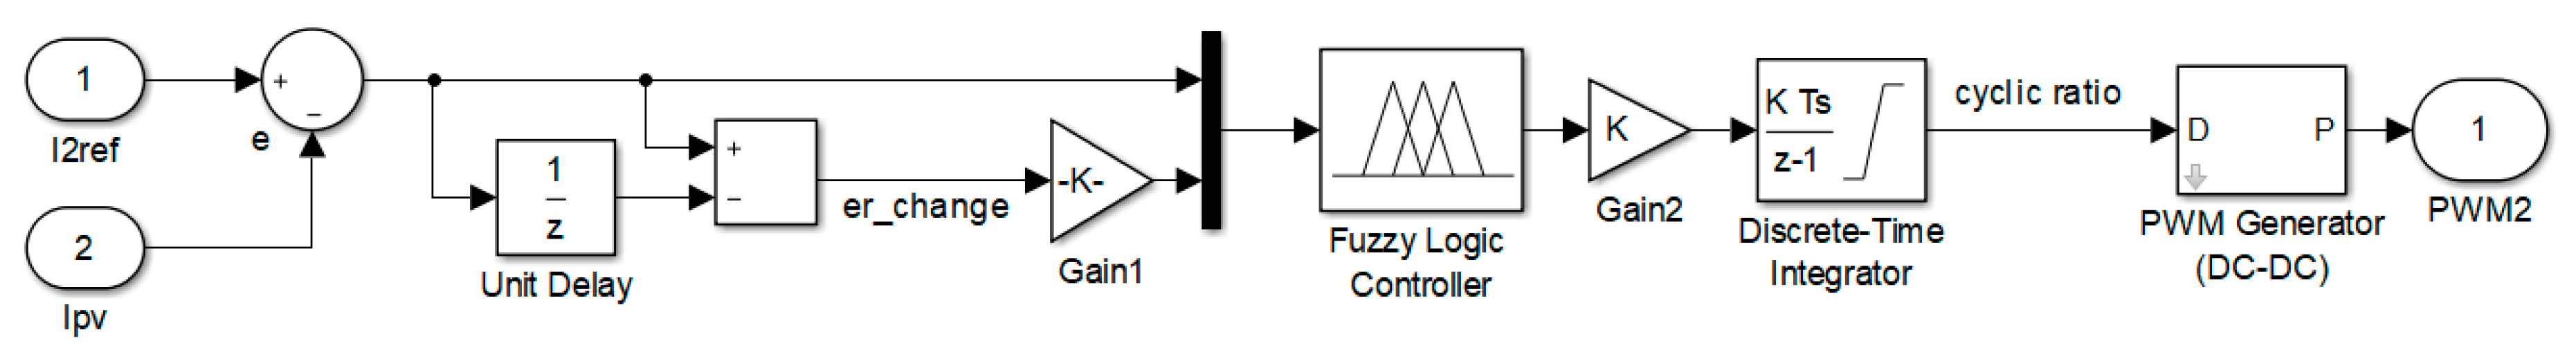
2.2.2. Design of the Fuzzy Controller

The average current generated by PVG follows solar radiation, G. When the radiation is increased (decreased), the operating point of the inductor in the B-H curve moves to (from) the saturation zone. The inductor value in this case must follow any changes in the generated current.
From this observation, the idea to integrate a fuzzy control came up [14,22]. From the deviation between the current I2 and its reference, I2ref, coming from the measured Ipv, we can decide whether to increment, decrement or keep the same duty cycle. One of the advantages of this strategy is that only one measurement is required, namely the inductor current i2.
The control diagram is presented in Figure 9. The fuzzy algorithm has been designed using two linguistic input variables (error and change in error). Five membership functions have been chosen for each variable. The output of the algorithm gives the required duty cycle of the converter. The membership functions of the input and output variables are highlighted in Figure 10a,b, respectively. The used fuzzy rules are summarized in Table 2.
Figure 11 shows the result of the FC: reference current (I2ref) in red color and measurement current (Ipv) in blue. We note that the FC achieved good tracking performances.

3. Results

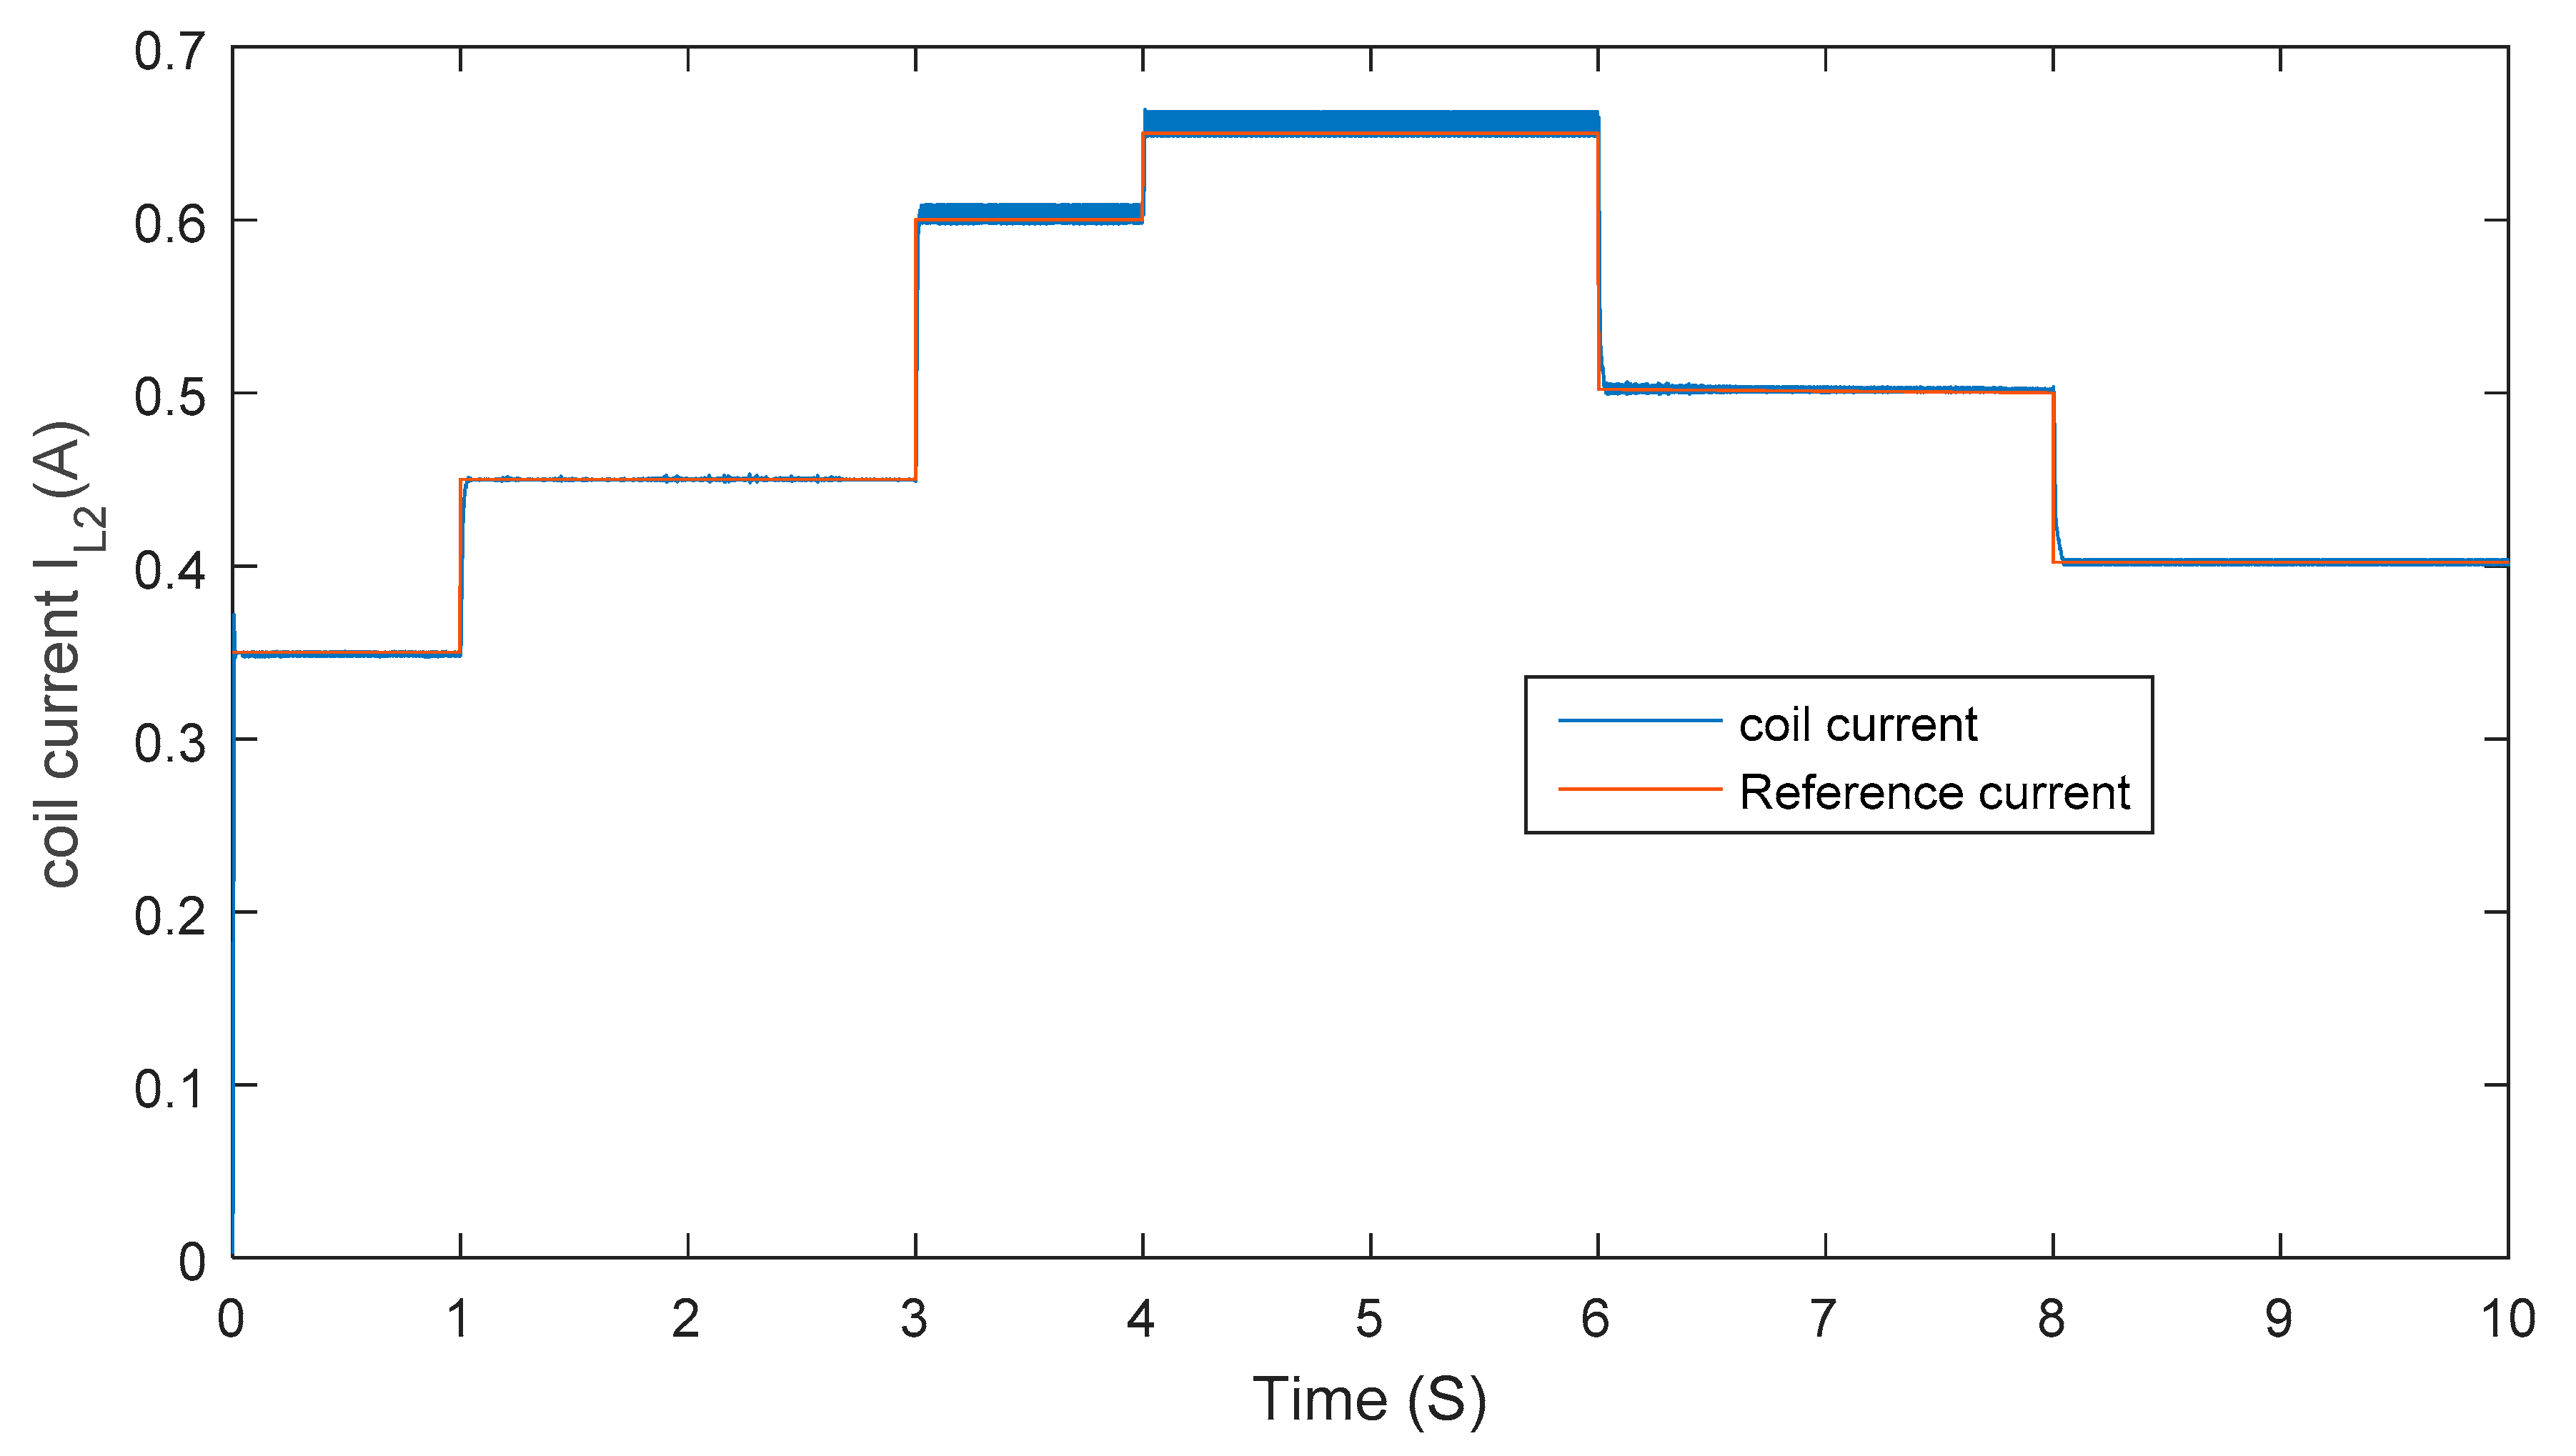
3.1. Simulation Results

To model a magnetic core from the datasheet of ETD 49 core, which is constructed using 3C90 material with the following parameters (effective area Ae = 211 mm2, Area product = 57,600 mm4, magnetic conductance AL = 4200 nH, with L = AL·N2). Our inductor was calculated by taking d = 0.5 and I = 3 A. We have to wire a coil of N = 28 turns for L1 and N = 12 turns for L2 using a wire of 2 mm and density of (2.5 A/mm2), and the PSpice Model Editor was used [21]. A co-simulation between Orcad and Simulink was used to simulate the system by using the SLPS block, as shown in Figure 12. SIMULINK was used to implement control part (P&O algorithm) and the PV panel of the system, while PSpice was used to model the conventional and proposed boost converter in Figure 3 and Figure 4, respectively.
Figure 13a shows the simulated input solar radiation of the PV panel while Figure 13b,c reports the simulated output power and power conversion efficiency of the conventional and proposed converter with the following element values (C1 = 200 µF, C2 = 400 µF, and L1 = 3500 µH), which are chosen corresponding to the used PV panel characteristics (SANYOHP). It can be observed that the power conversion efficiency of the proposed converter is about 9% higher than that of the conventional one when the radiation is equal to 1000 W/m2 (i.e., when the input current value is maximum), whereas the two converters show similar performance for values of radiation lower than 300 W/m2.

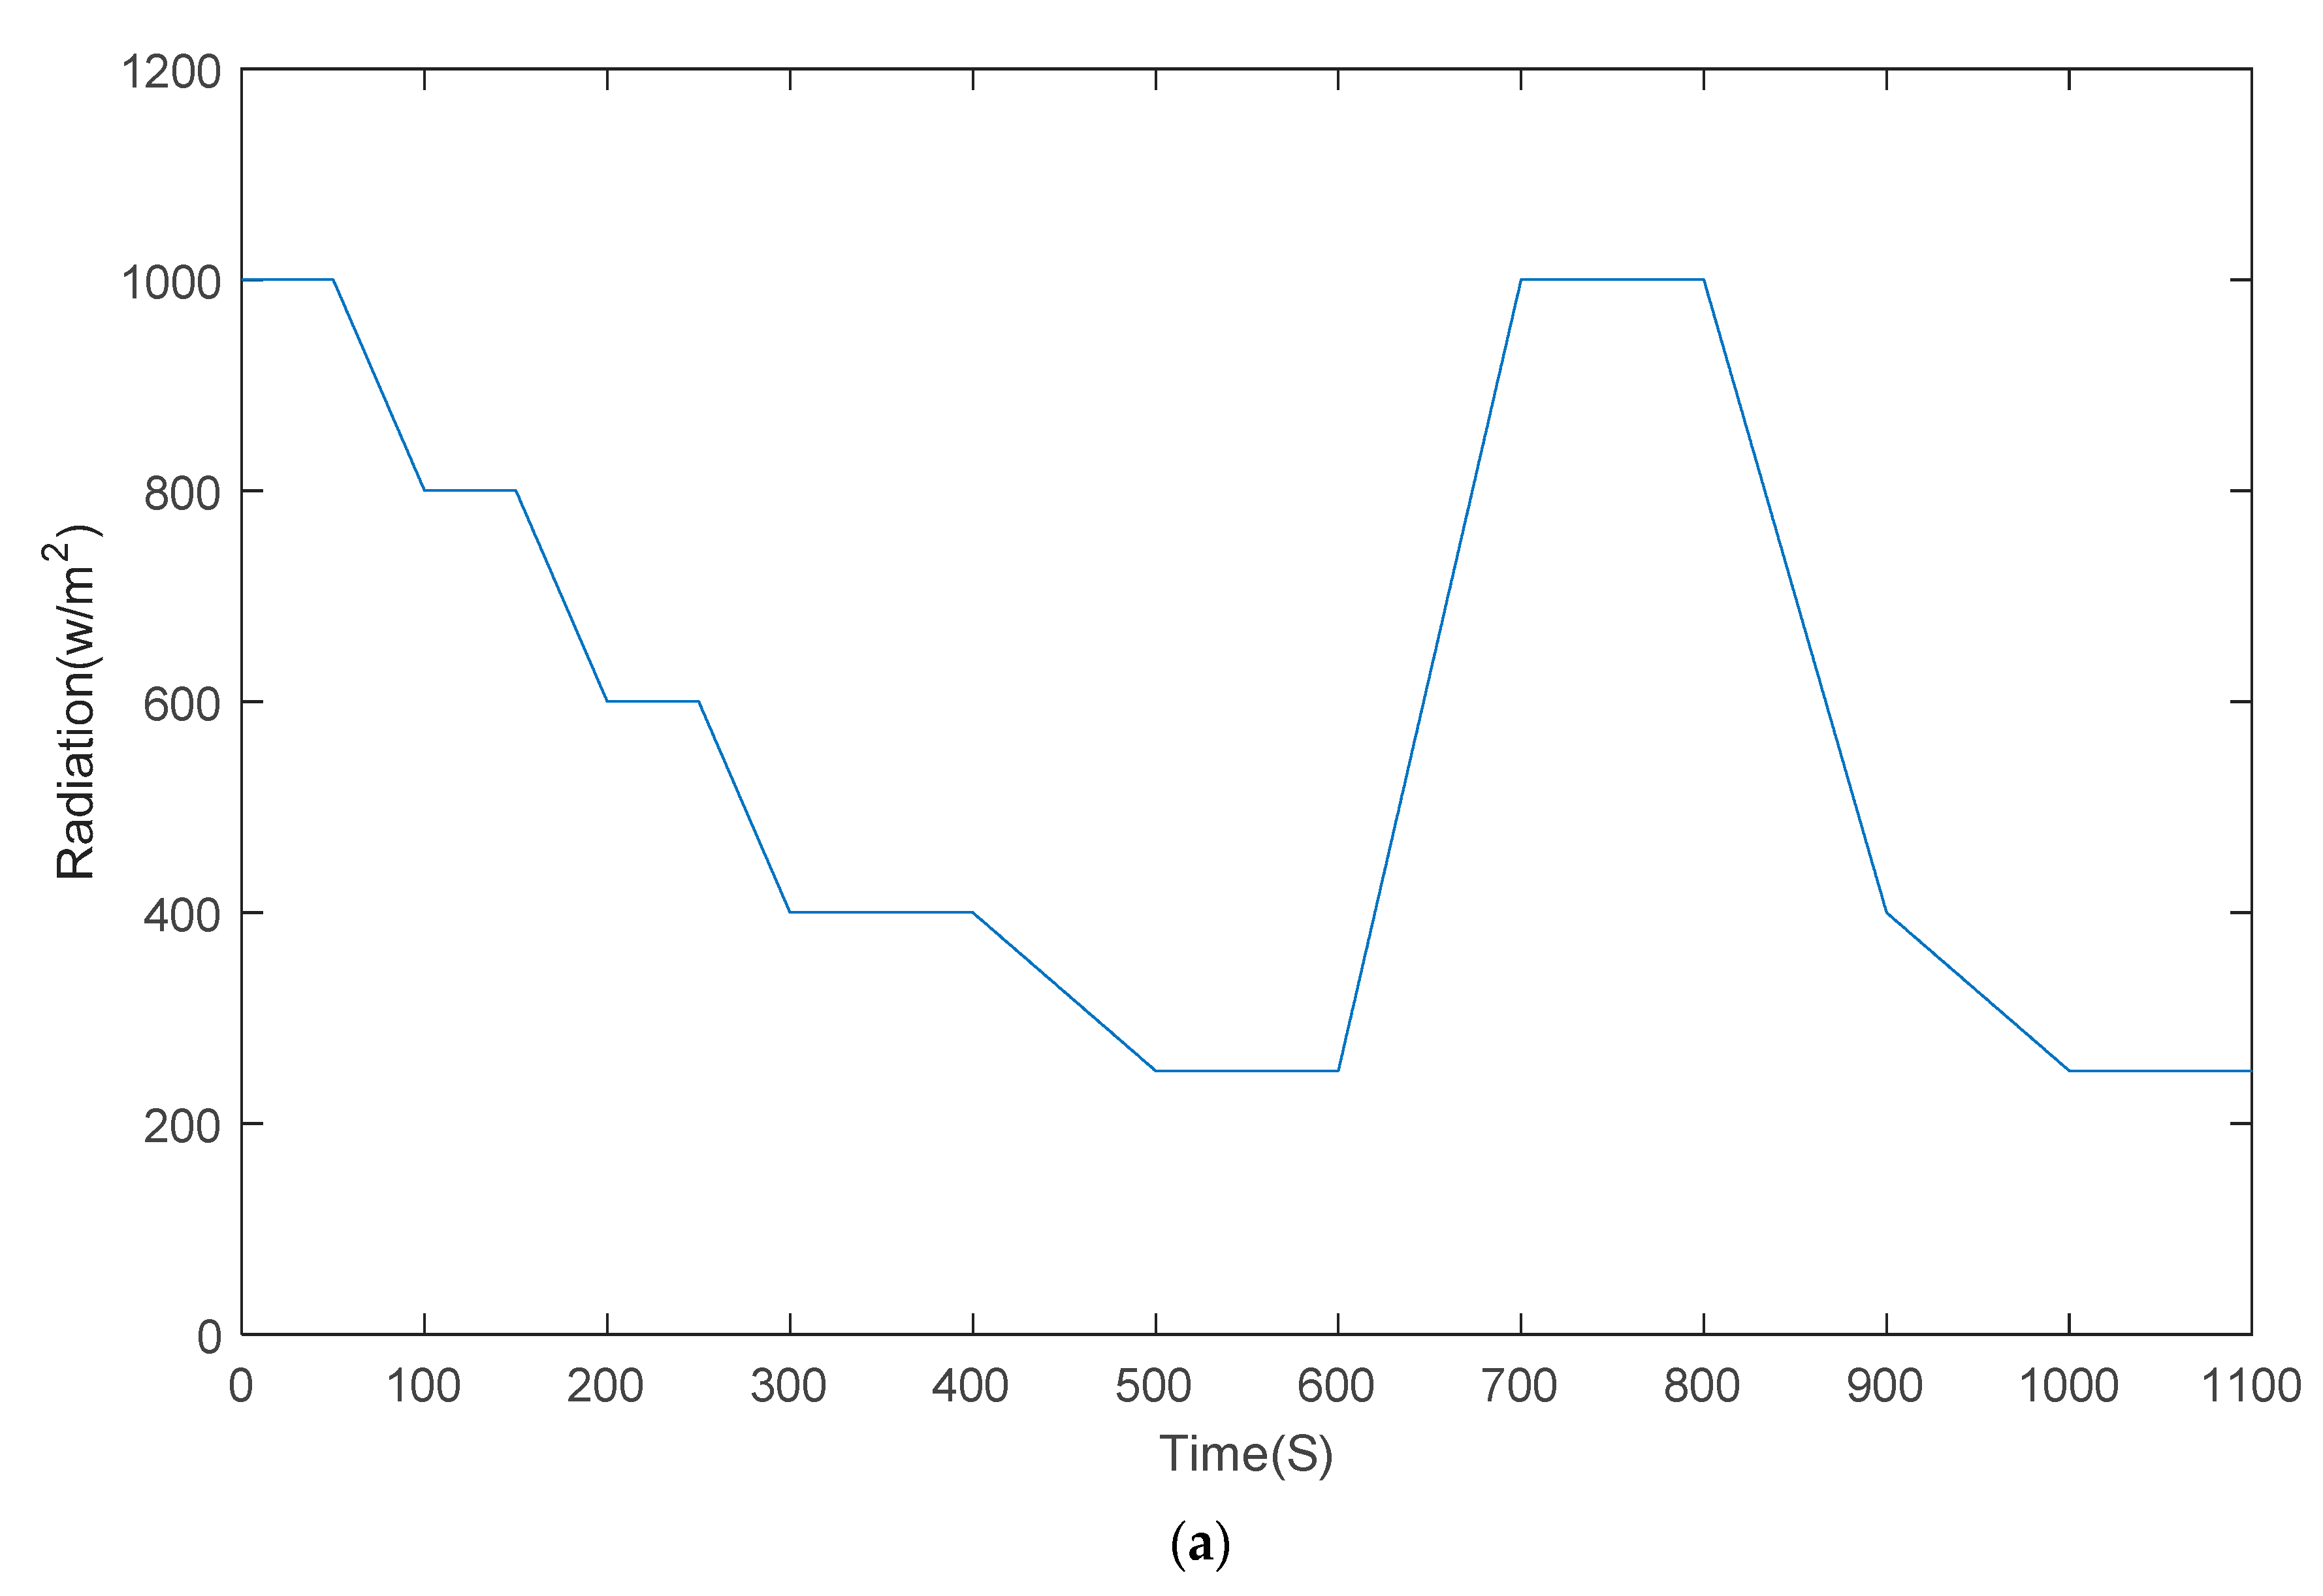
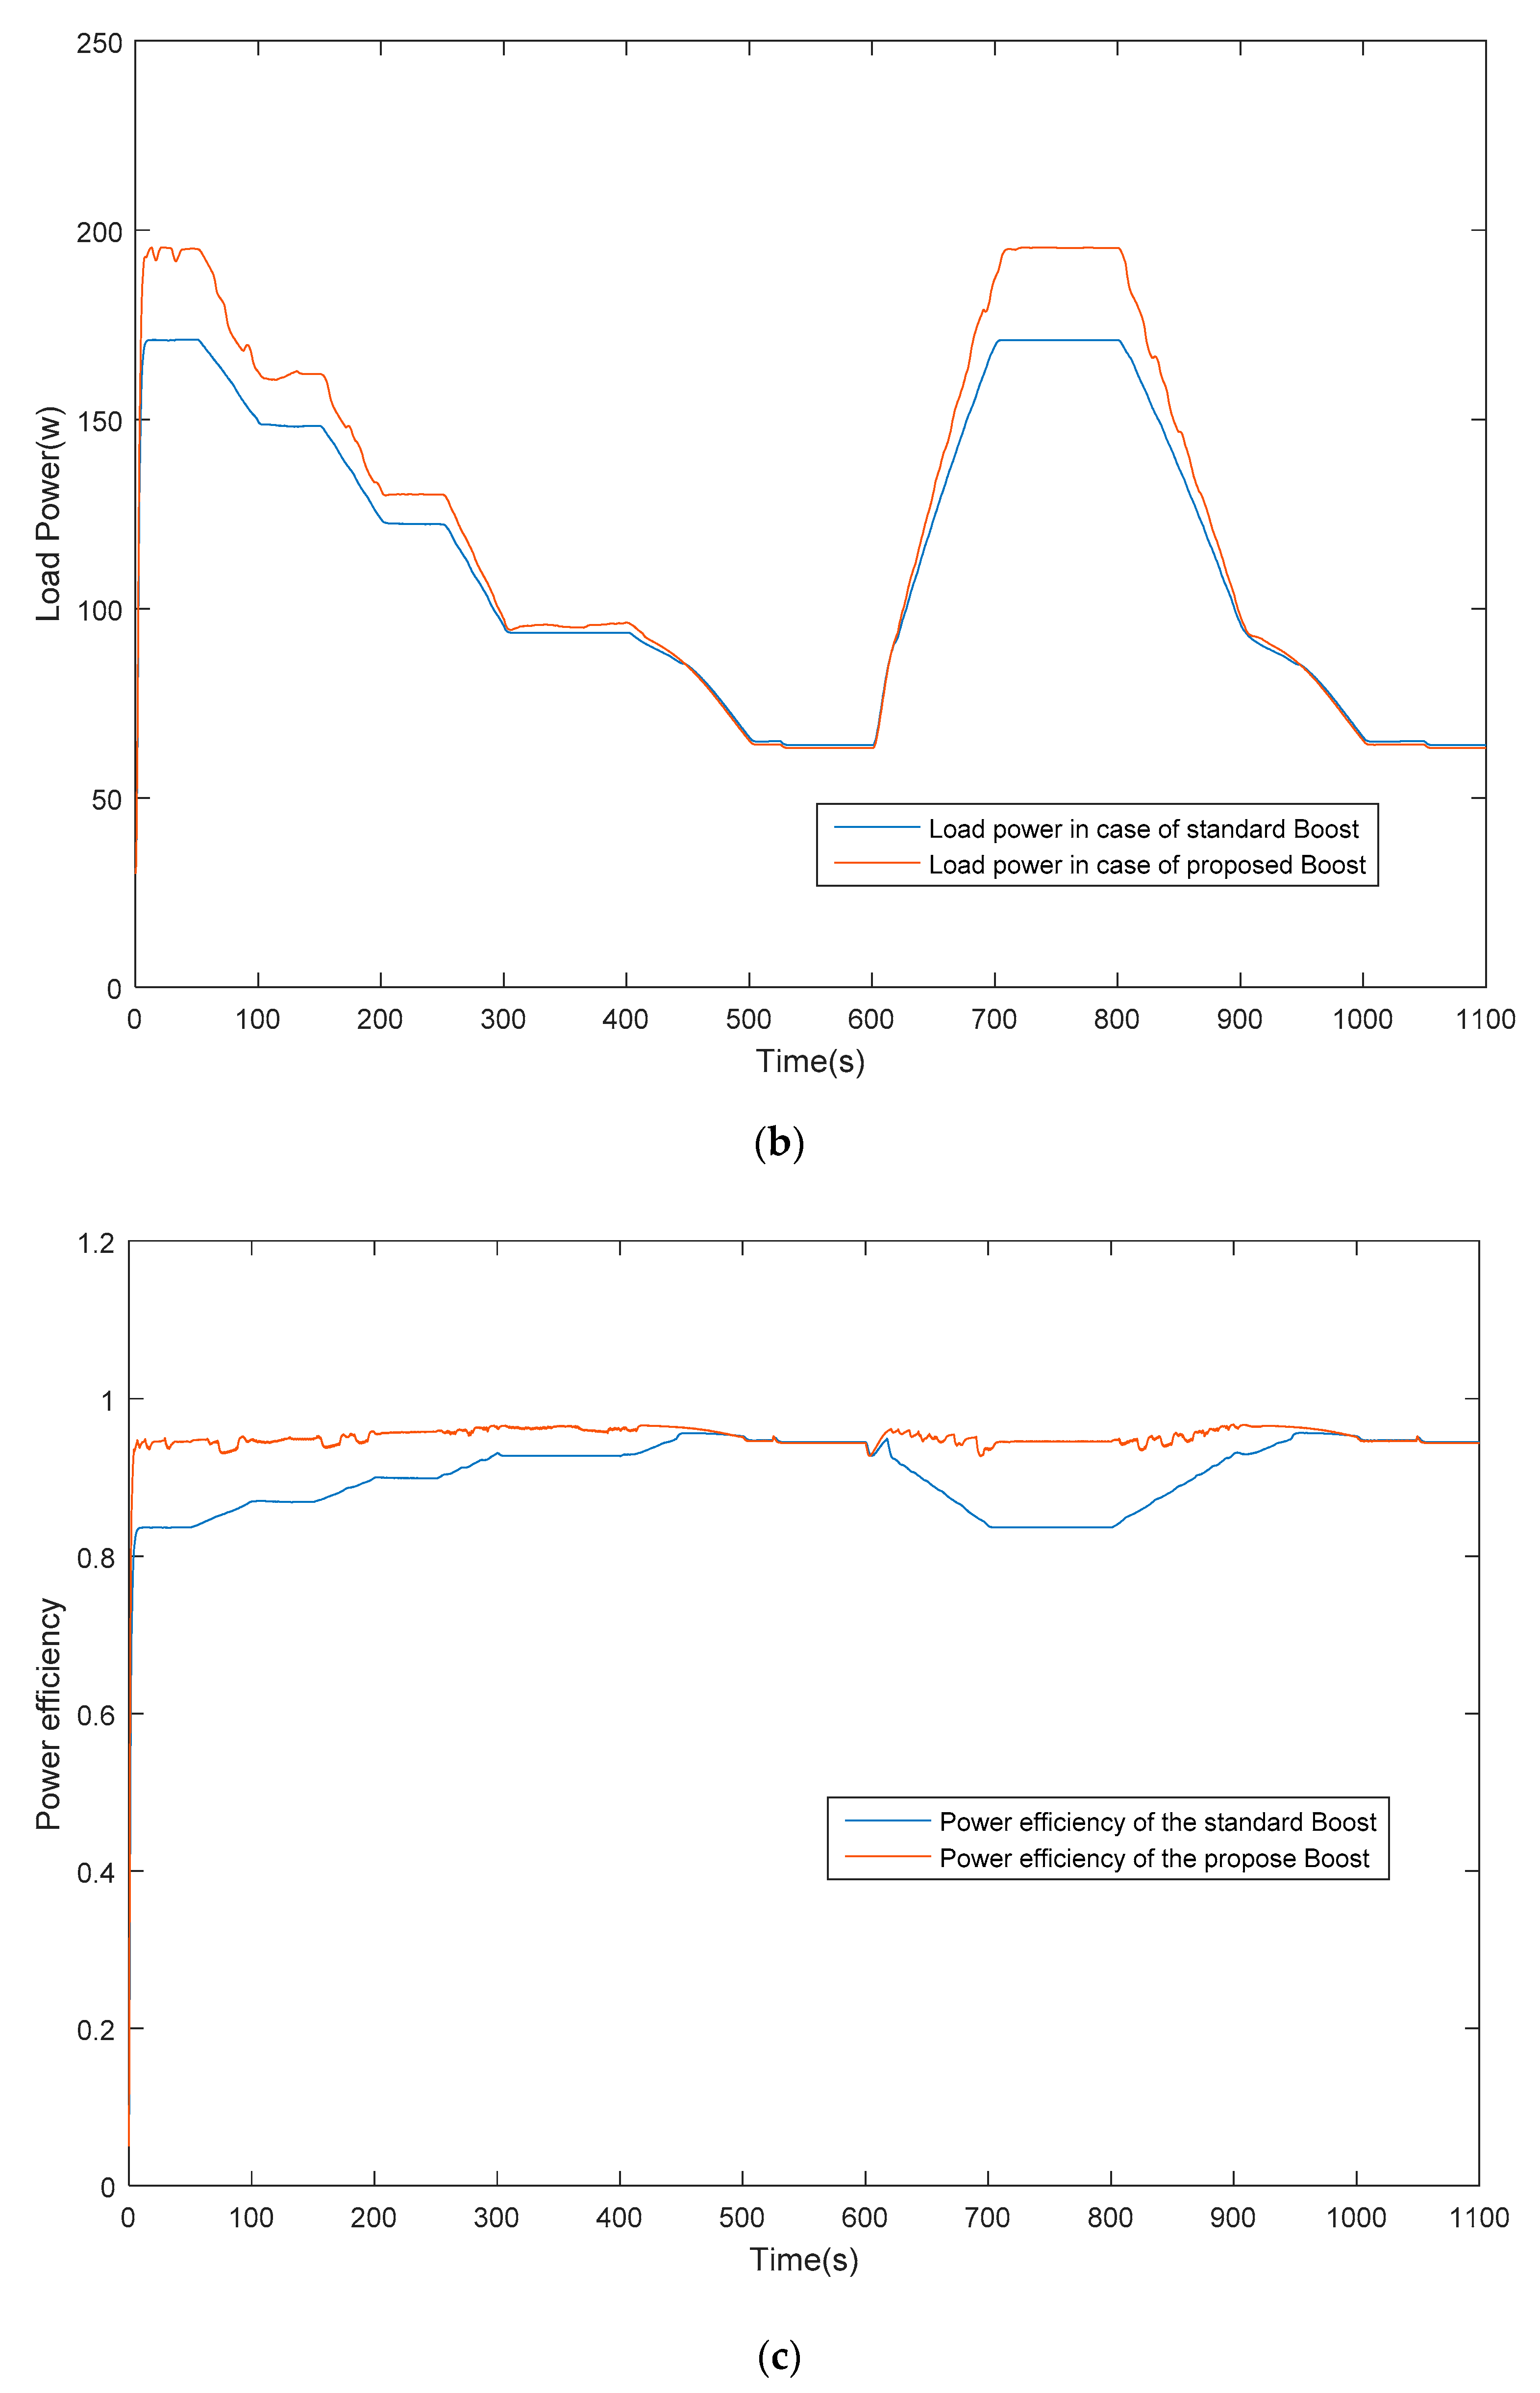
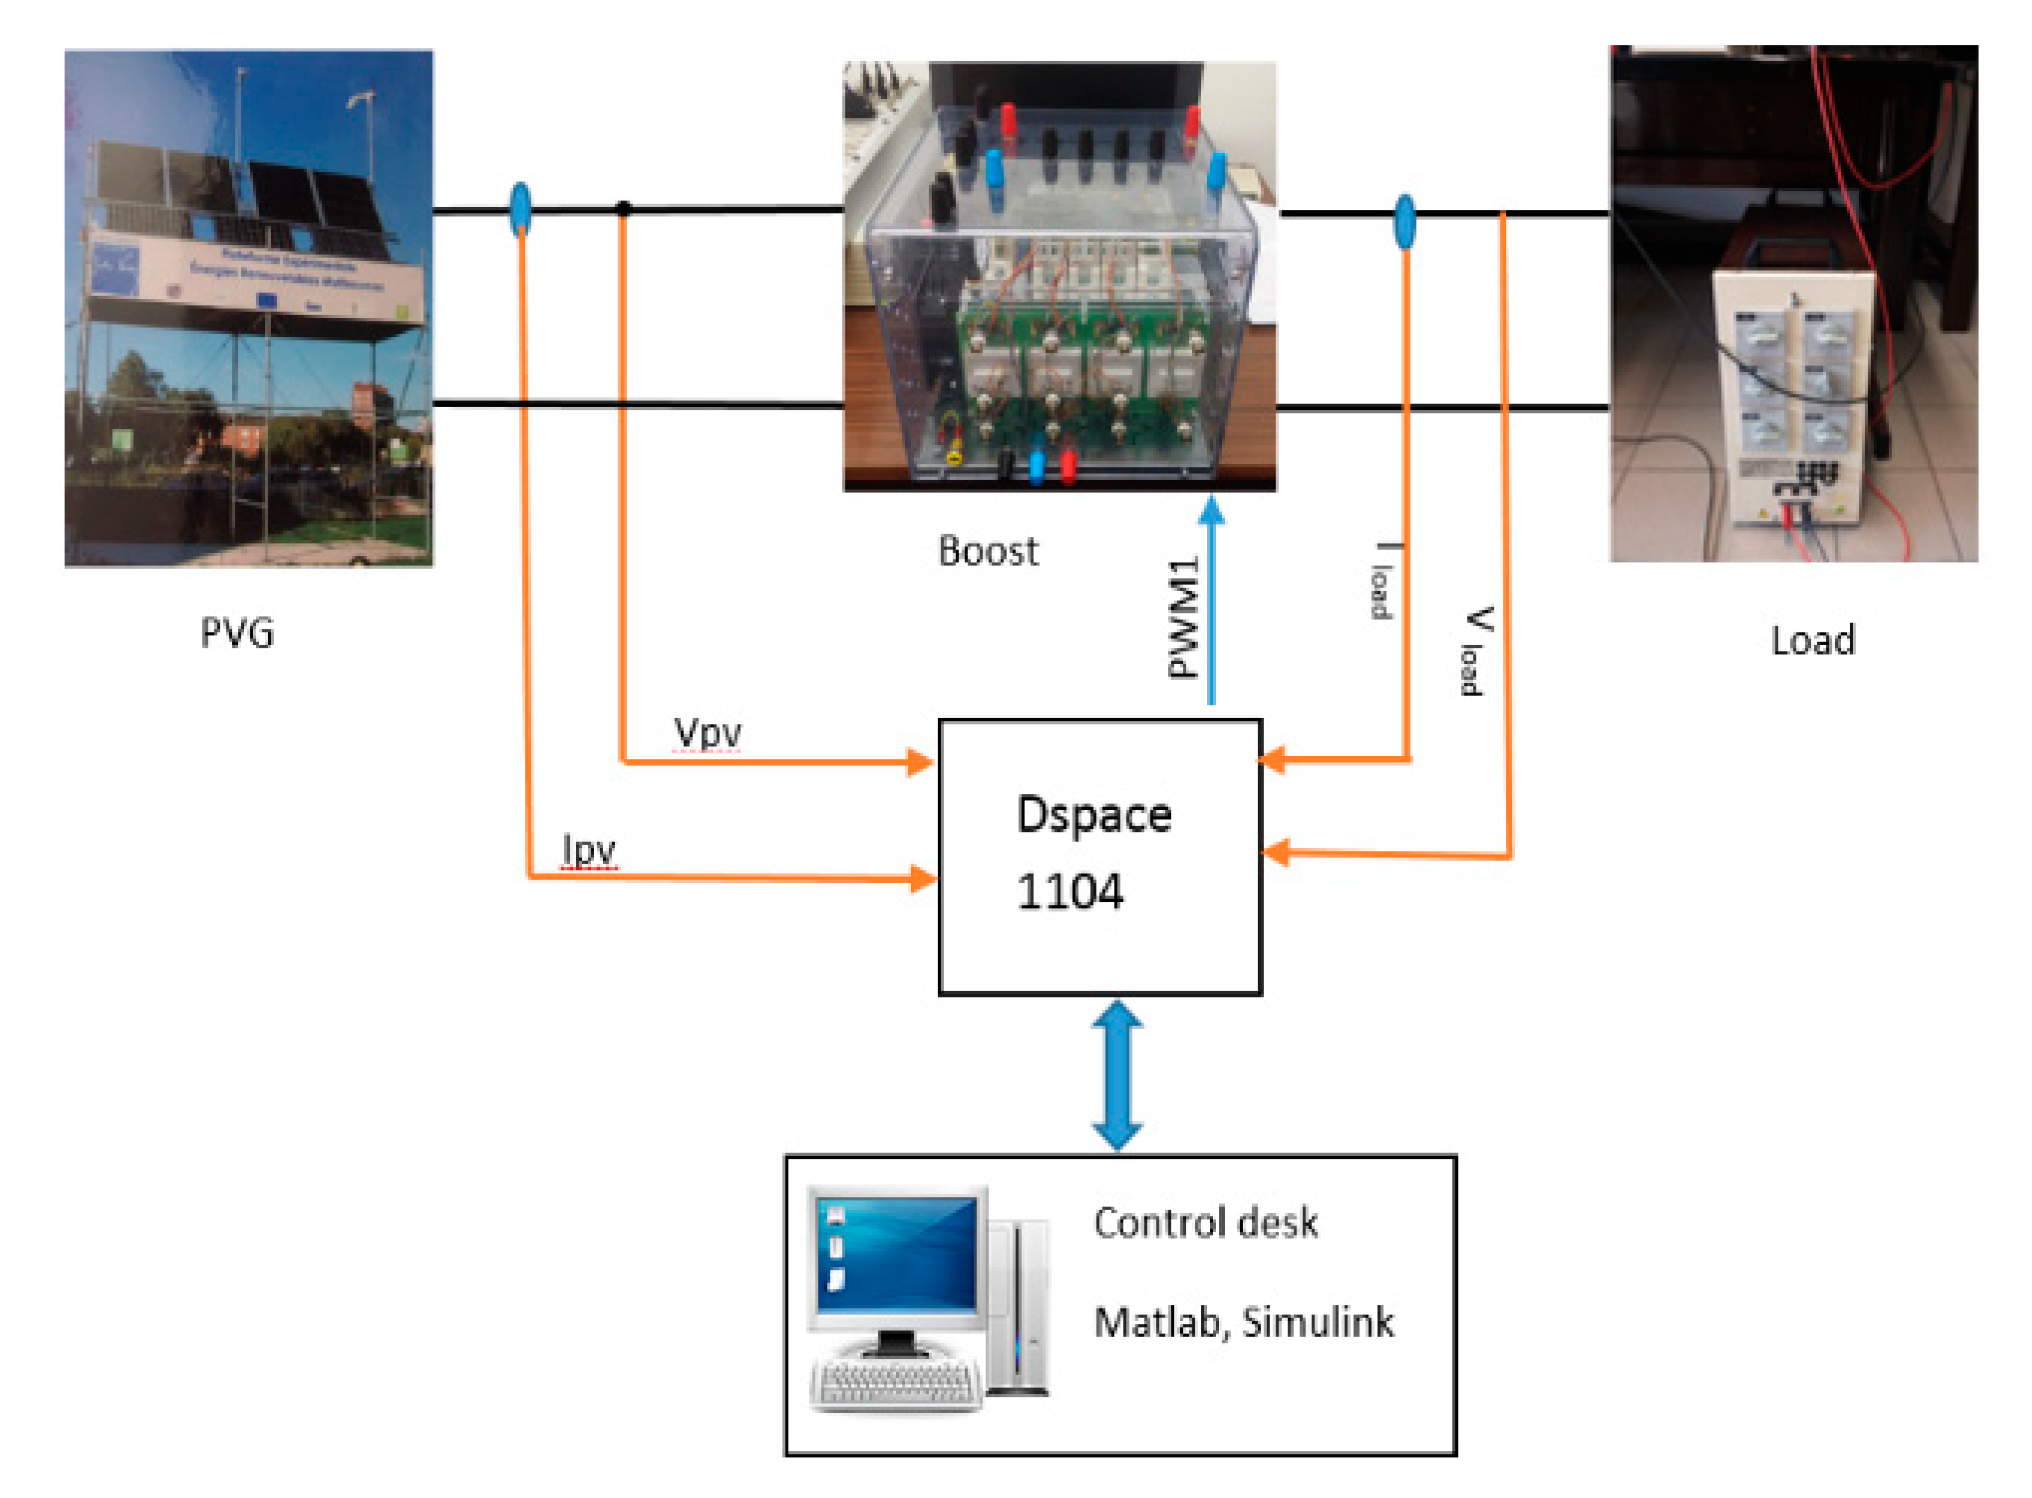
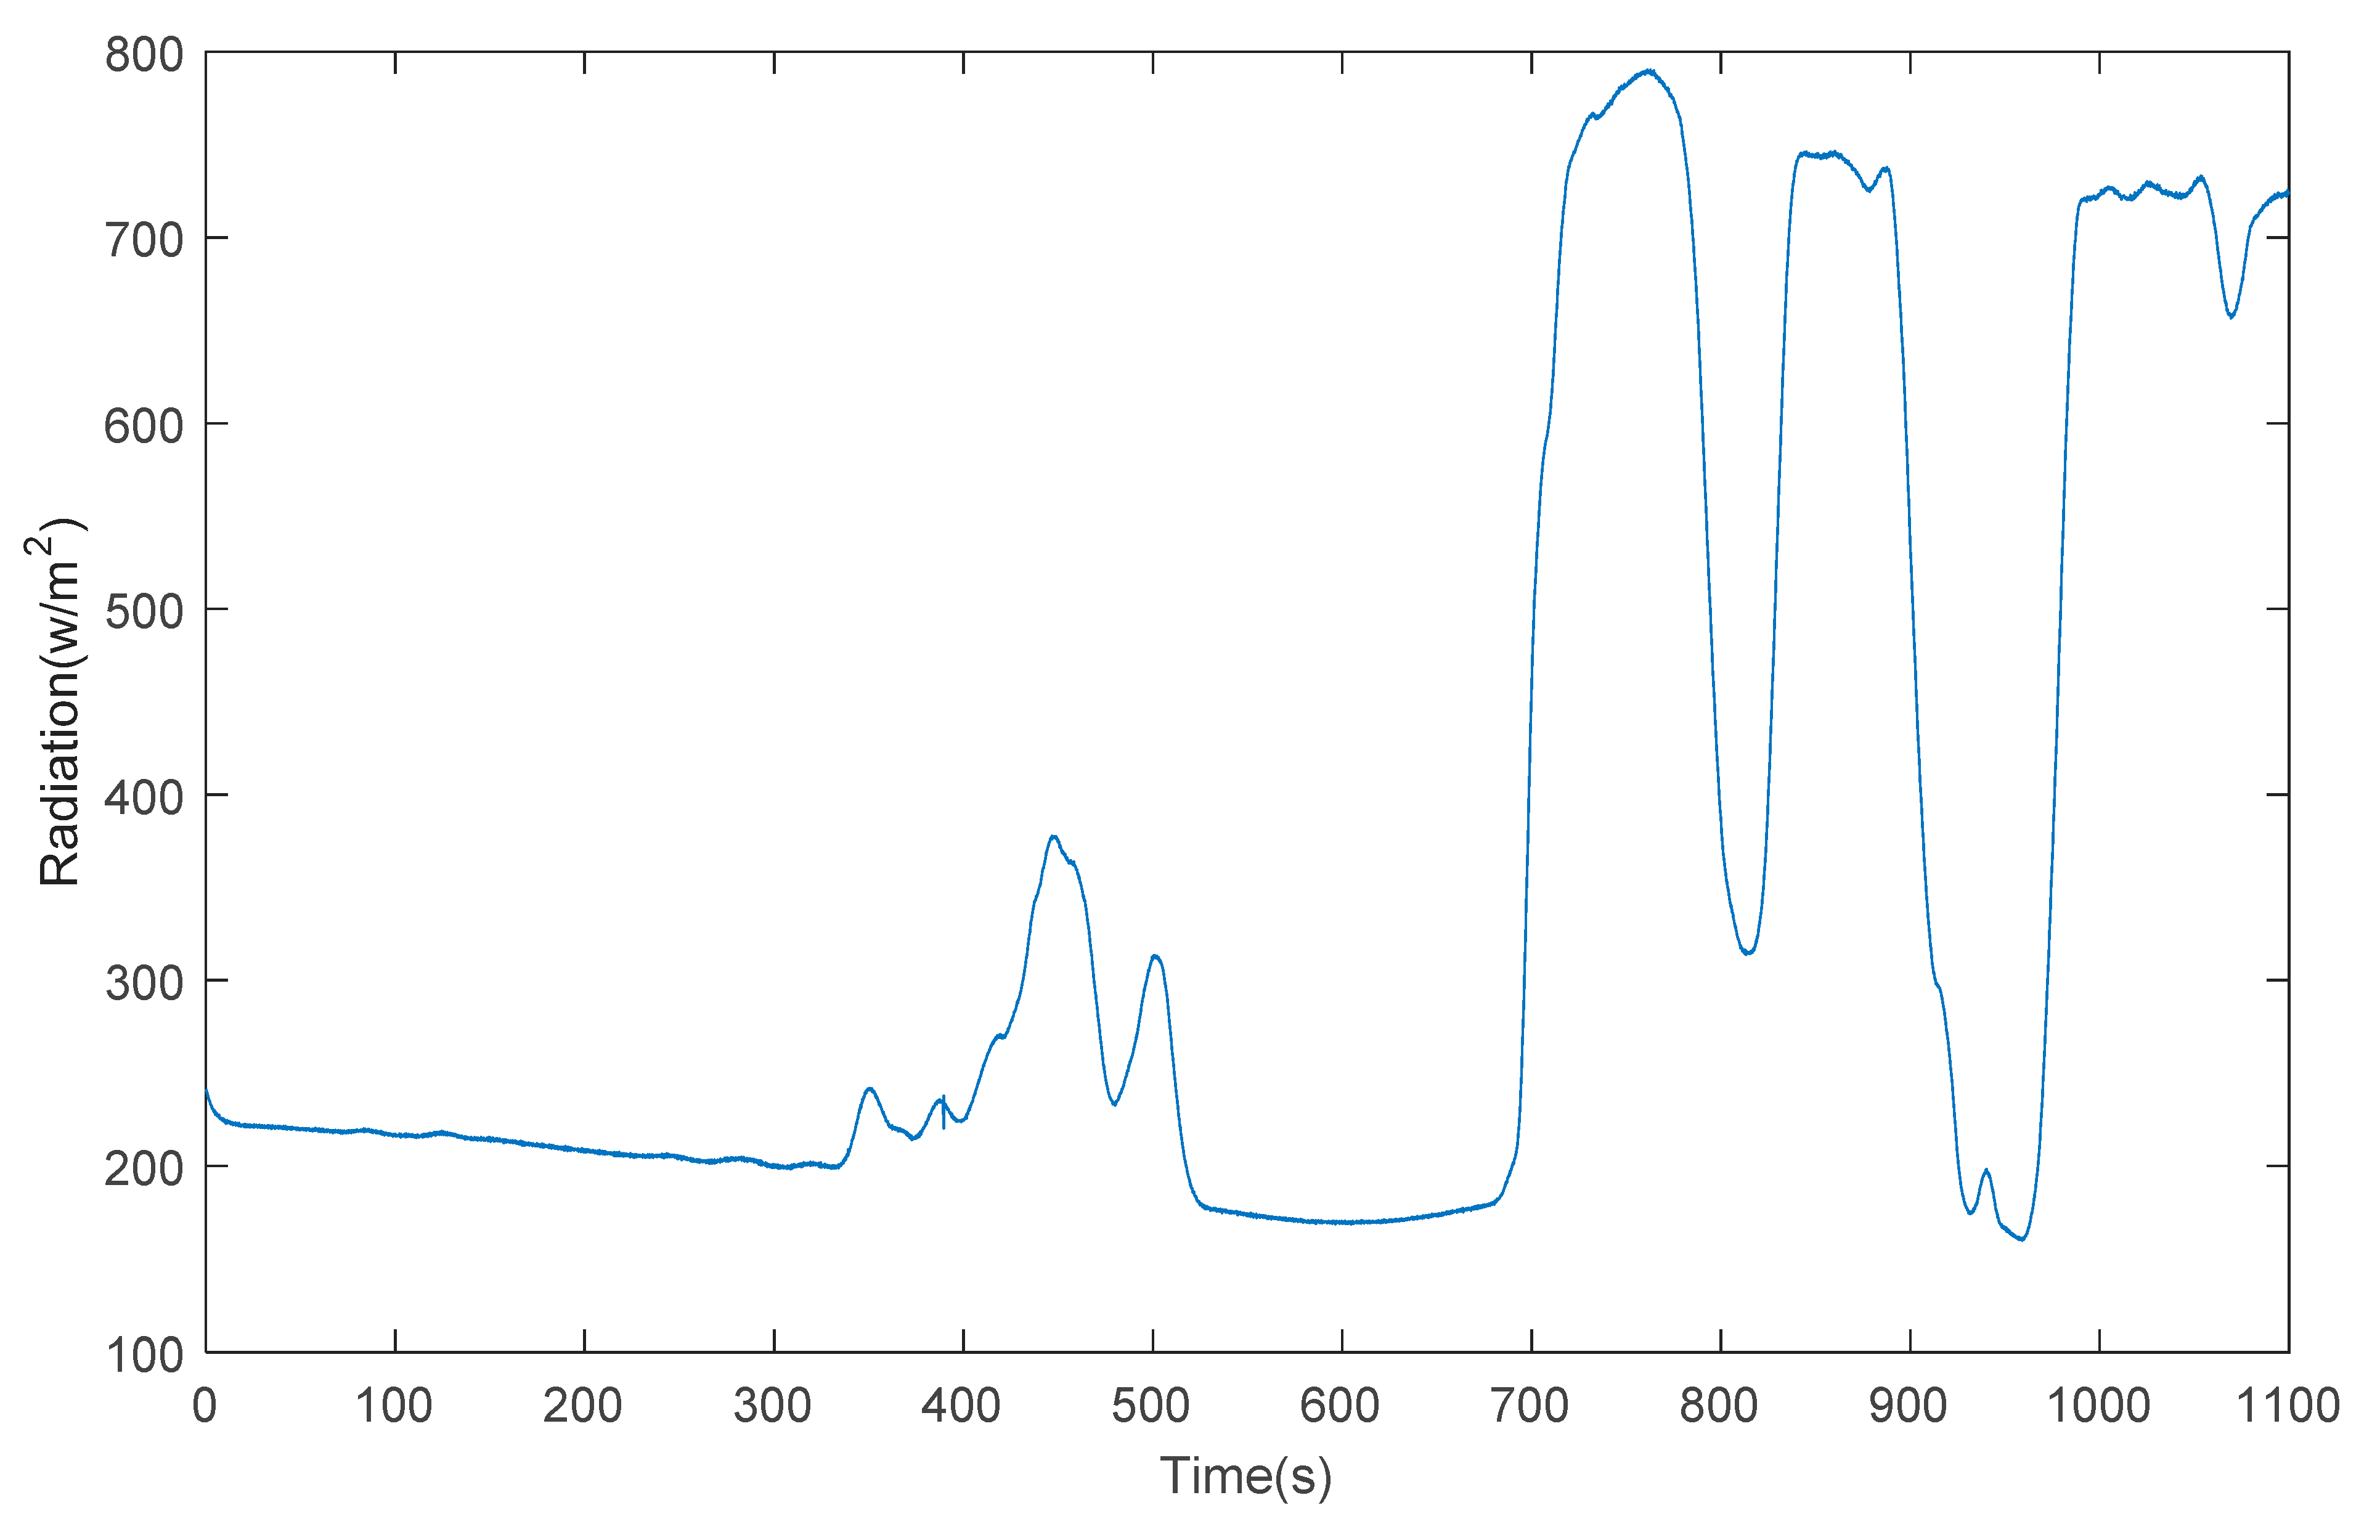
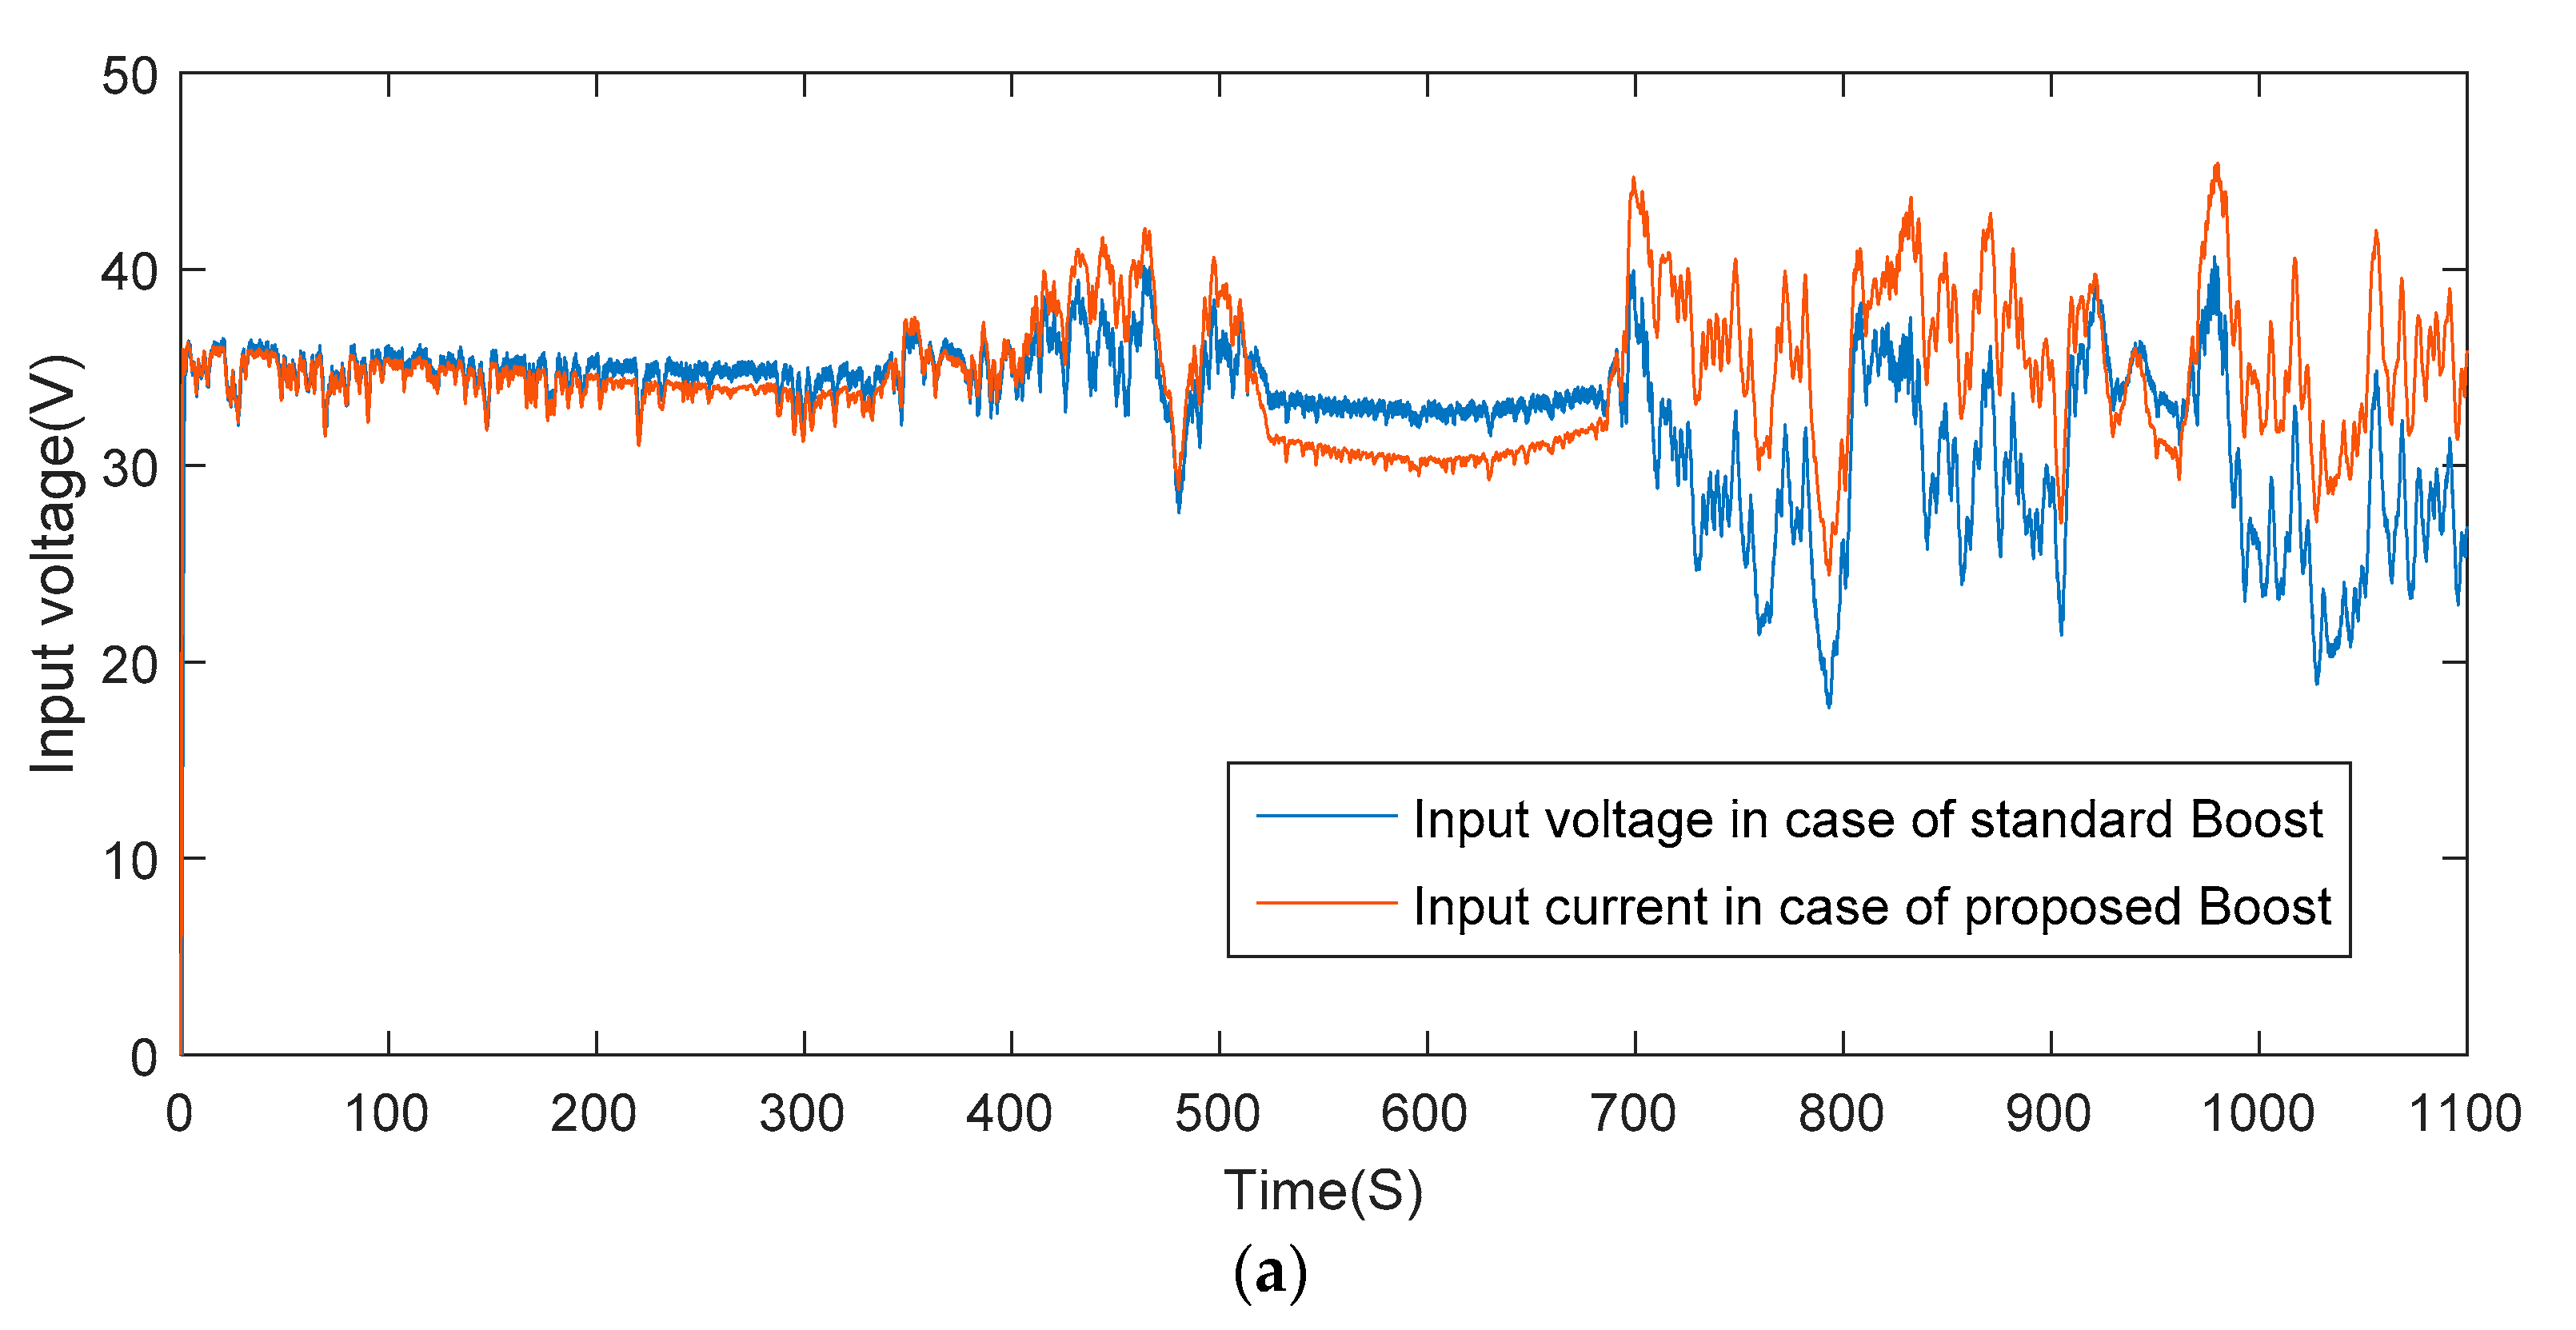
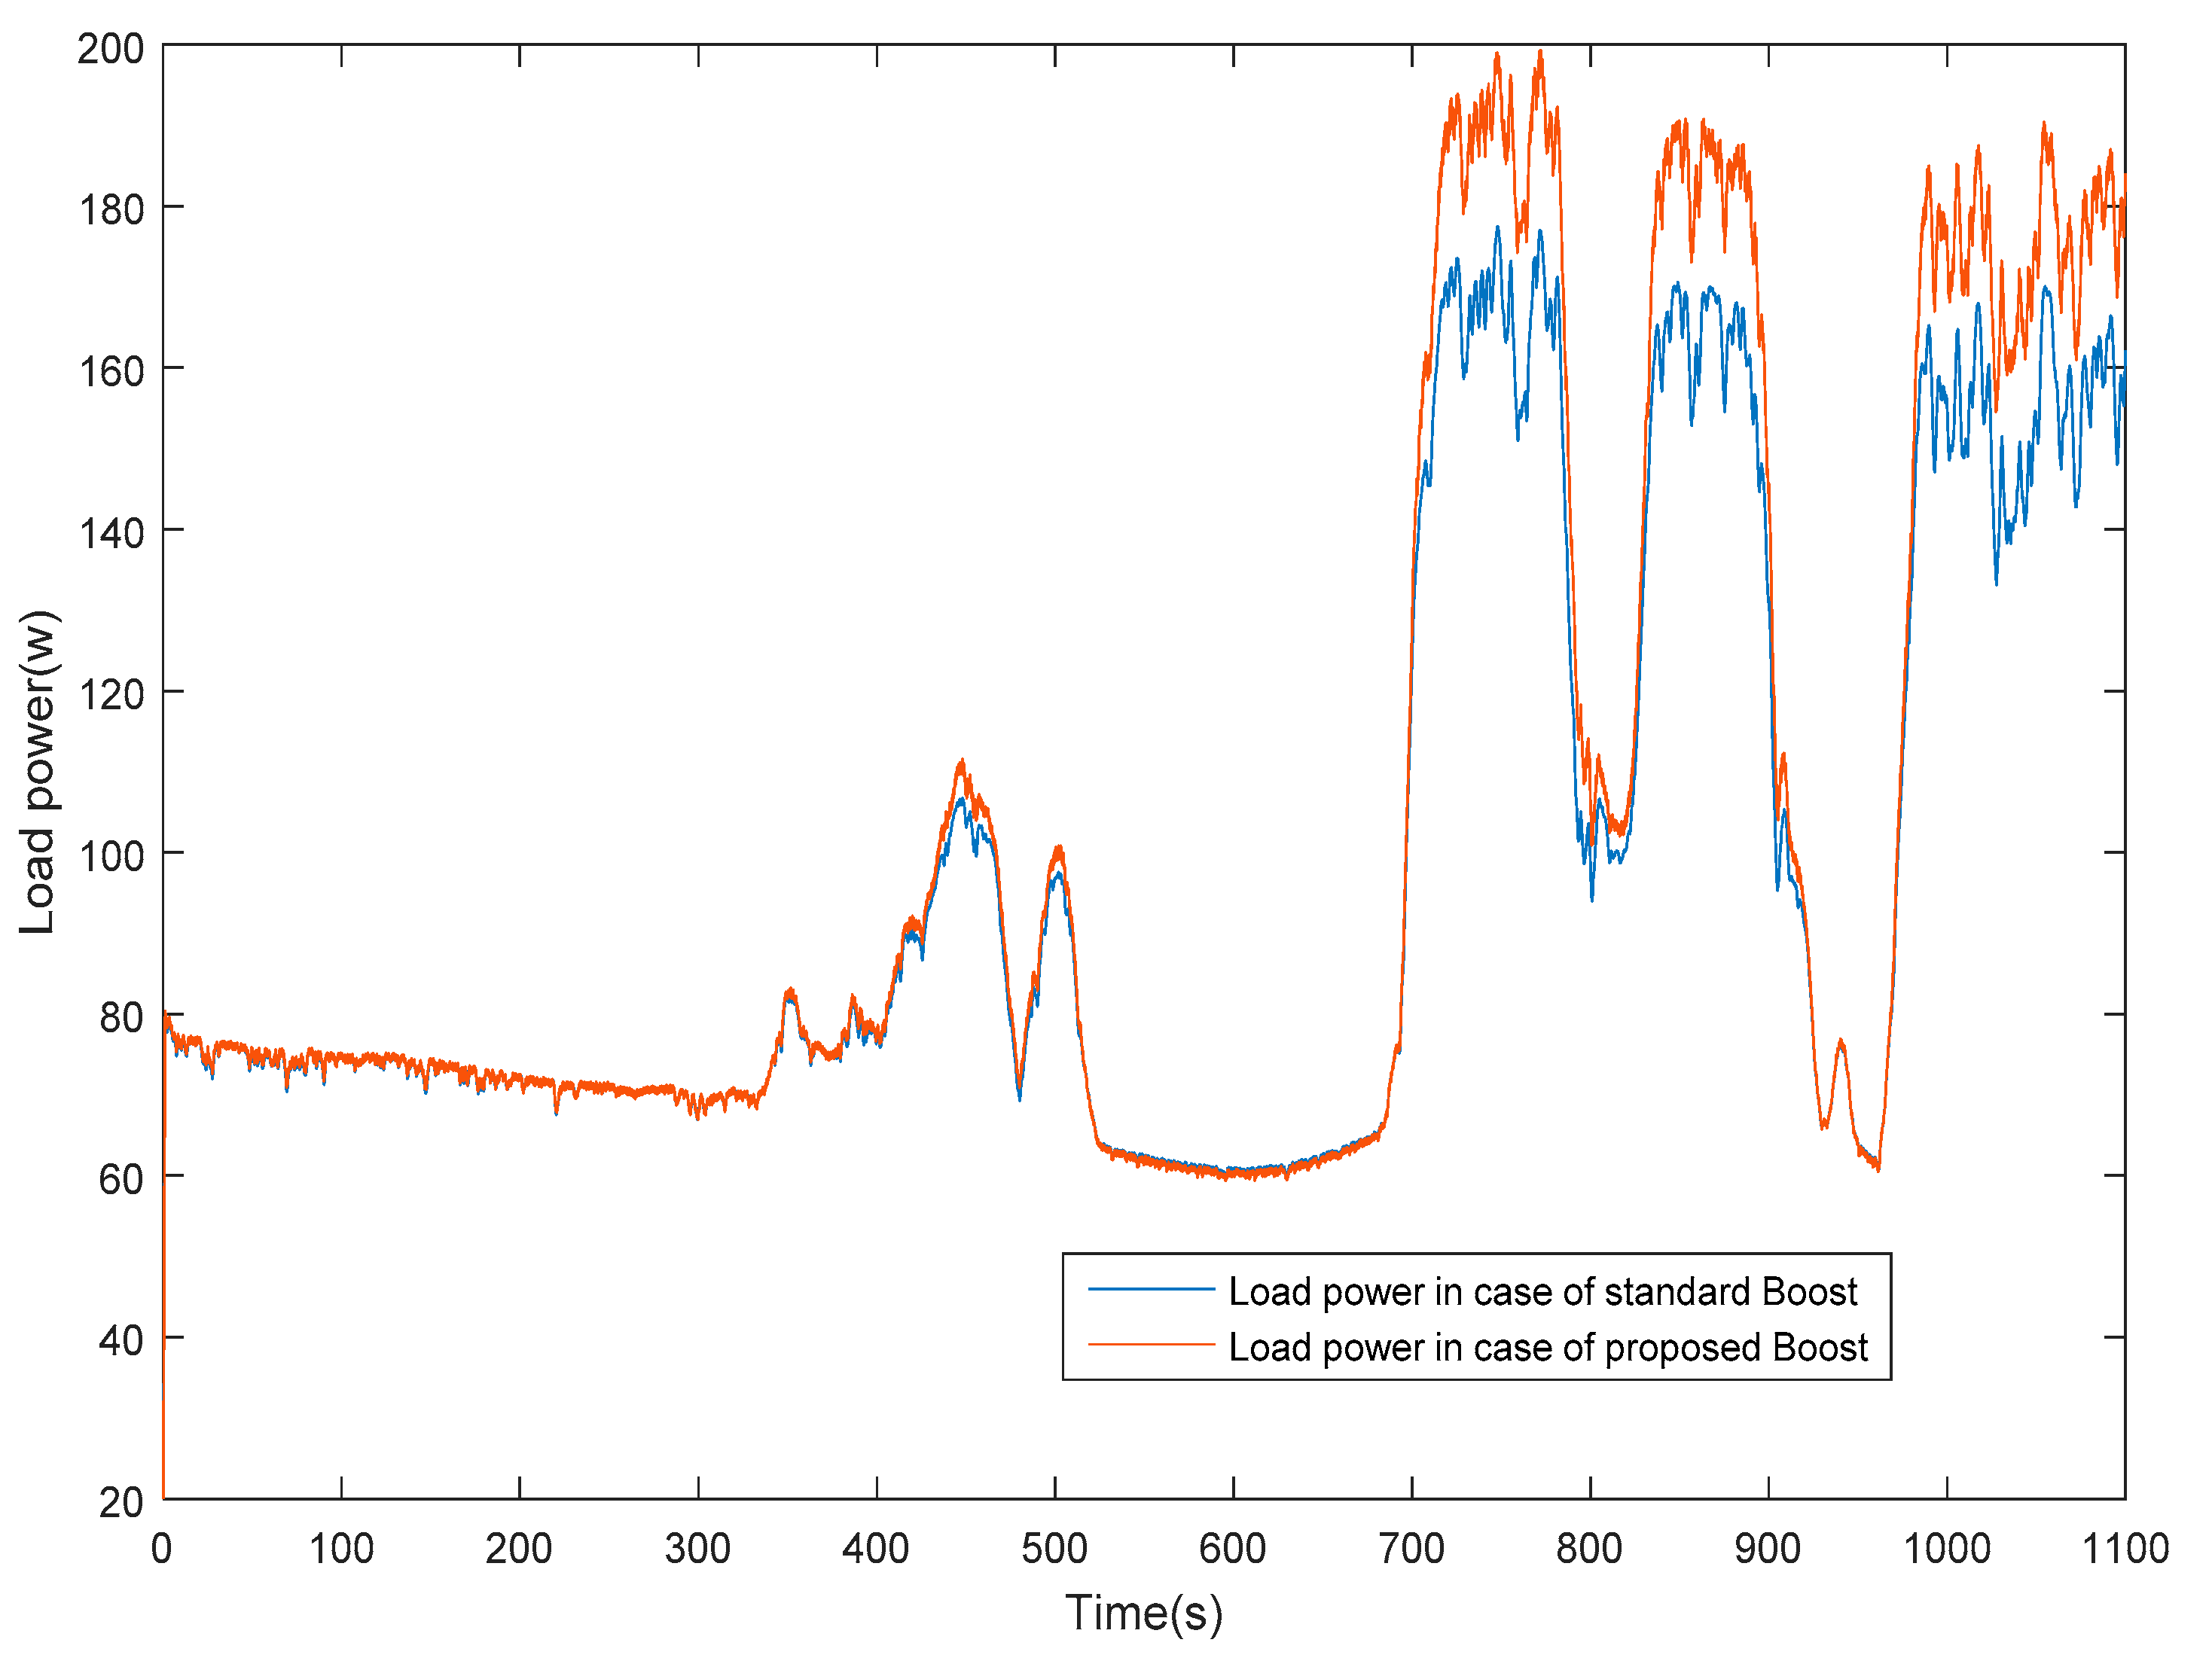
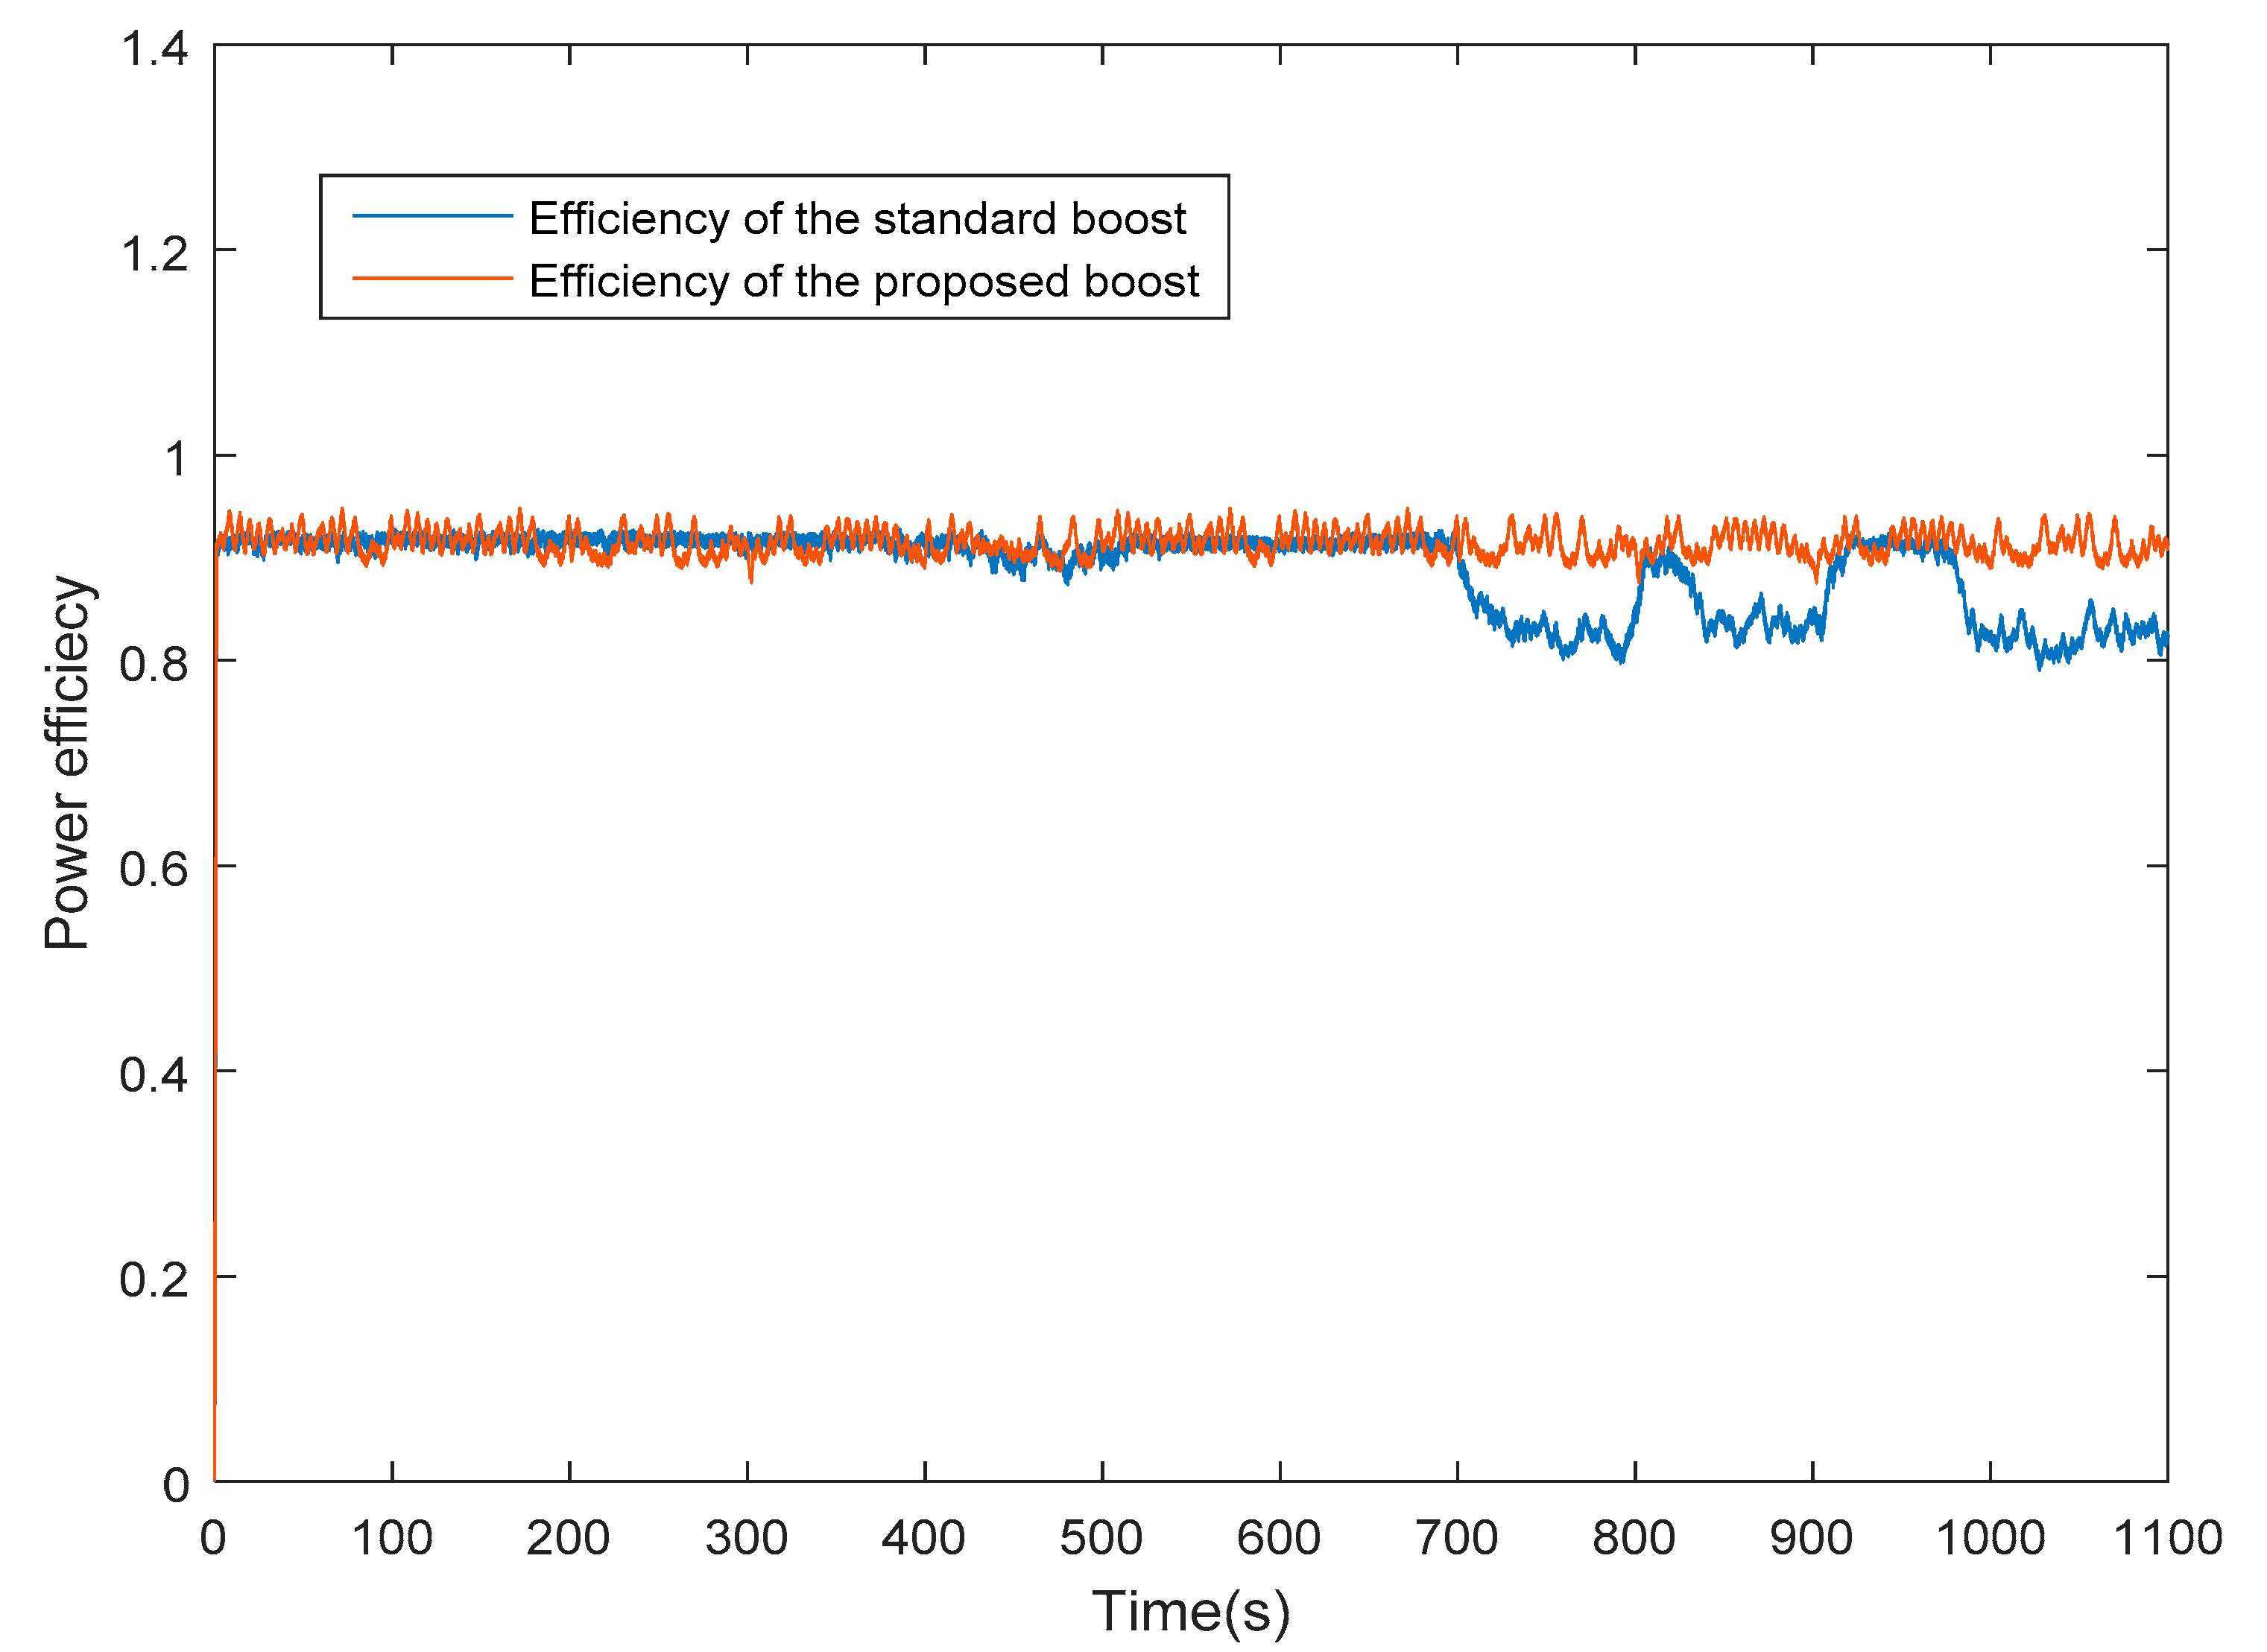
3.2. Experimental Results

In experimental tests, we used the platform installed in the MIS Laboratory of the University of Picardie Jules Verne in France, as Figure 14 presents.
The platform is made up by one SANYO, HIP-215NKHE5 PV panel and a radiation sensor. The PVG is connected to the SEMIKRON shopper module as a DC/DC boost converter that is considered as an adaptation block between the load and PV generator. The system is controlled using a dsPACE controller board. The MPPT algorithm is implemented in Simulink for implementation in real time.
Several experimental tests have been carried out to validate the proposed topology. In particular, two systems have been tested. The first one adopts a standard boost as presented in Figure 3 while the second uses a coupled inductor as shown in Figure 4. Two similar PV panels installed close to each other in the MIS platform are used to compare the performance of the two systems. Two SMIKRON devices are used: one for the Boost with the coupled inductor circuit and the other for the standard Boost circuit. The two inductors are made by the same magnetic core (ETD49). A P&O algorithm is used to track the MPP of the PVG, and the same kind of the resistive load is used. The detailed schematic of the two systems is shown in Figure 15 and Figure 16, respectively. In both installations we used an 1104 card of dSPACE to implement our algorithm in real time.
The Fuzzy controller is used to control the inductor current I2; this current must track the reference current evaluated on PV current measurement, I1. The buck topology has been chosen because the output current of a buck is always greater than its input current. In this case we ensure that the second windings draws lower current even when I2 has greater value.
To verify the improvement of the power efficiency of the proposed topology, the power efficiencies of the two systems are evaluated under the same operating conditions. Figure 17 shows the measured radiation during the experimental test of the two circuits.
The input and output voltages for the proposed coupled inductor topology are shown in Figure 18 whereas the coil and load current are presented in Figure 19.
In Figure 20 the measured power transferred to the load for both circuits is presented.

4. Discussion

Figure 18 shows clearly that the boost converter is operating as a step-up converter and we notice from the input voltage that the PV panel delivers the maximum power. It is noticed from Figure 19 that the coil current follows the radiation shape and it reaches the maximum power point corresponding to 5 A when the radiation is almost 800 W/m2.
By inspection of Figure 13b and Figure 20, we clearly notice that the power, in the case of the proposed topology (red curve), is greater than the power of the standard boost topology (blue curve), except during the intervals where the current that flows into both circuits is around the value that does not saturate the core. These results confirm that the load power is greater because the boost losses are minimized by avoiding magnetic core saturation in the case of the proposed topology. This outcome is further confirmed by Figure 13c and Figure 21 where the power efficiency of both converters is reported. It is apparent that the proposed converter maintains a power efficiency as high as 92% when the solar radiation is high, i.e., when the input current saturates the core of the inductor of the conventional converter, and the efficiency of which lowers to 80%.

5. Conclusions

In this paper a boost converter with a coupled inductor was proposed and assessed for PV applications. The proposed topology provides remarkable advantages. Firstly, the lower inductor characteristics can be adapted (core size) by integrating a controlled current of the second winding. Secondly, it improves the DC/DC converter for power efficiency of PV applications. A fuzzy controller is introduced to control the second coil current of the coupled inductor in order to avoid power loss due to core saturation. The main advantage of the fuzzy controller is that it does not need prior knowledge about the system parameters and that only one measured current is needed. Experimental results show that power efficiency stays constant over different values of solar radiation, unlike the conventional converter, where efficiency heavily reduces for high values of input current (i.e., solar radiation).

Author Contributions

Conceptualization, M.H. and N.A.; methodology, M.H. and A.R. and N.A.; software, N.A. and A.R.; validation, N.A. and A.R., and A.D.G.; formal analysis, N.A. and A.D.G.; data curation, M.H. and A.D.G. and G.M.T.; writing—original draft preparation, N.A.; writing—review and editing, M.H. and N.A. and A.R. and A.D.G. and G.M.T.; supervision, M.H. and G.M.T.; project administration, M.H.; All authors have read and agreed to the published version of the manuscript.

Funding

This research was funded in part by The General Directorate of Scientific Research and Technological Development (DGRSDT), under PRFU projects the grant number is A01L07UN030120180003, in part by laboratories: MIS, LACoSERE, LDCCP.

Conflicts of Interest

The authors declare no conflict of interest.

Appendix A. Operation of the Converter in Continuous Conduction Mode

To avoid power loss in the DC/DC converter, the latter must work in continuous conduction mode (CCM) [17,18]. This mode is characterized by permanently having the inductor current positive (IL > 0). To ensure operation in CCM mode, we follow the following steps to calculate the inductor value. For the boost converter circuit presented in Figure 3, two cases are possible. When the switch K is closed, we have
  V L = V i
when the switch K is open, the voltage Kirchhoff’s law yields
V L = V i V o
The voltage across the inductor is given by
V L = L d I L d t
From Equations (A1)–(A3), the inductor current can be written as
  I L = 0 d T V i L d t + d T T V i V o L d t
where d is the duty cycle of the Pulse Width Modulation (PWM) signal applied to the switch, K, shown in Figure A1.
Figure A1. Pulse Width Modulation (PWM) signal controlling the switch K.
Applsci 11 00980 g0a1
From Equations (A1)–(A4), the current curve through the inductance and its voltage are represented in Figure A2.
Figure A2. Voltage and current during continuous conduction mode.
Applsci 11 00980 g0a2
The current ripple of IL, is defined as,
I L = I L M a x I L M i n
where if 0 < t < dT relation
I L = V i L t + I L M i n
holds, whereas when dT < t < T
I L = V i v o L ( t d T ) + I L M a x
The average voltage across the inductor, L, is zero, which results in
V L   =   1 T 0 T V L · d t = 1 T ( 0 d T V i · d t + d T T ( V i V o ) · d t ) = 0
V i · d T = ( 1 d ) T ( V o V i )
and
V o =   1 1 d   V i  
The duty cycle value d is between 0 and 1 so the output voltage, Vo, is necessarily greater than the input voltage, Vi.
The sizing of the inductor in DC/DC converters supplied by PVG is difficult because its value is calculated and optimized for a given input power.
At the limit between continuous and discontinuous conduction mode (DCM), over a period T, the ripple current through the inductor verifies relation
I L > I L   m a x 2
At t = dT and from Equation (A6) we find that:
I L > d T V i 2 L
From Equation (A12) we can calculate the inductor value for a given ripple current through the coil from
L = V i   d I L f
where Vi is input voltage, d is the duty cycle, IL is the inductor current and f is the frequency of the PWM signal.

References

  1. Makbul, A.M.; Ramli, S.; Twaha, K.; Ishaque, Y.; Al-Turki, A. A review on maximum power point tracking for photovoltaic systems with and without shading conditions. Renew. Sustain. Energy Rev. 2017, 67, 144–159. [Google Scholar]
  2. Hernández-Callejo, L.; Gallardo-Saavedra, S.; Alonso-Gómez, V. A review of photovoltaic systems: Design, operation and maintenance. Sol. Energy 2019, 188, 426–440. [Google Scholar] [CrossRef]
  3. Verma, D.; Nema, S.; Shandilya, A.M.; Dash, S.K. Maximum power point tracking (MPPT) techniques: Recapitulation in solar photovoltaic systems. Renew. Sustain. Energy Rev. 2016, 54, 1018–1034. [Google Scholar] [CrossRef]
  4. Belkaid, A.; Colak, I.; Kayisli, K. Implementation of a modified P&O-MPPT algorithm adapted for varying solar radiation conditions. Electr. Eng. 2017, 99, 839–846. [Google Scholar]
  5. Graditi, G.; Adinolfi, G.; Tina, G.M. Photovoltaic optimizer boost converters: Temperature influence and electro-thermal design. Appl. Energy 2014, 115, 140–150. [Google Scholar] [CrossRef]
  6. Boehinger, A.F. Self-adaptive DC converter for solar spacecraft power supply. IEEE Trans. Aerosp. Electron. Syst. 1968, 1, 102–111. [Google Scholar] [CrossRef]
  7. Houssamo, I.; Locment, F.; Sechilariu, M. Experimental analysis of impact of MPPT methods on energy efficiency for photovoltaic power systems. Electr. Power Energy Syst. 2013, 46, 98–107. [Google Scholar] [CrossRef]
  8. Longlong, Z.; William, G.H.; Werner, H.W. A New Approach to Achieve Maximum power point tracking for PV system with a variable inductor. IEEE Trans. Power Electron. 2011, 26, 1031–1037. [Google Scholar]
  9. Kamarzaman, N.A.; WeiTan, C. A comprehensive review of maximum power point tracking algorithms for photovoltaic systems. Renew. Sustain. Energy Rev. 2014, 37, 585–598. [Google Scholar] [CrossRef]
  10. Sri Revathi, B.; Prabhakar, M. Non-isolated high gain DC-DC converter topologies for PV applications—A comprehensive review. Renew. Sustain. Energy Rev. 2016, 66, 920–933. [Google Scholar] [CrossRef]
  11. Da Rocha, M.V.; Sampaio, L.P.; da Silva, S.A.O. Comparative analysis of MPPT algorithms based on Bat algorithm for PV systems under partial shading condition. Sustain. Energy Technol. Assess. 2020, 40, 100761. [Google Scholar]
  12. Grasso, A.D.; Pennisi, S. A Micro-Scale Inductorless MPPT DC-DC Converter. IET Power Electron. 2013, 6, 1634–1639. [Google Scholar] [CrossRef]
  13. Grasso, A.D.; Pennisi, S.; Ragusa, M.; Tina, G.M.; Ventura, C. Performance evaluation of a multistring PV module with distributed DC-DC converters. IET Renew. Power Gener. 2015, 9, 935–942. [Google Scholar] [CrossRef]
  14. Woonki, N.; Pengyuan, C.; Jonghoon, K. An Improvement of a Fuzzy Logic-Controlled Maximum Power Point Tracking Algorithm for Photovoltic Applications. Appl. Sci. 2017, 7, 326. [Google Scholar] [CrossRef]
  15. Bastidas-Rodriguez, J.D.; Franco, E.; Petrone, G.; Ramos-Paja, C.A.; Spagnuolo, G. Maximum power point tracking architectures for photovoltaic systems in mismatching conditions: A review. IET Power Electron. 2014, 7, 1396–1413. [Google Scholar] [CrossRef]
  16. Aabouchabana, N.; Haddadi, M.; Rabhi, A.; El hadjjaji, A. Using a coupled inductor controlled by fuzzy logic to improve the efficiency of a Buck converter in a PV system. Proc. ASEE17 Web Conf. 2017, 22, 00001. [Google Scholar] [CrossRef] [Green Version]
  17. Colonel, W.T. McLyman. In Transformer and Inductor Design Handbook, 4th ed.; CRC Press: Boca Raton, FL, USA, 2011. [Google Scholar]
  18. Williams, B.W. Power Electronics, Devices, Drivers, Applications, and Passive Components, 2nd ed.; McGraw Hill: New York, NY, USA, 1992. [Google Scholar]
  19. Marina, S.P.; João Pedro, F.T.; Alonso, J.M.; Saraiva, E.S. Large-Signal Characterization of Power Inductors in EV Bidirectional DC-DC Converters Focused on Core Size Optimization. IEEE Trans. Ind. Electron. 2015, 62, 3042–3051. [Google Scholar]
  20. Imaoka, J.; Yamamoto, M.; Umetani, K.; Arimura, S.; Hirano, T. Characteristics Analysis and Performance Evaluation for Interleaved Boost Converter with Integrated Winding Coupled Inductor. In Proceedings of the 2013 IEEE Energy Conversion Congress and Exposition, Denver, CO, USA, 15–19 September 2013; pp. 3711–3718. [Google Scholar]
  21. Data Sheet of ETD 49 Magnetic Core. Available online: http://www.alldatasheet.com/datasheet-pdf/pdf/343540/FERROXCUBE/ETD49.html (accessed on 27 January 2020).
  22. Baek, J.; Park, M. Fuzzy bilinear state feedback control design based on TS fuzzy bilinear model for DC–DC converters. Electr. Power Energy Syst. 2012, 42, 710–720. [Google Scholar] [CrossRef]
Figure 1. Adaptation block as a power interface between a photovoltaic generator(PVG) and load, to transfer the maximum power.
Applsci 11 00980 g001
Figure 2. (a) Direct electrical connection between a PV generator and a load; (b) different operating points for two levels of radiation with different loads.
Applsci 11 00980 g002
Figure 3. Simplified schematic of a boost converter.
Applsci 11 00980 g003
Figure 4. PV system using boost converter with a coupled inductor.
Applsci 11 00980 g004
Figure 5. Basic ferromagnetic circuit.
Applsci 11 00980 g005
Figure 6. Conventional boost inductor current and corresponding operating point on the B-H curve.
Applsci 11 00980 g006
Figure 7. (a) Coupled inductor, (b) added flux, (c) subtracted flux.
Applsci 11 00980 g007
Figure 8. (a) Exploded drawing of the coupled inductor; (b) picture of assembled inductor.
Applsci 11 00980 g008
Figure 9. Diagram of the fuzzy controller.
Applsci 11 00980 g009
Figure 10. (a) Membership functions of the input variable; (b) membership functions of the output variable.
Applsci 11 00980 g010
Figure 11. Current through 2nd coil and its reference.
Applsci 11 00980 g011
Figure 12. Simulation block diagram.
Applsci 11 00980 g012
Figure 13. Transient simulation results: (a) solar panel radiation; (b) output power of the conventional and proposed converter; (c) power conversion efficiency.
Applsci 11 00980 g013aApplsci 11 00980 g013b
Figure 14. Hardware materials used in experimental tests.
Applsci 11 00980 g014
Figure 15. Schematic of the experimental setup for the conventional boost DC/DC converter.
Applsci 11 00980 g015
Figure 16. (a) Schematic of the experimental setup for the proposed boost DC/DC converter. (b) Schematic of the small Buck converter.
Applsci 11 00980 g016
Figure 17. Measured solar radiation.
Applsci 11 00980 g017
Figure 18. (a) Input voltage, (b) output voltages.
Applsci 11 00980 g018aApplsci 11 00980 g018b
Figure 19. (a) Current through L1, (b) load current.
Applsci 11 00980 g019
Figure 20. Measured power delivered to the load for the conventional and proposed converter.
Applsci 11 00980 g020
Figure 21. Measured power efficiency for the conventional and proposed converter.
Applsci 11 00980 g021
Table 1. Inductor sizing for different current duty cycle values (f = 20 kHz, Vi = 42 V).
IL (A)L (µH)
d = 0.1d = 0.5d = 0.9
0.5420021,00037,800
1210010,50018,900
1.51400700012,600
2110053009500
2.580042007600
370035006300
3.560030005400
452526004700
4.546623004200
540021003800
Table 2. Rules of the fuzzy controller.
DE\ENBNSZPSPB
NBPBPSPSNSNB
NSPBPSZNSNB
ZPBPSZNSNB
PSPBPSZNSNB
PBPBPSPSNSNB
Where NB: Negative Big, PB: Positive Big, PS: Positive Small, NS: Negative Small, and Z: Zero.
Publisher’s Note: MDPI stays neutral with regard to jurisdictional claims in published maps and institutional affiliations.

