
A State-of-Art-Review on Machine-Learning Based Methods for PV


1
Department of Electrical, Electronics and Computer Engineering, University of Catania, 95125 Catania, Italy
2
ENEA, DTE-FSD-SAFS, Research Centre Portici, 80055 Naples, Italy
*
Authors to whom correspondence should be addressed.
Appl. Sci. 2021, 11(16), 7550; https://doi.org/10.3390/app11167550
Submission received: 12 July 2021
/
Revised: 11 August 2021
/
Accepted: 12 August 2021
/
Published: 17 August 2021
(This article belongs to the Special Issue Applications of Machine Learning for Renewable Energy based Modern Power Systems)
Abstract
:In the current era, Artificial Intelligence (AI) is becoming increasingly pervasive with applications in several applicative fields effectively changing our daily life. In this scenario, machine learning (ML), a subset of AI techniques, provides machines with the ability to programmatically learn from data to model a system while adapting to new situations as they learn more by data they are ingesting (on-line training). During the last several years, many papers have been published concerning ML applications in the field of solar systems. This paper presents the state of the art ML models applied in solar energy’s forecasting field i.e., for solar irradiance and power production forecasting (both point and interval or probabilistic forecasting), electricity price forecasting and energy demand forecasting. Other applications of ML into the photovoltaic (PV) field taken into account are the modelling of PV modules, PV design parameter extraction, tracking the maximum power point (MPP), PV systems efficiency optimization, PV/Thermal (PV/T) and Concentrating PV (CPV) system design parameters’ optimization and efficiency improvement, anomaly detection and energy management of PV’s storage systems. While many review papers already exist in this regard, they are usually focused only on one specific topic, while in this paper are gathered all the most relevant applications of ML for solar systems in many different fields. The paper gives an overview of the most recent and promising applications of machine learning used in the field of photovoltaic systems.
1. Introduction
ML is a subset of AI which is concerned with creating systems that learn or improve performance based on the data they use. The term machine learning was first used in 1959 by the American scientist Arthur Lee Samuel, with the following definition: “field of study that gives computers the ability to learn without being explicitly programmed”.
Today, ML is ubiquitous. When we interact with banks, shop online or use social media, ML algorithms are used to make our experience efficient, easy and safe, along with learning our lifestyle-related preferences. For example, search engines on the Internet practically exploit them in many ways: the results we obtain derive from algorithms that elaborate models and patterns of use of search keys, as well as for completion suggestions. Amazon Go, the first store with no cashiers opened by Amazon in Seattle, is also based on ML and other advanced technologies. Self-driving cars, which we will soon see on the roads, use continuously improved ML models: MIT in Boston has developed a system that will allow these cars to orient themselves only with sensors and GPS, avoiding the use of maps which may simply be out of date or insufficiently detailed. ML is fundamental for data protection and fraud prevention, thanks to unsupervised algorithms that compare the access models and detect any anomalies, and it can also improve personal security, making checks at airports and places of transport more reliable and faster. Applications in the health sector will also be increasingly relevant, to obtain more accurate diagnoses, analyze the risk factors of certain diseases and prevent epidemics [1,2]. ML and associated technologies are developing rapidly, and we are just starting to discover their capabilities [3,4]. AI technologies have now also arrived in the field of renewable energy; from those, such as Google, who use them in wind farms to improve forecast data [5,6], to those who use them to increase the efficiency of solar panels [7].
Several AI and ML solutions are already available to predict wind and PV energy production, for predictive maintenance systems for wind turbines or to search for new materials for solar panels [5].
The perspective of ML applications for the development of renewable energy is almost unlimited. Many players in this market are testing innovative solutions to improve the performance of their systems. ML applications can make it possible to exploit in the best way the operation of plants, forecasting weather conditions, such as the exposure to the sun of the PV surfaces, the direction and strength of the wind in the case of wind power or rainfall for hydroelectric generators [8,9].
ML and predictive models can also help in the management of energy supply for households in cities, optimizing their distribution network [10,11,12].
According to the International Energy Agency (IEA), in the coming years, in the energy field AI will be decisive and will radically transform global energy systems, making them more interconnected, reliable and sustainable [13].
During the last several years, many papers have been published concerning ML applications in the field of solar systems. This paper presents the state of the art of recent advances in ML for photovoltaic and solar applications, which provides a broad overview of current advanced techniques to academics and practitioners. In particular, papers published in international journals from 2018 to 2021 have been taken under consideration. For the literature review step, the following search engines for research articles (journals and book chapters) have been extensively employed: Microsoft Academic, Scopus/ScienceDirect, ResearchGate and GoogleScholar.
The main contributions of this paper are summarized below:
- This is the first paper, as far as authors know, which gathers only more recent and promising, in authors’ opinion, applications of ML in many different fields of PV and not only in a specific one,
- For each of the fields under consideration a critical analysis is reported, highlighting the architecture/solution that, in literature, has proven to be the most suitable for that specific task,
- The pros and cons of each solution are detailed, in addition to suggesting ideas for further investigation.
The remainder of this paper is structured as follows: Section 2 reports a reasoned introduction about ML methods or more generally data-driven methods, Section 3 gathers all more recent review papers on the topics treated in this paper, Section 4 is devoted to the field of PV power forecasting, Section 5 reports recent papers concerning the anomaly detection (fault diagnostic) in PV, Section 6 regards ML-based methods for MPPT in PV, Section 7 gives an overview on the other applications of ML in PV field and finally Section 8 ends the paper with concluding remarks and an analysis of possible future trends.
2. Machine Learning, Deep Learning and Related Methods
Nowadays, the term Artificial Intelligence is quite common and people, often even without knowing it, benefit from AI every single day: from Alexa (a ubiquitous application of a field of machine learning (ML) known as Natural Language Processing); to the recommendation system of Netflix, suggesting content for users to watch next using similar users’ preferences; to the automated driving systems that equip many new recent car models. To better clarify the terms that are reported in many research papers, this section will briefly define the most common ones. AI indicates a branch of computer science that studies ways to build intelligent programs in a way that mimics human reasoning; the benchmark for AI is human intelligence regarding reasoning, speech, learning, vision and problem-solving. To AI belong two other methods: ML and Deep Learning (DL) [14]. Machine learning is, as anticipated, a subset of AI that allows systems/programs to learn from data without being declaratively programmed; in this sense, it is a data-driven method. An example of machine learning is the so-called (Shallow) Artificial Neural Network (ANN); more on this later.
DL, often indicated as a deep neural learning/network (DNN), is a peculiar type of neural network which differs from the usual ANNs (also known as shallow neural networks, SNNs) by being composed of several hidden layers, complex connectivity architectures and different transfer operators. Deep learning is a term currently quite common in literature but is not new. It can be dated back to 1986. In 1986, Carnegie Mellon professor and computer scientist Geoffrey Hinton, by many considered as the “Godfather of Deep Learning”, demonstrated that more than just a few of a Neural Network’s layers could be trained using backpropagation for improved shape recognition and word prediction. Hinton went on to coin the term “deep learning” in 2006. However, only during recent years has this type of network reached a broad diffusion thanks to the advent of the graphics processing unit, GPU, mainly by NVIDIA with its CUDA extensions, that can dramatically improve the calculation time required to train this type of network [15]. In past years, many ML frameworks have been raised and many of them are capable of exploiting GPU power, including TensorFlow by Google and Pytorch from Facebook, to cite just a few. These user-oriented ML frameworks have contributed to the diffusion of DL. With the advent and wide adoption of DL in many different fields, many techniques and algorithms have been introduced to train DNNs; think of the concept of “batch size” or the well-known and widespread training algorithm ADAM [16]. For some aspects, the difference between an SNN and DNN can be subtle as the techniques originally developed to train DNNs are currently used also for SNNs. The most important difference between an SNN (or ML) and DNN (or DL) is that the latter does not require “feature engineering” to be able to extract the relevant features automatically from data. Usually for achieving this, significantly more data is required to efficiently train DL architecture. As previously said, ML is a data-driven method capable of extracting knowledge from data without being explicitly programmed, but for this to be possible ML requires a data set on which the model is “trained”; after this initial phase of knowledge extraction from data, the ML model can be used to provide forecast/insight into the system, it is said it can work in “inference” mode. The training phase is usually quite computationally and time intensive, while in inference mode the ML model can often provide results in times that are an order of difference lesser than in training. The data set used for training needs to be correctly transformed/normalized to derive the correct “features” that allow the ANN to be trained effectively. Usually, main performance gains in models’ predictive performance are possible by performing “feature engineering”, i.e., combining raw features into new features that can express new/more knowledge on the system to which the data set is related [17]. This “feature engineering” or “feature extraction” that has to be manually implemented in SNNs is automatically performed in DNNs, at least to some extent. Another ML-based method that is beginning to be employed in the field of PV, especially for MPPT reactive tracking, is reinforcement learning (RL). While in “traditional” ML/DL methods a dataset is required to extract knowledge from the data (training phase) and thereafter apply this knowledge to new unseen data (inference phase), in RL the model, or better, the system, can learn by themselves essentially by trial and error. Using RL an “agent” performs actions to maximize rewards, or in other words, it is learning by doing, and its goal is to optimize the total reward in the same way as ML or DL aim at minimizing a loss function.
In addition to DL, during the last several decades, a class of methods known as Ensemble Methods (EM) has been developed and has started to appear in research papers [18,19,20]. The basic idea is quite simple: integrate a group of base models, also known as weak learners, to build up a more robust model. This robustness is intended to build a model capable of providing better accuracy, performing better, and/or being capable of better generalizing, i.e., to provide good performance for a “scenario” different from the training one. However, how does one train different weak learners and aggregate their output to build up a stronger leaner? In this regard many solutions are possible, but commonly used techniques are:
- Bagging
- Boosting
- Stacking
Bagging stands for Bootstrap Aggregation, where multiple models are trained in parallel, but each base model is trained on a different training set derived from the original training data using the Boostrap (data is randomly sampled from the original dataset with replacement) method and the final prediction is derived by a voting aggregation from the predictions of all base models. In bagging methods, the weak learners are usually of the same type. Since the random sampling with replacement creates independent and identically distributed samples, bagging does not change the models’ biases but reduces their variance, producing a model capable of providing consistent results in production. A typical bagging model is based upon Random Forest. In boosting, multiple weak learners are learned sequentially, not in parallel as in bagging. Each subsequent model is trained by giving more importance to the data points that were misclassified (or giving greater error in terms of MSE for example) by the previous weak learner. In this way, the weak learners can focus on specific data points and can collectively reduce the bias of the prediction. In stacking, the base weak learners are trained in parallel as in bagging, but stacking does not carry out simple voting to aggregate the output of each weak learner to calculate the final prediction. Stacking employs another meta-learner to provide the final prediction, and this meta-learner is trained on the outputs of weak-learners to learn a mapping from the weak learners’ output to the final prediction. Usually, this meta-learner is quite simple, such as a LASSO or Ridge regression.
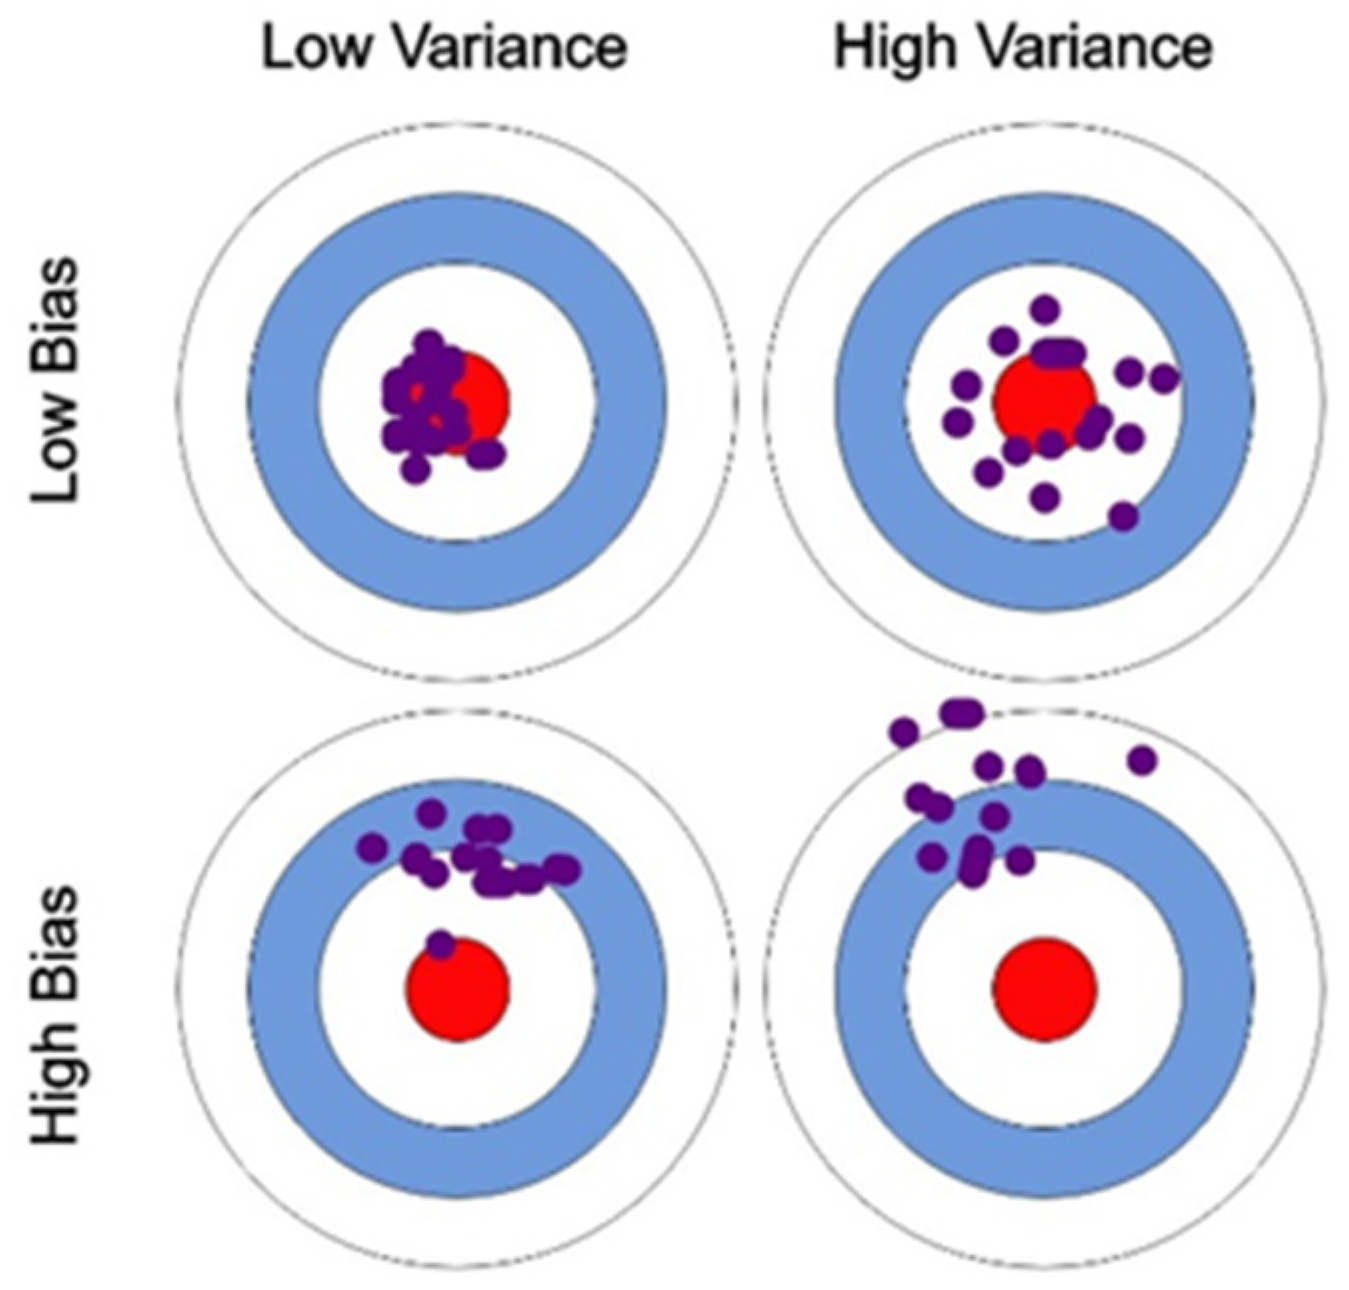
Previously, the terms bias and variance have been cited a few times, and require further clarification. A common “mantra” in ML is the bias vs. variance trade-off; any ML-based model trying to improve bias will always make gains at the expense of variance, and vice versa. The two variables measure the effectiveness of the model: bias is the error or difference between real data and a models’ predicted value, while variance is the error that occurs due to sensitivity to small changes in the training set.
Typically, the two terms are well synthesized with the image shown in Figure 1:
The model’s error is the difference between predicted and observed/actual values. Suppose one has a very accurate model: this means that the error is very low, indicating a low bias and low variance (as seen on the top-left circle in Figure 1).
If the variance increases, the data are spread out more which results in lower accuracy (as seen on the top-right circle in Figure 1). In this case, the average model’s error could be the same as in the first case but sometimes the error is greater and more spread out around the same mean value. If the bias increases, the error calculated increases (as seen on the bottom-left circle in Figure 1). High variance and high bias indicate that data are spread out with a high error (as seen on the bottom-right circle in Figure 1). This is a bias-variance tradeoff. In essence, bias is a measure of error between what the model captures and what the available data is showing, while variance is the error from sensitivity to small changes in the available data. A model having high variance captures random noise in the data.
For the field of interest of this paper, the most used ensemble methods are:
- Random Forest (RF) (bagging ensemble method);
- XGBoost or LightGBM (boosting ensemble method).
Very few papers have tested stacking solutions.
3. Literature Review of Review Paper for Each of the Fields of Interest in PV
4. Latest Research in PV Power Forecasting
This section describes the latest ML-based methods that have been employed in literature to forecast power production from PV, published from the year 2018 till the year 2021.
The vast majority of methods employed within this field are several types of NN architectures, but while older papers reported the use of shallow architectures such as multilayer perceptron (MLP) or Radial Basis Function (RBF) networks, research that is more recent has turned its interest to more advanced DL methods, such as LSTM, CNNs or a combination of both. Concerning the metrics used to assess models’ performance, the most frequent are Mean Absolute Error (MAE) and Root Mean Square Error (RMSE). It is quite impossible to compare results from models applied to different scenarios, where the scenario has to be intended as the features of the plant under investigation (dimension, architecture in terms of the number of string, cells type, etc.), the environmental conditions, length of the training and test dataset, features pre-processing and/or features engineering, if applied, as the scenario greatly affects the model’s performance results. This is true for metrics such as RMSE or MAE but also for percentage metrics such as Mean Average Percentage Error (MAPE) or Root Mean Squared Percentage Error (RMSPE) that are more suited to comparing models’ performances related to different plants, being the last percentage errors. For a detailed discussion on models’ metrics see [28,29].
While many researchers are more interested in providing a model capable of providing “point-forecast” results, i.e., the expected mean/average value for the forecasting horizon, some papers have been published concerning the “probabilistic/interval forecast”, where, in addition to the point-forecast, the prediction interval associated to this point is provided [30]. For the reasons outlined before, PV power forecasting can be classified into basically two different types:
- Point-forecast
- Interval-forecast
The latter type, in the authors’ opinion, could be more useful as in many situations it may be more critical to know not the future power production from the PV plant connected to the grid but rather to know, with a probability of 95% or 99%, that this expected level of production will not fall below a critical level.
The following tables, Table 2 and Table 3, summarize the latest research in forecasting PV production by grouping the research into point and interval forecasts. As appears evident from Table 2 and Table 3, the vast majority of papers are point-forecast and consider a short-term forecasting horizon. In this regard, the usual classification of models based on the forecasting horizon is the following:
- Very short-term, from few seconds to some minutes;
- Short-term, up to 48 or 73 h;
- Medium-term, in the range from few days to one week;
- Long-term, usually several months or one year.
Another, mostly equivalent, classification criteria relies on counting how many time steps ahead are considered in the forecasting horizon. Many papers are focused on only one step ahead (this usually could be a single hour or day), but multi-steps-ahead models are often the more interesting ones. A multi-step ahead model can produce results into an iterative model or with architectures able to provide, with a single run, or better a single inference computation, an array of values, each related to a specific timestamp (Pt + 1, Pt + 2, …Pt + h, where P is the forecasted power production, h is the forecasting horizon and t is the actual timestamp).
The remainder of this section is devoted to highlighting the novelty and/or the most interesting findings of each of the listed research papers. In [31] a multi-step-ahead prediction model focused on 1 to 16 steps ahead (with data sampled every 15 min and so resulting in a forecasting horizon from 15 min to 4 h) is obtained by a deep extreme learning machine (DELM) combined with enhanced colliding bodies optimization (ECBO) and Variational Mode Decomposition (VMD). The proposed model employs irradiance prediction from numerical weather prediction (NWP) and uses as the first step a grey correlation analysis coupled with Pearson correlation to find in the training data a day representative of/like the prediction day. In the second step, VMD and ECBO methods are employed to decompose the original power data that is fed to a Deep Extreme LM (DELM) to provide the final forecasts. The proposed DELM can be trained very fast if compared to a generic DL model. The decomposition method employed in this work is a novelty as most previous works rely on wavelets packet transform (WPT) or empirical mode decomposition (EMD). The model has been tested on a PV plant in China using a dataset of two years (2018–2019) with data sampled every 15 min and differentiating according to day conditions: sunny, cloudy and rainy. Authors claim very accurate results in the range of 4–8 steps ahead (1–2 h) but also state that a CNN+LSTM model can obtain results even better if enough data is provided, especially for longer forecasting horizons.
In the last several years, many different ML frameworks have been developed; this gives the opportunity to easily develop ML models and eventually deploy them in production an effective solution with ease. Some of these solutions provide what is known as Auto-ML (AML), i.e., an approach that can automatically select, train and optimize an ML model or eventually an ensemble of ML models. This is what is proposed in [32], where an AML is employed to derive an ensemble where the features used by each building model are derived using an improved GA optimization method capable of selecting optimal features for each region. In this work, historical data coming from PV plant data (panel temperature and power generation) and weather data (temperature, irradiance, cloud cover, precipitation and humidity) are used in conjunction with the results of a physical model that provide power production as a function of the tilted solar irradiance perpendicular to the solar PV panel, the temperature of the solar PV panel and the ambient temperature. The dataset used spans over 2 years, 2016–2017, with data sampled every 30 min, and is used for a multi-regional model, i.e., applied to data from plants at different regions. The ensemble selected by AML is made up of Elastic Net CV regression, Gradient Boosting Regression and RF Regression. Historical data of PV power plants located in Hokkaido (Northern Japan) from 1 January 2016 to 31 December 2017, is used for training while only one month is used for testing (December 2017). This is one of the very few papers assessing the viability of AML in forecasting PV production. Interestingly enough, the models selected to build up the ensemble were previously rarely used in this field.
While most of the research is focused on the very short- to short-term forecasting horizon, long-term PV production forecasting is investigated in [33] using a grey box prediction model. In detail, an adaptive discrete grey model with a time-varying parameter denoted as ATDGM(1,1) with a single variable and one order is used. This type of model does not require exogenous variables and belongs to the group of the model generally applicable to time series prediction problems. More on grey methods can be found in [34]. For the first time, to the best of our knowledge, the concept drift issue is discussed in the field of energy forecasting in [35]. This work is about solar and wind energy forecasting and not PV power production, but it has been included in this paper as it employs some techniques that can be easily adopted in the field of interest and because it takes into consideration a public dataset. An evolving Multivariate Fuzzy Time Series (e-MVFTS) is here adopted to forecast a time series and its potential has been evaluated in solar and wind energy using a public dataset made available by United States National Renewable Energy Laboratory (NREL) for solar energy data, and extracted from Global Energy Forecasting Competition 2012 (GEFCom2012). The wind energy dataset has been published on the Kaggle platform repository. To allow for the complete reproducibility of the results, all code and data were made publicly available. The proposed method, combining a forecasting model based on Fuzzy Time Series with an evolving clustering method based on Typicality and Eccentricity Data Analytics (TEDA), can adapt to the concept drift that occurs in the time series, i.e., can automatically deal with changes in the data distribution.
In [36] a hybrid model based on wavelet packet decomposition (WPD) and long short-term memory (LSTM) networks is proposed which employs historical power and historical meteorological data as input variables, including global horizontal irradiance, diffuse horizontal irradiance, ambient temperature, wind speed and humidity. No forecasted irradiance is used in the model. WPD is applied to a PV original power series obtaining four “sub-series”; each new derived series, augmented with the meteorological data, constitutes the input of an LSTM whose results are linearly weighted to provide the final forecast. Each LSTM provides a multi-step prediction. An LSTM network is also used in [18] where its inputs include historical PV power data, historical weather predictions and synthetic weather forecasts derived using the k-means clustering method to provide multi-step-ahead forecasts. The derived synthetic irradiance forecast results in an improvement into models’ accuracy that varies from 33%, if compared to that when an hourly categorical type of sky forecast is used, to 44.6%, if compared to that when a daily type of sky forecast is used. This work claimed that the proposed LSTM DNN can perform better than the recurrent neural network (RNN), the generalized regression neural network (GRNN) and the ELM models.
Again, a model with an LSTM DNN in conjunction with an RNN is applied to forecast PV production in [37]. This work introduces a time correlation modification (TCM) integrated with a partial daily pattern prediction (PDPP) framework. The main idea is that the ensemble resulting from LSTM-RNN+TCM can benefit both from the results of the time correlation model, which is closer to the actual data in trend, and from the results of the LSTM-RNN model more capable of tracking the fluctuations of PV power output. Finally, the DPP model is used to predict the pattern of the forecasting day so as to select an optimal set of weight coefficients to calculate the results using the output from both the LSTM-RNN model and TCM model.
As the authors claimed, the methodology of Transfer Learning (TF) firstly appears in a research paper in the field of PV production forecasting in [38]. Transfer learning is a known technique employed in DNNs that consists of using a complex but successful pre-trained DNN model to “transfer” what it has learned from its specific domain knowledge to a similar but different domain. Transfer learning has been extensively adopted in the field of image classification/recognition for convolutional neural networks (CNNs).
The advantages coming from TL related to the existing successful pre-trained model consists in:
- Its hyper-parameters and network structure, i.e., number of layers and types, have already been tested and found to be successful;
- The earlier layers of a CNN are essentially learning the basic features of the image sets such as edges, shapes, textures, etc. Only the last one or two layers of a CNN are performing the most complex tasks of summarizing the vectorized image data into the classification. Weights of the first layers are frozen while only the last layers are trained for the specific task in the target domain knowledge; this turns out to be a faster training method.
This idea in the field of PV power forecasting relies on transferring the knowledge of a pre-trained LSTM in the field of a historical irradiance time series to that of PV power series (irradiance being highly correlated to PV power) to cope with data scarcity in the target domain. Authors have obtained interesting results that demonstrate how TL can be very beneficial for a new plant where there is not enough historical data acquired.
To provide short-term predictions of PV power output, authors in [39] propose the use of an ensemble method, LighGBM, combined both with a Bayesian optimization algorithm to find optimal time steps for temporal pattern aggregation and a clustering-based training framework based on a tree-structured self-organized map (TS-SOM), proving its effectiveness in a production environment consisting of an edge computing platform (Raspberry Pi 3B) with limited storage. The proposed model, starting from historical meteorological data, applies three functional steps: a temporal pattern aggregation optimized using a Bayesian approach, a weather clustering, performed by TS-SOM, and the final model training using LightGBM. When compared with common DL alternatives such as GRNN and LSTM, authors showed that the proposed method performs better with a dramatic decrease of both training time and inference time. A hybrid model made up of a set of different ML-based methods is described in [40] to forecast PV power production in the short-term horizon. In the first step, an RF model is used to rank the input, weather-related (such as temperature, daily rainfall, horizontal radiation, diffuse horizontal radiation, etc.) features, then an improved grey ideal value approximation (IGIVA) model receiving results from RF as weight values searches for similar days of different weather types to improve the training data. Then, the original power series is decomposed by a complementary ensemble empirical mode decomposition (CEEMD) algorithm, while, to provide the short-term PV power generation, a backpropagation NN (BPNN) trained using a dynamic factor PSO method (DIFPSO) is used.
Again, the short-term horizon is investigated in [41] using an ensemble model made up of two LSTMs with Attention Mechanism (AM) working on the temperature and power time series, respectively, whose results are flattened and merged by a fully connected layer. The AM in DL is based on the concept of directing a model’s main focus by paying greater attention to certain factors when processing the data. In broader terms, attention is one component of a network’s architecture and is in charge of managing and quantifying the interdependence between the input and output elements (General Attention) or within the input elements (Self-Attention). Authors proved that AM can effectively improve LSTM performance.
The public dataset of the GEFCom14 competition is used to forecast PV generation for one day ahead with data sampled hourly in [42]. Here, an ensemble method with cluster analysis is proposed. A k-means algorithm is used to cluster solar generation, and the result of each cluster is used in an ensemble, by ridge regression, of RF models. Every ML-based method, being data-driven, needs an adequate amount of data; this means that, before being able to provide a forecast, it is necessary to acquire data for a non-negligible amount of time, ideally at least one year to take into account annual seasonality. In this regard, methods such as generative adversarial networks (GANs) could be useful to derive enough data for training an ML-based method. In [43] a recurrent generative adversarial network (R-GAN) is used to generate realistic energy consumption data by learning from real data. Although not strictly pertinent, this work has been included, as, in the authors’ opinion, such an approach could be effectively used in the forecasting in the field of PV production, for, as an example, generating weather or power data for the rainy or cloudy conditions that are usually the conditions resulting in lower accuracy predictions.
While papers listed so far are related to what is known as “point-forecast”, a far fewer number of papers have been published during the last several years concerning probabilistic forecasting. In this regard, some international forecasting contests, for example, M3 and M4 forecasting competitions, have contributed to encouraging the production of such types of forecasting results. These contests have highlighted some concepts, such as prediction interval (PI) and probability coverage, and some metrics more suitable for this type of forecast, such as pinball loss. For more information concerning this contest see [44,45,46]. In [47], the authors have provided a point-forecast with a confidence interval (CI) which quantifies the uncertainties associated with the forecasts delivered by mean of a bandwidth of possible changes and the certainty associated with each forecast. In this research, the authors employ a bootstrapping method to compute the CI. It is here interesting to highlight that confidence interval (CI) and prediction interval (PI) are completely different concepts, with the first being far narrower than the second (see [48,49]). In this paper the short-term forecasting horizon 1–6 h is explored; the main novelty resides in the considered PV plant size, a large multi-megawatt PV system (a 75 MW plat with 84 inverters), for which a new approach consisting of macro-level models results into a marginal improvement in accuracy compared to the usual inverter-level model approach. The proposed model uses an FFNN, an LSTM-RNN and a gated recurrent unit-RNN (GRU-RNN). The same CI criteria are used to provide a probabilistic description of the accuracy provided by a Gaussian Process Regression with Matérn 5/2 as kernel function in [50]. As commonly employed in the forecasting PV output field, the proposed model uses meteorological data (irradiance, temperature, and zenith and azimuth solar positions) and historical PV output as inputs. A k-means algorithm is used to cluster data into four groups based on solar output and time. The proposed model is validated using five PV plants data and both a five-fold CV procedure and a hold-out one (using 30 random days as a test). A first work more oriented on the probabilistic forecasting of PV production that summaries the models’ accuracy in terms of the PI is [51]. Here, in the addition to the usual point forecasting metrics such as RMSE and MAE, prediction interval coverage probability and prediction interval normalized average width (PINAW) are introduced; the first metric estimates the predicted reliability, which is based on the probability that the real PV power is within the PIs, while the latter measures the width of the PIs. In this paper is proposed an hourly day-ahead forecasting horizon and sampling, and is introduced a CNN combined with a quantile regression (QR) method with a two-stage training strategy to cope with the non-differentiable loss function of QR. Results obtained with the described model are very interesting also in comparison to that obtained by a quantile extreme learning model (QELM), quantile echo state network (QESN), direct quantile regression (DQR) and RBFNNs.
Another researcher paper considering probabilistic forecasting is [52]; here, the authors use a hybrid model made up of a wavelet transform (WT) applied to historical PV power data and a RBFNN that is trained using a PSO algorithm. The proposed hybrid model provides the point forecast while constructing a PI is employed an indirect method: bootstrap. Results in PI using bootstrap are compared, using reliability diagrams, to direct and indirect QR; from this comparison, bootstrap emerges as a paramount factor in determining the better performing model.
An Analog Ensemble (AnEn) model is used in [53]; the authors, starting from the AnEn developed in [54], have further improved the metric herein adopted to allow the management of data, both from NWP and from satellite images (used to derive GHI time series data), where the probability density function (PDF) of the analogue ensemble is built up using a weighted kernel density estimation (KDE) method. Results are compared with a quantile regression forest (QRF) and a Bayesian Regression (BR) with Automatic Relevance Determination (ARD) prior models. Forecasting results are described in terms of PINAW and Continuous Ranked Probability Score (CPRS) and show how the proposed model performs better, compared to QRF and BR, for a forecasting horizon of fewer than two hours, while above this threshold QRF seems to perform better. The dataset used in the 2014 Global Energy forecast competition (GEFCom2014) is used in [55] to test a novel method able to provide a probabilistic forecast. The proposed method, named nearest neighbours quantile filter (NNQF), solves the problem of training quantile regressions with gradient-based optimization by deriving a modified training set. This modified training set can be used to train a generic regression model that directly outputs the conditional empirical q-quantile defined by the neighbours used in the training. The results achieved show that the proposed method obtains accuracies similar to those of the winners of the GEFCom14 competition, with a difference in terms of the pinball loss values obtained below 1%.

Table 2.
Point-forecast ML-based methods for PV power production. Publication year considered: 2018–2021.
Table 2.
Point-forecast ML-based methods for PV power production. Publication year considered: 2018–2021.
| Year | Reference | Forecasting Horizon & Sampling | Parameters | Tested on One Location or Regional | Methods & Notes |
|---|---|---|---|---|---|
| 2021 | [31] | 1–16 steps ahead 15 min | Forecasted irradiance Historical powers | One location | DELM model that uses a SD training data selection method based on grey correlation analysis (applied on irradiance values) and Pearson correlation (applied on power production value). A novel decomposition method ECBO-VMD for power production time series. Fast training time for DELM. Forecasting horizon from 15 min to 4 h (1–16 steps-ahead if data is sampled every 15 min). Results compared with other DL models show great accuracy in everyday conditions, especially for 1–2 steps ahead. |
| 2021 | [32] | One day ahead 30 min | Historical weather Historical power Power from a physical model | Regional | AML model providing an ensemble of Elastic Net CV regression, Gradient Boosting Regression and RF Regression. An improved GA algorithm is used to select optimal features for the base models varying in each region. A physical model adds power production base prediction level, improving results of the final model. |
| 2021 | [33] | Annually/Quarterly | Historical power | Two locations (three cases/datasets) | A novel discrete grey model with time-varying parameters known as ATDGM(1,1). Almost 10/11 years for training and one or two years for testing. Results benchmarked with ARIMA, SARIMA, BPNN, LSTM and SVR models. |
| 2021 | [35] | Gh every 15 min Pwind hourly | Historical Solar energy & Wind energy (Public datasets) | 10 sites for solar energy 7 wind farms | Evolving Multivariate Fuzzy Time Series (E-MVFTS) + Typicality and Eccentricity Data Analytics (TEDA). Interesting methodology to detect concept drift. The model was developed in Python using the pyFTS library. |
| 2020 | [36] | One hour ahead 5 min | Historical power Historical meteorological data | One location | A hybrid DL model combining wavelet packet decomposition (WPD) and long short term memory (LSTM) networks. Comparisons with individual LSTM, RNN, GRU and MLP. |
| 2020 | [56] | 12 to 24 h ahead Hourly | Historical weather Weather forecast Historical powers | One location | LSTM network that employs a synthetic irradiance forecast derived using a k-MEANS classification algorithm resulting in an improvement in the obtained accuracy of 33%, concerning using the hourly type of sky forecast, or 44% over using the daily type of sky forecast. |
| 2020 | [37] | Day-ahead 15 min | Historical power direct normal irradiance (DNI) and temperature | One location | An ensemble formed by LSTM-RNN and a Time Correlation Modification model (TCM) whose coefficient is moduled by a partial daily pattern prediction (PDPP) framework. |
| 2020 | [38] | 10 min 1–4 weeks | Historical irradiance Historical power | One location | A share-optimized-layer LSTM (SOL-LSTM) network, whose hyperparameters are optimized using Sequential Model-Based Optimization (SMBO), where Transfer Learning (TF) is applied from a source domain, solar irradiance series (historical data), to the target domain, power production series, to overcome scarcity in training data. |
| 2020 | [39] | 1–12 steps ahead 30 min | Historical weather features | One location | LightGBM models combined with a temporal pattern aggregation and TS-SOM for weather clustering. Interesting performances from an accuracy point of view but also as training and inference time, even in edge devices. |
| 2020 | [40] | 1–150 steps ahead 5 min | Historical weather features Historical power | One location | Hybrid model made up by BPNN for final forecasts whose training data are PV power historical data decomposed by CEEMD algorithm and weather selected by RF and data-optimized by IGIVA |
| 2019 | [41] | 1–8 steps ahead 7.5 min | Historical temperature and power | One location | Ensemble model of two LSTMs with Attention Mechanism, one for temperature series and one for power series. |
| 2019 | [42] | 1–24 steps ahead 1 h | Weather forecasts Day-ahead Hourly | Ensemble, using ridge regression, of RF models using a preliminary cluster analysis of weather forecasts | |
| 2019 | [43] | Not applicable | Not applicable | Not applicable | R-GAN to generate realistic data to be used for training energy forecasting models |
Table 3.
Interval-forecast ML-based methods for PV power production. Publication year considered: 2019–2021.
Table 3.
Interval-forecast ML-based methods for PV power production. Publication year considered: 2019–2021.
| Year | Reference | Forecasting Horizon & Sampling | Parameters | Tested on One Location or Regional | Methods & Notes |
|---|---|---|---|---|---|
| 2021 | [47] | 1–6 h ahead (21 steps) 15 min | Historical Weather Historical power (inverter level and plant level) Forecast altitude & azimuth sun position (pvlib-solar position) | One location | FFNN & LSTM-RNN+GRU-RNN |
| 2021 | [50] | 1–24 h ahead Hourly data | Direct, diffuse and horizontal solar irradiance, temperature, zenith & azimuth solar position | Five locations | Gaussian process regression (GPR) with Matern 5/2 kernel function on pre-clustered data (by k-means) |
| 2020 | [51] | 1–24 h ahead Hourly data | Solar irradiance, temperature, humidity, historical PV power | One location | Quantile CNN (QCNN), two-stage training strategy to solve the training problem of the QCNN caused by the non-differentiable loss functions of the QR. PI and PINAW provided |
| 2020 | [52] | 1,3,6 h ahead | Weather data Historical PV power | One location | Hybrid model WT+RBFNN+PSO. PI provided using Bootstrap and results compared QR. Bootstrap obtains better results in terms of reliability diagrams for the PI. |
| 2019 | [53] | 30 min–36 h ahead 30 min | Forecast from NWP Satellite images to estimate GHI PV power, temperature, GTI, clear-sky profile using McClear model | Three locations | Analog Ensemble (AnEn) model using NWP data, satellite images and in situ data. State-of-the-art results in 5–36 h horizon. |
5. The Latest Research on Anomaly Detection (a.k.a. Fault Detection) and Diagnosis in PV
This section reports the latest research papers, i.e., published during the year 2018–2019, concerning anomaly detection (AD), in some papers also indicated as fault detection (FD), in PV.
This research field counts fewer papers if compared to papers concerning PV power forecasting, but it is a very interesting field in terms of the suitability of ML-based methods to automatically detect and classify anomalies or better provide predictive maintenance. PV plants are subject to many different faults during their life; these faults can lead simply to a power loss or even pose a hazard risk due to fires. To have the idea of the likelihood of power loss coming from faults, this can vary from 3.6% during the first year of life to 18.9% after three years of life, as stated in [57] that analyzed some domestic PV systems in the UK. Typical PV faults can be detected automatically using ML-based methods essentially using three methodologies:
- Analysis of string/panel current and/or voltage, or current/voltage measured at the inverter with the use of exogenous variables as environmental ones,
- Image analysis performed mainly by infrared (IFR) images detected by Unmanned Aerial Vehicle (UAV),
- Clustering-based techniques that can detect anomalies using unlabelled data.
For the methodology at point 1, the most frequently used methods include ANN, FL, Decision Tree (DT) and RF. For point 2 above, DL is the most suitable, and various types of CNN have been employed in this regard.
The third methodology reported above counts essentially k-Nearest Neighbour (kNN), one class SVM (1-SVM) or more recent algorithms as Isolation Forest (IS) or Local Outlier Factor (LOF). This field of research often deals with a dataset of unlabelled data and/or where the faults are, fortunately, very few, resulting in a highly unbalanced dataset (few faults and majority of data fault-free). For this reason, the normal accuracy metric is not well suited to accurately represent the model’s performance. Nonetheless, many papers report only traditional accuracy while better metrics could be Balanced Accuracy, F1 score [58], Cohen’s Kappa [59] or Matthews Correlation Coefficient (MCC) [60]. Moreover, for the reason outlined above, very often the dataset used to train and test the model is ad hoc simulated and not derived from a real plant; this can overcome the problems related to an unbalanced dataset, as many faults as desired can be created/simulated, and the issue concerning the labeling can be resolved, i.e., accurately describing what type of fault occurred and where and at which timestamp; but, at the same time, this could be not representative of a real functioning plant. It is probable that the optimal approach could be to employ both simulated and real data with ad-hoc created faults. The remainder of this section will present:
- A discussion of anomalies/faults analyzed in literature with ML-based methods
- Suggestions on which approach from the most current literature review (from 2018 till 2021) seems to produce better results
- Common challenges and insight on possible future trends
Detectable Faults by ML-Based Methods
Faults in PV can be of different types; for in-depth analysis of faults that can adversely affect PV plants see [61,62].
In literature, the vast majority of works deal with four types of faults: short circuit (SC), open circuit (OC), partial shading (PS) and abnormal ageing. For these types of faults, the most employed solution is based on an MLP ANN that considers as inputs current or voltage related to string/array/panel, so the most frequent variables taken into account are voltage at MPP (VMPP), current at MPP (IMPP), OC voltage (VOC) and SC current (ISC), almost always supported by environmental variables such as ambient and module temperature and solar irradiance at the panel level. These models necessarily require a labelled dataset and are mainly based on the difference between the models’ predicted system performance and the real measured one. Many ML-based models that employ SNN apply input pre-processing as Discrete Wavelet Transform (DWT); this is a typical form of feature engineering that has proven to be beneficial to improve the FD accuracy of the model. For the faults described so far, the models usually employed consist of SNNs of various typologies, but also DT ensembles such as RF or 1-SVM. Considering faults detectable using image analysis as module delamination/crack, hotspot or soiling (dust and birds’ droppings), this is a field dominated by DL and especially CNNs trained on thermal infrared (IR) images acquired by UAV. For detecting faulty cells or modules electroluminescence (EL) images are also considered, while at the array level only IR images, generally EL images, embed more fault information and are the preferred type of images. The type of CNN used in this field varies from pre-trained known CNN architectures such as LeNet and VGG-16 to custom architecture. This is a field where Transfer Learning [38] can be very beneficial and where data augmentation techniques are also very common (image rotation, flip, etc.).
Although CNNs are particularly suited to dealing with 2d data, i.e., images (usually IR or EL), some interesting results have been obtained by treating a 1D signal, such as a current-voltage (I-V) curve, as a 2D feature using, for example, a scalogram and combining a CNN with an LSTM.
In Table 4 are reported some recent, always in the range 2018–2021, review papers dealing with ML-based models to detect faults/anomalies in PV.
The remainder of this paragraph is devoted to the latest research paper dealing with ML methods for anomaly/fault detection in PV. Paper [68] focuses its attention on the detection of hotspots using a hybrid based SVM model trained using infrared thermography (IRT) images; it classifies panels into three categories: healthy, non-faulty hotspot and faulty hotspot. The novelty of this paper resides in the pre-processing phase of the IRT images acquired by handheld a FLIR camera horizontally aligned to PV panels of a PV system made up of 22 modules. The image feature extraction pipeline here proposed results in 41 features: 3 RGB, 12 contrast, 12 correlation, 3 energy, 1 Histogram of Oriented Gradient and 10 Local Binary Pattern. The feature extraction proposed results in an improvement in terms of accuracy results for the following classification algorithms: KNN, n-Bayes, Quadratic Discriminant Analysis (QDA) and bagging ensemble (BE). The SVM performed the best also in terms of computing time (k-fold CV methodology applied to derive all metrics). An LSTM NN is used in [69], combined with DWT as a feature extraction phase, to detect High Impedance Fault (HIF) and four other faults coming from an IEEE 13-bus system with a solar PV network simulated in MATLAB/Simulink. Results from the proposed LSTM as classifier are compared with other ML-based methods: SVM, Naïve Bayes, J48 Decision Tree. Models performance, defined utilizing several metrics (F-Measure, Recall, Precision, CM, Kapps Statistics) clearly show the LSTM model as the best performing.
Line-to-Line (LL) faults are automatically detected in [70] using an SVM model whose hyper-parameters are selected using GA. This model employs features extracted from DC I-V data resulting from a simulation model (developed with Matlab/Simulink) of a PV plant. GA is also used to extract optimal features for detect LL faults even in case of low mismatch and high impedance. A total of ten features are extracted from the simulated data, and all features are related to I–V curves under normal and fault events based on three points: short circuit current, MPP and open-circuit voltage. Results show as optimal the Gaussian kernel for the SVM model and two or three features from the whole set of ten. An emulated (not software but by dedicated hardware simulator) GCPV system is used in [71] to test a novel RK-RFKmeans and RK-RFED. Faults emulated at the grid side are open-circuit (F1) and standalone mode protection (F3), while on the PV side are poor connection and/or erroneous reading (F2), open-circuit/short-circuit/sudden disconnection (F5) and partial shading from 10–20% (F4). This paper introduced two new RF classifiers based on RK-RF that extract nonlinear features using a reduced kernel PCA (RK-PCA) technique to decrease the computational complexity of K-PCA for large data sets. The data reduction is based on two schemes; Euclidean distance metric and K-means clustering. Comparison with ML bases methods such as SVM, DT, ND, DA, KNN and RNN show that the two proposed methods perform very well.
A novel approach based on a 2D CNN is proposed in [72]; this CNN is trained with 2D scalograms from PV system data. This 2D CNN is proposed into two configurations: one derived from a pre-trained AlexNet CNN in which the last three layers are fine-tuned to provide a six-way classifier, and another where the results from a pre-trained AlexNet layer (fc7) are used with a classical classifier (RF and SVM). Faults considered detectable with the proposed approach are PS, LL, OC, arc-fault and faults (LL and OC) in PS. Good results are obtained from the fine-tuned AlexNet but also by the pre-trained AlexNet + SVM. This paper also outlines how data from MPPT (Imax and Vmax) are significant for obtaining good accuracy (performance halves without these data). In [73] is proposed a hierarchical model for anomaly detection and a multimodal classifier to recognize five common faults in PV. The anomaly detection is realized in two steps: an Auto Gaussian Mixture Model (Auto-GMM) acts as an unsupervised ML model to detect anomalies, and this is further filtered using an auto-thresholding methodology applied to a local anomaly index (LAI) that is derived for each probable anomaly. For the classification, the authors propose a multimodal feature extraction procedure based on the Fourier spectrum derived from PV strings currents. Three classifiers are compared to classify five common PV faults: SVM, bagging and XGBoost. With the extracted multimodal features, the XGBoost model has proved to perform the best.
In Table 5 are reported some recent review papers dealing with ML-based models for fault/anomaly detection and diagnosis in PV.
6. The Latest Research on MPPT in PV
Apart from its application, PV are expected to be operated in a manner such that maximum power can be extracted from the installed system.
The energy output of a PV system is sensitive to variations in weather conditions; in particular, it is dependent on solar radiation and temperature. Variations in cloud cover, fog and heat affect the PV system’s conversion efficiency. Dust and other particles floating in the air or covering the panel can drastically decrease the efficiency of the power conversion process as well [76].
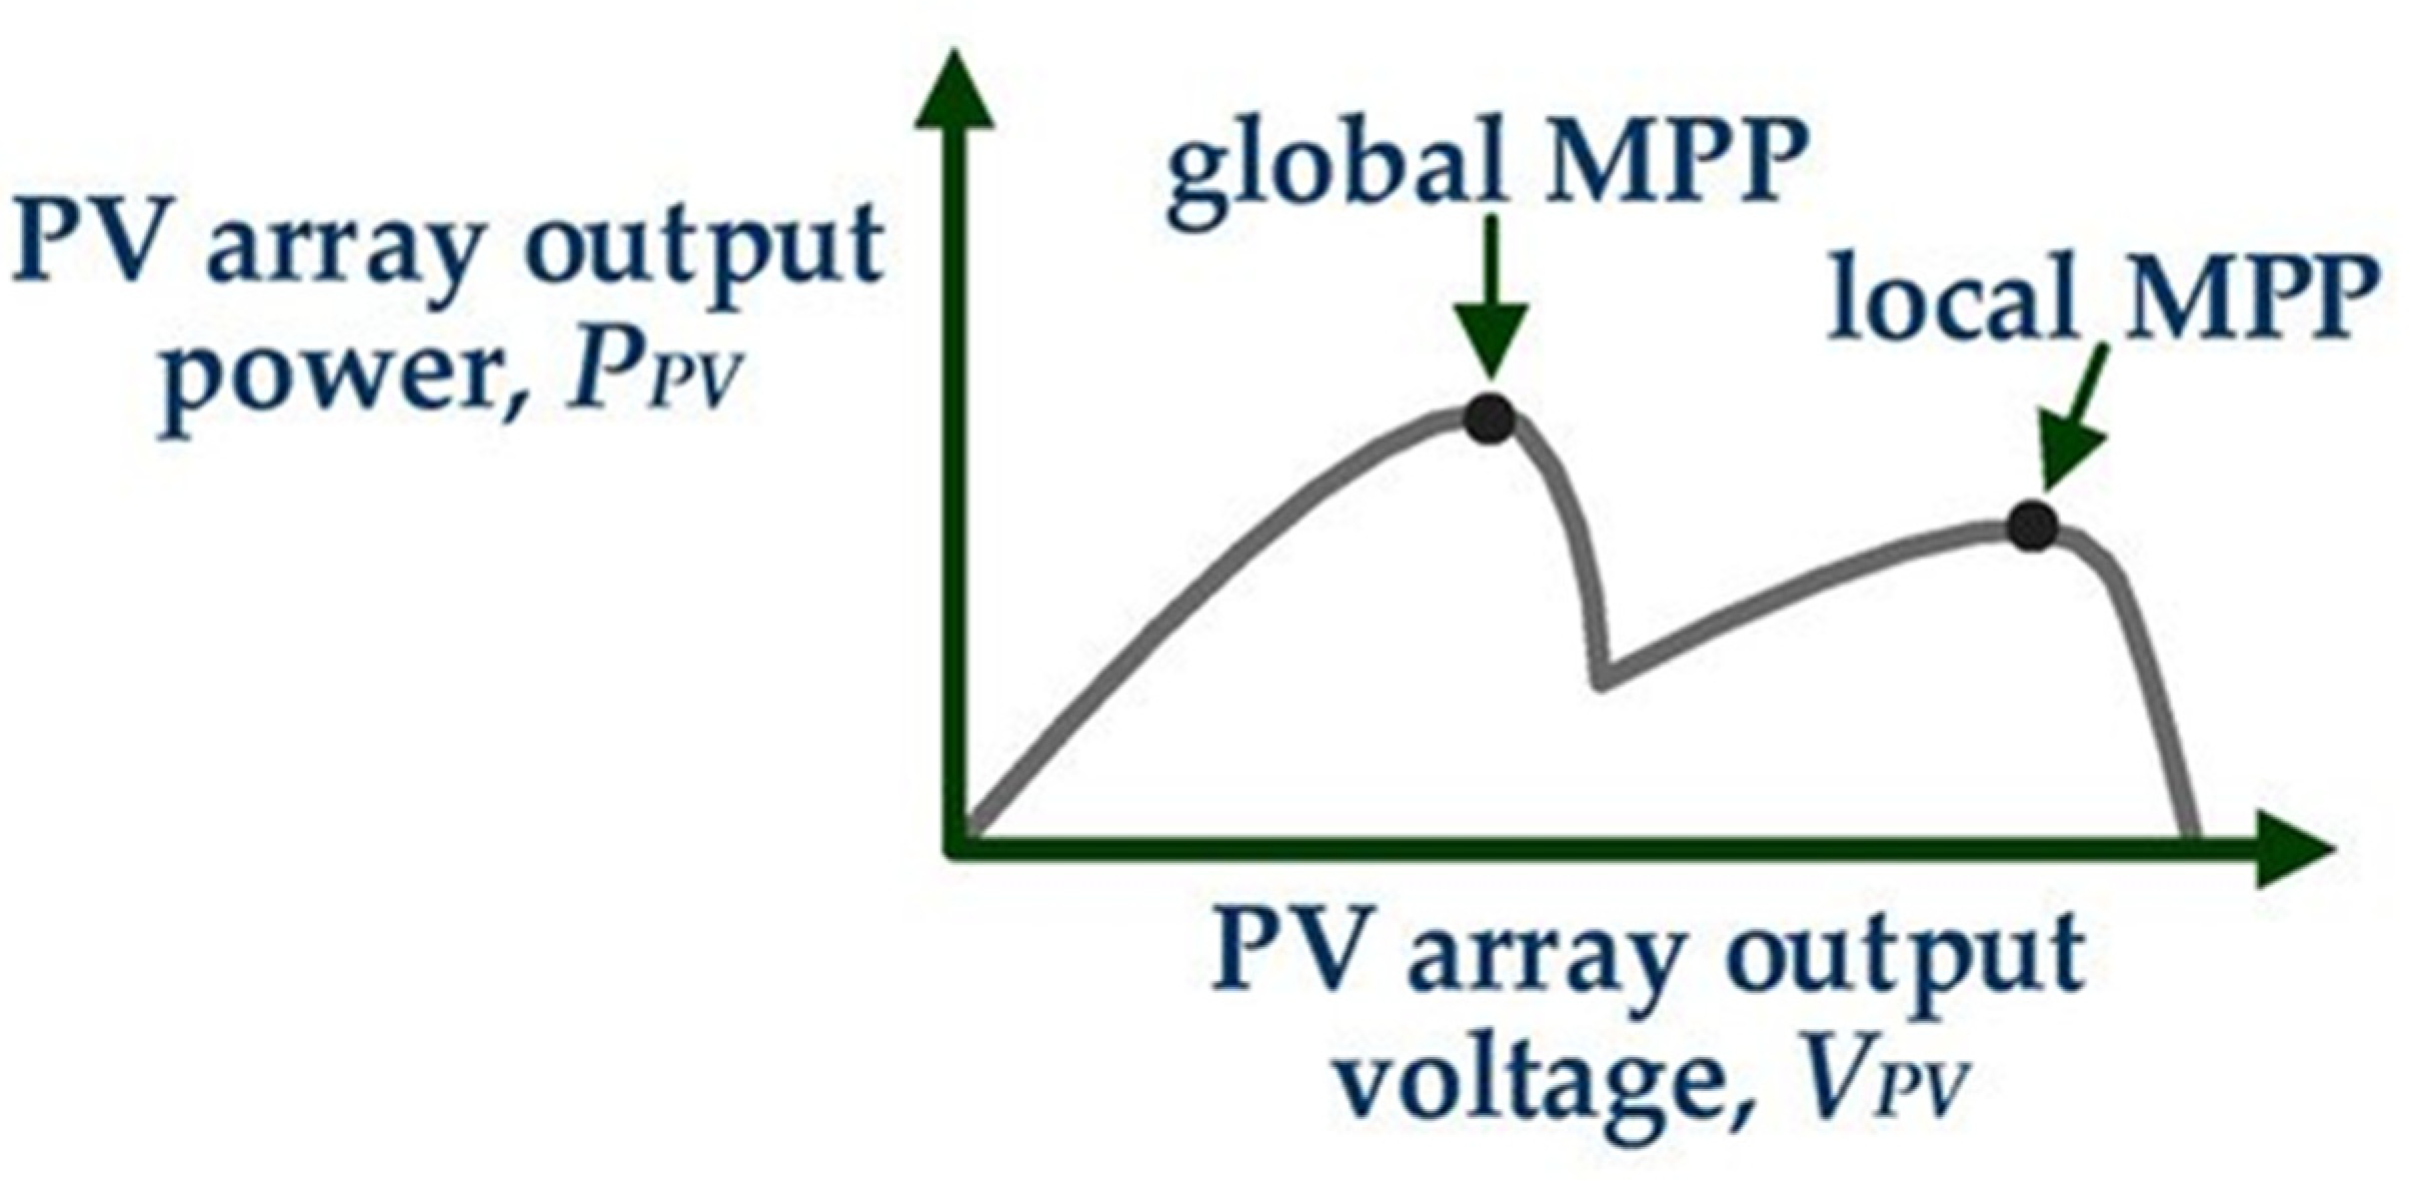
Under these conditions, the power–voltage curve of the PV array exhibits multiple local maximum power points (MPPs). However, only one of these MPPs corresponds to the global MPP (GMPP), where the PV array produces the maximum total power [77]. (Figure 2). Any change in the output voltage because of the change of load or other reasons will cause the PV panel to produce less power than the maximum. Therefore, the controller of the power converter that is connected at the output of the PV array must execute an effective global MPP tracking (GMPPT) process to continuously operate the PV array at the GMPP during continuously changing weather conditions.
Consequently, many research efforts are focused on finding ways to drive PV panels to their maximum output power at all weather conditions, thus ensuring their profitability [78].
In Table 6 a list of papers that provide a review on PV MPPT techniques is shown.
MPPT methods can be classified into indirect and direct methods [91]. The indirect methods, such as open-circuit and short-circuit methods, require prior knowledge of the PV array characteristics or are based on mathematical relationships which do not meet all meteorological conditions. Therefore, they cannot precisely track the MPP of the PV array at any irradiance and cell temperature. For this kind of method, temperature and irradiance must be used as sensed parameters, but their measurement requires expensive devices that have to be placed throughout the PV array to obtain the values of such variables for each panel or group of them, thus making the measurement very expensive, especially for large PV plants. On the other hand, direct methods work under any meteorological condition. The most used direct methods are [6]: P&O, IncCond and ML-based MPPT methods. These methods control the reference signal of a DC-DC converter that matches the PV module voltage with that of the DC bus or works as a battery charge [7]. In the P&O method, the controller adjusts the voltage by a small amount and observes the power change; if the power increases, it adjusts the operating voltage in that direction until the output power no longer increases. The IncCond method is based on the fact that the slope of the power–voltage curve characterizing the circuits of the PV array is zero at the MPP, positive on the left and negative on the right of the MPP. The controller evaluates the effect of a voltage adjustment by measuring the incremental changes in PV array output. However, the effectiveness of P&O and IncCond methods is limited due to steady-state oscillation and diverged tracking direction, and they can even fail to identify the global optimal power point under some special conditions, such as an abrupt irradiance change due to shading. Therefore, more intelligent MPPT techniques based on machine learning methods have been proposed for better transient and steady-state performance. Intelligent techniques (i.e., FL and ANN-based MPPT methods) are more efficient and they have fast responses, but they are more complex compared to the conventional techniques that are generally simple, cheap and less efficient [91]. ANN-based methods have shown their advantages under rapidly varying irradiance [92], especially regarding response efficiency. However, despite their higher efficiency, these advanced heuristic approaches are much more complex compared to the conventional techniques. The performance of the ML approaches is heavily dependent on the accuracy of the trained model that is determined by the quality of training data, and frequent calibration is needed as the system evolves.
In Table 7, several papers that use ML approaches to improve MPPT performance have been analyzed. They have been ordered based on the year of publication. In particular, the table is useful to underline the ML method that has been used most frequently and the results that the different approaches allow to obtain. Unfortunately, results are not always presented in such a way they can be compared with other similar papers.
In particular, some papers present results comparing the value of the power that the proposed solution allows reaching with the value of the power of the global MPP [77,93,94,95]. In these cases, to compare results obtained in the different papers, the ratio between the reached power, Preached, and that one that should be obtained, PGMPP, has been calculated as:
In some papers, other statistical errors have been used to compare the reached power with that one at MPP: the Mean Error (ME in Equation (2)) [96], the Mean Square Error (MSE in Equation (3)) [96], the Standard Deviation error (σ in Equation (4)) [96], the Root Mean Square Error (RMSE in Equation (5)) [76,97], means absolute error (MAE in Equation (6)) [97], the overall power tracking efficiency (η in Equation (7)) [98] and a quality indicator that provides information about the ability of the ANN to predict the MPP (QI1 in Equation (8)) [99]:
where N is the number of tests and μ is the average of the reached values.
Table 7.
Papers for PV MPPT. Publication year considered: 2018–2021.
| Year | Reference | ML Method | Description | Results on Reached Power | Transient Response | Simulation/ Experimental | Advantages |
|---|---|---|---|---|---|---|---|
| 2021 | [100] | ANN, segmentation-based approach and hill-climbing | The paper deals with the feasibility study and implementation of a novel easy and cost-effective hybrid two-stage GMPPT algorithm. The first stage synergically combines two different methods to predict the optimal operating condition: an ANN-based algorithm and a segmentation-based approach. A traditional hill-climbing method is used in the second stage to finely track MPP. Various ANN structures have been implemented and tested. | Figures show the MPP_ratio (maximum value 99.55%) | - | Simulation (Matlab) | Very fast dynamic behaviour |
| 2021 | [101] | PSO, ANN GA-FLC, PSO-FLC, GA-ANN and Combined GA-FLC-ANN | Two artificial intelligence-based MPPT systems are proposed in the paper for grid-connected PV units. The first design is based on an optimized FL control using a genetic algorithm and PSO for the MPPT system. In turn, the second design depends on the genetic algorithm-based ANN. Each of the two artificial intelligence-based systems has its privileged response according to the solar radiation and temperature levels. Then, a novel combination of the two designs is introduced to maximize the efficiency of the MPPT system. The simulation results demonstrate that the GA/PSO-FLC and the GA-ANN-based MPPT methods have significant improvement in terms of the output DC power and the tracking speed. | Quantitative evaluation of INC, GA-FLC, PSO-FLC, GA-ANN and Combined GA-FLC-ANN | Rise time = [0.0168s–0.0251s] | Simulation (Matlab) | |
| 2021 | [102] | Backstepping terminal sliding mode control (BTSMC) | A nonlinear BTSMC is proposed for maximum power extraction. The system is finite-time stable and its stability is validated through the Lyapunov function. A DC-DC buck-boost converter is used to deliver PV power to the load. For the proposed controller, reference voltages are generated by an RBF NN. | MPP_ratio = 98.74% Under varying climatic conditions = 98.72% Under faulty condition | Simulation (Matlab/Simulink) | Best performance of the proposed control technique in all conditions | |
| 2020 | [95] | MFA + ANFIS + P&O | After being trained using the modified firefly algorithm (MFA), the ANFIS (adaptive neuro-fuzzy inference system) based on the radiation conditions on solar panels provides a quantity as the optimal duty cycle, from which point the P&O algorithm starts to enter the tracking cycle and tries to detect the MPP under partial shading conditions. | MPP_ratio = [65.05–99.95%] | - | Simulation (Simulink) | High speed in tracking the MPP |
| 2020 | [103] | RL + DL | The deep Q-network (DQN) and deep deterministic policy gradient (DDPG) are proposed to harvest the MPP in PV systems, especially under a PSC. Two robust MPPT controllers based on DRL are proposed, including DQN and DDPG. Both algorithms can handle the problem with continuous state spaces, in which DQN is applied with discrete action spaces while DDPG can deal with continuous action spaces. Rather than using a look-up table in the RL-based method, DRL uses neural networks to approximate a value function or a policy so that high memory requirement for sizeable discrete state and action spaces could be significantly reduced. | Powers increase by 17.9% (DQN) and 15.4% (DDPG) | Simulation (Matlab/Simulink) | No prior model of the control system is needed. Significant tracking speed | |
| 2020 | [77] | Q-learning-based | The paper presents a novel GMPPT method that is based on the application of a machine-learning algorithm (Q-learning-based method). | MPP_ratio = [97.1–99.7%] | Simulation (Matlab/Simulink) |
| |
| 2020 | [76] | GRNN and Support Vector Regression (SVR) | The main contribution of the work is to predict the optimum reference voltage of the PV panel at all-weather conditions using ML strategies and to use it as a reference for a Proportional-Integral-Derivative controller that ensures that the DC/DC boost converter provides a stable output voltage and maximum power under different weather conditions and loads. | RMSE = 0.0278 (SVR) RMSE = 0.044 (GRNN) | Simulation (Matlab/Simulink) | Robust against internal and external disturbances | |
| 2020 | [104] | ANN | The authors propose a simple MPPT algorithm that is based on the neural network (NN) model of the photovoltaic module. The expression for the output current of the NN model is used to develop an analytical, gradient MPPT algorithm which can provide high prediction accuracy of the maximal power. Finally, to avoid the usage of the pyranometer, a simple irradiance estimator, which is also based on the identified NN model, has been proposed. The presented algorithm has smaller computational complexity compared to the other NN-based MPPT algorithms, in which the MPP position is predicted by one multilayer NN or by two single-layer NNs. | Relative error between the predicted and true maximal power:
| Simulation | Low computation complexity | |
| 2020 | [105] | DT, Multivariate Linear Regression (MLR), Gaussian Process Regression (GPR), Weighted K-Nearest Neighbors (WK-NN), Linear Discriminant Analysis (LDA), Bagged Tree (BT), Naïve Bayes classifier (NBC), SVM, RNN | Nine ML-based MPPT techniques, by presenting three experiments under different weather conditions, in case of no sensor, are introduced. DT, Multivariate Linear Regression (MLR), Gaussian Process Regression (GPR), Weighted K-Nearest Neighbors (WK-NN), Linear Discriminant Analysis (LDA), Bagged Tree (BT), Naïve Bayes classifier (NBC), SVM and Recurrent Neural Network (RNN) performances are validated. | RMSE: DT = 0.42 WK-NN = 0.37 MLR = 0.44 LDA = 0.48 BT = 0.73 GPR = 0.4 NBC = 0.51 SVM = 0.14 RNN = 0.36 | Training time: DT = 0.91 s WK-NN = 0.78 s MLR = 6.17 s LDA = 2.32 s BT = 2.35 s GPR = 5.04 s NBC = 8.56 s SVM = 1.1178 s RNN = 8.9 s | Simulation (Matlab/Simulink) | Give the possibility to compare different ML algorithms |
| 2020 | [106] | FL and ANFIS | An FLC with a reduced number of rules-based MPPT and ANFIS based MPPT have been developed and tested in MATLAB/Simulink environment, based on the simulation it can be concluded that with both controllers the PV panel can deliver the maximum power. However, the performance of fuzzy with reduced rules MPPT is better than ANFIS based MPPT in terms of tracking speed and static error due to its reduced number of rules (8) Table instead of conventional (25) which makes it lighter and improves global performance. | Static error = 0.016% (FLC With reduced Rules) 0.020% (ANFIS) | Tracking time = 0.005 s (FLC With reduced Rules) 0.011 s (ANFIS) | Simulation (Matlab/Simulink) | |
| 2019 | [94] | Fuzzy neural network (FNN) | An FNN controller based on the MPPT technique has been designed and implemented to control the duty cycle of a boost converter and to elicit the maximum power from the PV cells. The FNN controller is also refined using a gradient descent-based back-propagation algorithm to obtain optimal results. | MPP_ratio = [96.09–96.67%] | - | Simulation (Matlab/Simulink) | The FNN controller has good stable sets of responses where there is no oscillation around the optimal value. |
| 2019 | [92] | Sequential Monte–Carlo (SMC) filtering + ANN | An improved MPPT method for PV systems method is proposed utilizing the state estimation by the sequential Monte–Carlo (SMC) filtering, which is assisted by the prediction of MPP via an ANN. A state-space model for the sequential estimation of MPP is proposed in the framework of the INC MPPT approach. The ANN model is based on the input of the voltage and current or the irradiance measurements and predicts the generalised local log-likelihood ratio (GLLR) given the knowledge learned from training data. Furthermore, the ANN-based refinement is triggered only when the proposed GLLR change detector declares the irradiance change, which decreases the number of redundant ANN predictions when the irradiance is steady. | Prediction quality index = [87.7–96.2%] | SMC = 0.22 s I-C = 0.35 s | Simulation (Simscape Power Systems in Matlab) | Efficient and economical MPPT solution |
| 2019 | [78] | Reinforcement learning -Q-Table and the RL-Q-Network (QN) | Two reinforcement learning-based MPPT (RL MPPT) methods are proposed by the use of the Q-learning algorithm. One constructs the Q-table and the other adopts the Q-network. These two proposed methods do not require the information of an actual PV module in advance and can track the MPP through offline training in two phases: the learning phase and the tracking phase. A Markov decision process model is suitable for describing the interaction between the circuit connected to the PV module and the controller. An MDP model consists of four elements, which are state, action, transition and reward. With the MDP model described, an RL-QT MPPT method is proposed by constructing the Q-table to perform MPPT control. However, the state representation is needed to be discretized for the tabular method, which may cause the loss of MPPT control accuracy. Therefore, a Q-network-based MPPT method is proposed. In the RL-QN MPPT method, the Q-table is approximated by a neural network, so that the discretization of the states is not needed. | Quantitative evaluation | Experimental | Small oscillations and high average power | |
| 2019 | [107] | Transfer reinforcement learning (TRL) | The paper aims to introduce a novel maximum power point tracking (MPPT) strategy called TRL, associated with space decomposition for PV systems under PS conditions (PSC). The space decomposition is used for constructing a hierarchical searching space of the control variable, thus the ability of the global search of TRL can be effectively increased. | Quantitative evaluation | - | Simulation | Fast convergence and a high convergence stability |
| 2019 | [108] | ANN + Backstepping Sliding Mode (BSM) | The paper presents a novel hybrid technique for tracking the maximum power point of the photovoltaic panel. This approach includes two loops: the first one is the ANN loop that is used to quickly predict the desired voltage, which minimizes the calculation and allows a rapid system response. While the second loop consists of a combination of the sliding mode and the backstepping control approaches, the main aim is to track the reference voltage that is generated by the ANN loop, the second purpose is to have a rapid, robust and accurate system under various and difficult changes of meteorological conditions. The proposed technique is compared with the conventional algorithms and the hybrid controllers, ANN combined with the Integral sliding mode controller and ANN combined with the backstepping controller, to prove its effectiveness and tracking performance. | Figures show the effectiveness of the proposed approach | Simulation (Matlab) | A robust controller | |
| 2019 | [109] | Neuro-fuzzy | In the paper, an IC-based variable step size Neuro-Fuzzy MPPT controller has been propose and investigated. The proposed NF MPPT controller is developed firstly in the offline mode required for testing a different set of neural network parameters to find the optimal neural network controller used secondly in the online mode to track the output power of the PV system under different atmospheric conditions. The inputs variables for NF MPPT are the same as the IC algorithm inputs i.e., I and V, while the output power is the PWM ratio used to drive the DC-DC boost converter. | Figures show the effectiveness of the proposed approach | Simulation (Matlab/Simulink) | Response time, ripple, steady-state oscillation accuracy | |
| 2019 | [110] | ANN | The authors design an MPPT controller based on an ANN for a solar structure using Boost and Cuk converter topology. The performances of the proposed solution are analyzed under uniform and varying climatic. Cuk converter provides good performance under all climatic conditions but the main disadvantage is its cost which is comparatively high than that of the Boost converter. | MPP_ratio = 95.5% (boost) and 99.56% (Cuk) | Rise Time (μs) = 600.6 (boost) 465.1 (cuk) Settling time (μs) = 801(boost) 757.4 (cuk) | Simulation (Matlab/Simulink) | Good performance with accurate tracking, high efficiency and low oscillation under uniform and rapidly changing climatic conditions |
| 2018 | [111] | SVM and extreme learning machine (ELM) | A customized MPPT design was proposed to determine the optimal step sizes according to three different weather types. The weather-type labelling was automatically provided by a supervised learning classification system. Two classical machine learning technologies were employed and compared, including SVM and ELM. The classification probability from SVM or ELM is deployed as the confidence level and is designed as a fuzzy-weighted classification system to further improve the MPPT design. | Classification accuracy reaches over 90% for both SVM and ELM methods | Simulation (Matlab/Simulink) | High MPPT efficiency by using a low-cost simple micro-controller | |
| 2018 | [98] | Bayesian fusion | An intelligent Bayesian network technique is proposed for global MPP tracking of a PV array under partial shading conditions. The algorithm sweeps the output voltage of a DC-DC converter, measures the corresponding current, computes the resulting power, and uses the Bayes rule to compute an estimate of the MPP. A PID controller is used for a more efficient real-time controller with minimum overshoot and minimum rise time in output power. | η = 98.9% (simulation) η = 98.4% (Experimental) | 1.72 s (simulation) and 1.86 (experimental)when the time interval of the irradiation change is 10 s–20 s when G = 1000 W/m2 to G = 500 W/m2 1.81 s (simulation) and 1.88 (experimental)when the time interval of the irradiation change is 20 s–30 s when G = 500 W/m2 to G = 800 W/m2 | Simulated (Matlab) and then experimentally validated | Enhanced response time and efficiency |
| 2018 | [99] | ANN + hill climbing | A global maximum power point tracking algorithm including an ANN and a hill-climbing method is combined. The proposed solution is suitably designed for handling fast-changing partial shading conditions in photovoltaic systems. Through only a limited number of preselected current measurements, the proposed algorithm is capable of automatically detecting the global maximum power point of the photovoltaic array and also minimizing the time intervals required to identify the new optimal operating condition. | QI1 = [8.96–14.26%] | - | Simulation | Does not require any information on the environmental operating conditions and it is cost-effective, with no additional hardware requirements |
| 2018 | [112] | ANN and FL | Authors propose a new MPPT algorithm based on FL and an ANN to improve the performances of a system that consists of three main parts: PVG, a DC-DC boost converter and a DC motor coupled with a centrifugal water pump. The ANN is used to predict the optimal voltage of the PVG, under different environmental conditions (temperature and solar irradiance) and the fuzzy controller is used to command the DC-DC boost converter. The proposed algorithm gives better stability and accuracy to the system compared to P&O-based MPPT. | Comparison based on figures | - | Simulation (Matlab/Simulink) | |
| 2018 | [113] | ||||||
| 2018 | [114] | Coarse-Gaussian SVM and ANN | The paper introduces an innovative MPPT algorithm that combines two powerful ML techniques of coarse-Gaussian SVM (CGSVM) (a particular type of classification learning technique) and an ANN as the ANN-CGSVM technique. The results of the proposed MPPT algorithm were compared with that of Adaptive Neuro-Fuzzy Inference Systems (ANFIS), conventional ANN and the hybrid of ANN and P&O (ANN-PO) results to verify the proposed algorithm performance for the MPPT task. The obtained results suggested that the CGSVM classifier could extract considerable power from the PV panel under varied weather conditions. | MPP_ratio = [69.34–98.99%] | Tracking time between 0.006 s and 1.486 s | Simulation | Good efficiency and the convergence speed |
As it is possible to note in Table 7, almost all the papers propose simulations to test their algorithms. Only in [78] do authors propose both simulation and experimental results. This can be because ML algorithms have a computational load that is hardly in accordance with the characteristics of the hardware that can be used in PV fields.
7. Other Applications in the PV Field
In few cases, ML algorithms have been used to improve the performance of concentrating PV (CPV).
In particular, in [115] authors studied a Random-Forest (RF) model for the temperature analysis of two different triple-junction solar cells mounted on an experimental CPV system. The cell temperature evaluation is a basic parameter to determine the energy production of a CPV/T system. Moreover, an ANN model and an LRM have been also studied to compare the RF model results in terms of absolute error and fit capability. The RF model to evaluate the performances of a CPV system from electric and thermal presents the lowest values for RMSE, MAE and MAPE. In particular, RMSE is 1.95 °C, the MAE is 1.17 °C and the MAPE is 3.67%. These values are two or three times lower than the LR and ANN models results. However, it should be noted that the ANN model shows better statistical results with respect to the LRM. This proves that a non-linear method represents a better solution than a linear one for the cell temperature evaluation. The good forecast capability of the RF technique is also proved by the values of the goodness of fit(R2). In particular, the estimated values are 0.95, 0.79 and 0.76, respectively, for the RF, ANN and LRM models. Finally, the RF model constitutes the best method both in terms of absolute error and fit capability.
Another paper where ML algorithms are used in the field of CPV is [116]. The authors developed four machine-learning algorithms (support vector machine, ANN, kernel, nearest-neighbour and deep learning) to predict the power outputs of a CPV system. The authors concluded that all machine learning algorithms used in the paper can successfully predict PV module output power. However, the SVM algorithm performed reasonably well throughout the day. The k-NN algorithm shows a prediction trend similar to SVM at the beginning of the observations. However, it is possible to say that this algorithm gives a better result than SVM, especially in the initial and final observations. As the predictions with ANN are analyzed, it is seen that this algorithm is successful in predicting peak points as in the SVM algorithm. On the other hand, the DL approach predicted power output higher than the measured value. On the other hand, the reason for the higher deviation in the DL algorithm is probably related to the availability of data.
In [117] an RBFNN is used in the field of CPV. More specifically, it is used to predict the output power of a high CPV (HCPV) facility. The RBFNN has been designed using MATLAB. Two coefficients have been used to verify the accuracy of the adopted solution, the RMSE and the R2. The results were compared to those obtained by the ASTM E-2527 model using the same dataset. Results have been divided for sunny and cloudy days, obtaining an RMSE of 3.3 kW and 4 kW, respectively, in the case that the ASTM model is used. In the case of R, BFNN the RMSE is equal to 1.3 kw for sunny days and 2.24 kW for cloudy days. The obtained value of R2 is 0.322 for sunny days and 0.339 for cloudy days in the case of the ASTM model.
Another application in the PV field where ML has been used to improve the performance of the system is PV/T hybrid systems. They consist of conventional thermal collectors with an absorber covered by a PV layer. The PV modules produce electricity and simultaneously the absorbed thermal energy is transported away by the working fluids.
In [118] different PV/T systems (conventional PV, water-based PV/T, water-nanofluid PV/T and nanofluid/nano-PCM) under the same conditions and environment have been tested using one ANN-based MLP system. The parameters used in simulating the neural models were input parameters such as Solar Irradiation and Ambient Temperature, whereas the output parameters were PV/T Current (A), PV/T Voltage (V), PV/T Electrical Efficiency (%) and PV/T Thermal Efficiency (%). The MLP based on the backpropagation algorithm using momentum learning function was used. The proposed ANN approach proved that using nanofluid/nano-PCM enhanced the electrical efficiency from 8.07% to 13.32% and its thermal efficiency reached 72%.
In [119] authors examined the feasibility of several ML techniques to forecast the energetic performance of a building-integrated PV/T (BIPV/T) collector. In particular, they tested the following techniques: multiple linear regression (MLR), MLP, RBF regressor, sequential minimal optimization improved support vector machine (SMO Improved), lazy.IBK, RF and random tree (RT). Moreover, it implements the performance evaluation criteria (PEC) to evaluate the system’s performance from the perspective of exergy. The results for the testing dataset showed the RF model is superior to other proposed models with an RMSE equal to 0.8153 compared with an RMSE of 18.9966 for MLR, 4.5751 for MLP, 8.9168 for RBF Regressor, 22.7223 for SMO Improved, 8.4233 for lazy.IBK and 2.115 for RT.
The prediction of thermal efficiency of PV/T setups is studied in [120], regarding input temperature, recirculation flow rate and solar irradiation by modifying MLP-ANN, ANFIS and least-squares SVM (LSSVM) approaches. An experimental dataset of 100 data points (empirical measurements performed on a fabricated water-cooled PV/T setup) has been used. Graphical and statistical methods were employed to determine the credibility of the proposed models in accurate prediction of the thermal efficiency. The proposed ANN model provided the best performance compared to ANFIS and LSSVM models due to the MSE and R2 values of 0.009 and 1.00, respectively.
In [121] ML methods of ANNs (MLP-ANN and RBF-ANN), LSSVM and ANFIS have been used for advancing prediction models for the thermal performance of a PV/T solar collector. As the input variables for the proposed models, authors have considered: inlet temperature, flow rate, heat, solar radiation and the sun heat. The electrical efficiency yield has been used as the output. The data set has been extracted through experimental measurements from a novel solar collector system. Results show that the proposed LSSVM model outperforms other models with an R2 equal to 0.987 and an MSE equal to 0.004. Further, in [121] the sensitivity analysis demonstrates that the water inlet temperature has the most significant relevancy factor and therefore it is the parameter that most affects the efficiency of the PV/T system.
Finally, in [122] a comparison study of prediction data system of PV/T output power by using ANN techniques considered published studies in data sets for the years 2008–2017. The results show that ANN models are the most suitable for the prediction of global solar radiation. The presented study offers a cheap and easy method for implementing PV models and choosing the desired location for providing good performance for the system. Several models were used to simulate and measure the production of energy in solar cells including ANN such as MLP, Bayesian NN (BNN), RNN (Recurrent NN), Generalized Feed-Forward (GFF), SVM, Self-organization feature map (SOFM) and LSTM. To obtain the most significant benefit from the best model, several mathematical coefficients have been adopted to determine the validity of accurate results such as MAPE, MSE, RMSE, MBE, Mean Percentage Error (MPE) and R2. The comparative study can clarify the best implementation method and address the scope of weakness in any of the proposed models based on the results of scientific verification and operation.
Furthermore, in [123,124] ML is used to improve the efficiency of control algorithms used in PV-storage systems. In particular, in [123] an algorithm using ML to effectively control PV-storage systems has been developed. The algorithm uses an offline policy planning stage and an online policy execution stage. In the planning stage, a suitable machine learning technique is used to generate models that map states (inputs) and decisions (outputs) using training data. In the execution stage, the model generated by the ML algorithm is then used to generate fast real-time decisions.
In [124] authors introduce a supervised ML approach to predict and schedule the real-time operation mode of the next operation interval for residential PV/battery systems controlled by mode-based controllers. The performance of the mode-based economic model-predictive control approach is used as the benchmark. The optimal operation mode for each control interval is first derived from the historical data used as the training set. Then, four ML algorithms (i.e., ANN, SVM, logistic regression and RF algorithms) are applied. Simulation results show that using the ML approach can effectively improve the performance of the mode-based control system and reduce the computation effort of local controllers because the training can be completed on a cloud-based ML engine.
8. Concluding Remarks and Future Trends
In this paper, a literature review of recent (from the year 2018 till 2021) applications of ML methods on many different fields of PV has been carried out. Fields touched within this discussion are forecasting of PV production, anomalies detection and fault analysis, tracking MPP, PV systems efficiency optimization, PV/T and CPV system design parameters optimization and efficiency improvement and energy management of PV storage systems. In almost all fields reported above, ML methods have proven to be an effective and reliable solution. The field of forecasting PV production is, by far, the most investigated one where many ML-based models have been proposed. Most research papers in this field are focused on point-forecast, though in the last several years some papers have also evaluated probabilistic forecasting that, in the authors’ opinion, is the most interesting as provide the additional prediction interval associated with point forecasting. Due to the rise of DL and to the availability of ML frameworks such as Tensorflow or Pytorch, to cite a few, many DL models, mainly based on LSTM architectures, have proven to provide state of the art accuracy. These LSTM architectures mostly use historical values of PV production as well as environmental features and some techniques of an analogue ensemble. For probabilistic forecasting, methods based on some variation of Quantile regressions are the most common. Regarding forecasting horizon, the short-term horizon, from one hour to few days, is the most investigated. In this field, some ensemble methods such as LGBM have shown promising results. Only a few papers have investigated techniques such as TF and AML, techniques that could be of great usefulness in future applications, especially thinking on real-time applications. Regarding anomalies detection and fault analysis, the reviewed models employ electrical features and/or images (usually IFR or EL). Typically, SNNs, mainly MLP, RBF and ELMs, are employed in the first case while, as could be expected, DNNs, mainly CNNs, are more common for the detection of permanently visible faults. The models tested in the FDD field employ for most cases a simulated dataset and the more frequent faults taken into consideration are short circuits and partial shading. Regarding the metrics used to evaluate models for FDD, only a few papers correctly employ a broader range of metrics (e.g., F1, balanced accuracy and MCC) apart from the common accuracy that is adequate only for a balanced dataset. Transfer Learning is a useful technique that probably will be more and more adopted in FDD, at least for models employing images as features. In this field it would be advisable to promote sharing of public datasets (a common repository for images related to faults in PV, IFR and EL images). Ensemble models such as RF have seen only a few applications in the field of FDD but seem very promising. For all fields here analyzed, and more generally for research papers, it would be desirable to promote reproducible research results using technologies based on containers as Docker.
Author Contributions
Conceptualization, all authors.; methodology, all authors; validation, all authors; investigation, C.V. and S.F.; data curation, C.V. and S.F; writing—original draft preparation, C.V. and S.F; writing—review and editing, all authors. All authors have read and agreed to the published version of the manuscript.
Funding
This research received no external funding.
Institutional Review Board Statement
Not applicable.
Informed Consent Statement
Not applicable.
Conflicts of Interest
The authors declare no conflict of interest.
Nomenclature
| AI | Artificial Intelligence |
| ABC | Artificial Bee Colony |
| ACO | Ant Colony Optimization |
| AD | Anomaly Detection |
| AM | Attention Mechanism |
| AML | Auto-ML |
| AnEn | Analog Ensemble |
| ANFIS | Adaptive Neuro-Fuzzy Inference Systems |
| ANN | Artificial Neural Networks |
| ARD | Automatic Relevance Determination |
| BE | Bagging Ensemble |
| BIPV/T | Building-integrated PV/T |
| BPNN | Backpropagation NN |
| BR | Bayesian Regression |
| BSM | Back-stepping Sliding Mode |
| BT | Bagged Tree |
| BTSMC | Backstep-ping terminal sliding mode control |
| CEEMD | Complementary Ensemble Empirical Mode Decomposition |
| CGSVM | coarse-Gaussian SVM |
| CI | Confidence Interval |
| CNN | Convolutional Neural Network |
| CPRS | Continuous Ranked Probability Score |
| CPV | Concentrating PV |
| DDPG | Deep Deterministic Policy Gradient |
| DELM | Deep Extreme LM |
| DIFPSO | Dynamic Factor PSO |
| DL | Deep Learning |
| DNN | Deep Neural learning/Network |
| DQN | Deep Q-network |
| DQR | Direct Quantile Regression |
| DT | Decision Tree |
| DWT | Discrete Wavelet Transform |
| ECBO | Enhanced Colliding Bodies Optimization |
| EI | Error Indicator |
| EL | Electroluminescence |
| ELM | Extreme Learning Machines |
| EM | Ensemble Methods |
| EMD | Empirical Mode Decomposition |
| E-MVFTS | Evolving Multivariate Fuzzy Time Series |
| FD | Fault Detection |
| FDD | Fault Detection and Diagnosis |
| FFNN | Feedforward Neural Network |
| FL | Fuzzy Logic |
| FLC | Fuzzy Logic Control |
| FNN | Fuzzy neural network |
| GA | Genetic Algorithm |
| GAN | Generative Adversarial Network |
| GFF | Generalized Feed-Forward |
| GLLR | Generalized Local Log-likelihood Ratio |
| GMPP | Global MPP |
| GPR | Gaussian Process Regression |
| GRNN | Generalized Regression Neural Network |
| GRU | Gated Recurrent Unit |
| HCPV | High CPV |
| HIF | High Impedance Fault |
| IFR | Infrared |
| IGIVA | Improved Grey Ideal Value Approximation |
| IMPP | Current at MPP |
| INC | Incremental Conductance |
| IR | Infrared |
| IRT | Infrared Thermography |
| IS | Isolation Forest |
| ISC | SC current |
| KDE | Kernel Density Estimation |
| KNN | k-Nearest Neighbour |
| LDA | Linear Discriminant Analysis |
| LG | Line to Ground fault |
| LL | Line-to-Line |
| LLG | Double Line to Ground fault |
| LLLG | Three-phase fault |
| LOF | Local Outlier Factor |
| LSSVM | Least-squares SVM |
| LSTM | Long short-term memory |
| MAE | Mean Absolute Error |
| MAPE | Mean Average Percentage Error |
| MCC | Matthews Correlation Coefficient |
| ME | Mean Error |
| ML | Machine Learning |
| MLP | Multilayer Perceptron |
| MLR | Multivariate Linear Regression |
| MPE | Mean Percentage Error |
| MPP | Maximum Power Point |
| MSE | Mean Square Error |
| MVFTS | Multivariate Fuzzy Time Series |
| NBC | Naïve Bayes classifier |
| NNQF | Nearest Neighbours Quantile Filter |
| NWP | Numerical Weather Prediction |
| OC | Open Circuit |
| P&O | Perturb and Observe |
| Probability Density Function | |
| PDPP | Partial Daily Pattern Prediction |
| PDPP | Partial Daily Pattern Prediction |
| PEC | Performance Evaluation Criteria |
| PI | Prediction Interval |
| PINAW | Prediction Interval Normalized Average Width |
| PS | Partial Shading |
| PSC | PS Conditions |
| PSO | Particle Swarm Optimization |
| PV/T | PV/Thermal |
| QCNN | Quantile CNN |
| QDA | Quadratic Discriminant Analysis |
| QELM | Quantile Extreme Learning Model |
| QESN | Quantile Echo State Network |
| QI1 | quality indicator |
| QN | Q-Network |
| QR | Quantile Regression |
| QRF | Quantile Regression Forest |
| RBF | Radial Basis Function |
| RF | Random Forest |
| RGAN | Recurrent Generative Adversarial Network |
| RL | Reinforcement Learning |
| RMSE | Root Mean Square Error |
| RMSQP | Root Mean Squared Percentage Error |
| RT | Random Tree |
| SC | Short Circuit |
| SI | Swarm Intelligence |
| SMBO | Sequential Model-Based Optimization |
| SMC | Sequential Monte–Carlo |
| SMO | Sequential Minimal Optimization |
| SNN | Shallow Neural Networks |
| SOFM | Self-organization feature map |
| SOL-LSTM | Share-Optimized-Layer LSTM |
| SVM | Support-Vector Machines |
| SVR | Support Vector Regression |
| TCM | Time Correlation Modification |
| TCM | Time Correlation Modification model |
| TEDA | Typicality and Eccentricity Data Analytics |
| TEDA | Typicality and Eccentricity Data Analytics |
| TL | Transfer Learning |
| TRL | Transfer Reinforcement Learning |
| TS-SOM | Tree-Structured Self-Organized Map |
| UAV | Unmanned Aerial Vehicle |
| VMD | Variational Mode Decomposition |
| VMPP | Voltage at MPP |
| VOC | OC voltage |
| WK-NN | Weighted K-Nearest Neighbors |
| WPD | Wavelet Packet Decomposition |
| WPT | Wavelets Packet Transform |
| WT | Wavelet Transform |
| Greek symbols | |
| σ | Standard Deviation error |
| η | Overall power tracking efficiency |
References
- Mottaqi, M.S.; Mohammadipanah, F.; Sajedi, H. Contribution of machine learning approaches in response to SARS-CoV-2 infection. Inform. Med. Unlocked 2021, 23, 100526. [Google Scholar] [CrossRef] [PubMed]
- Alfred, R.; Obit, J.H. The roles of machine learning methods in limiting the spread of deadly diseases: A systematic review. Heliyon 2021, 7, e07371. [Google Scholar] [CrossRef] [PubMed]
- Buchlak, Q.D.; Esmaili, N.; Leveque, J.C.; Bennett, C.; Farrokhi, F.; Piccardi, M. Machine learning applications to neuroimaging for glioma detection and classification: An artificial intelligence augmented systematic review. J. Clin. Neurosci. 2021, 89, 177–198. [Google Scholar] [CrossRef] [PubMed]
- Adlung, L.; Cohen, Y.; Mor, U.; Elinav, E. Machine learning in clinical decision making. Med 2021, 2, 642–665. [Google Scholar] [CrossRef]
- Chatterjee, J.; Dethlefs, N. Scientometric review of artificial intelligence for operations & maintenance of wind turbines: The past, present and future. Renew. Sustain. Energy Rev. 2021, 144, 111051. [Google Scholar]
- Betti, A.; Tucci, M.; Crisostomi, E.; Piazzi, A.; Barmada, S.; Thomopulos, D. Fault prediction and early-detection in large pv power plants based on self-organizing maps. Sensors 2021, 21, 1687. [Google Scholar] [CrossRef]
- Yılmaz, B.; Yıldırım, R. Critical review of machine learning applications in perovskite solar research. Nano Energy 2021, 80, 105546. [Google Scholar] [CrossRef]
- Ibrahim, K.S.M.H.; Huang, Y.F.; Ahmed, A.N.; Koo, C.H.; El-Shafie, A. A review of the hybrid artificial intelligence and optimization modelling of hydrological streamflow forecasting. Alex. Eng. J. 2021. [Google Scholar] [CrossRef]
- Liu, C.; Zhang, X.; Mei, S.; Liu, F. Local-pattern-aware forecast of regional wind power: Adaptive partition and long-short-term matching. Energy Convers. Manag. 2021, 231, 113799. [Google Scholar] [CrossRef]
- Aslam, S.; Herodotou, H.; Mohsin, S.M.; Javaid, N.; Ashraf, N.; Aslam, S. A survey on deep learning methods for power load and renewable energy forecasting in smart microgrids. Renew. Sustain. Energy Rev. 2021, 144, 110992. [Google Scholar] [CrossRef]
- Lissa, P.; Deane, C.; Schukat, M.; Seri, F.; Keane, M.; Barrett, E. Deep reinforcement learning for home energy management system control. Energy AI 2021, 3, 100043. [Google Scholar] [CrossRef]
- Babar, M.; Tariq, M.U.; Jan, M.A. Secure and resilient demand side management engine using machine learning for IoT-enabled smart grid. Sustain. Cities Soc. 2020, 62, 102370. [Google Scholar] [CrossRef]
- International Energy Agency (IEA). Energy efficiency and digitalisation. Available online: https://www.iea.org/articles/energy-efficiency-and-digitalisation (accessed on 12 August 2021).
- IBM. AI vs. Machine Learning vs. Deep Learning vs. Neural Networks: What’s the Difference? Available online: https://www.ibm.com/cloud/blog/ai-vs-machine-learning-vs-deep-learning-vs-neural-networks (accessed on 5 July 2021).
- Dong, S.; Zhao, P.; Lin, X.; Kaeli, D. Exploring GPU acceleration of Deep Neural Networks using Block Circulant Matrices. Parallel Comput. 2020, 100, 102701. [Google Scholar] [CrossRef]
- Kingma, D.P.; Ba, J.L. Adam: A method for stochastic optimization. In Proceedings of the 3rd International Conference on Learning Representations, ICLR 2015, San Diego, CA, USA, 7–9 May 2015; pp. 1–15. [Google Scholar]
- Butcher, B.; Smith, B.J. Feature Engineering and Selection: A Practical Approach for Predictive Models. Am. Stat. 2020, 74, 308–309. [Google Scholar] [CrossRef]
- Liu, L.; Zhao, Y.; Wang, Y.; Sun, Q.; Wennersten, R. A weight-varying ensemble method for short-term forecasting PV power output. Energy Procedia 2019, 158, 661–668. [Google Scholar] [CrossRef]
- Radhakrishnan, P.; Ramaiyan, K.; Vinayagam, A.; Veerasamy, V. A stacking ensemble classification model for detection and classification of power quality disturbances in PV integrated power network. Meas. J. Int. Meas. Confed. 2021, 175, 109025. [Google Scholar] [CrossRef]
- Kapucu, C.; Cubukcu, M. A supervised ensemble learning method for fault diagnosis in photovoltaic strings. Energy 2021, 227, 120463. [Google Scholar] [CrossRef]
- Das, U.K.; Tey, K.S.; Seyedmahmoudian, M.; Mekhilef, S.; Idris, M.Y.I.; Van Deventer, W.; Horan, B.; Stojcevski, A. Forecasting of photovoltaic power generation and model optimization: A review. Renew. Sustain. Energy Rev. 2018, 81, 912–928. [Google Scholar] [CrossRef]
- Wang, H.; Liu, Y.; Zhou, B.; Li, C.; Cao, G.; Voropai, N.; Barakhtenko, E. Taxonomy research of artificial intelligence for deterministic solar power forecasting. Energy Convers. Manag. 2020, 214, 112909. [Google Scholar] [CrossRef]
- Wang, H.; Lei, Z.; Zhang, X.; Zhou, B.; Peng, J. A review of deep learning for renewable energy forecasting. Energy Convers. Manag. 2019, 198, 111799. [Google Scholar] [CrossRef]
- Mellit, A.; Massi Pavan, A.; Ogliari, E.; Leva, S.; Lughi, V. Advanced Methods for Photovoltaic Output Power Forecasting: A Review. Appl. Sci. 2020, 10, 487. [Google Scholar] [CrossRef] [Green Version]
- Carrera, B.; Kim, K. Comparison Analysis of Machine Learning Techniques for Photovoltaic Prediction Using Weather Sensor Data. Sensors 2020, 20, 3129. [Google Scholar] [CrossRef]
- Rajagukguk, R.A.; Ramadhan, R.A.A.; Lee, H.-J. A Review on Deep Learning Models for Forecasting Time Series Data of Solar Irradiance and Photovoltaic Power. Energies 2020, 13, 6623. [Google Scholar] [CrossRef]
- Yang, T.; Zhao, L.; Li, W.; Zomaya, A.Y. Reinforcement learning in sustainable energy and electric systems: A survey. Annu. Rev. Control 2020, 49, 145–163. [Google Scholar] [CrossRef]
- Zhang, J.; Florita, A.; Hodge, B.-M.; Lu, S.; Hamann, H.F.; Banunarayanan, V.; Brockway, A.M. A suite of metrics for assessing the performance of solar power forecasting. Sol. Energy 2015, 111, 157–175. [Google Scholar] [CrossRef] [Green Version]
- Jensen, T.L.; Fowler, T.L.; Brown, B.G.; Lazo, J.K.; Haupt, S.E. Metrics for Evaluation of Solar Energy Forecasts | OpenSky. Available online: https://opensky.ucar.edu/islandora/object/technotes:538 (accessed on 22 April 2021).
- Alkhayat, G.; Mehmood, R. A review and taxonomy of wind and solar energy forecasting methods based on deep learning. Energy AI 2021, 4, 100060. [Google Scholar] [CrossRef]
- Li, Q.; Zhang, X.; Ma, T.; Jiao, C.; Wang, H.; Hu, W. A multi-step ahead photovoltaic power prediction model based on similar day, enhanced colliding bodies optimization, variational mode decomposition, and deep extreme learning machine. Energy 2021, 224, 120094. [Google Scholar] [CrossRef]
- Zhao, W.; Zhang, H.; Zheng, J.; Dai, Y.; Huang, L.; Shang, W.; Liang, Y. A point prediction method based automatic machine learning for day-ahead power output of multi-region photovoltaic plants. Energy 2021, 223, 120026. [Google Scholar] [CrossRef]
- Ding, S.; Li, R.; Tao, Z. A novel adaptive discrete grey model with time-varying parameters for long-term photovoltaic power generation forecasting. Energy Convers. Manag. 2021, 227, 113644. [Google Scholar] [CrossRef]
- Kayacan, E.; Ulutas, B.; Kaynak, O. Grey system theory-based models in time series prediction. Expert Syst. Appl. 2010, 37, 1784–1789. [Google Scholar] [CrossRef]
- Severiano, C.A.; de Lima e Silva, P.C.; Weiss Cohen, M.; Guimarães, F.G. Evolving fuzzy time series for spatio-temporal forecasting in renewable energy systems. Renew. Energy 2021, 171, 764–783. [Google Scholar] [CrossRef]
- Li, P.; Zhou, K.; Lu, X.; Yang, S. A hybrid deep learning model for short-term PV power forecasting. Appl. Energy 2020, 259, 114216. [Google Scholar] [CrossRef]
- Wang, F.; Xuan, Z.; Zhen, Z.; Li, K.; Wang, T.; Shi, M. A day-ahead PV power forecasting method based on LSTM-RNN model and time correlation modification under partial daily pattern prediction framework. Energy Convers. Manag. 2020, 212, 112766. [Google Scholar] [CrossRef]
- Zhou, S.; Zhou, L.; Mao, M.; Xi, X. Transfer learning for photovoltaic power forecasting with long short-term memory neural network. In Proceedings of the 2020 IEEE International Conference on Big Data and Smart Computing, BigComp 2020, Busan, Korea, 19–22 February 2020; pp. 125–132. [Google Scholar]
- Chang, X.; Li, W.; Zomaya, A.Y. A Lightweight Short-term Photovoltaic Power Prediction for Edge Computing. IEEE Trans. Green Commun. Netw. 2020, 4, 946–955. [Google Scholar] [CrossRef]
- Niu, D.; Wang, K.; Sun, L.; Wu, J.; Xu, X. Short-term photovoltaic power generation forecasting based on random forest feature selection and CEEMD: A case study. Appl. Soft Comput. J. 2020, 93, 106389. [Google Scholar] [CrossRef]
- Zhou, H.; Zhang, Y.; Yang, L.; Liu, Q.; Yan, K.; Du, Y. Short-Term photovoltaic power forecasting based on long short term memory neural network and attention mechanism. IEEE Access 2019, 7, 78063–78074. [Google Scholar] [CrossRef]
- Pan, C.; Tan, J. Day-Ahead Hourly Forecasting of Solar Generation Based on Cluster Analysis and Ensemble Model. IEEE Access 2019, 7, 112921–112930. [Google Scholar] [CrossRef]
- Fekri, M.N.; Ghosh, A.M.; Grolinger, K. Generating Energy Data for Machine Learning with Recurrent Generative Adversarial Networks. Energies 2019, 13, 130. [Google Scholar] [CrossRef] [Green Version]
- Makridakis, S.; Spiliotis, E.; Assimakopoulos, V. The M4 Competition: Results, findings, conclusion and way forward. Int. J. Forecast. 2018, 34, 802–808. [Google Scholar] [CrossRef]
- Hong, T.; Pinson, P.; Fan, S.; Zareipour, H.; Troccoli, A.; Hyndman, R.J. Probabilistic energy forecasting: Global Energy Forecasting Competition 2014 and beyond. Int. J. Forecast. 2016, 32, 896–913. [Google Scholar] [CrossRef] [Green Version]
- Hyndman, R.J. A brief history of forecasting competitions. Int. J. Forecast. 2020, 36, 7–14. [Google Scholar] [CrossRef]
- du Plessis, A.A.; Strauss, J.M.; Rix, A.J. Short-term solar power forecasting: Investigating the ability of deep learning models to capture low-level utility-scale Photovoltaic system behaviour. Appl. Energy 2021, 285, 116395. [Google Scholar] [CrossRef]
- The Difference between Prediction Intervals and Confidence Intervals | Rob J Hyndman. Available online: https://robjhyndman.com/hyndsight/intervals/ (accessed on 28 April 2021).
- Prediction Intervals too Narrow|Rob J Hyndman. Available online: https://robjhyndman.com/hyndsight/narrow-pi/ (accessed on 28 April 2021).
- Najibi, F.; Apostolopoulou, D.; Alonso, E. Enhanced performance Gaussian process regression for probabilistic short-term solar output forecast. Int. J. Electr. Power Energy Syst. 2021, 130, 106916. [Google Scholar] [CrossRef]
- Huang, Q.; Wei, S. Improved quantile convolutional neural network with two-stage training for daily-ahead probabilistic forecasting of photovoltaic power. Energy Convers. Manag. 2020, 220, 113085. [Google Scholar] [CrossRef]
- Wen, Y.; AlHakeem, D.; Mandal, P.; Chakraborty, S.; Wu, Y.K.; Senjyu, T.; Paudyal, S.; Tseng, T.L. Performance Evaluation of Probabilistic Methods Based on Bootstrap and Quantile Regression to Quantify PV Power Point Forecast Uncertainty. IEEE Trans. Neural Networks Learn. Syst. 2020, 31, 1134–1144. [Google Scholar] [CrossRef]
- Carriere, T.; Vernay, C.; Pitaval, S.; Kariniotakis, G. A Novel Approach for Seamless Probabilistic Photovoltaic Power Forecasting Covering Multiple Time Frames. IEEE Trans. Smart Grid 2020, 11, 2281–2292. [Google Scholar] [CrossRef] [Green Version]
- Monache, L.D.; Anthony Eckel, F.; Rife, D.L.; Nagarajan, B.; Searight, K. Probabilistic weather prediction with an analog ensemble. Mon. Weather Rev. 2013, 141, 3498–3516. [Google Scholar] [CrossRef] [Green Version]
- González Ordiano, J.Á.; Gröll, L.; Mikut, R.; Hagenmeyer, V. Probabilistic energy forecasting using the nearest neighbors quantile filter and quantile regression. Int. J. Forecast. 2020, 36, 310–323. [Google Scholar] [CrossRef] [Green Version]
- Hossain, M.S.; Mahmood, H. Short-Term Photovoltaic Power Forecasting Using an LSTM Neural Network and Synthetic Weather Forecast. IEEE Access 2020, 8. [Google Scholar] [CrossRef]
- Firth, S.K.; Lomas, K.J.; Rees, S.J. A simple model of PV system performance and its use in fault detection. Sol. Energy 2010, 84, 624–635. [Google Scholar] [CrossRef] [Green Version]
- Jeni, L.A.; Cohn, J.F.; De La Torre, F. Facing imbalanced data—Recommendations for the use of performance metrics. In Proceedings of the 2013 Humaine Association Conference on Affective Computing and Intelligent Interaction, ACII 2013, Geneva, Switzerland, 2–5 September 2013; pp. 245–251. [Google Scholar]
- Warrens, M.J. Five Ways to Look at Cohen’s Kappa. J. Psychol. Psychother. 2015, 5, 1. [Google Scholar] [CrossRef] [Green Version]
- Zhu, Q. On the performance of Matthews correlation coefficient (MCC) for imbalanced dataset. Pattern Recognit. Lett. 2020, 136, 71–80. [Google Scholar] [CrossRef]
- Mellit, A.; Tina, G.M.; Kalogirou, S.A. Fault detection and diagnosis methods for photovoltaic systems: A review. Renew. Sustain. Energy Rev. 2018, 91, 1–17. [Google Scholar] [CrossRef]
- Pillai, D.S.; Rajasekar, N. A comprehensive review on protection challenges and fault diagnosis in PV systems. Renew. Sustain. Energy Rev. 2018, 91, 18–40. [Google Scholar] [CrossRef]
- Mellit, A.; Kalogirou, S. Artificial intelligence and internet of things to improve efficacy of diagnosis and remote sensing of solar photovoltaic systems: Challenges, recommendations and future directions. Renew. Sustain. Energy Rev. 2021, 143, 110889. [Google Scholar] [CrossRef]
- Li, B.; Delpha, C.; Diallo, D.; Migan-Dubois, A. Application of Artificial Neural Networks to photovoltaic fault detection and diagnosis: A review. Renew. Sustain. Energy Rev. 2021, 138, 110512. [Google Scholar] [CrossRef]
- Appiah, A.Y.; Zhang, X.; Ayawli, B.B.K.; Kyeremeh, F. Review and performance evaluation of photovoltaic array fault detection and diagnosis techniques. Int. J. Photoenergy 2019, 2019. [Google Scholar] [CrossRef]
- Livera, A.; Theristis, M.; Makrides, G.; Georghiou, G.E. Recent advances in failure diagnosis techniques based on performance data analysis for grid-connected photovoltaic systems. Renew. Energy 2019, 133, 126–143. [Google Scholar] [CrossRef]
- Triki-Lahiani, A.; Bennani-Ben Abdelghani, A.; Slama-Belkhodja, I. Fault detection and monitoring systems for photovoltaic installations: A review. Renew. Sustain. Energy Rev. 2018, 82, 2680–2692. [Google Scholar] [CrossRef]
- Ali, M.U.; Khan, H.F.; Masud, M.; Kallu, K.D.; Zafar, A. A machine learning framework to identify the hotspot in photovoltaic module using infrared thermography. Sol. Energy 2020, 208, 643–651. [Google Scholar] [CrossRef]
- Veerasamy, V.; Wahab, N.I.A.; Othman, M.L.; Padmanaban, S.; Sekar, K.; Ramachandran, R.; Hizam, H.; Vinayagam, A.; Islam, M.Z. LSTM Recurrent Neural Network Classifier for High Impedance Fault Detection in Solar PV Integrated Power System. IEEE Access 2021, 9, 32672–32687. [Google Scholar] [CrossRef]
- Eskandari, A.; Milimonfared, J.; Aghaei, M.; Reinders, A.H.M.E. Autonomous Monitoring of Line-to-Line Faults in Photovoltaic Systems by Feature Selection and Parameter Optimization of Support Vector Machine Using Genetic Algorithms. Appl. Sci. 2020, 10, 5527. [Google Scholar] [CrossRef]
- Dhibi, K.; Fezai, R.; Mansouri, M.; Trabelsi, M.; Kouadri, A.; Bouzara, K.; Nounou, H.; Nounou, M. Reduced Kernel Random Forest Technique for Fault Detection and Classification in Grid-Tied PV Systems. IEEE J. Photovolt. 2020, 1–8. [Google Scholar] [CrossRef]
- Aziz, F.; Ul Haq, A.; Ahmad, S.; Mahmoud, Y.; Jalal, M.; Ali, U. A Novel Convolutional Neural Network-Based Approach for Fault Classification in Photovoltaic Arrays. IEEE Access 2020, 8, 41889–41904. [Google Scholar] [CrossRef]
- Zhao, Y.; Liu, Q.; Li, D.; Kang, D.; Lv, Q.; Shang, L. Hierarchical anomaly detection and multimodal classification in large-scale photovoltaic systems. IEEE Trans. Sustain. Energy 2019, 10, 1351–1361. [Google Scholar] [CrossRef]
- Lu, S.; Sirojan, T.; Phung, B.T.; Zhang, D.; Ambikairajah, E. DA-DCGAN: An Effective Methodology for DC Series Arc Fault Diagnosis in Photovoltaic Systems. IEEE Access 2019, 7, 45831–45840. [Google Scholar] [CrossRef]
- Chen, Z.; Han, F.; Wu, L.; Yu, J.; Cheng, S.; Lin, P.; Chen, H. Random forest based intelligent fault diagnosis for PV arrays using array voltage and string currents. Energy Convers. Manag. 2018, 178, 250–264. [Google Scholar] [CrossRef]
- Takruri, M.; Farhat, M.; Barambones, O.; Ramos-Hernanz, J.A.; Turkieh, M.J.; Badawi, M.; AlZoubi, H.; Sakur, M.A. Maximum power point tracking of PV system based on machine learning. Energies 2020, 13, 692. [Google Scholar] [CrossRef] [Green Version]
- Kalogerakis, C.; Koutroulis, E.; Lagoudakis, M.G. Global MPPT based on machine-learning for PV arrays operating under partial shading conditions. Appl. Sci. 2020, 10, 700. [Google Scholar] [CrossRef] [Green Version]
- Kuan-Yu Chou, S.-T.Y.; Chen, Y.-P. Maximum Power Point Tracking of Photovoltaic System Based on Reinforcement Learning. Sensors 2019, 19, 1316. [Google Scholar] [CrossRef] [Green Version]
- Díaz Martínez, D.; Trujillo Codorniu, R.; Giral, R.; Vázquez Seisdedos, L. Evaluation of particle swarm optimization techniques applied to maximum power point tracking in photovoltaic systems. Int. J. Circuit Theory Appl. 2021, 1–19. [Google Scholar] [CrossRef]
- Sarvi, M.; Azadian, A. A Comprehensive Review and Classified Comparison of MPPT Algorithms in PV Systems; Springer: Berlin/Heidelberg, Germany, 2021; ISBN 1266702100427. [Google Scholar]
- Wani, T.A.; Channi, H.K. A Review of Fuzzy Logic and Artificial Neural Network Technologies Used for MPPT. Turkish J. Comput. Math. Educ. 2021, 12, 2912–2918. [Google Scholar] [CrossRef]
- Bollipo, R.B.; Mikkili, S.; Bonthagorla, P.K. Hybrid, optimal, intelligent and classical PV MPPT techniques: A review. CSEE J. Power Energy Syst. 2021, 7, 9–33. [Google Scholar] [CrossRef]
- Manisha; Gaur, P. The Survey of MPPT under non-uniform atmospheric conditions for the Photovoltaic Generation Systems. Int. J. Inf. Technol. 2021, 13, 767–776. [Google Scholar] [CrossRef]
- Pilakkat, D.; Kanthalakshmi, S.; Navaneethan, S. A Comprehensive Review of Swarm Optimization Algorithms for MPPT Control of PV Systems under Partially Shaded Conditions. Electronics 2020, 24, 3–14. [Google Scholar] [CrossRef]
- Yap, K.Y.; Sarimuthu, C.R.; Lim, J.M.Y. Artificial Intelligence Based MPPT Techniques for Solar Power System: A review. J. Mod. Power Syst. Clean Energy 2020, 8, 1043–1059. [Google Scholar] [CrossRef]
- Bollipo, R.B.; Mikkili, S.; Bonthagorla, P.K. Critical Review on PV MPPT Techniques: Classical, Intelligent and Optimisation. IET Renew. Power Gener. 2020, 14, 1433–1452. [Google Scholar] [CrossRef]
- Mao, M.; Cui, L.; Zhang, Q.; Guo, K.; Zhou, L.; Huang, H. Classification and summarization of solar photovoltaic MPPT techniques: A review based on traditional and intelligent control strategies. Energy Rep. 2020, 6, 1312–1327. [Google Scholar] [CrossRef]
- Motahhir, S.; El Hammoumi, A.; El Ghzizal, A. The most used MPPT algorithms: Review and the suitable low-cost embedded board for each algorithm. J. Clean. Prod. 2020, 246, 118983. [Google Scholar] [CrossRef]
- Podder, A.K.; Roy, N.K.; Pota, H.R. MPPT methods for solar PV systems: A critical review based on tracking nature. IET Renew. Power Gener. 2019, 13, 1615–1632. [Google Scholar] [CrossRef]
- Belhachat, F.; Larbes, C. A review of global maximum power point tracking techniques of photovoltaic system under partial shading conditions. Renew. Sustain. Energy Rev. 2018, 92, 513–553. [Google Scholar] [CrossRef]
- Bendib, B.; Belmili, H.; Krim, F. A survey of the most used MPPT methods: Conventional and advanced algorithms applied for photovoltaic systems. Renew. Sustain. Energy Rev. 2015, 45, 637–648. [Google Scholar] [CrossRef]
- Chen, L.; Wang, X. Enhanced MPPT method based on ANN-assisted sequential Monte–Carlo and quickest change detection. IET Smart Grid 2019, 2, 635–644. [Google Scholar] [CrossRef]
- Thamizhselvan, T.; Seyezhai, R.; Premkumar, K. Maximum power point tracking algorithm for photovoltaic system using supervised online coactive neuro fuzzy inference system. J. Electr. Eng. 2017, 17, 270–286. [Google Scholar]
- Hameed, W.I.; Saleh, A.L.; Sawadi, B.A.; Al-Yasir, Y.I.A.; Abd-Alhameed, R.A. Maximum power point tracking for photovoltaic system by using fuzzy neural network. Inventions 2019, 4, 33. [Google Scholar] [CrossRef] [Green Version]
- Farzaneh, J. A hybrid modified FA-ANFIS-P&O approach for MPPT in photovoltaic systems under PSCs. Int. J. Electron. 2020, 107, 703–718. [Google Scholar] [CrossRef]
- Shareef, H.; Mutlag, A.H.; Mohamed, A. Random Forest-Based Approach for Maximum Power Point Tracking of Photovoltaic Systems Operating under Actual Environmental Conditions. Comput. Intell. Neurosci. 2017, 2017. [Google Scholar] [CrossRef]
- Satapathy, P.; Dhar, S.; Dash, P.K. An evolutionary online sequential extreme learning machine for maximum power point tracking and control in multi-photovoltaic microgrid system. Renew. Energy Focus 2017, 21, 33–53. [Google Scholar] [CrossRef]
- Keyrouz, F. Enhanced Bayesian Based MPPT Controller for PV Systems. IEEE Power Energy Technol. Syst. J. 2018, 5, 11–17. [Google Scholar] [CrossRef]
- Rizzo, S.A.; Salerno, N.; Scelba, G.; Sciacca, A. Enhanced hybrid global MPPT algorithm for PV systems operating under fast-changing partial shading conditions. Int. J. Renew. Energy Res. 2018, 8, 221–229. [Google Scholar]
- Du, Y.; Yan, K.; Ren, Z.; Xiao, W. Designing localized MPPT for PV systems using fuzzy-weighted extreme learning machine. Energies 2018, 11, 2615. [Google Scholar] [CrossRef] [Green Version]
- Assahout, S.; Elaissaoui, H.; El Ougli, A.; Tidhaf, B.; Zrouri, H. A Neural Network and Fuzzy Logic based MPPT Algorithm for Photovoltaic Pumping System. Int. J. Power Electron. Drive Syst. 2018, 9, 1823. [Google Scholar] [CrossRef]
- Viloria-Porto, J.; Robles-Algarín, C.; Restrepo-Leal, D. A novel approach for an MPPT controller based on the ADALine network trained with the RTRL algorithm. Energies 2018, 11, 3407. [Google Scholar] [CrossRef] [Green Version]
- Farayola, A.M.; Hasan, A.N.; Ali, A. Efficient photovoltaic mppt system using coarse gaussian support vector machine and artificial neural network techniques. Int. J. Innov. Comput. Inf. Control 2018, 14, 323–339. [Google Scholar] [CrossRef]
- Ding, M.; Lv, D.; Yang, C.; Li, S.; Fang, Q.; Yang, B.; Zhang, X. Global Maximum Power Point Tracking of PV Systems under Partial Shading Condition: A Transfer Reinforcement Learning Approach. Appl. Sci. 2019, 9, 2769. [Google Scholar] [CrossRef] [Green Version]
- Boudaraia, K.; Mahmoudi, H.; Abbou, A. MPPT design using artificial neural network and backstepping sliding mode approach for photovoltaic system under various weather conditions. Int. J. Intell. Eng. Syst. 2019, 12, 177–186. [Google Scholar] [CrossRef]
- Harrag, A.; Messalti, S. IC-based variable step size neuro-fuzzy MPPT Improving PV system performances. Energy Procedia 2019, 157, 362–374. [Google Scholar] [CrossRef]
- Divyasharon, R.; Narmatha Banu, R.; Devaraj, D. Artificial Neural Network based MPPT with CUK Converter Topology for PV Systems under Varying Climatic Conditions. In Proceedings of the 2019 IEEE International Conference on Intelligent Techniques in Control, Optimization and Signal Processing (INCOS), Tamilnadu, India, 11–13 April 2019. [Google Scholar] [CrossRef]
- Phan, B.C.; Lai, Y.C.; Lin, C.E. A Deep Reinforcement Learning-Based MPPT Control for PV Systems under Partial Shading Condition. Sensors 2020, 20, 3039. [Google Scholar] [CrossRef]
- Zečevič, Ž.; Rolevski, M. Neural network approach to MPPT control and irradiance estimation. Appl. Sci. 2020, 10, 5051. [Google Scholar] [CrossRef]
- Nkambule, M.S.; Hasan, A.N.; Ali, A.; Hong, J.; Geem, Z.W. Comprehensive Evaluation of Machine Learning MPPT Algorithms for a PV System Under Different Weather Conditions. J. Electr. Eng. Technol. 2020, 16, 411–427. [Google Scholar] [CrossRef]
- Farah, L.; Haddouche, A.; Haddouche, A. Comparison between proposed fuzzy logic and anfis for MPPT control for photovoltaic system. Int. J. Power Electron. Drive Syst. 2020, 11, 1065–1073. [Google Scholar] [CrossRef]
- Rizzo, S.A.; Scelba, G. A hybrid global MPPT searching method for fast variable shading conditions. J. Clean. Prod. 2021, 298, 126775. [Google Scholar] [CrossRef]
- Ali, M.N.; Mahmoud, K.; Lehtonen, M.; Darwish, M.M.F. Promising mppt methods combining metaheuristic, fuzzy-logic and ann techniques for grid-connected photovoltaic. Sensors 2021, 21, 1244. [Google Scholar] [CrossRef]
- Khan, Z.A.; Khan, L.; Ahmad, S.; Mumtaz, S.; Jafar, M.; Khan, Q. RBF neural network based backstepping terminal sliding mode MPPT control technique for PV system. PLoS ONE 2021, 16, e0249705. [Google Scholar] [CrossRef]
- Renno, C.; Petito, F. Triple-junction cell temperature evaluation in a CPV system by means of a Random-Forest model. Energy Convers. Manag. 2018, 169, 124–136. [Google Scholar] [CrossRef]
- Ağbulut, Ü.; Gürel, A.E.; Ergün, A.; Ceylan, İ. Performance assessment of a V-Trough photovoltaic system and prediction of power output with different machine learning algorithms. J. Clean. Prod. 2020, 268, 122269. [Google Scholar] [CrossRef]
- Anaty, M.K.; Alamin, Y.I.; Bouziane, K.; Garcia, M.P.; Yaagoubi, R.; Hervas, J.D.A.; Belkasmi, M.; Aggour, M. Output power estimation of high concentrator photovoltaic using radial basis function neural network. In Proceedings of the 2018 6th International Renewable and Sustainable Energy Conference (IRSEC), Rabat, Morocco, 5–8 December 2018. [Google Scholar] [CrossRef]
- Al-Waeli, A.H.A.; Sopian, K.; Yousif, J.H.; Kazem, H.A.; Boland, J.; Chaichan, M.T. Artificial neural network modeling and analysis of photovoltaic/thermal system based on the experimental study. Energy Convers. Manag. 2019, 186, 368–379. [Google Scholar] [CrossRef]
- Shahsavar, A.; Moayedi, H.; Al-Waeli, A.H.A.; Sopian, K.; Chelvanathan, P. Machine learning predictive models for optimal design of building-integrated photovoltaic-thermal collectors. Int. J. Energy Res. 2020, 44, 5675–5695. [Google Scholar] [CrossRef]
- Zamen, M.; Baghban, A.; Pourkiaei, S.M.; Ahmadi, M.H. Optimization methods using artificial intelligence algorithms to estimate thermal efficiency of PV/T system. Energy Sci. Eng. 2019, 7, 821–834. [Google Scholar] [CrossRef] [Green Version]
- Ahmadi, M.H.; Baghban, A.; Sadeghzadeh, M.; Zamen, M.; Mosavi, A.; Shamshirband, S.; Kumar, R.; Mohammadi-Khanaposhtani, M. Evaluation of electrical efficiency of photovoltaic thermal solar collector. Eng. Appl. Comput. Fluid Mech. 2020, 14, 545–565. [Google Scholar] [CrossRef] [Green Version]
- Yousif, J.H.; Kazem, H.A.; Alattar, N.N.; Elhassan, I.I. A comparison study based on artificial neural network for assessing PV/T solar energy production. Case Stud. Therm. Eng. 2019, 13, 100407. [Google Scholar] [CrossRef]
- Keerthisinghe, C.; Chapman, A.C.; Verbič, G. Energy Management of PV-Storage Systems: Policy Approximations Using Machine Learning. IEEE Trans. Ind. Informatics 2019, 15, 257–265. [Google Scholar] [CrossRef]
- Henri, G.; Lu, N. A Supervised Machine Learning Approach to Control Energy Storage Devices. IEEE Trans. Smart Grid 2019, 10, 5910–5919. [Google Scholar] [CrossRef]
Figure 1.
Bias vs. variance trade-off.

Figure 2.
An example of the power-voltage characteristic of a photovoltaic (PV) array under partial shading conditions [77].
Figure 2.
An example of the power-voltage characteristic of a photovoltaic (PV) array under partial shading conditions [77].

Table 1.
Review papers in forecasting power PV production. Publication year considered: 2018–2021.
| Year | Reference | Notes |
|---|---|---|
| 2018 | [21] | A review of ML and statistical models based on historical data. Concludes that ANNs and Support-Vector Machines (SVMs) are the best-performing models, especially due to their capability to rapidly adapt to varying environmental conditions. Genetic Algorithms (GAs) result as the most frequently used method in optimizing forecasting models’ hyper parameters. |
| 2019 | [22] | A very interesting review, from the taxonomy point of view, of AI-based methods in solar power forecasting. Methods analyzed include ANNs, SVMs, Extreme Learning Machines (ELMs), Recurrent Neural Networks (RNNs), Long short-term memory (LSTM), RF, stacked Auto-Encoders, Generative Adversarial Networks (GANs), Fuzzy Logic (FL), Particle Swarm Optimization (PSO) and others. For each method is indicated their pros & cons and optimal field of application. This paper outlines challenges and future research directions, mainly: probabilistic prediction of solar energy, model explainability and prediction of the movement and thickness of clouds. |
| 2019 | [23] | A review focused only on DL methods for renewable energy forecasting, both deterministic and probabilistic (deep belief network, stack auto-encoder, deep recurrent neural network, etc.) Forecasting horizon from 15 min ahead to 120 min ahead. Some notes on data preprocessing techniques |
| 2020 | [24] | A comprehensive review of papers from 2008 till 2019 on ML, DL and hybrid models to forecast power production from PV. Interesting concluding remarks. Mainly focused on methods for point forecasting. |
| 2020 | [25] | A comparison of state-of-the-art models to forecast PV power production focused on a horizon of 36 h in advance. Many models tested from simple linear regression (also Ridge, Lasso and Elastic Net), to the DT and ensemble models, both bagging (RF) and boosting (eXtreme Gradient Boosting). Robust 10-Fold Cross-Validation procedure to test each model’s performance and grid search to find each model’s optimal hyperparameters. All models were tested on a single dataset (plant located in Asia). Weather forecast and observations were used as model input. XGBoosting performed best. |
| 2020 | [26] | A review focused only on three DL methods; LSTM, RNN, Gated Recurrent Unit (GRU) and a hybrid Convolutional Neural Network + LSTM (CNN+LSTM) to forecast solar irradiance and PV power production. Generally, LSTM performs overall the best but if enough data is available CNN+LSTM is the preferred model to choose. This paper highlights the use of RMSE as the most useful metric, allowing easy comparison of results. |
| 2020 | [27] | A review of various reinforcement learning methods, both classical (multi-agent RL, etc.) and deep (Deep Q-network, etc.) in sustainable energy and electric systems. It is a more generic review not focused on PV but with a paragraph on MPPT worth reading to a general overview of RL. |
Table 4.
Review papers for fault/anomaly detection and diagnosis in PV. Publication year considered: 2018–2021.
Table 4.
Review papers for fault/anomaly detection and diagnosis in PV. Publication year considered: 2018–2021.
| Year | Reference | Notes |
|---|---|---|
| 2021 | [63] | A review of AI-based methods for remote sensing and fault detection and diagnosis (FDD) in PV emphasizing the applicability of models and the use of IoT technologies for remote monitoring and diagnosis. |
| 2020 | [64] | A very comprehensive review on fault detection in PV using both SNNs and DL. Analysis related to the years 2009–2020. MLP and CNNs result as the more diffused methods employed in this field. Some public datasets (cell images) were reported. Proposes the build of a large open database of healthy and faults modules/plants (1D and 2D images) |
| 2019 | [65] | Four major faults are analyzed: ground, line-line, arc and hot-spot. For each fault are proposed both conventional and advanced methods to deal with them: ML-based (MLBTs), reflectometry-based, statistical and signal based and comparison based. Proposes a scoring system to ranks methods. |
| 2018 | [66] | A review of applicable methods, ML-based but also statistical-based, to FDD in PV. Highlights that most methods employ I-V curve data but also irradiance and module temperature. |
| 2018 | [62] | An in-depth analysis of all major faults that can affect PV systems is accompanied by a complete list of methodologies that can be employed to detect and diagnose faults. Only a small section is devoted to ML-based methods. |
| 2018 | [61] | After describing all major faults that can occur in PV, it focuses on FDD methods especially suited for faults occurring in a PV array: statistical, I–V analysis, power loss analysis, voltage and current measurement and AI-based. This paper concludes by highlighting the pro and cons of each method with some recommendations and insight into possible future trends. |
| 2018 | [67] | Analyzes all major faults that can affect PV with a review of methods in the literature for PV fault monitoring and detection. Emphasizes how statistical methods do not require previous data but cannot identify failure types. On the other hand, numerical methods can detect failure types, but require knowledge of previous data. Knowledge model-based methods using residual current voltage or power can provide fault detection and identification but require historical data and also meteorological ones. |
Table 5.
Papers for fault/anomaly detection and diagnosis in PV. Publication year considered: 2018–2021.
Table 5.
Papers for fault/anomaly detection and diagnosis in PV. Publication year considered: 2018–2021.
| Year | Reference | Metrics | Applied to | Faults Detectable | Methods & Notes |
|---|---|---|---|---|---|
| 2021 | [69] | Kappa Statistic, Precision, Recall, CM, F-measure | Software simulation | HIF, Line to Ground fault (LG), LL, Double Line to Ground fault (LLG), Three-phase fault (LLLG) | LSTM+DWT |
| 2020 | [68] | TPR, FNR, PPV, FDR, ROC, F-measures | PV panels of a 22 modules plant | Hot-spot | Hybrid SVM using IRT images and custom feature extraction methodology (41 total features) |
| 2020 | [70] | Accuracy | Software simulation | LL | SVM+ GA for optimal model hyper-parameter selection (Gaussian kernel) and feature selection (three or two from a set of ten) |
| 2020 | [71] | Accuracy, F1 | Hardware simulation | Five total faults AC or DC. | RK-RFKmeans and RK-RFED |
| 2020 | [72] | Software simulation | LL, ARC, PS, OC, No-Fault, faults in PS | Pre-trained AlexNet with last three layers fine-tuned with 2-D scalogram from PV data | |
| 2019 | [73] | Precision, Recall, F1, Detection Accuracy | Two large solar farms | Five types of common anomalies (ageing, building shading, hot spot, grass shading and surface soiling) | Hierarchical context-aware anomaly detection (Auto-GMM+ auto thresholding, Multimodal feature extraction+XGboost) |
| 2019 | [74] | ||||
| 2018 | [75] | Accuracy (10-fold CV) | Software simulation + laboratory PV system | RF using only voltage and string currents from PV array optimized with grid search (out-of-bag accuracy) |
Table 6.
Review papers on PV MPPT techniques. Publication year considered: 2018–2021.
| Year | Reference | Notes |
|---|---|---|
| 2021 | [79] | The paper provides a comparative and comprehensive review of some relevant PSO-based methods taking into account the effects of important key issues such as particles initialization criteria, search space, convergence speed, initial parameters, performance with and without partial shading and efficiency. |
| 2021 | [80] | The paper intends to review the previous articles and provide a proper division, performance method. This explains the performance, application, advantages and disadvantages of algorithms to be a good reference for selecting the appropriate algorithm. Algorithms in the presented paper are divided into four categories methods based on measurement, calculation, intelligent schemes and hybrid schemes. |
| 2021 | [81] | The paper represents a review of two modern techniques used in solar photovoltaic systems which enhance the extraction of maximum output power in an efficient manner. The Artificial Intelligence-Based MPPT Techniques for PV Applications and a Forecasting System of Solar PV Power Generation using Wavelet Decomposition and Bias- compensated RF are reviewed and compared in the paper. |
| 2021 | [82] | The paper presents an organized and concise review of MPPT techniques implemented for the PV systems in literature along with recent publications on various hardware design methodologies. Their classification is done into four categories, i.e., classical, intelligent, optimal and hybrid depending on the tracking algorithm utilized to track MPP under PSCs. |
| 2021 | [83] | The review of MPPT techniques proposed in the paper has been grouped into two groups. The first group includes all the benchmark facilities. The second group includes the intelligent techniques that explain the fuzzy-based MPPT, ANN-based MPPT evolutionary techniques, hybrid methods and MPPT techniques used in energy harvesting. |
| 2020 | [84] | In the presented paper, a compendious study of different Swarm Intelligence (SI)-based MPPT algorithms for PV systems feasible under partially shaded conditions are presented. The methods are compared in terms of their swarm intelligence and advantages. |
| 2020 | [85] | A detailed comparison of classification and performance between six major AI-based MPPT techniques have been made based on the review and MATLAB/Simulink simulation results. Each technique is compared in terms of algorithm structure, cost, complexity, platform, input parameters, tracking speed, oscillation accuracy, efficiency and their applications. The AI-based MPPT techniques are generally classified into fuzzy logic control (FLC), ANN, GA, swarm intelligence (SI), ML and other emerging techniques. |
| 2020 | [86] | The presented study gives an extensive review of 23 MPPT techniques present in literature along with recent publications on various hardware design methodologies. MPPT classification is done into three categories, i.e., Classical, Intelligent and Optimisation depending on the tracking algorithm utilised. During uniform insolation, classical methods are highly preferred as there is only one peak in the P-V curve. The paper furnishes the hardware information of the particular technique by different authors performed in various platforms with their tracking speeds and efficiencies. In addition, the parameters of these techniques, their flowcharts and a clear explanation of MPPT algorithm implementation are explained in brief. The fundamental objective is to give ongoing innovation advancements in MPPT techniques. |
| 2020 | [87] | The main MPPT techniques for PV systems are reviewed and summarized and divided into three groups according to their control theoretic and optimization principles: Traditional MPPT methods, MPPT methods based on intelligent control and MPPT methods under PSCs. In particular, the advantages and disadvantages of the MPPT techniques for PV systems under PSCs are compared and analyzed. |
| 2020 | [88] | This paper reviews (extensively) the most used MPPT algorithms. They are classified into three groups: (1) direct, such as hill climbing, Perturb and Observe (P&O) and incremental conductance (INC); (2) indirect, namely fractional short-circuit current, Fractional Open-Circuit Voltage and pilot cell and (3); soft computing methods such as a Kalman filter, FLC, ANN, PSO, ant colony optimization (ACO), artificial bee colony (ABC), bat algorithm and hybrid PSO-FLC. The purpose of the presented review is to provide a general insight into various MPPT methods describing their principles of operations and highlighting their advantages and limitations. In addition, the suitable embedded board for the hardware implementation of each method is outlined; low-cost only embedded boards have been studied. |
| 2019 | [89] | This study provides an extensive review of the current status of MPPT methods for PV systems which are classified into eight categories (methods based on mathematical calculations, constant parameters-based methods, measurement and comparison-based methods, trial and error based methods, numerical methods, intelligent prediction based methods and methods based on iterative in nature). The categorization is based on the tracking characteristics of the discussed methods. The novelty of this study is that it focuses on the key characteristics and 11 selection parameters of the methods to make a comprehensive analysis, which is not considered together in any review works so far. Again, the pros and cons, classification and immense comparison among them described in this study can be used as a reference to address the gaps for further research in this field. A comparative review in tabular form is also presented at the end of the discussion of each category to evaluate the performance of these methods, which will help in selecting the appropriate technique for any specific application. |
| 2018 | [90] | The paper focuses mainly on a review of advancements of MPPT techniques of PV systems subjected to partial shading conditions (PSC) to help the users to make the right choice when designing their system. The choice of MPPT depends on several parameters such as the application, hardware availability, cost, convergence speed, precision, and system reliability. |
Publisher’s Note: MDPI stays neutral with regard to jurisdictional claims in published maps and institutional affiliations. |
© 2021 by the authors. Licensee MDPI, Basel, Switzerland. This article is an open access article distributed under the terms and conditions of the Creative Commons Attribution (CC BY) license (https://creativecommons.org/licenses/by/4.0/).
Share and Cite
MDPI and ACS Style
Tina, G.M.; Ventura, C.; Ferlito, S.; De Vito, S. A State-of-Art-Review on Machine-Learning Based Methods for PV. Appl. Sci. 2021, 11, 7550. https://doi.org/10.3390/app11167550
AMA Style
Tina GM, Ventura C, Ferlito S, De Vito S. A State-of-Art-Review on Machine-Learning Based Methods for PV. Applied Sciences. 2021; 11(16):7550. https://doi.org/10.3390/app11167550
Chicago/Turabian StyleTina, Giuseppe Marco, Cristina Ventura, Sergio Ferlito, and Saverio De Vito. 2021. "A State-of-Art-Review on Machine-Learning Based Methods for PV" Applied Sciences 11, no. 16: 7550. https://doi.org/10.3390/app11167550
Note that from the first issue of 2016, this journal uses article numbers instead of page numbers. See further details here.