
A Novel Framework for Online Remaining Useful Life Prediction of an Industrial Slurry Pump

Department of Advanced Design and Systems Engineering, City University of Hong Kong, Hong Kong
*
Author to whom correspondence should be addressed.
Appl. Sci. 2022, 12(10), 4839; https://doi.org/10.3390/app12104839
Submission received: 25 March 2022
/
Revised: 2 May 2022
/
Accepted: 5 May 2022
/
Published: 10 May 2022
(This article belongs to the Collection Nondestructive Testing (NDT))
Abstract
:An efficient Remaining Useful Life (RUL) prediction method is one of the most important features of a condition-based maintenance system. A running machine’s RUL prognosis in its real-time is a challenging task, especially when there is no historic failure data available for that particular machine. In this paper, an online RUL of an in-operation industrial slurry pump having no historical failure data has been predicted. At first, the available raw vibration datasets were filtered out for valid datasets. The obtained valid datasets were utilized for constructing the Health Degradation Trends (HDTs) using principal component analysis and a moving average method. Then, a novel procedure for automatically selecting the HDT’s data points for initiating the iteration process of prediction was formulated. Afterward, a hybrid deep LSTM model embedded with a smart learning rate mechanism was developed for estimating the online RUL using the selected points of HDTs. The online RUL prediction results produced by the developed model were quite satisfactory when they were compared with other online RUL prediction methods.
1. Introduction
A smart Remaining Useful Life (RUL) prediction method is one of the most important elements of a Condition Based Maintenance (CBM) system. If a maintenance engineer has an idea for a running machine of when it will start to degrade, then he can take wise maintenance decisions beforehand. By doing so, he will not only save the industry from downtime but will also optimize the working of a particular machine by protecting it from unnecessary maintenance. There are three types of RUL prediction methods that are currently available in the literature [1], model-based methods, data-driven methods, and hybrid approaches. If the physical model of the deterioration of a machine is precisely derived, then the model-based RUL prediction approaches are suitable for RUL prediction. However, accurate physical failure models are difficult to construct due to the increasing complexity of modern machines and components. With the rapid growth of the industrial internet of things (IIOT), a substantial amount of machine monitoring data is now available in modern industries. This data can be utilized for fault diagnosis and the prognosis analysis of industrial machines [2]. Hybrid approaches attempt to fix the constraints of individual data-driven and model-based methods by merging these techniques [3]. However, they still depend on the analytical model’s availability [4]. As a result, data-driven approaches have become the most popular and preferred choice by the researchers for RUL prediction purposes [5].
The prognosis of the RUL of a running machine in its real-time is a difficult task. This job becomes more challenging when no historic failure data is available for a particular machine. In literature, many RUL prediction studies are available where researchers have utilized their own empirical or publically available datasets, for instance, [6,7,8,9,10]. A very positive aspect of those datasets was the presence of a huge amount of run-to-failure (training data) and run-to-prior failure (testing data) data. Researchers utilized the available run-to-failure data for training of the models while run-to-prior failure data for testing of their developed models. There are two problems involved with the above-mentioned approach to RUL prediction: (i) Experimental/simulation-based datasets or publically available datasets, e.g., NASA’s CMAPSS dataset or PRONOSTIA dataset, etc., are developed in a controlled environment. In contrast, the field data is different and more problematic than the data obtained from an artificially organized environment. (ii) Even from the field, it is not possible to have a huge amount of run-to-failure data of many same types of equipment. The reason is that machines are never allowed to work until their failure in an industry. After a specified time period, machines are typically practiced with the Time Based Maintenance (TBM) to keep them well and in a good working condition.
In the real world, it is almost impossible to have a huge amount of run-to-failure field data of a machine. However, it is still possible to have the run-to-prior failure data of a particular running machine to make an analysis for its RUL.
In the conducted research, the run-to-prior failure vibration datasets of an industrial slurry pump were acquired while it was performing its operation. Slurry pumps are a special kind of centrifugal pumps that are typically used in the oil industry, especially for oil sand exploration. These pumps are typically installed in plants where they work under adverse conditions. Impellers of the slurry pumps have direct contact with the dense and rocky slurry mixtures, so they are subject to continuous wear [11]. Recently, some research has been conducted for estimating the Remaining Useful Lives of the slurry pumps. For instance, Hu [12] constructed a method for predicting the RUL of slurry pump impellers by integrating a sum of two exponential functions with relevance vector machines (RVMs). A unique feature extraction approach was proposed to handle field vibration data in which features were varying with the development of damage in the impellers. The efficiency of the devised strategy was proved with a case study, involving two field datasets. Tse [13] developed a methodology for estimating the RUL for slurry pumps, which was based on the fusion of data obtained from several vibration sensors. The fusion methodology allowed for the building of more reliable degradation indexes. After that, Kalman Filter method was used to estimate the parameters of a deterioration trend line for predicting the trend of the developed degradation index. Finally, by analytically extrapolating the state-space model to a pre-defined threshold, an interval estimation of the RUL was achieved. Dong [14] studied the degradation performance and the RUL estimation of the impellers with the combination of a nonlinear state-space model and an efficient unscented transform method. Dong [15] also proposed a moving-average wear degradation index and combined it with a general sequential Monte Carlo method for predicting the RUL of a slurry pump.
All the above-mentioned techniques were developed by the curve-fitting methods for processing data-driven RUL prognosis and health management. Furthermore, the presented Health Degradation Trends (HDTs) in these studies were progressing in a smooth way towards the threshold lines. The problem involved with the curve-fitting method is its issue of under- and over-fitting, particularly when it is applied to an HDT having many deep crest- and trough-like structures. This situation leads towards the doubt that whether the predicted curve is indicating the true degradation of the pump impellers or not. To encounter this shortcoming of the curve-fitting method, this study opted for an unsupervised learning technique of neural networks for predicting the online RUL.
As an outline, the conducted research aimed to develop a novel framework that can (i) filter the invalid datasets from the raw data automatically, (ii) construct and recognize the most appropriate HDT from the valid datasets with the help of PCA and a moving average method, (iii) automatically select the HDTs data points for initiating the iteration process of prediction, and (iv) develop a hybrid deep Long Short-Term Memory (LSTM) model embedded with a smart learning rate mechanism for RUL prognosis, using the selected data points of HDTs.
2. Methodology
Figure 1 illustrates the proposed framework for the online RUL prediction of the slurry pump impellers. There were three main parts of the developed methodology.
Part I. Raw data filtering: This step generated a new criterion that can recognize the valid and invalid raw vibration signals. Four traditional statistical indicators, i.e., Root Mean Square (RMS), kurtosis, and Percentage Mean Difference (PMD) in the time domain, while kurtosis again, in the frequency domain, were selected as the selection criteria.
Part II. Health degradation trend built: This step first calculated the eighteen traditional statistical features and constructed a feature matrix. Then, it used a principal component analysis along with a moving average method for reducing the dimensions of the feature matrix. The obtained first principal component was utilized as the health degradation tracking index. Afterward, the automatic selection of HDTs data points for initiating the prediction process was performed.
Part III. Remaining useful life prediction: This step built the hybrid deep LSTM model, which was embedded with a novel smart learning rate mechanism. The developed model produced its prediction results, which were utilized for estimating the online RUL of the slurry pump.
2.1. Data Collection and Its Filtering for Valid Datasets Acquisition
The vibrational measurement datasets were collected from the application of Smart Asset Management System (SAMS) software developed by the smart engineering asset management Lab. The data acquisition instrument included a National Instrument (NI) DAQ 9172 and a DAQ module NI 9234. The four accelerometers (PCB 352A60), C1, C2, C3, and C4, were mounted on four different locations of the slurry pump, as shown in Figure 2. C1 monitored the vibration at the suction/inlet of the pump, while C2 and C3 were responsible for gathering the vibration signals of the rotating vanes. Lastly, C4 monitored the vibration at the discharge/outlet of the pump. The datasets which were utilized in the conducted research were observed from channel 2, i.e., T2G1 C2, and channel 4, i.e., T2G1 C4.
During the above-stated condition monitoring stage, the vibration signals were collected after every one hour. A total of 24 data sets were collected per day. Since the sampling frequency was set to 6000 Hz, consequently, each dataset had a data length of 6000 samples. The total number of datasets or files stored in the system was 4269 sets. During the data collection process, many of the datasets were not collected correctly due to different reasons. For example, many of them were collected when the pump was flushing with water, or sensor cables were loosened or broken, or the pump was interfered by the other nearby machines vibrations, or human errors, etc. Therefore, there was a need to remove those invalid datasets that were not reflecting the true operating conditions of the slurry pump. Tse et al. and his research team worked on a number of faults-related features to select a criteria for distinguishing valid datasets from the raw vibration datasets [13]. Based on their past experience and research efforts, they selected three statistical features i.e., root mean square, kurtosis, and perentage mean difference in the time domain and one statistical feature i.e., kurtosis, again in the frequency domain for separating the valid and invalid datasets. The utilized statistical features are defined as the following:
where
- N = data length of the dataset
- n = selected length of the considered dataset i.e., n = 1, 2, …, N
- Xn = processed vibration signals
- μ = mean of the dataset
- σ = standard deviation of the dataset
- PM = mean of positive values for one particular vibration signal
- MN = mean of negative values for one particular vibration signal
To study the statistical features of collected vibration signals, a LabView program was built up that filtered the invalid signals from the raw data. The outcome of the program was two separate pools of data. One contained the valid while the other contained the invalid datasets. The filtering criteria are depicted in Table 1.
In the LabVIEW program, the values of the four statistical features were calculated automatically, and it scored one point if the values of the statistical features were within the pass range, as shown in Table 2. A signal was determined as valid if it scored 3 points or more. Otherwise, the signal was considered invalid. Figure 3 shows the raw signals before and after the data filtering process. It can be observed that the invalid data signals, which were outliers or with values nearly equal to zero, were filtered out efficiently.
2.2. Development of the Health Degradation Trends
After the first step, i.e., filtering the valid datasets from raw datasets, the second step was the extraction of the 18 traditional statistical features from the valid raw vibration signals.
2.2.1. Statistical Feature Extraction
Besides the impellers, the slurry pump also consisted of many other critical components, such as vanes, casing, etc. These components were generating various vibrating frequencies; therefore, a low-pass filter algorithm was used for specifically capturing the impellers vibrations. A cut-off frequency of 110 Hz was applied to process the slurry pump’s original vibration data . Then, nine traditional statistical features, i.e., mean (μ), standard deviation (σ), root mean square (RMS), skewness (SK), kurtosis (KU), crest factor (CF), clearance factor (CLF), shape factor (SF), and impulse factor (IF) in the time domain, were extracted. Subsequently, the same nine statistical features in the frequency domain were also extracted from the valid vibration signals . Table S1 (Supplementary Materials) shows the mathematical equations of the selected statistical features. The feature matrices in time and frequency domains were constructed as
where
- N = data length of the dataset
- n = selected length of the considered dataset i.e., n = 1,2, …, N
- FLP(t) = the features in the time domain
- FLP(f) = the features in the frequency domain
- LP = low pass filtering
2.2.2. Health Assessment Indicator
Principal component analysis can effectively reduce the dimensionality of the data matrix [14]. It performs an orthogonal transformation to convert a set of observations, for instance, the correlated statistical features extracted from the raw vibration signals into a set of uncorrelated principal components [14]. Since the first principal component has the largest variance, it was taken as an index for evaluating the given datasets. After the extraction of 18 statistical features from the valid signals, they were reconstructed into a new feature matrix. Further details regarding this transformation can be seen in the previous work by the corresponding authors in [14,16]. The new feature matrix was sent to a designed algorithm that was the combination of principal component analysis and a moving average method. The algorithm constructed the HDTs of 18 statistical features (9 in time domain and 9 in frequency domain), as shown in Figures S2 and S3 (Supplementary Materials). It was observed that the first principal component for channel 2 datasets was the time domain feature “mean”. On the contrary, for channel 4, it was noticed to be the time domain feature “STD”. Therefore, the health degradation tracking indexes that were formed by the time domain features mean and STD were considered the required HDTs for the RUL estimation process. The constructed HDTs are shown in Figure 4.
2.3. Automatic Selection of HDTs Data Points for Initiating the Iteration Process of Prediction
As per the proposed framework, after the construction of HDTs, the next step was the automatic selection of the HDTs data points for initiating the iteration process of prediction. According to [17], there is a research gap on from which points of HDTs the iteration process should start for producing the prediction points. As per the general experience, the vibration of in-operation mechanical equipment increases with the passage of time. Therefore, it was decided that only those data points of the HDTs should be selected for commencing the iteration process, which have a trend of increasing slopes. This concept gave a logical sense that HDT’s data points owning a patch of successive increasing slopes can be expected to progress towards the upward threshold line (like a natural vibration trend). To comply with this idea, a moving window size of 20 data points of each HDT was selected for calculating the slopes. In the case of channel 2, a standard was made that at least every 6th consecutively increasing slope point would be utilized for initiating the iteration process, as shown in Figure 5a. Since the neural networks require a suitable amount of data for their training and learning stage, 200 data points of both the channels’ HDTs were kept excluded during the data points selection process.
By following the approach stated above, the corresponding data points were found to be 258, 288, 312, 364, 416, and 458 for the channel 2 HDT. For the first iteration process, Section 1 of HDTs data points, i.e., from 1 to 258, was selected, as shown in Figure 5b. Similarly, for the second iteration process, Section 2 of data points, i.e., 1 to 288, was selected. Accordingly, the 6th section of data points, i.e., 1 to 456, was picked up to initiate the 6th iteration process for producing the prediction points.
Similarly, in the case of channel 4, every 4th (or above) sequentially increasing slope point was utilized for starting the iteration process, as shown in Figure 5c. The corresponding slope points values were found to be 456, 495, 565, 655, 720, 824, and 834 for the channel 4 HDT. Same as earlier, by utilizing the selected data points, seven sections were formed, which were utilized for initiating the iteration process, as shown in Figure 5d.
2.4. Development and Design of the Hybrid Deep LSTM Model
To utilize the selected data points of HDTs for RUL prediction, a hybrid deep neural network model with LSTM and classic neural network layers was constructed in this study. The developed model was taking advantage of LSTM for its ability to model sequential data, while the classic fully connected layers were working for their outstanding capability of modeling non-linearity in data [2]. After each LSTM layer, a fully connected layer was added for creating a hybrid building block. In order to avoid overfitting during the network training process, dropout layers were triggered on the fully connected layers. The architecture of the hybrid deep LSTM model is illustrated in Figure 6. The number of LSTM layers/units and the initial learning rates for channel 2 and channel 4 datasets were determined by the Bayesian Optimization (BO) method. The number of hybrid building blocks was kept equal to the number of LSTM layers. Similarly, the number of units in fully connected layers were also kept equal to the number of units in the LSTM layers. The number of LSTM layers, units, and initial learning rate for channel 2 datasets were found to be 2, 244, 0.018, while for channel 4 datasets, they were observed as 3, 258, and 0.024, respectively.
Working Mechanism of the Developed Model
As discussed in Section 1 of the paper, both the datasets were modeled using the unsupervised learning technique of neural networks. Therefore, the developed model estimated the online RUL by predicting one prediction point, i.e., , after every single iteration of the given datasets. The input data was in the form of , … , which produced the output at the time-step . The predicted value became the part of the input data for the next iteration in the form of , … , and produced the result at time-step . Similarly, the output became the last part of the input data in the form of , … , , …, , and so on. This process remained in progress until the resulting prediction point did not strike the threshold line.
2.5. Development and Incorporation of the Smart Learning Rate Mechanism
After the automatic selection of the different data points of HDTs, the required iteration process of prediction was started. The iteration process produced one prediction point in return to one complete iteration run, as discussed above. If the produced prediction point was found to be greater than its preceding data point, i.e., > , then it was accepted to append into the input vector for the next iteration. The iteration process remained in progress until it produced the acceptable prediction points, i.e., > . After a few acceptable prediction points, the iteration system produced a prediction point that was less than its preceding data point, i.e., < . The simulation program considered a “descending” prediction point as an outlier or a rejected prediction point and re-iterated the prediction process for that particular time step. The system continued the re-iteration process repeatedly until the resulting prediction point did not arrive to be greater than the earlier prediction point, i.e., > .
Since the iteration system was only iterating a maximum of 458 and 834 data points of channel 2 and channel 4 HDTs, respectively, the system was producing too many outliers or rejected values. In some cases, the situation was such that even after 1000 iterations for a particular time step, the condition was still < . An investigation was made to dig out the reason for this unwanted phenomenon. After a deep analysis, it came to the authors’ knowledge that the base learning rate value helped the developed hybrid LSTM model for a few iterations for obtaining acceptable prediction points. However, later on, it leads the training process to suffer from an under- / overfitting problem for converging towards the global minima of the gradient descent. The concept of learning rate and its role in modeling for reaching towards global minima can be seen in [18,19].
In order to tackle the frequent situation of < , a novel smart learning rate mechanism was developed and incorporated into the iteration system. The developed mechanism was overviewing the whole iteration process. As it observed consecutive 20 rejected values, i.e., < , it automatically changed the base learning rate by a multiple factor of standard deviation value of the considered HDT. The proposed learning rate mechanism worked as the “catalyst” for the whole prediction process since its triggering was setting the system to again begin to provide acceptable prediction points, i.e., > . The concept of accepted and rejected prediction points is depicted in Figure 7. The iteration system can also work without the developed learning rate mechanism, but it is quite possible that it would take many days to produce the required number of acceptable prediction points.
3. Results
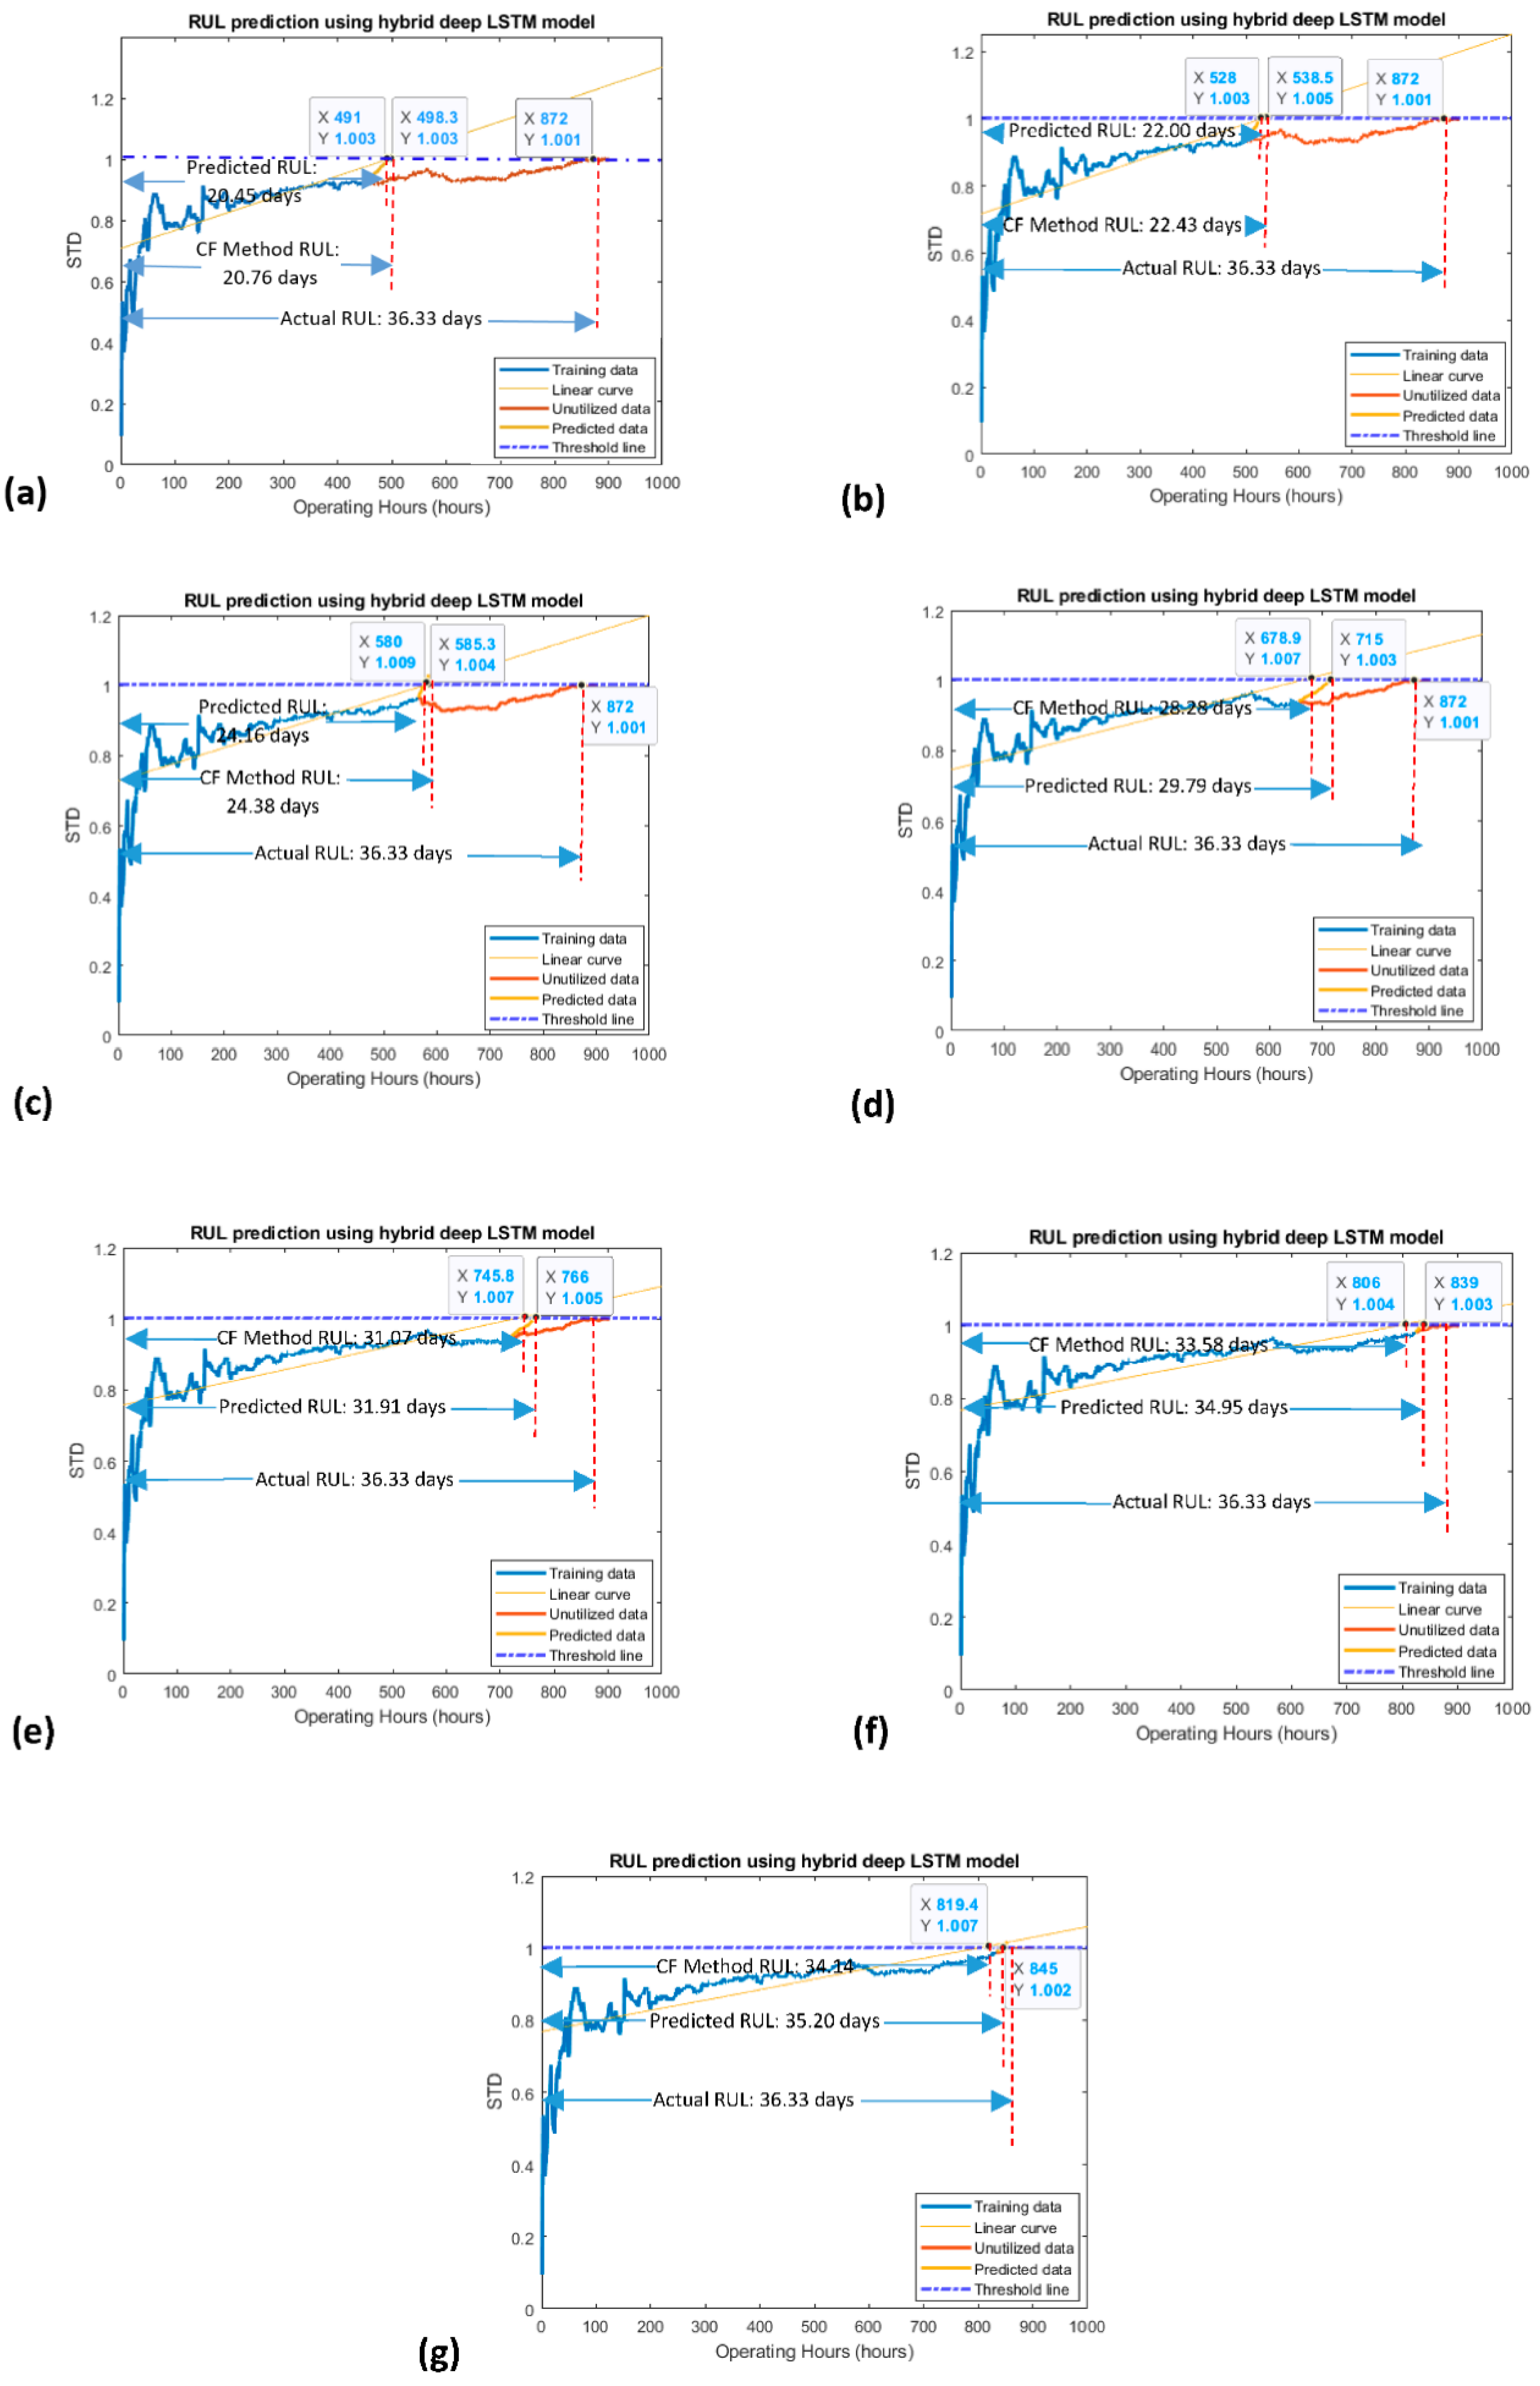
The RUL prediction results obtained by the developed model for channel 2 and channel 4 HDTs are shown in Figure 8 and Figure 9, respectively. It is obvious that when the number of operating hours was less for the model’s learning/training stage, the predicted RULs were less accurate. However, with the passage of time, when the number of operating hours was more, the RUL prediction results were relatively more accurate. It should be noticed that each data point of an HDT was reflecting one operating hour. Therefore, RUL prediction results were calculated by dividing the x-coordinates of the prediction point by 24 (which was meeting the threshold line). The RUL prediction results obtained by the developed model were also compared with other existing methods. These comparative methods are typically used for online RUL prediction in the absence of run-to-failure data, as discussed in [13,17,20]. The obtained RUL prediction results comparison is shown in Table 3 and Table 4. It should be noticed that the curve-fitting method was not applicable to predict the RUL for all the selected operating hours of channel 2. The reason is that the predicted curve was striking to the threshold line after the threshold (maximum) point of the HDT, as shown in Figure 8a–f. Contrariwise, the Nonlinear Autoregressive network with Exogenous input (NARX) method was predicting its RUL prediction results for only 456 operating hours, as shown in Table 3. Similarly, in the case of channel 4, it can be observed in Figure 9 that the proposed method RUL prediction results are more satisfactory than the curve-fitting method results. The proposed model results are better for four out of seven operating hours, i.e., 655, 720, 824, and 834 operating hours, as displayed in Figure 9d–g. For the remaining three operating hours, i.e., 456, 496, and 565, the curve-fitting method results were slightly better, as depicted in Figure 9a–c. In contrast, the NARX method provided RUL prediction results for only 824 and 834 operating hours, but those results were less accurate than the developed model results, as presented in Table 4.
Error Analysis
The weighted average accuracy of prediction was utilized to assess the efficiency of the proposed and existing methods for estimating the RUL of the slurry pump. The weighted average accuracy of prediction can be calculated using Equation (6) [12].
where
- ωj = weight of particular operation hours
- xj = operation hours
- RULA = actual RUL in terms of weights
The weights of operation hours are directly proportional to the number of operation hours [12]. For estimating the weighted average of accuracy for channel 2 datasets, the weights of all the considered operating hours were calculated, as follows.
where the denominator 2094 is the sum of all the operating hours.
The calculated , , and were substituted into the equation (6) for obtaining the weighted average of accuracy. The same procedure was revised for channel 4. Table 5 presents the weighted actual and predicted RULs, while the results for the weighted average accuracy of prediction are shown in Table 6.
In the case of channel 2, it can be observed that when other methods are not even applicable to generate RUL results, the proposed method still yields its results with 42.15% weighted average accuracy. It should also be noticed that curve fitting and NARX methods are designated as “Not Applicable” in Table 6. This is due to the reason that they did not produce any RUL prediction results, as shown in Table 5. Similarly, in the case of channel 4, NARX is still not applicable. On the other hand, the weighted average accuracy of the curve-fitting method is still less than the proposed method, as depicted in Table 6.
4. Conclusions
In the literature, many studies are available for estimating the RUL of different equipment by utilizing the deep learning neural networks. Researchers have applied a huge amount of available simulation or empirical run-to-failure (training data) and run-to-prior failure (testing data) datasets for estimating the RULs. However, in the real world, only run-to-prior failure data of an operating machine is available, since the machine is never allowed to work until its failure. There is very limited research available where only run-to-prior failure data has been utilized for RUL prediction. In such studies, researchers have applied curve-fitting methods for their RUL prediction. Furthermore, the presented HDTs in these studies were very smooth while progressing in a very calm manner towards the threshold line, as in, for instance, [13,17].
However, the curve-fitting methods cannot be trusted for HDTs that have deep crest- and trough-like structures, due to their issues of under- and over-fittings. In the presented study, only run-to-prior failure vibration datasets of an in-operation industrial slurry pump were available for online RUL estimation. The involved HDTs were very difficult to simulate since there were many deep up and down peaks that were progressing towards the threshold line. To deal with such complicated HDTs of the slurry pump, a hybrid deep LSTM model embedded with a smart learning rate mechanism, was developed in this research work. The RUL prediction results obtained by the developed model outperformed those of other existing methods.
The major findings of the conducted research work are below.
- It is recommended that the iteration process for prediction should start from particular points of an HDT, which have consecutively increasing slopes. As per [17], it was a research gap that has been attempted to be filled up in this study.
- The developed smart learning rate mechanism incorporated into the hybrid deep LSTM model has worked as a “catalyst” for obtaining the acceptable prediction points. This feature of the proposed method is saving a large extent of time for estimating the online RUL.
- The developed strategy of producing an acceptable prediction point, then appending it into the input vector for another prediction, and so on, has been proved to be a successful alternative to the curve-fitting method. It is suggested that if an HDT is progressing with deep crest- and trough-like structures, then the proposed method should be utilized for estimating the online RUL.
The authors are making efforts to further improve the RUL prediction outcomes. The RULs of different types of rotating machines with significant changes in observed signals, such as vibration, forces, and pressure, etc., can also be predicted using the developed methodology.
Supplementary Materials
The following supporting information can be downloaded at: https://www.mdpi.com/article/10.3390/app12104839/s1, Related theory and literature review, Figure S1: The structure of a single LSTM unit. Figure S2: Developed HDTs for 18 traditional statistical features (a) nine in the time domain, and (b) nine in the frequency domain, for channel 2. Figure S3: Developed HDTs for 18 traditional statistical features (a) nine in the time domain, and (b) nine in the frequency domain, for channel 4. Table S1: 18 Statistical features extracted in time and frequency domains (Xn represents the valid vibration data in temporal and spectral domains). References [2,21,22,23,24,25,26,27,28,29,30,31,32,33,34,35,36,37] are cited in the Supplementary Materials file.
Author Contributions
Conceptualization, M.M.K. and P.W.T.; Methodology, formal analysis, M.M.K., P.W.T. and J.Y.; Programming, software and validation, M.M.K.; Experimental investigation and Supervision, P.W.T.; Original draft preparation, M.M.K. and P.W.T.; Project administration and funding acquisition, P.W.T.; Proof-reading, comment and revision, M.M.K., P.W.T. and J.Y. All authors have read and agreed to the published version of the manuscript.
Funding
The work described in this paper is fully supported by a grant from the Innovation and Technology Commission (ITC) (Project No. ITS-205-18FX) of the Government of the Hong Kong Special Administrative Region (HKSAR), China and a grant from the Research Grants Council (RGC) of the Hong Kong Special Administrative Region, China (Project No. [T32-101/15-R]).
Data Availability Statement
The slurry pumps datasets which have been used in this study are not available for public use.
Acknowledgments
The work described in this paper is fully supported by a grant from the In-novation and Technology Commission (ITC) (Project No. ITS-205-18FX) of the Government of the Hong Kong Special Administrative Region (HKSAR), China and a grant from the Research Grants Council (RGC) of the Hong Kong Special Administrative Region, China (Project No. [T32-101/15-R]). Any opinions, findings, conclusions, or recommendations expressed in this material (or by members of the project team) do not reflect the views of the Government of the HKSAR, ITC, RGC, or Panel of the Assessors for the Innovation and Technology Support Program of the Innovation and Technology Fund.
Conflicts of Interest
The authors declare no conflict of interest.
References
- Yin, S.; Li, X.; Gao, H.; Kaynak, O. Data-based techniques focused on modern industry: An overview. IEEE Trans. Ind. Electron. 2015, 62, 657–667. [Google Scholar] [CrossRef]
- Xia, M.; Zheng, X.; Imran, M.; Shoaib, M. Data-driven prognosis method using hybrid deep recurrent neural network. Appl. Soft Comput. 2020, 93, 106351. [Google Scholar] [CrossRef]
- Sbarufatti, C.; Corbetta, M.; Giglio, M.; Cadini, F. Adaptive prognosis of lithium-ion batteries based on the combination of particle filters and radial basis function neural networks. J. Power Sources 2017, 344, 128–140. [Google Scholar] [CrossRef]
- Djeziri, M.; Benmoussa, S.; Sanchez, R. Hybrid method for remaining useful life prediction in wind turbine systems. Renew. Energy 2018, 116, 173–187. [Google Scholar] [CrossRef]
- Javed, K.; Gouriveau, R.; Zerhouni, N.; Nectoux, P. Enabling health monitoring approach based on vibration data for accurate prognostics. IEEE Trans. Ind. Electron. 2015, 62, 647–656. [Google Scholar] [CrossRef] [Green Version]
- Ding, N.; Li, H.; Yin, Z.; Zhong, N.; Zhang, L. Journal bearing seizure degradation assessment and remaining useful life prediction based on long short-term memory neural network. Meas. J. Int. Meas. Confed. 2020, 166, 108215. [Google Scholar] [CrossRef]
- Al-Dulaimi, A.; Zabihi, S.; Asif, A.; Mohammadi, A. A multimodal and hybrid deep neural network model for Remaining Useful Life estimation. Comput. Ind. 2019, 108, 186–196. [Google Scholar] [CrossRef]
- Mo, Y.; Wu, Q.; Li, X.; Huang, B. Remaining useful life estimation via transformer encoder enhanced by a gated convolutional unit. J. Intell. Manuf. 2021, 32, 1997–2006. [Google Scholar] [CrossRef]
- Liu, L.; Song, X.; Chen, K.; Hou, B.; Chai, X.; Ning, H. An enhanced encoder–decoder framework for bearing remaining useful life prediction. Meas. J. Int. Meas. Confed. 2020, 170, 108753. [Google Scholar] [CrossRef]
- Wang, Q.; Xu, K.; Kong, X.; Huai, T. A linear mapping method for predicting accurately the RUL of rolling bearing. Meas. J. Int. Meas. Confed. 2021, 176, 109127. [Google Scholar] [CrossRef]
- Sellgren, A.; Addie, G.; Visintainer, R.; Pagalthivarthi, K. Prediction of slurry pump component wear and cost. In Annual Texas A&M Dredging Seminar: 19/06/2005-22/06/2005; Western Dredging Association: Vancouver, WA, USA, 2005; pp. 1–16. [Google Scholar]
- Hu, J.; Tse, P.W. A relevance vector machine-based approach with application to oil sand pump prognostics. Sensors 2013, 13, 12663–12686. [Google Scholar] [CrossRef] [Green Version]
- Tse, Y.L.; Cholette, M.E.; Tse, P.W. A multi-sensor approach to remaining useful life estimation for a slurry pump. Meas. J. Int. Meas. Confed. 2019, 139, 140–151. [Google Scholar] [CrossRef]
- Tse, P.W.; Wang, D. Enhancing the abilities in assessing slurry pumps’ performance degradation and estimating their remaining useful lives by using captured vibration signals. J. Vib. Control. 2015, 23, 1925–1937. [Google Scholar] [CrossRef]
- Wang, D.; Tse, P.W.T. Prognostics of slurry pumps based on a moving-average wear degradation index and a general sequential Monte Carlo method. Mech. Syst. Signal Process. 2015, 56–57, 213–229. [Google Scholar] [CrossRef]
- Sun, S.; Tse, P.W.; Tse, Y.L. An Enhanced Factor Analysis of Performance Degradation Assessment on Slurry Pump Impellers. Shock Vib. 2017, 2017, 1524840. [Google Scholar] [CrossRef]
- Kim, D.; Lee, S.; Kim, D. An applicable predictive maintenance framework for the absence of run-to-failure data. Appl. Sci. 2021, 11, 5180. [Google Scholar] [CrossRef]
- Rakhecha, A. Understanding Learning Rate. 2019. Available online: https://towardsdatascience.com/https-medium-com-dashingaditya-rakhecha-understanding-learning-rate-dd5da26bb6de (accessed on 24 March 2022).
- Abuqaddom, I.; Mahafzah, B.A.; Faris, H. Oriented stochastic loss descent algorithm to train very deep multi-layer neural networks without vanishing gradients. Knowl.-Based Syst. 2021, 230, 107391. [Google Scholar] [CrossRef]
- Khan, M.M.; Tse, P.W.; Trappey, A.J.C. Development of a novel methodology for remaining useful life prediction of industrial slurry pumps in the absence of run to failure data. Sensors 2021, 21, 8420. [Google Scholar] [CrossRef]
- Zhu, J.; Chen, N.; Shen, C. A new data-driven transferable remaining useful life prediction approach for bearing under different working conditions. Mech. Syst. Signal Process. 2020, 139, 106602. [Google Scholar] [CrossRef]
- Hinchi, A.Z.; Tkiouat, M. Rolling element bearing remaining useful life estimation based on a convolutional long-short-Term memory network. Procedia Comput. Sci. 2018, 127, 123–132. [Google Scholar] [CrossRef]
- An, Y.; Wang, X.; Chu, R.; Yue, B.; Wu, L.; Cui, J.; Qu, Z. Event classification for natural gas pipeline safety monitoring based on long short-term memory network and Adam algorithm. Struct. Health Monit. 2020, 19, 1151–1159. [Google Scholar] [CrossRef]
- Zhang, Y.; Xiong, R.; He, H.; Pecht, M.G. Long short-term memory recurrent neural network for remaining useful life prediction of lithium-ion batteries. IEEE Trans. Veh. Technol. 2018, 67, 5695–5705. [Google Scholar] [CrossRef]
- Wu, Y.; Yuan, M.; Dong, S.; Lin, L.; Liu, Y. Remaining useful life estimation of engineered systems using vanilla LSTM neural networks. Neurocomputing 2018, 275, 167–179. [Google Scholar] [CrossRef]
- Kisvari, A.; Lin, Z.; Liu, X. Wind power forecasting—A data-driven method along with gated recurrent neural network. Renew. Energy 2021, 163, 1895–1909. [Google Scholar] [CrossRef]
- Mao, W.; He, J.; Tang, J.; Li, Y. Predicting remaining useful life of rolling bearings based on deep feature representation and long short-term memory neural network. Adv. Mech. Eng. 2018, 10, 1687814018817184. [Google Scholar] [CrossRef]
- Fan, Y.; Qian, Y.; Xie, F.; Soong, F.K. TTS synthesis with bidirectional LSTM based Recurrent Neural Networks. Proc. Annu. Conf. Int. Speech Commun. Assoc. Interspeech 2014, 1964–1968. [Google Scholar] [CrossRef]
- Yildirim, Ö. A novel wavelet sequences based on deep bidirectional LSTM network model for ECG signal classification. Comput. Biol. Med. 2018, 96, 189–202. [Google Scholar] [CrossRef]
- Kara, A. A data-driven approach based on deep neural networks for lithium-ion battery prognostics. Neural Comput. Appl. 2021, 33, 13525–13538. [Google Scholar] [CrossRef]
- Esfahani, Z.; Salahshoor, K.; Farsi, B.; Eicker, U. A New Hybrid Model for RUL Prediction through Machine Learning. J. Fail. Anal. Prev. 2021, 21, 1596–1604. [Google Scholar] [CrossRef]
- Gao, S.; Xiong, X.; Zhou, Y.; Zhang, J. Bearing remaining useful life prediction based on a scaled health indicator and a lstm model with attention mechanism. Machines 2021, 9, 238. [Google Scholar] [CrossRef]
- Luo, J.; Zhang, X. Convolutional neural network based on attention mechanism and Bi-LSTM for bearing remaining life prediction. Appl. Intell. 2022, 52, 1076–1091. [Google Scholar] [CrossRef]
- Marei, M.; Li, W. Cutting tool prognostics enabled by hybrid CNN-LSTM with transfer learning. Int. J. Adv. Manuf. Technol. 2022, 118, 817–836. [Google Scholar] [CrossRef]
- Peng, H.; Li, H.; Zhang, Y.; Wang, S.; Gu, K.; Ren, M. Multi-Sensor Vibration Signal Based Three-Stage Fault Prediction for Rotating Mechanical Equipment. Entropy 2022, 24, 164. [Google Scholar] [CrossRef] [PubMed]
- Kumar, S.; Kolekar, T.; Kotecha, K.; Patil, S.; Bongale, A. Performance evaluation for tool wear prediction based on Bi-directional, Encoder–Decoder and Hybrid Long Short-Term Memory models. Int. J. Qual. Reliab. Manag. 2022. [Google Scholar] [CrossRef]
- Yao, J.; Lu, B.; Zhang, J. Tool remaining useful life prediction using deep transfer reinforcement learning based on long short-term memory networks. Int. J. Adv. Manuf. Technol. 2022, 118, 1077–1086. [Google Scholar] [CrossRef]
Figure 1.
The proposed framework for data filtering, health degradation assessment, automatic selection of HDTs data points, and online RUL prediction of slurry pump.
Figure 1.
The proposed framework for data filtering, health degradation assessment, automatic selection of HDTs data points, and online RUL prediction of slurry pump.
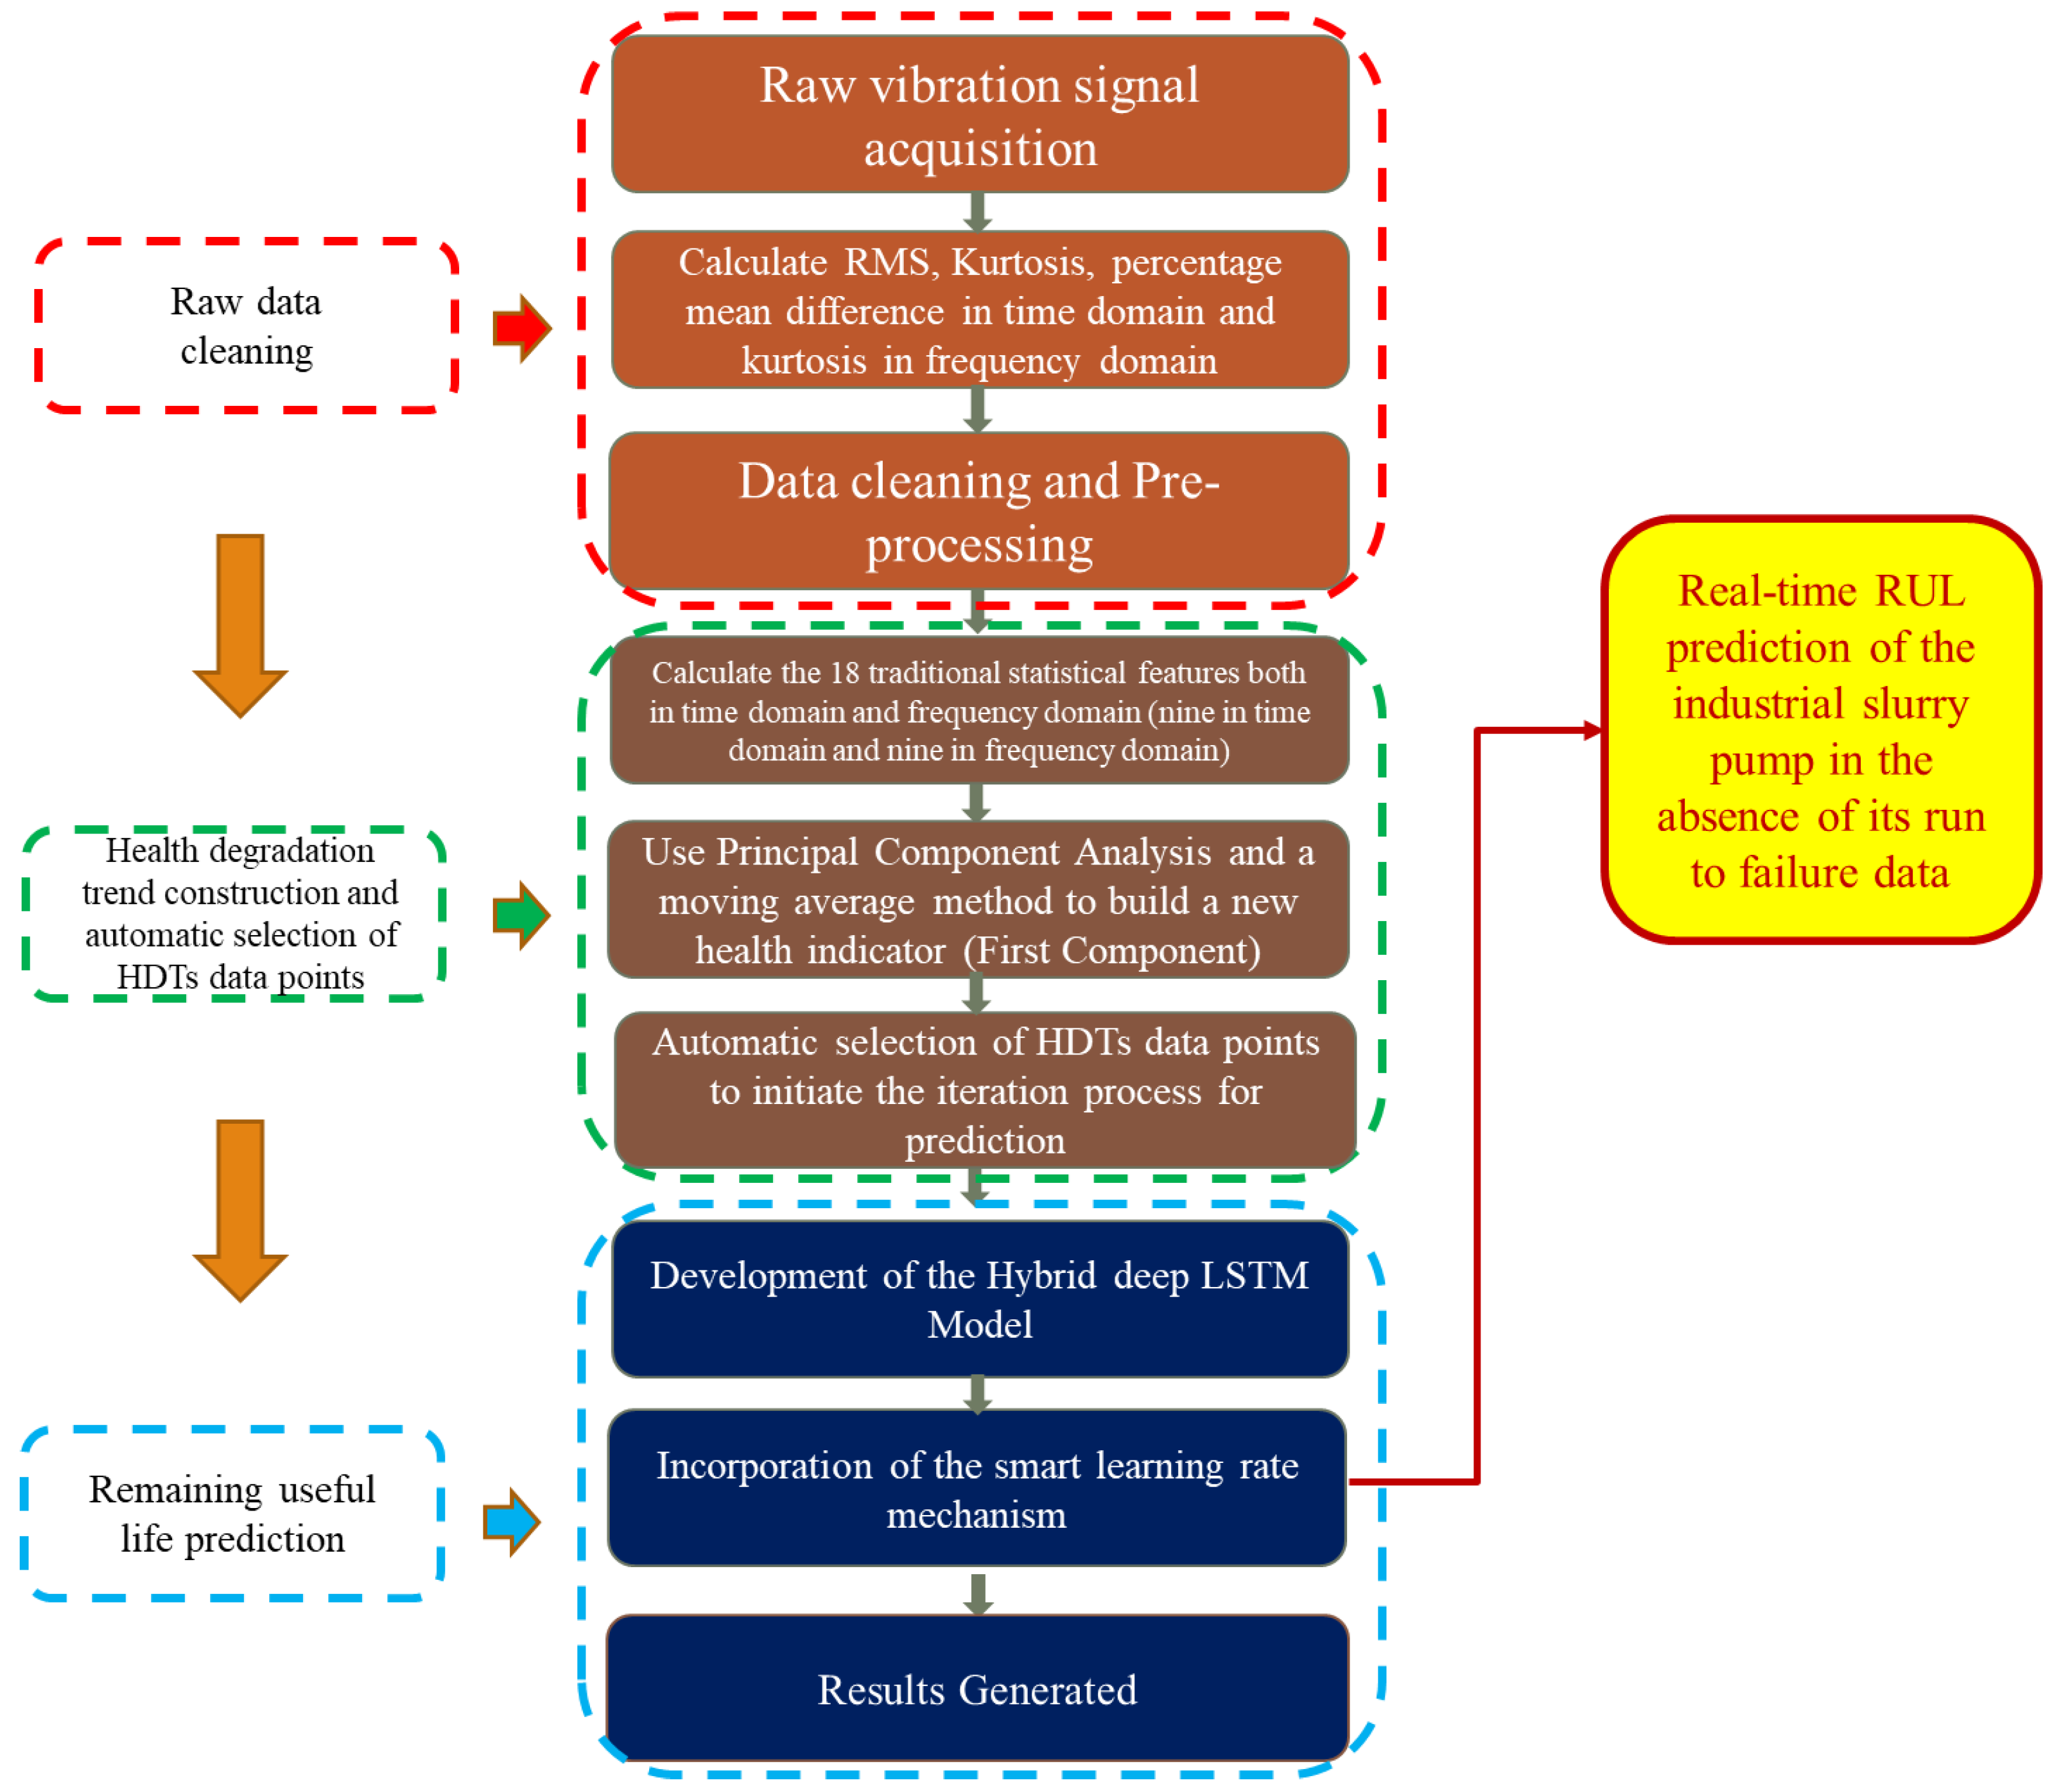
Figure 2.
The locations of the accelerometer installed on the slurry pump.
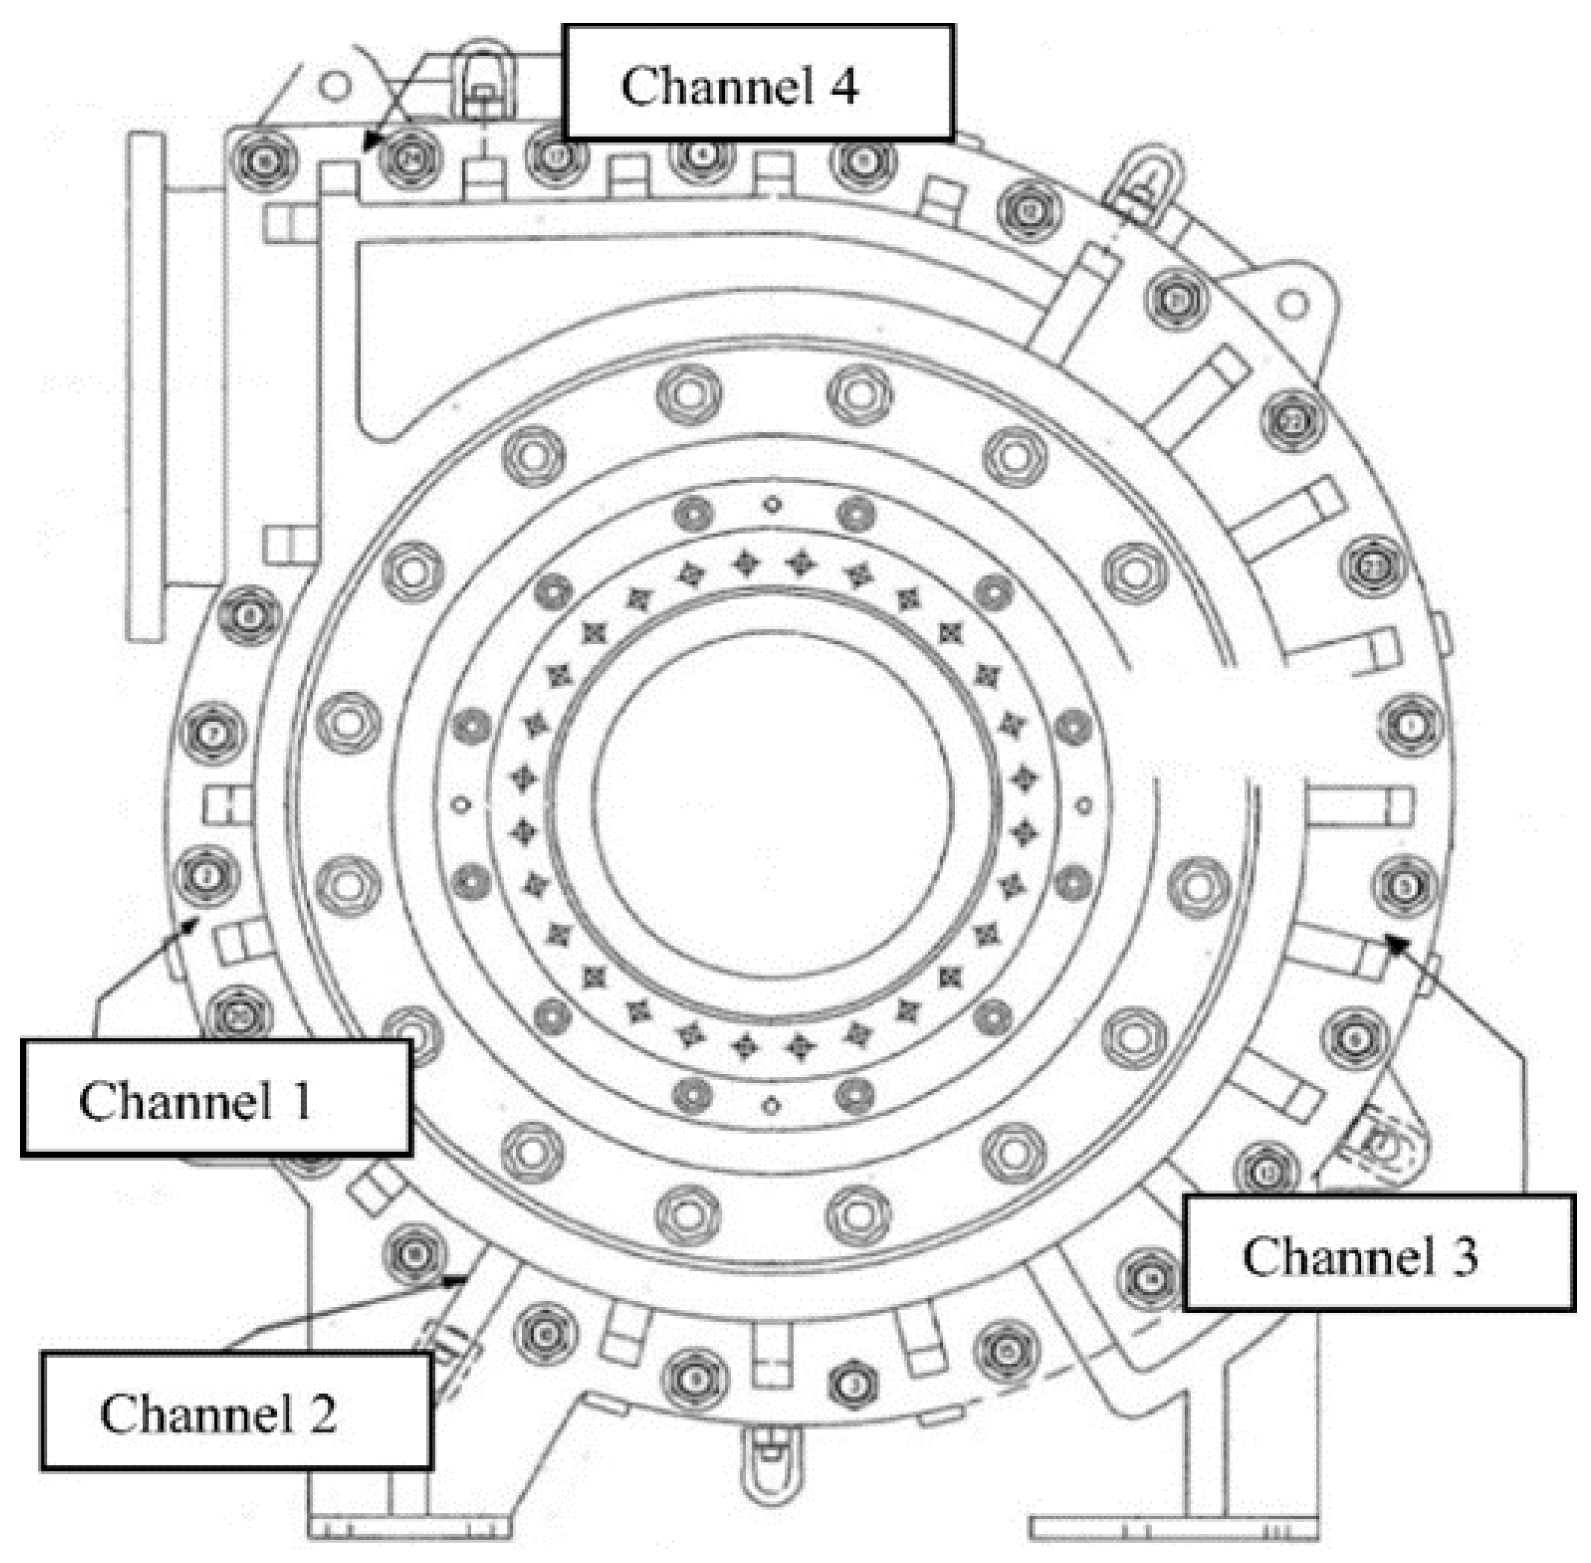
Figure 3.
The raw vibration signal before and after the data filtering process (a) for channel 2 and (b) channel 4.
Figure 3.
The raw vibration signal before and after the data filtering process (a) for channel 2 and (b) channel 4.

Figure 4.
Constructed health degradation trends for (a) channel 2 and (b) channel 4.
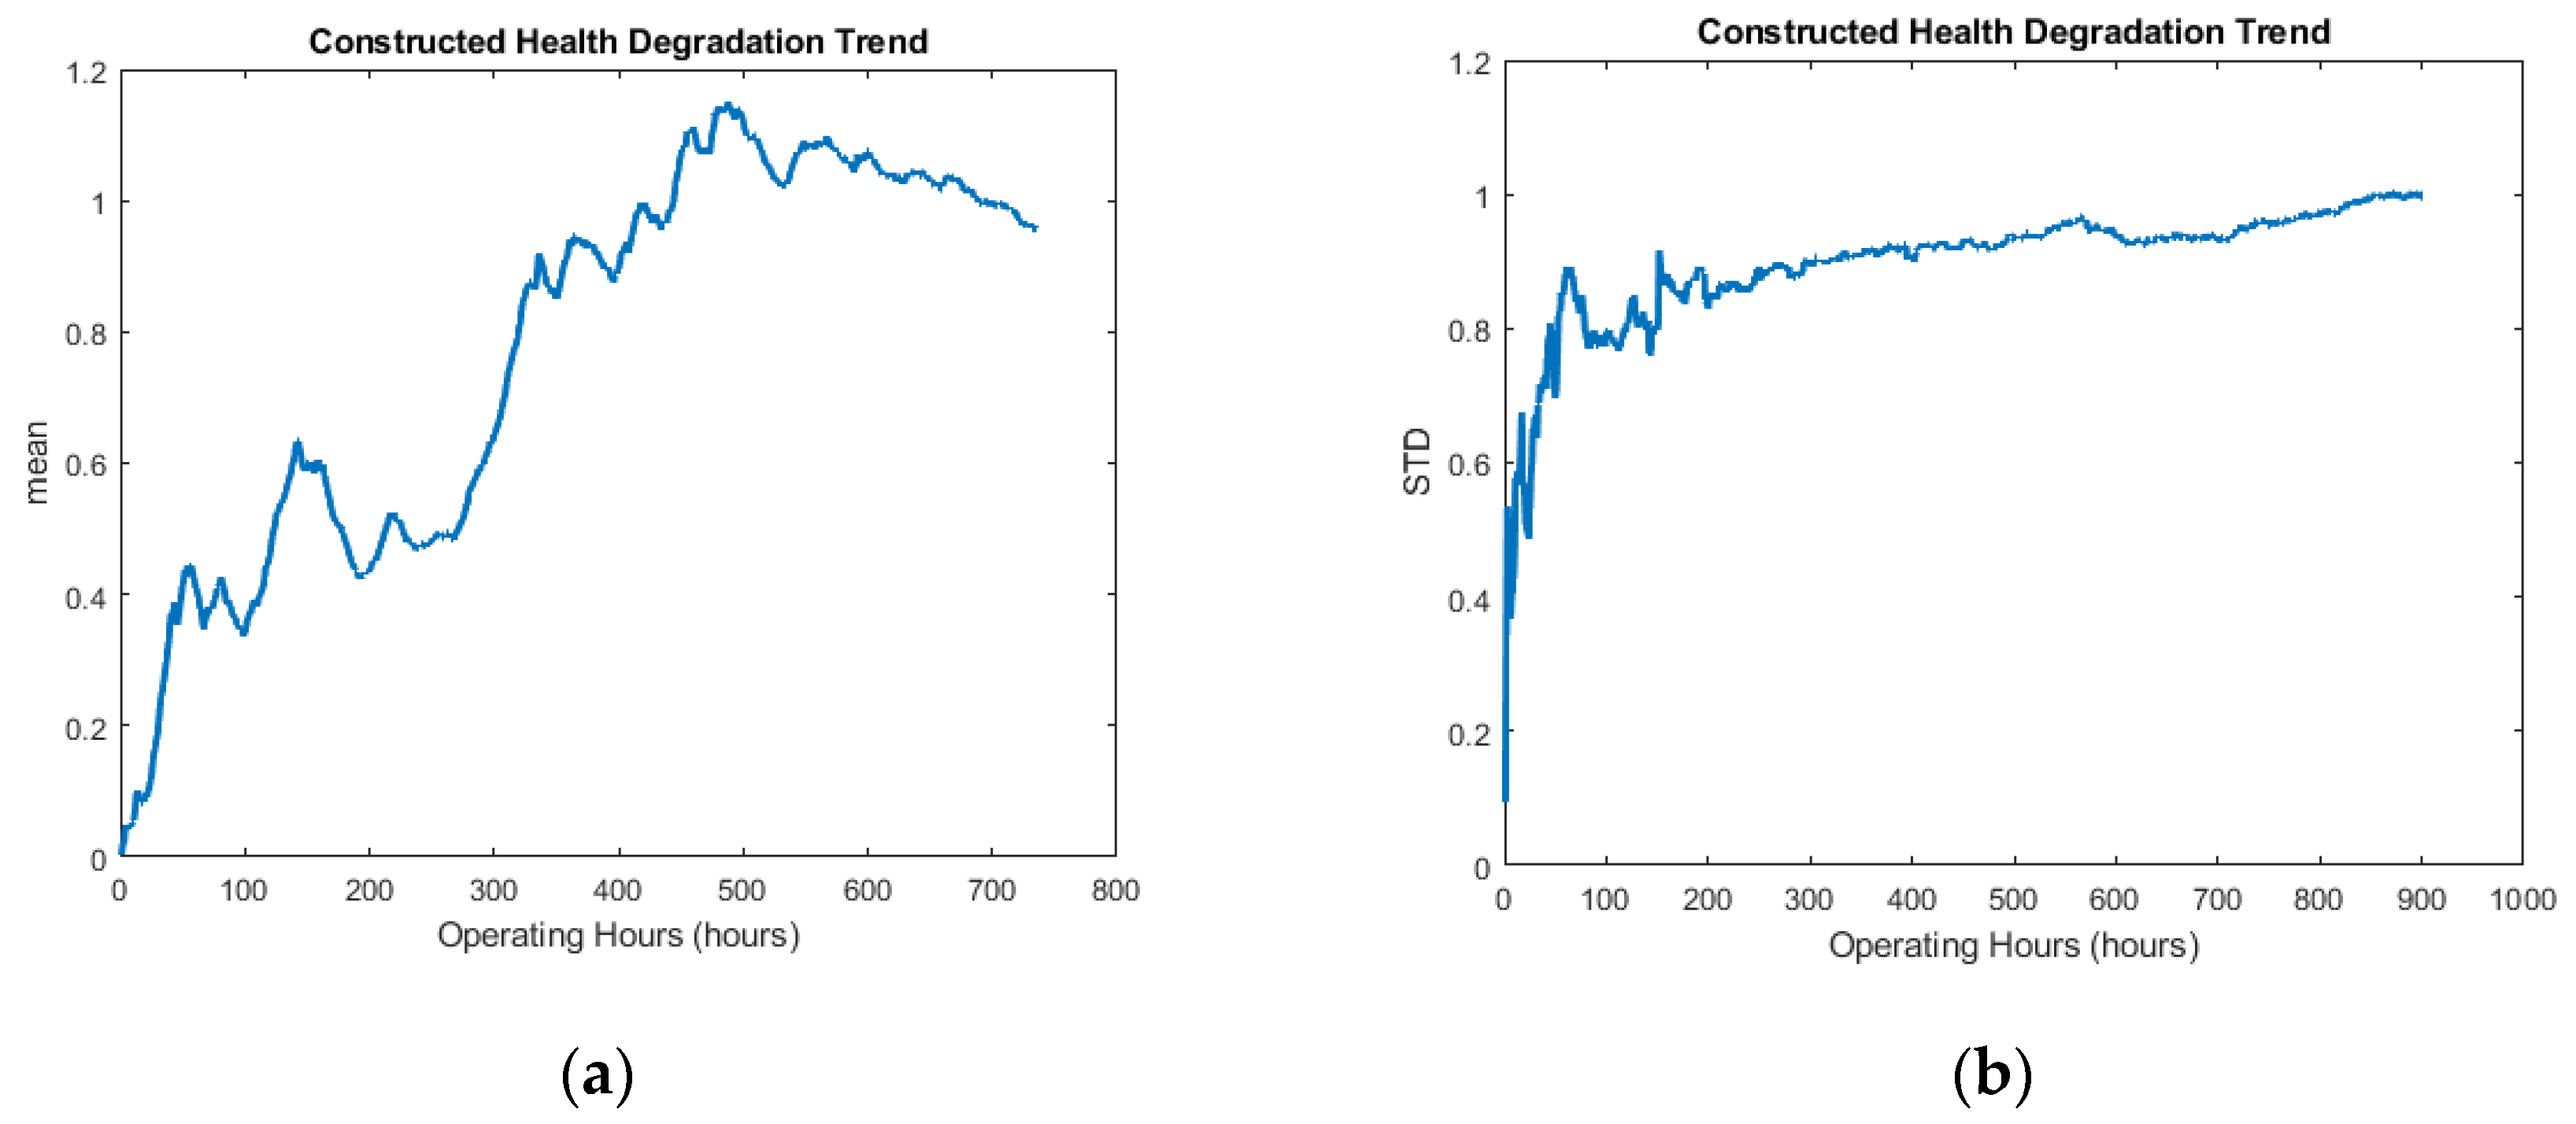
Figure 5.
Increasing trends of slope points (a,c) and selected data points of HDTs (b,d) for channel 2 and channel 4, respectively.
Figure 5.
Increasing trends of slope points (a,c) and selected data points of HDTs (b,d) for channel 2 and channel 4, respectively.
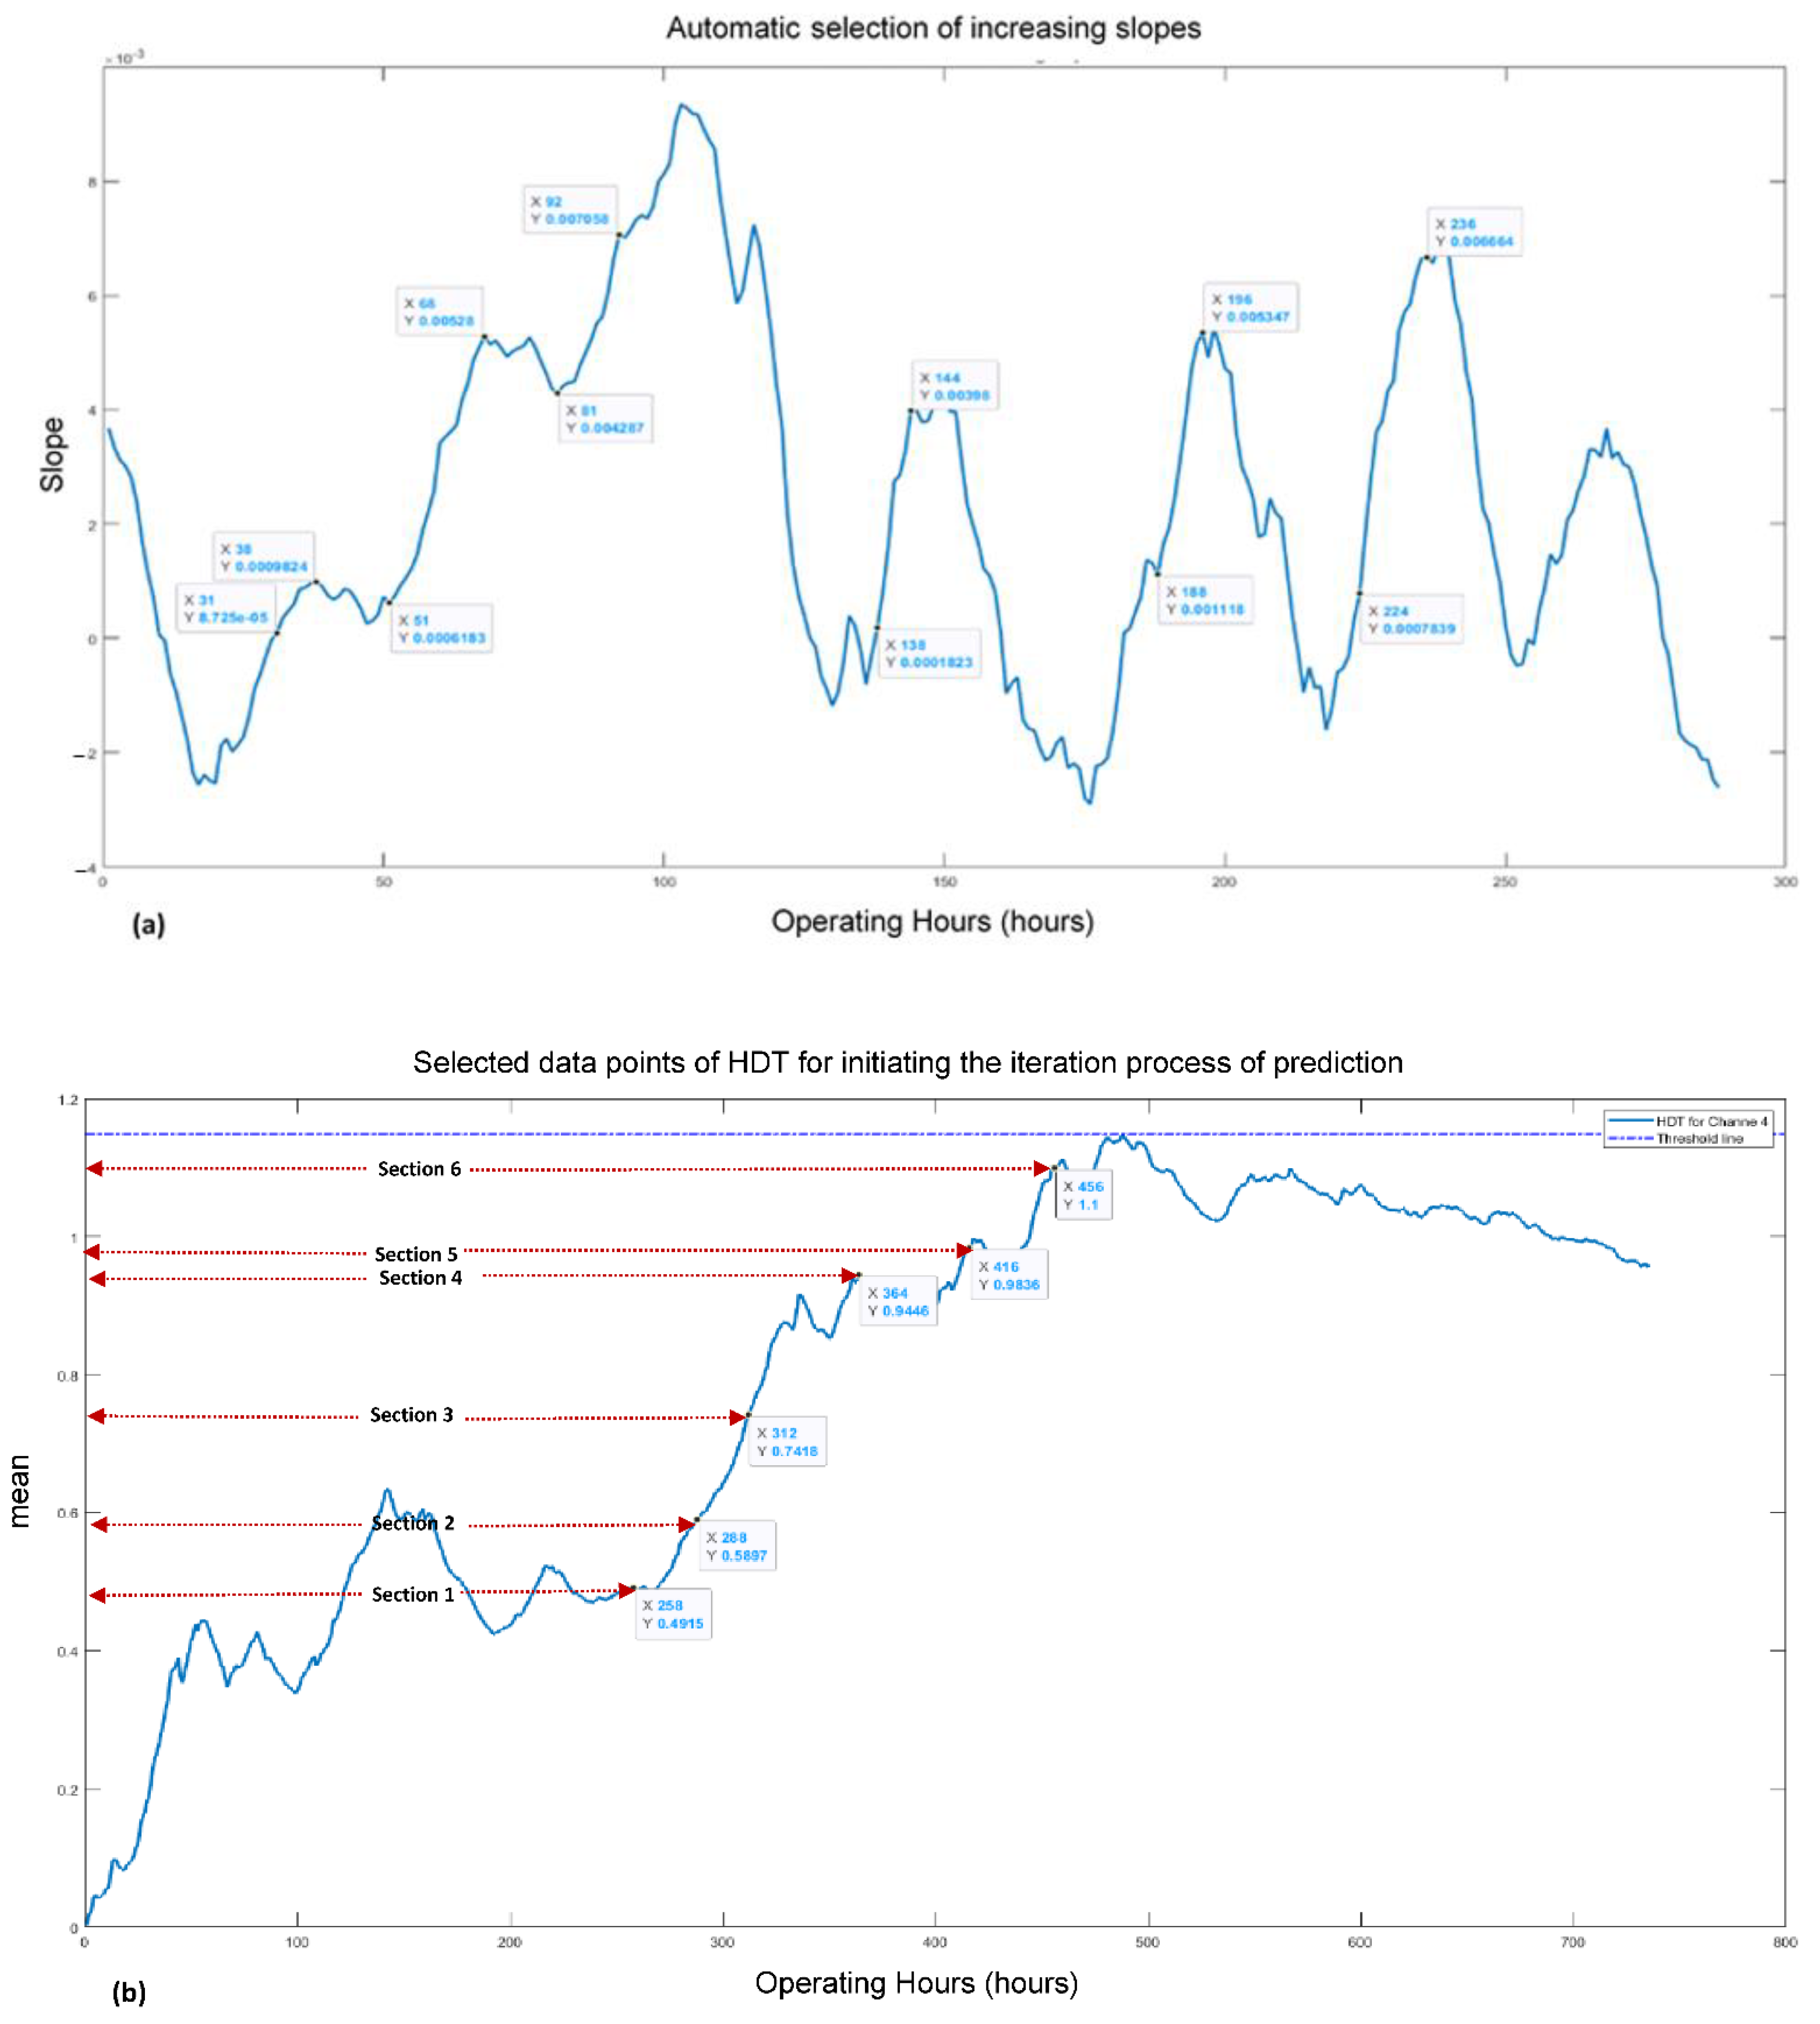
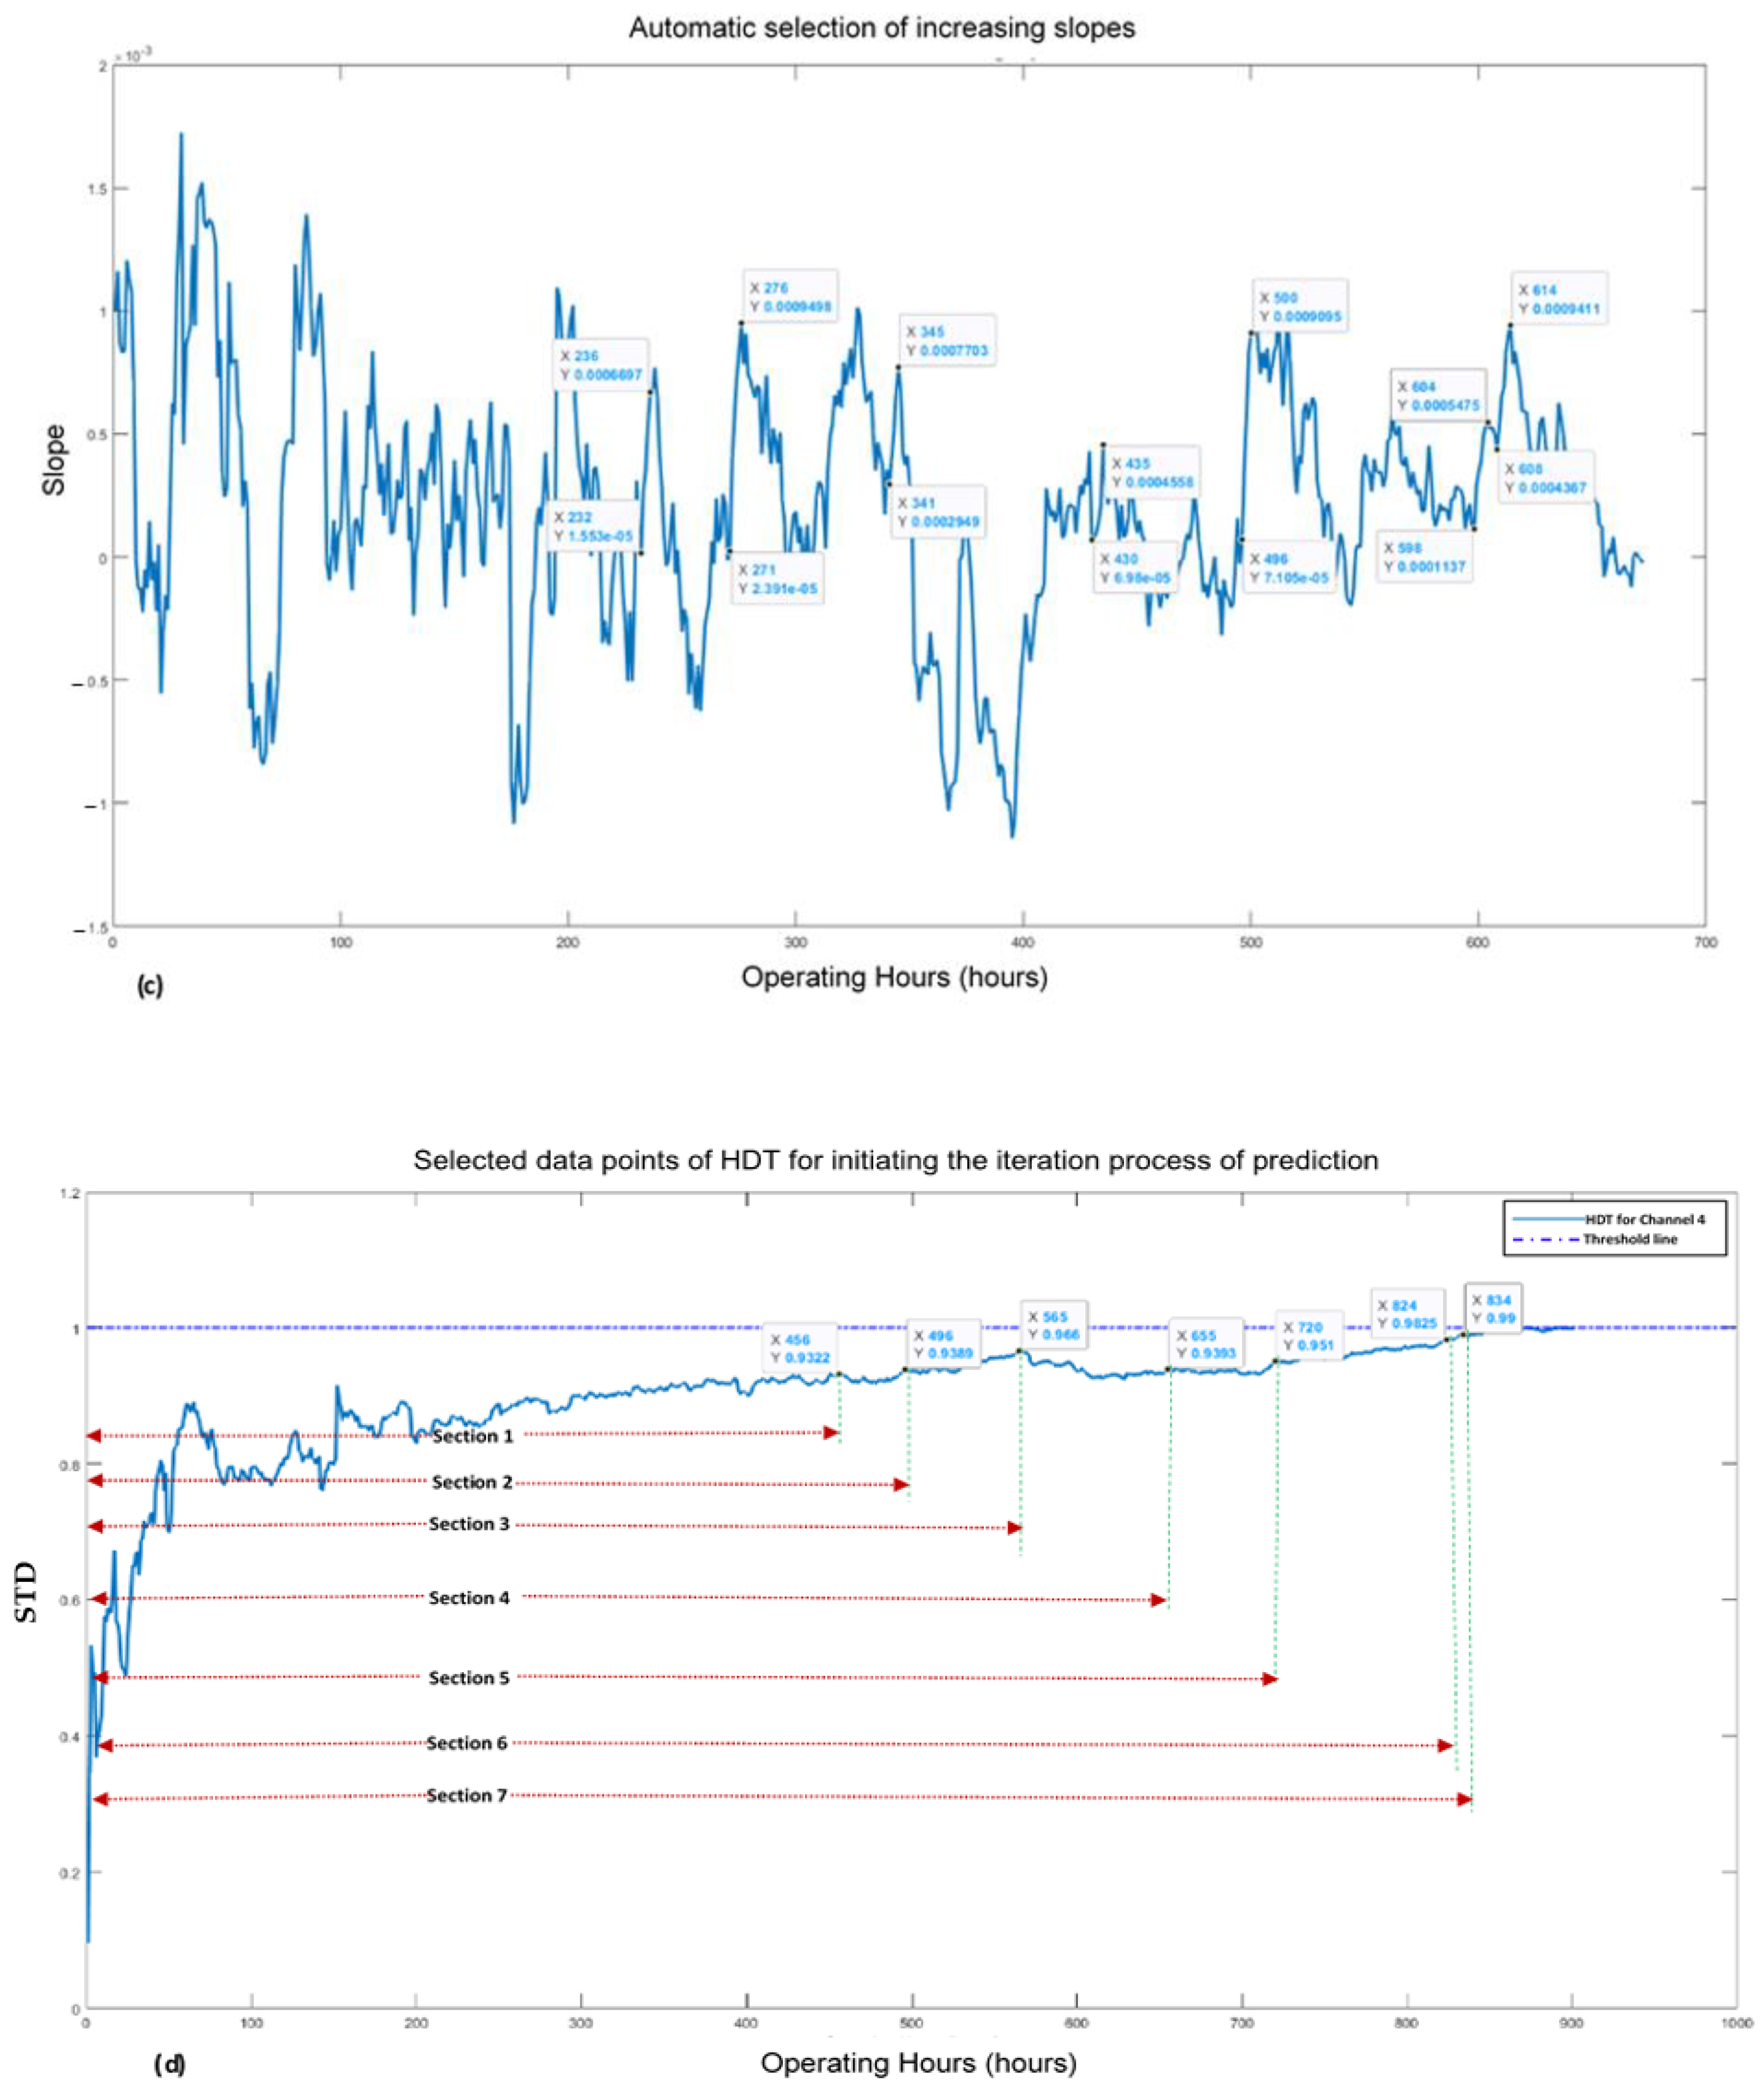
Figure 6.
The architecture of the developed hybrid deep LSTM model.
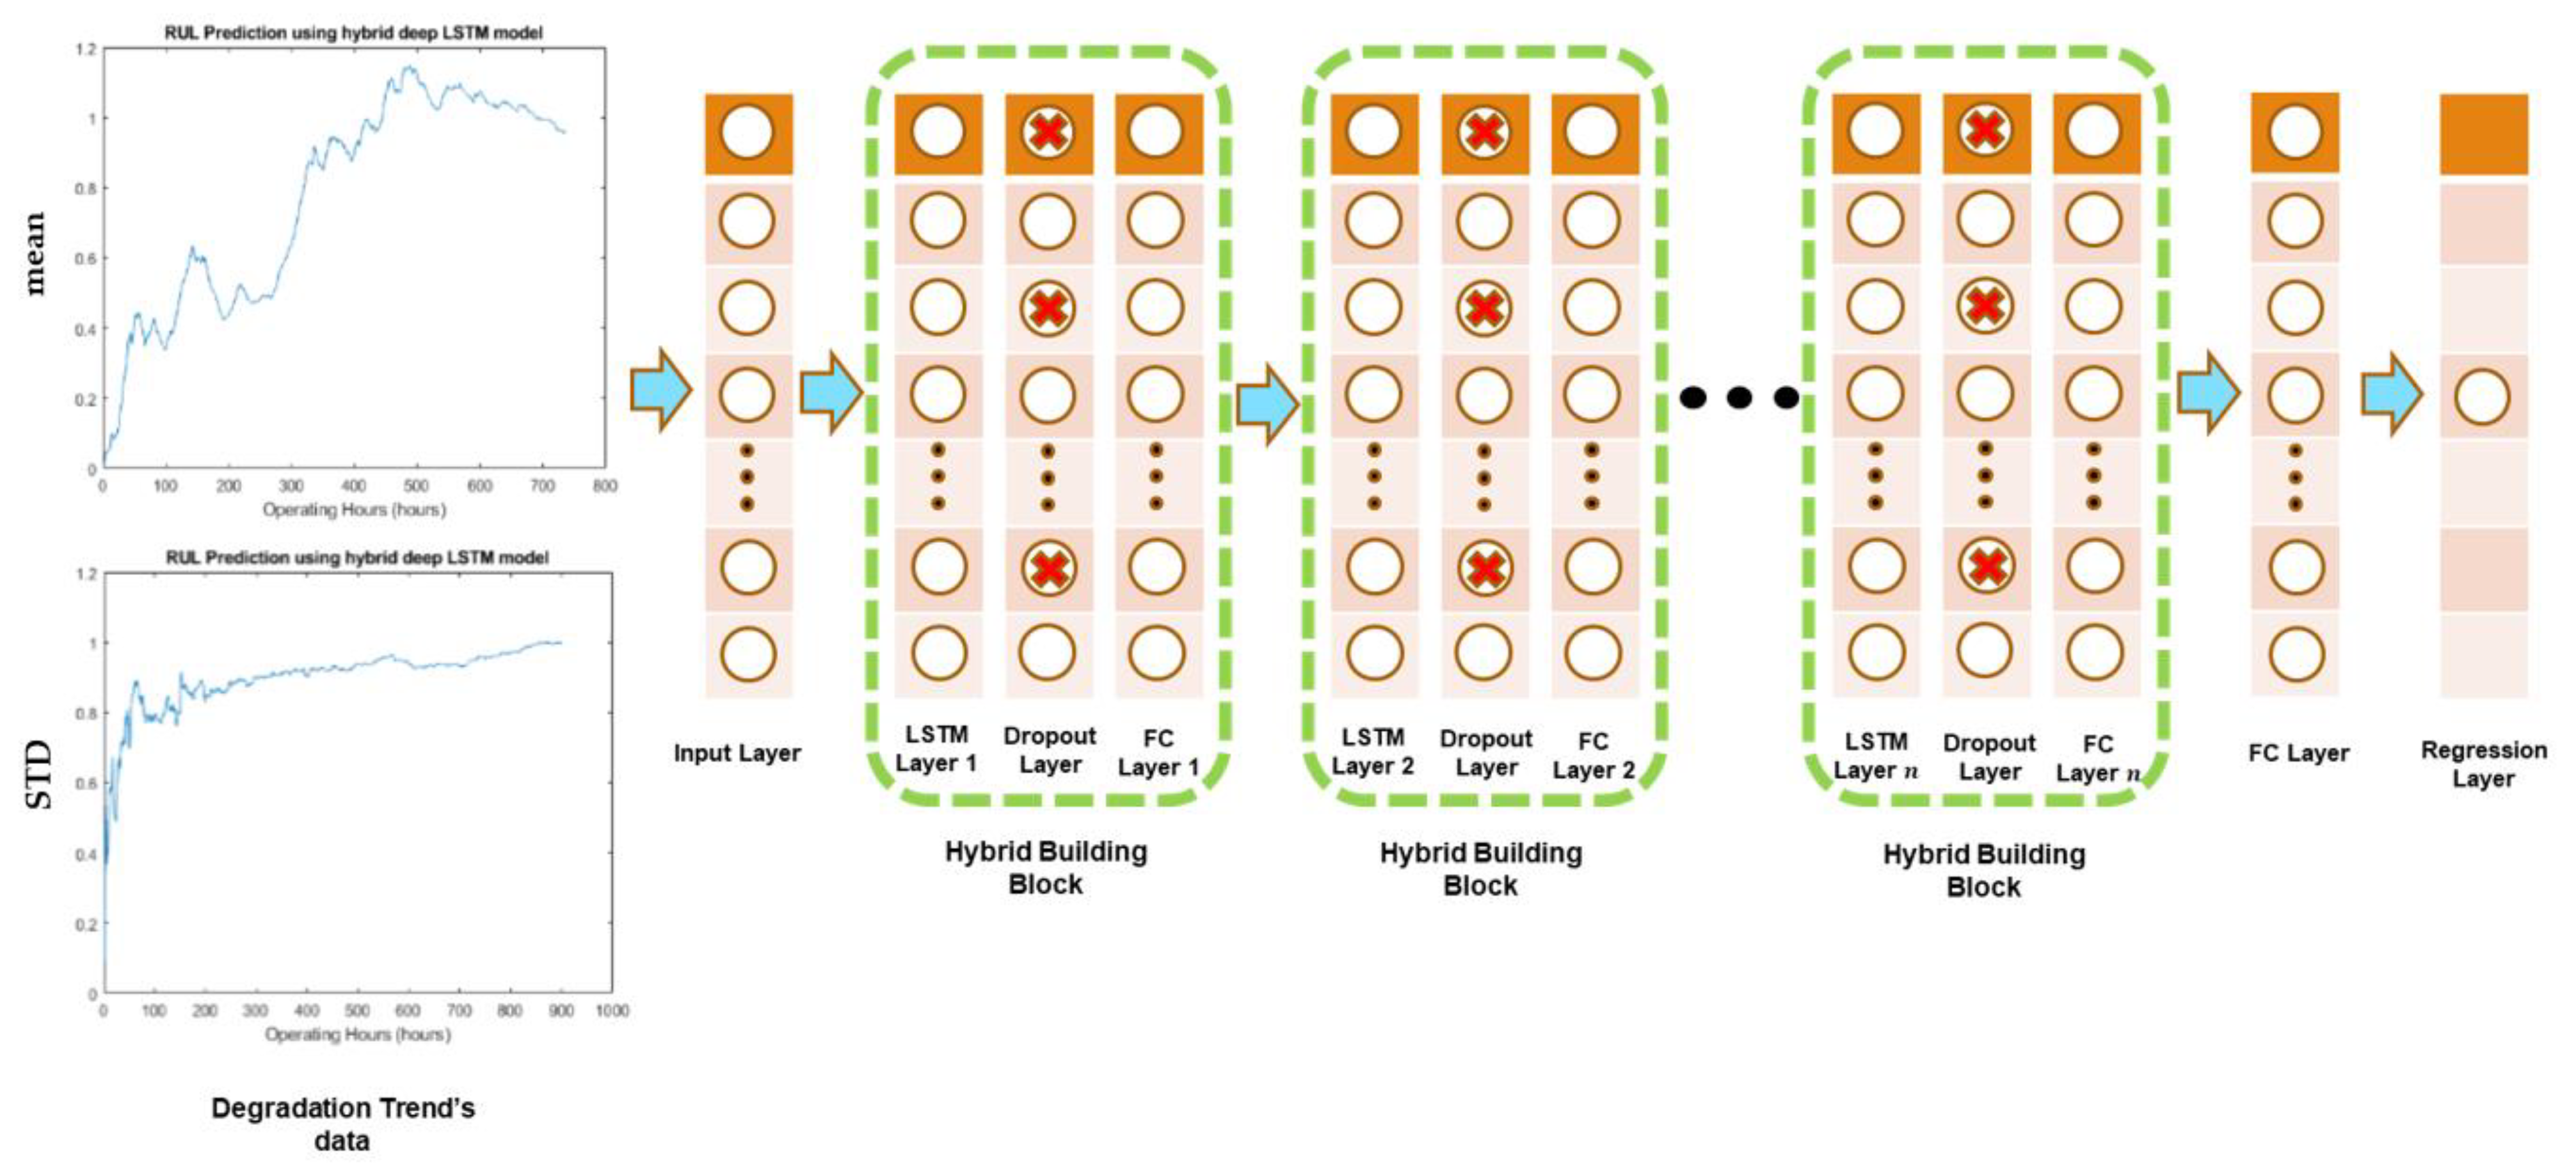
Figure 7.
Accepted or rejected prediction point for becoming the part of the input vector for the next iteration in (a) channel 2 and in (b) channel 4.
Figure 7.
Accepted or rejected prediction point for becoming the part of the input vector for the next iteration in (a) channel 2 and in (b) channel 4.
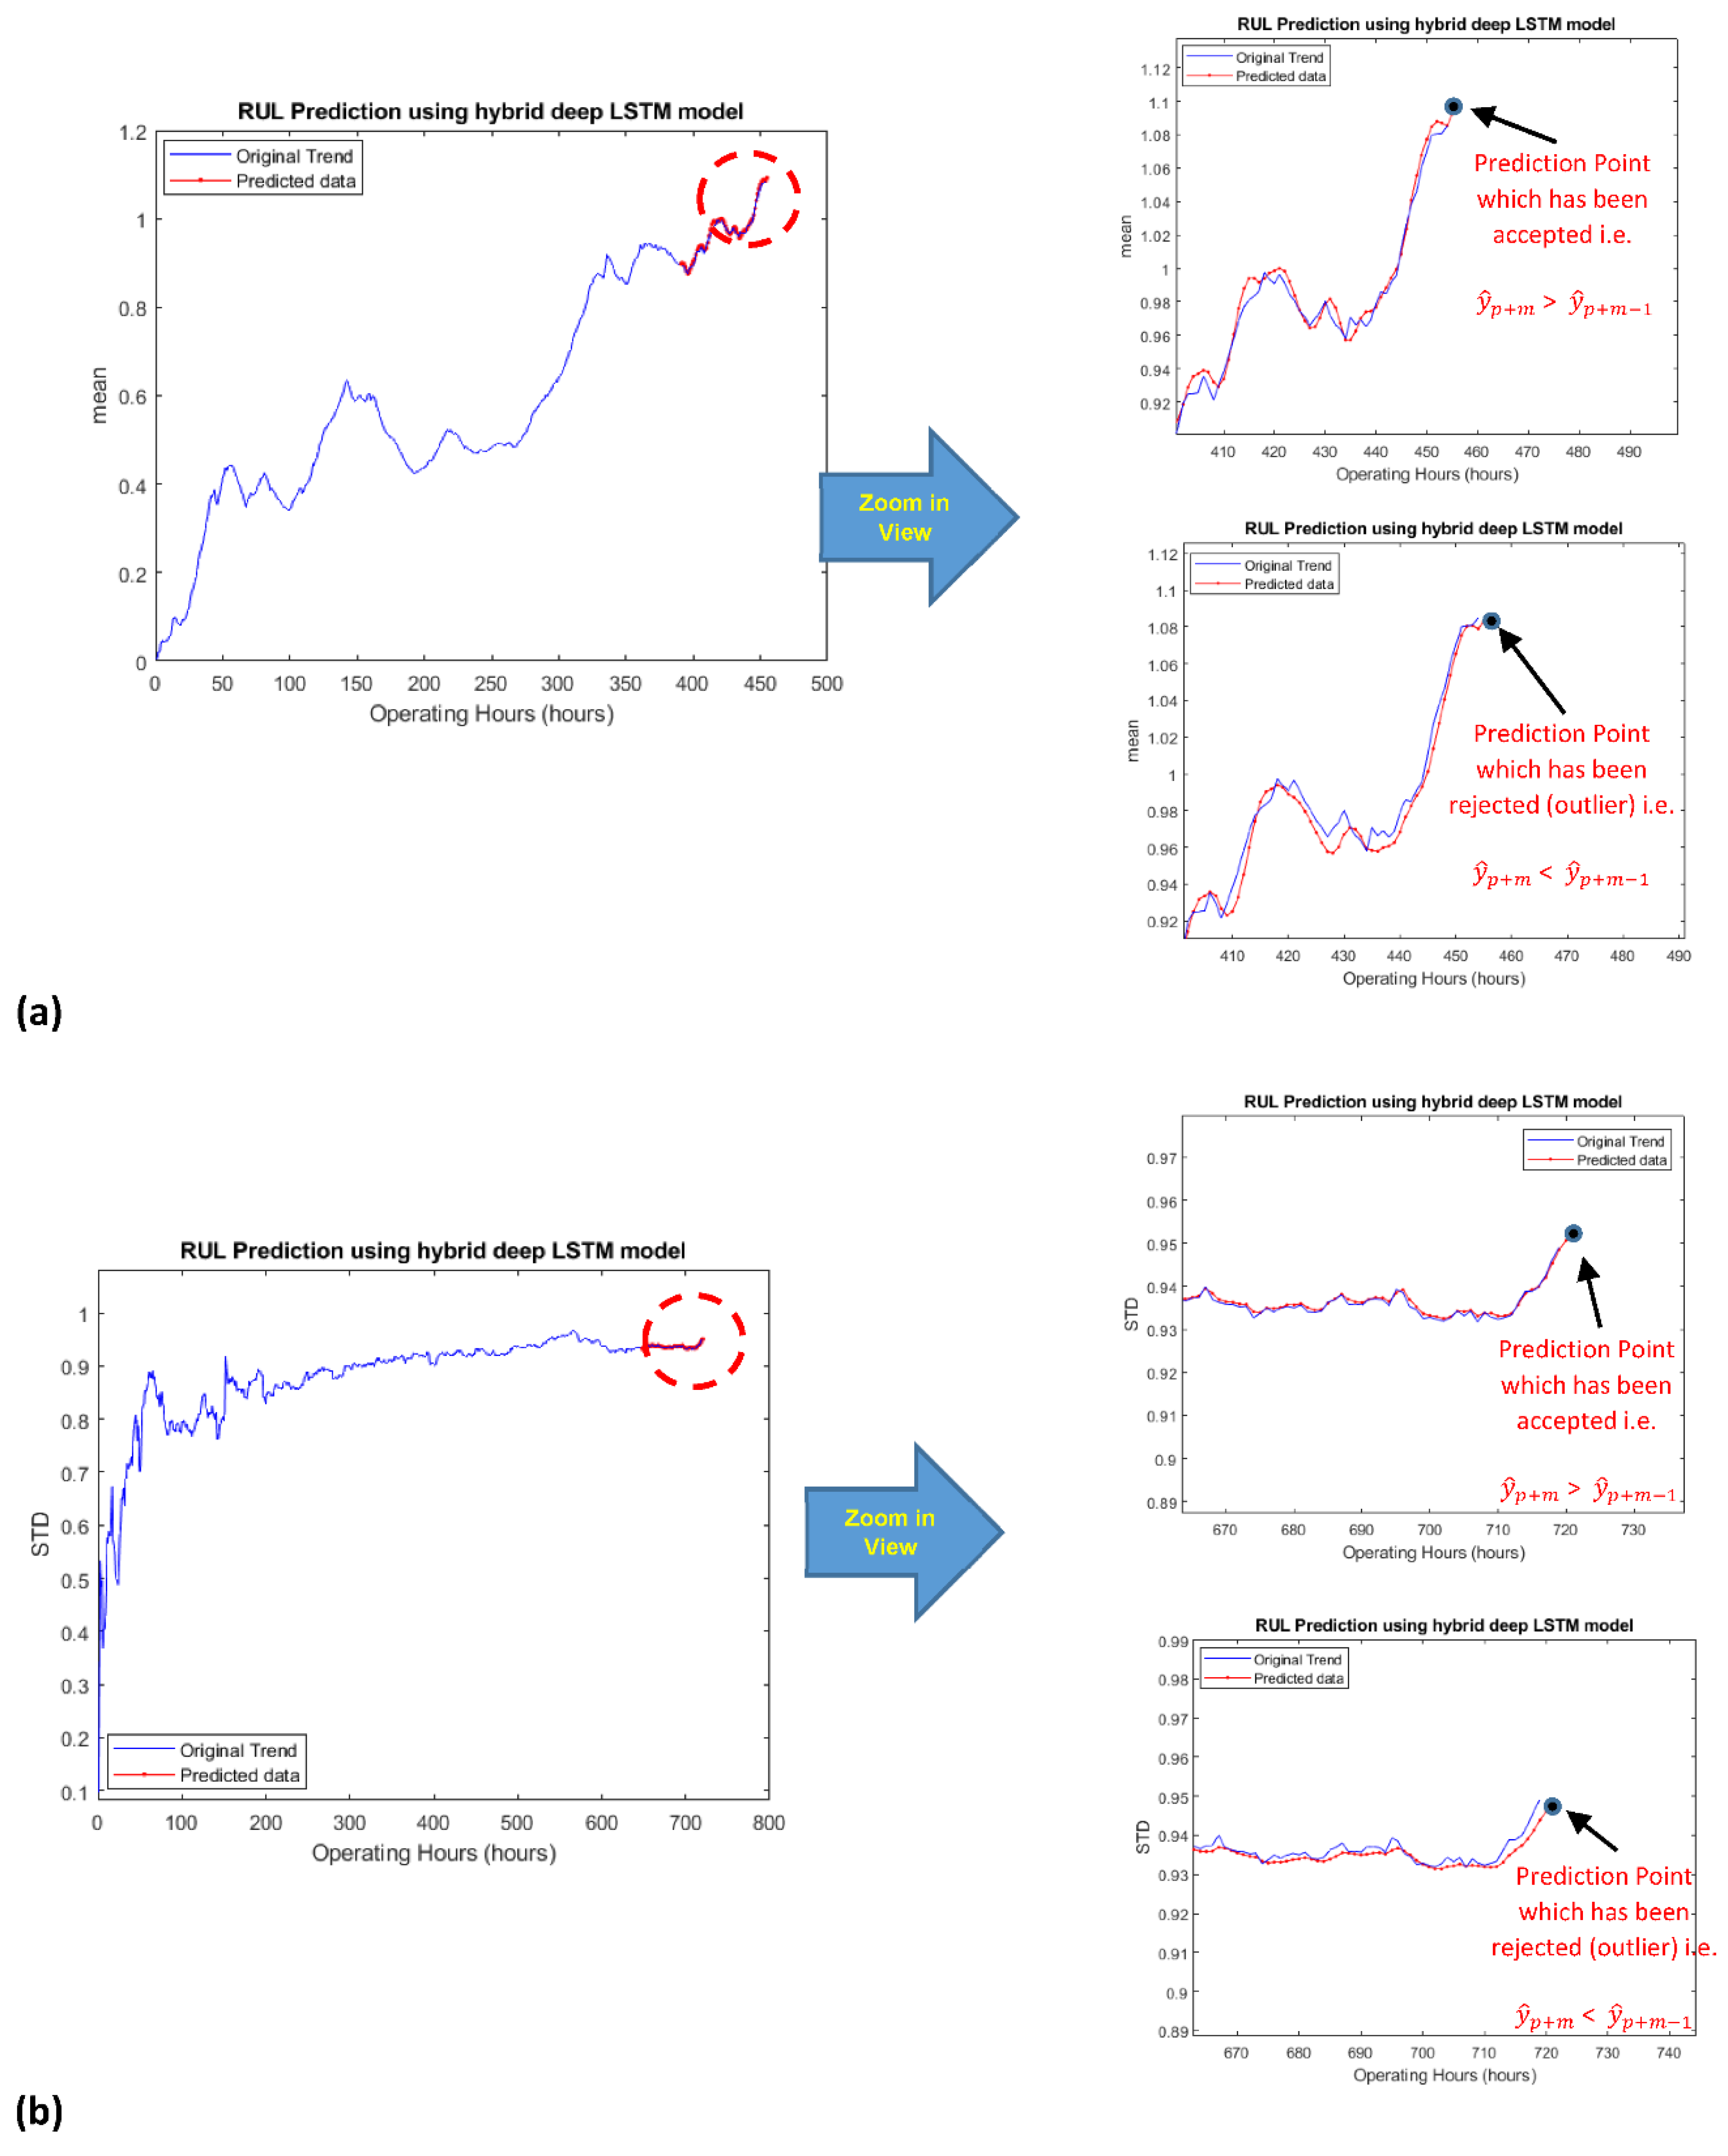
Figure 8.
Online RUL prediction results obtained by the curve-fitting and proposed methods for channel 2, (a–f).
Figure 8.
Online RUL prediction results obtained by the curve-fitting and proposed methods for channel 2, (a–f).
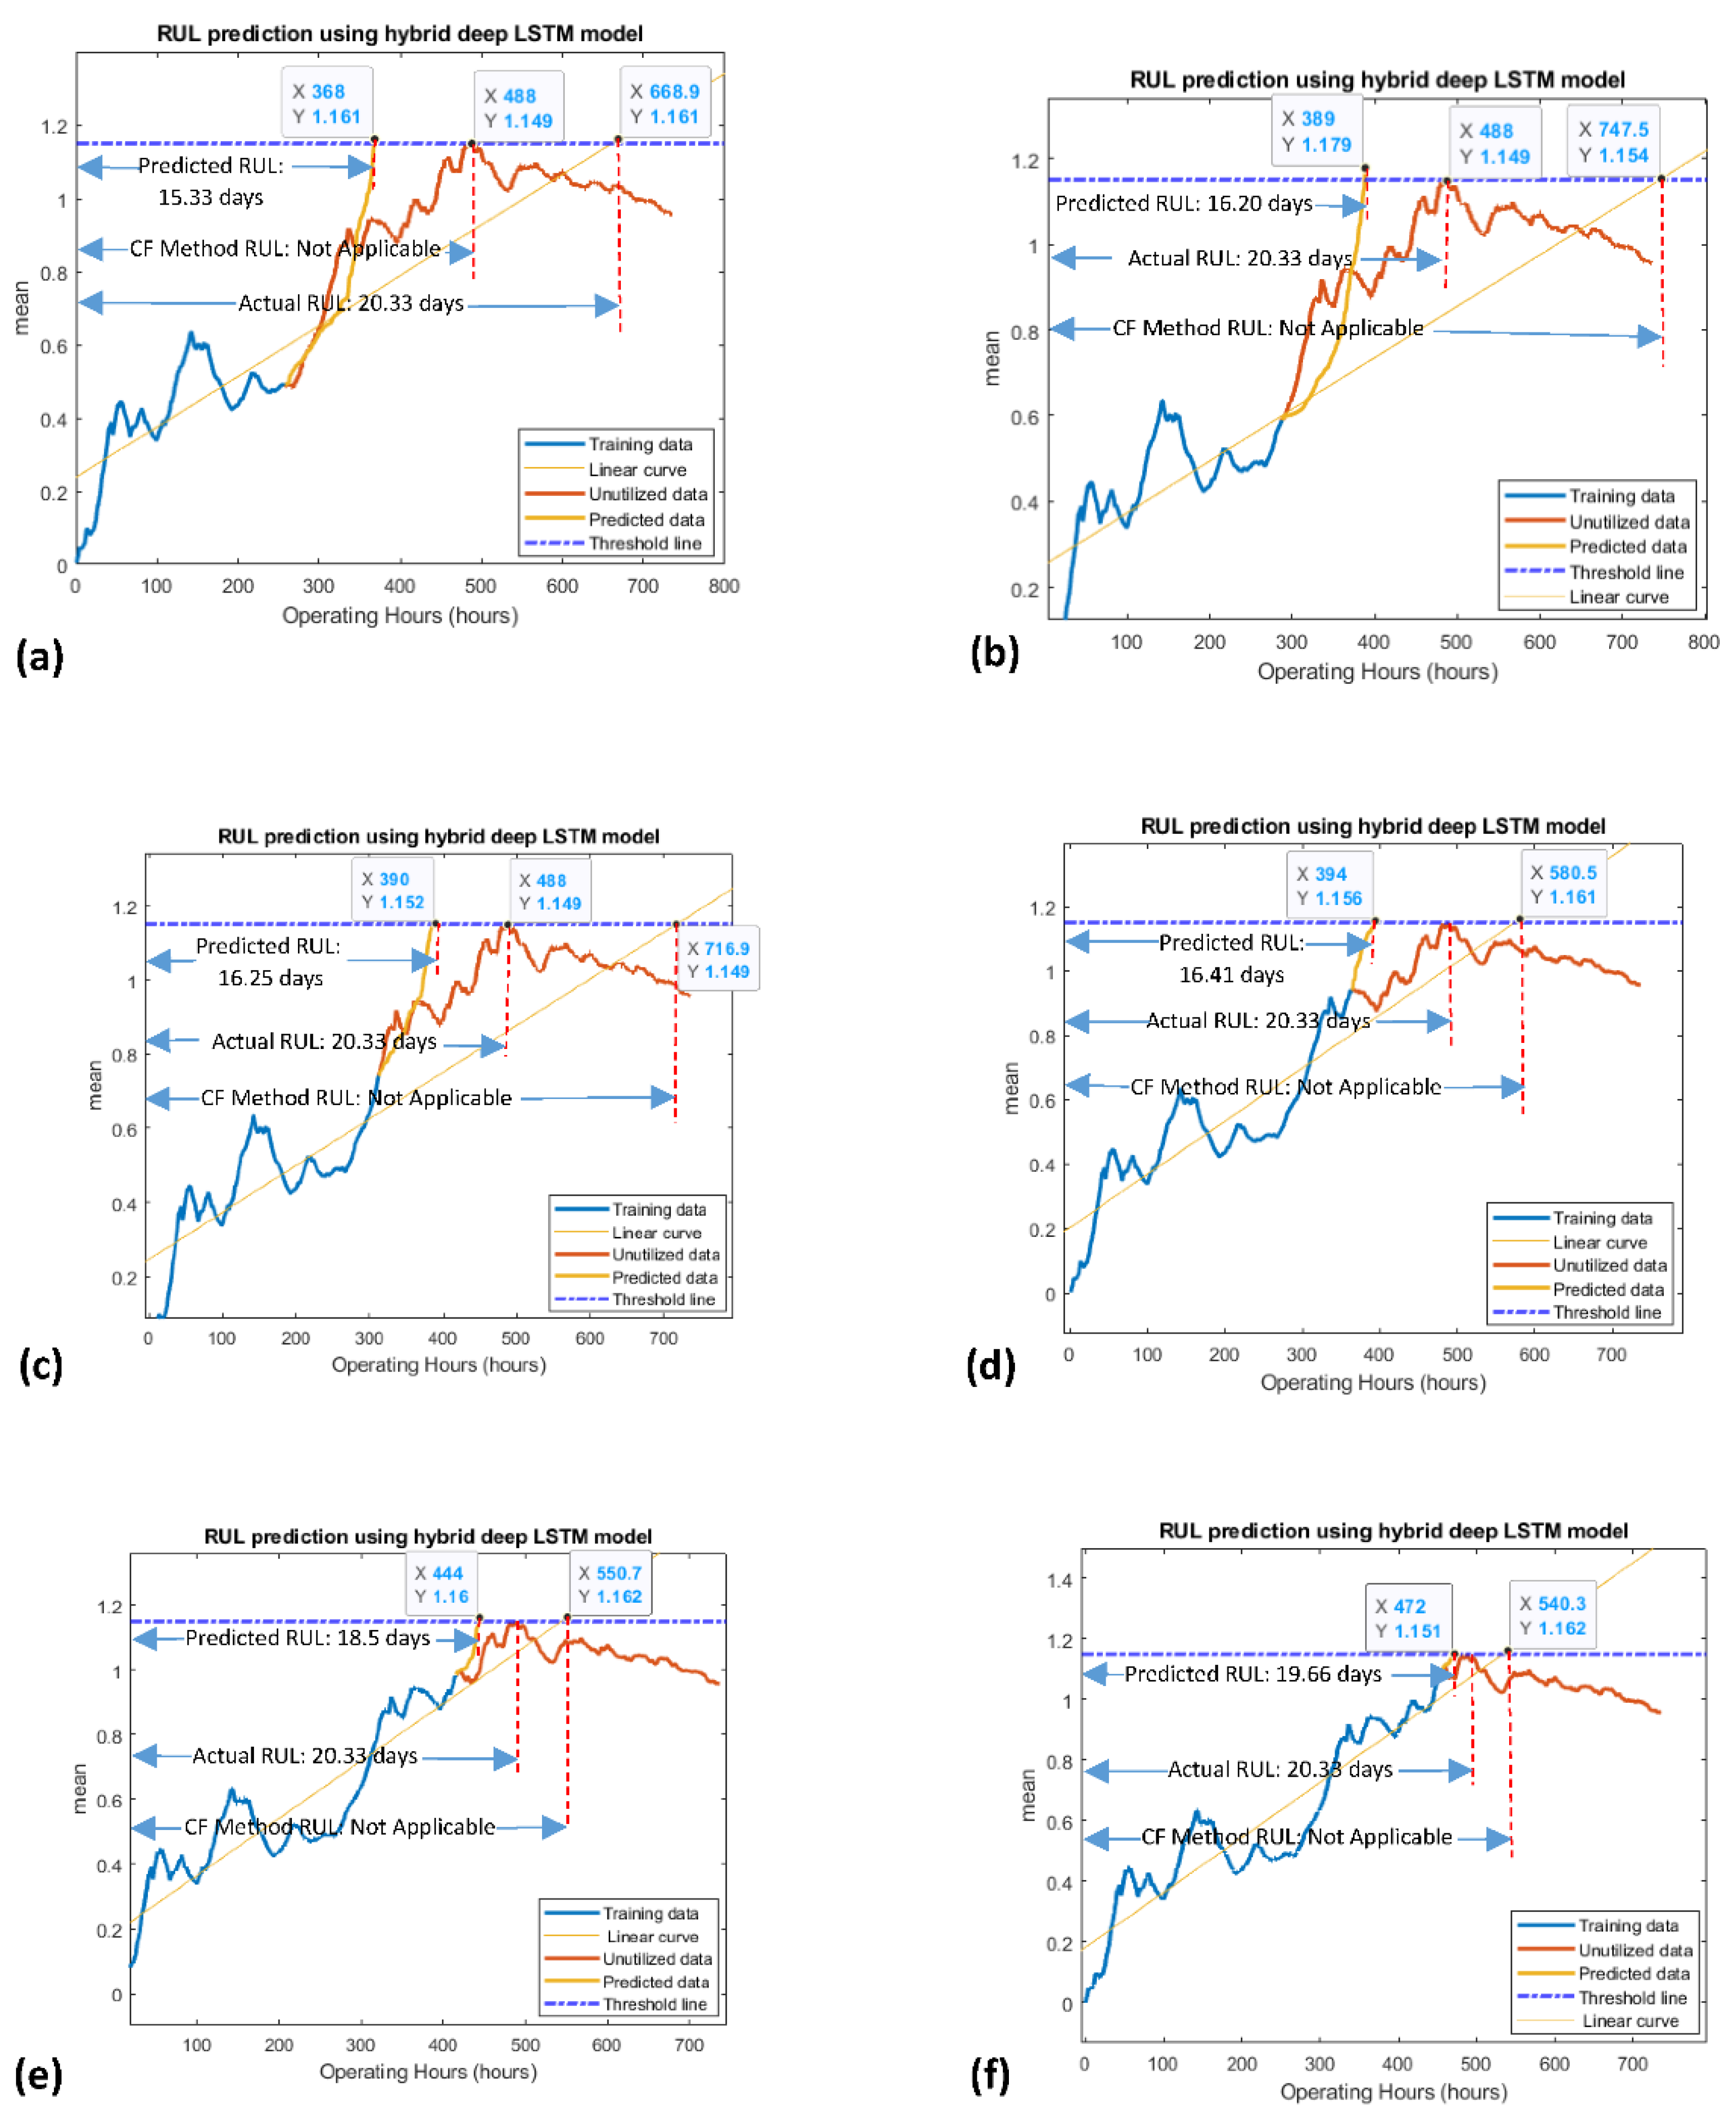
Figure 9.
Online RUL prediction results, obtained by the curve-fitting and proposed methods for channel 4, (a–g).
Figure 9.
Online RUL prediction results, obtained by the curve-fitting and proposed methods for channel 4, (a–g).

Table 1.
Criteria used for data filtering.
| Domain | Indicator | Pass Range |
|---|---|---|
| Time Domain | 1. RMS | X > 0.01 |
| 2. Kurtosis | X > 20 | |
| 3. Percentage mean difference | X < 25% | |
| Frequency Domain | 4. Kurtosis | X < 1000 |
Table 2.
The selected criteria for separating valid and invalid data sets.
| Indicator | Pass Score | Valid | Invalid |
|---|---|---|---|
| 1. RMS (Time domain) | 1 | S ≥ 3 | S < 3 |
| 2. Kurtosis (Time domain) | 1 | ||
| 3. Percentage mean difference (time domain) | 1 | ||
| 4. Kurtosis (Frequency domain) | 1 |
Table 3.
RUL predicted by developed and other existing models for channel 2.
| Channel 2 Datasets | ||||
|---|---|---|---|---|
| No. of Operating Hours (Hours) | Actual RUL with respect to Threshold Point (Days) | Predicted RUL (Days) | Accuracy (%) | |
| Proposed Method | 258 | 20.33 | 15.33 | 75.40 |
| Curve-fitting method | Not Applicable | - | ||
| NARX | Not Applicable | - | ||
| Proposed Method | 288 | 20.33 | 16.20 | 79.60 |
| Curve-fitting method | Not Applicable | - | ||
| NARX | - | |||
| Proposed Method | 312 | 20.33 | 16.25 | 79.93 |
| Curve-fitting method | Not Applicable | - | ||
| NARX | Not Applicable | - | ||
| Proposed Method | 364 | 20.33 | 16.41 | 80.71 |
| Curve-fitting method | Not Applicable | - | ||
| NARX | Not Applicable | - | ||
| Proposed Method | 416 | 20.33 | 18.5 | 90.99 |
| Curve-fitting method | Not Applicable | - | ||
| NARX | Not Applicable | - | ||
| Proposed Method | 456 | 20.33 | 19.66 | 96.70 |
| Curve-fitting method | Not Applicable | - | ||
| NARX | 19.37 | 95.27 | ||
Table 4.
RUL predicted by developed and other existing models for channel 4.
| Channel 4 Datasets | ||||
|---|---|---|---|---|
| No. of Operating Hours (hours) | Actual RUL with respect to Threshold Point (Days) | Predicted RUL (Days) | Accuracy (%) | |
| Proposed Method | 456 | 36.33 | 20.45 | 56.28 |
| Curve-fitting method | 20.76 | 57.14 | ||
| NARX | Not Applicable | - | ||
| Proposed Method | 496 | 36.33 | 22.00 | 60.55 |
| Curve-fitting method | 22.43 | 61.73 | ||
| NARX | Not Applicable | - | ||
| Proposed Method | 565 | 36.33 | 24.16 | 66.50 |
| Curve-fitting method | 24.38 | 67.10 | ||
| NARX | Not Applicable | - | ||
| Proposed Method | 655 | 36.33 | 29.79 | 81.99 |
| Curve-fitting method | 28.28 | 77.84 | ||
| NARX | Not Applicable | - | ||
| Proposed Method | 720 | 36.33 | 31.91 | 87.83 |
| Curve-fitting method | 31.07 | 85.52 | ||
| NARX | Not Applicable | - | ||
| Proposed Method | 824 | 36.33 | 34.95 | 96.20 |
| Curve-fitting method | 33.58 | 92.43 | ||
| NARX | 34.66 | 95.40 | ||
| Proposed Method | 834 | 36.33 | 35.20 | 96.88 |
| Curve-fitting method | 34.14 | 93.97 | ||
| NARX | 35.04 | 96.44 | ||
Table 5.
Actual and predicted RULs in terms of Weights.
| Operation Hours | ||||
|---|---|---|---|---|
| Channel 2 Datasets | ||||
| 258 | 9.58 | 4.58 | Not Applicable | Not Applicable |
| 288 | 8.33 | 4.2 | Not Applicable | Not Applicable |
| 312 | 7.33 | 3.25 | Not Applicable | Not Applicable |
| 364 | 5.17 | 1.25 | Not Applicable | Not Applicable |
| 416 | 3 | 1.17 | Not Applicable | Not Applicable |
| 456 | 1.33 | 0.66 | Not Applicable | Not Applicable |
| Channel 4 Datasets | ||||
| 456 | 17.33 | 1.45 | 1.76 | Not Applicable |
| 496 | 15.67 | 1.34 | 1.77 | Not Applicable |
| 565 | 12.79 | 0.62 | 0.84 | Not Applicable |
| 655 | 9.04 | 2.5 | 0.99 | Not Applicable |
| 720 | 6.33 | 1.91 | 1.07 | Not Applicable |
| 824 | 2 | 0.62 | −0.75 | 0.33 |
| 834 | 1.58 | 0.45 | −0.61 | 0.29 |
Table 6.
The weighted average accuracy of prediction for channel 2 and channel 4.
| Weighted Average Accuracy of Prediction | |||||
|---|---|---|---|---|---|
| Channel 2 Datasets | Channel 4 Datasets | ||||
| Proposed method | Curve-fitting Method | NARX | Proposed method | Curve-fitting Method | NARX |
| 42.15% | Not Applicable | Not Applicable | 22.01% | 7.29% | Not Applicable |
Publisher’s Note: MDPI stays neutral with regard to jurisdictional claims in published maps and institutional affiliations. |
© 2022 by the authors. Licensee MDPI, Basel, Switzerland. This article is an open access article distributed under the terms and conditions of the Creative Commons Attribution (CC BY) license (https://creativecommons.org/licenses/by/4.0/).
Share and Cite
MDPI and ACS Style
Khan, M.M.; Tse, P.W.; Yang, J. A Novel Framework for Online Remaining Useful Life Prediction of an Industrial Slurry Pump. Appl. Sci. 2022, 12, 4839. https://doi.org/10.3390/app12104839
AMA Style
Khan MM, Tse PW, Yang J. A Novel Framework for Online Remaining Useful Life Prediction of an Industrial Slurry Pump. Applied Sciences. 2022; 12(10):4839. https://doi.org/10.3390/app12104839
Chicago/Turabian StyleKhan, Muhammad Mohsin, Peter W. Tse, and Jinzhao Yang. 2022. "A Novel Framework for Online Remaining Useful Life Prediction of an Industrial Slurry Pump" Applied Sciences 12, no. 10: 4839. https://doi.org/10.3390/app12104839
Note that from the first issue of 2016, this journal uses article numbers instead of page numbers. See further details here.