
Nondestructive Surface Crack Detection of Laser-Repaired Components by Laser Scanning Thermography


1
AML, Department of Engineering Mechanics, Tsinghua University, Beijing 100084, China
2
School of Aerospace Engineering, Beijing Institute of Technology, Beijing 100081, China
3
College of Mechanical and Vehicle Engineering, Hunan University, Changsha 410082, China
*
Authors to whom correspondence should be addressed.
Appl. Sci. 2022, 12(11), 5665; https://doi.org/10.3390/app12115665
Submission received: 30 April 2022
/
Revised: 26 May 2022
/
Accepted: 1 June 2022
/
Published: 2 June 2022
(This article belongs to the Collection Nondestructive Testing (NDT))
Abstract
:As a revolutionary new technique, laser-engineered net shaping (LENS) is a layer additive manufacturing process that enables accurate, rapid and automatic repair of industrial component damage. In the laser repair (LR) process or in service, surface cracks can appear, which have a detrimental effect on the repair quality and the mechanical performance; therefore, the surface crack detection of repaired components has attracted much attention. Laser spot thermography is an important nondestructive testing method with the advantages of non-contact, full-field and high precision, which shows great potential in the crack detection of repaired components. The selection of thermographic process parameters and the optimization of thermal image processing algorithms are key to the success of the nondestructive detection. In this paper, the influence of material properties and thermographic process parameters on the surface temperature gradient is studied based on the simulation of laser spot thermal excitation, and the selection windows of thermographic process parameters for iron-based and nickel-based alloys are obtained, which is applied to the surface crack detection of repaired components. To improve the computational efficiency of thermal images, the Prewitt edge detection algorithm is used in the thermal image processing, which realized fast extraction of cracks with a high signal-to-noise ratio (SNR), and the detection sensitivity of crack width can reach 10 μm. To further study the influence of surface roughness on the thermographic detection, repair layers with and without polishing process are characterized, which show that the Prewitt edge detection algorithm is well applicable to crack detection on surfaces with different roughness level.
1. Introduction
Laser-engineered net shaping (LENS) is a metal additive manufacturing technique that enables laser repair (LR) of industrial components, in which metallic powders are melted by high energy laser, and consecutive layers are additively deposited. LENS has become one of the most important repairing methods for damaged components, considering its advantages in free forming, automation and high efficiency [1,2,3,4,5,6].
The laser-repaired components generally consist of the repair zone (containing the cladding and fusion zones), the heat-affected zone and the substrate. The defects and their distribution characteristics in the repaired components differ significantly from those using conventional metal forming processes, especially in the repair zone, where multiple types of defects may exist [1,5]. It has been shown that the repaired components are prone to generate surface cracks, which can seriously affect the repair quality and even leads to the mechanical failure of the repaired components. Therefore, the nondestructive testing of surface cracks is required to guarantee the quality and structural integrity of repaired components, a challenge which receives much attention from industry and academia [7,8,9,10]. In the detection of surface cracks, thermography methods show great potential due to their advantages of being non-contact and full-field [11,12,13,14,15,16].
Compared with traditional active thermography techniques, laser thermography retains the characteristics of being non-contact and full-field, and also has the advantage of high detection accuracy. It has a good application potential in nondestructive testing and evaluation of surface cracks [17,18,19,20,21]. Pech-May et al. obtained semi-analytical expression of surface temperature for a model with a semi-infinite crack under laser pulse and lock-in excitation, and verified the validity of the model by lock-in thermography of stainless steel and glass carbon samples [22,23,24]. Based on the analytical results under laser pulse excitation, González et al. obtained the temperature response under laser scanning excitation by convolution of time, providing a reliable theoretical basis for the optimization of thermographic process parameters of laser scanning thermography (LST) [25]. To reduce the detection time, Li et al. adopted the line laser scanning thermography method, which could realize the rapid detection of cracks on smooth titanium specimens [26]. In order to improve the identification efficiency and accuracy, Jiao et al. proposed a laser multi-mode scanning thermography (SMLT) method combining fast scanning of line laser and fine scanning of point laser, which has a large detection range, detection speed and sensitivity, and can effectively detect the position and shape of cracks on the surface of TBC material [10]. According to the existing research results, the laser thermography method generally determines key thermographic process parameters such as laser scanning speed and power through comparative experiments, and this method has high requirements on the surface flatness of the test piece [27]. However, the surface state of the LR components is complex, e.g., the surface is rough and there are periodic cladding tracks, which poses challenge to the detection of crack defects. It is imperative to optimize the thermal image processing algorithm to improve the efficiency and accuracy of detection [20].
Laser spot thermography is an important way to realize laser thermography. In this paper, in order to improve the detection accuracy and efficiency of laser spot thermography, the optimization of thermographic process parameters and the development of thermal image processing algorithm are studied. Firstly, a simulation model with a vertical surface crack was established based on the finite element method, and the surface temperature response of the model under different heat source parameters was calculated. Based on the simulation results, the influences of material properties, laser power and laser scanning speed, thermal image acquisition frequency on the temperature gradient at the crack were analyzed, and the windows for selecting laser scanning parameters were proposed for iron-based and nickel-based alloy materials. The optimized thermographic process parameters were applied to the surface crack detection of real repaired components, and the thermal image sequence based on laser scanning was used for post-processing. Then, the processing results of the one-order gradient algorithm, the second-order gradient algorithm and the edge detection algorithms were compared. The results show that the edge detection algorithm based on Prewitt operator has high precision in locating crack edges, and can achieve fast crack extraction with high signal-to-noise ratio (SNR). The detection sensitivity of crack width can reach 10 μm. To further study the influence of surface roughness on thermographic detection, repair layer with and without polishing process are detected. The results show that the periodic temperature distribution is caused by the periodic cladding tracks. When the amplitude of surface fluctuation is small, the global threshold segmentation algorithm can effectively eliminate the cladding track noise. When the amplitude of surface fluctuation is large, cladding noise has a great influence on crack identification results. The framework and technical route are shown in Figure 1.
2. Detection Principle
In order to perform theoretical analyses of laser spot thermography, a semi-infinite model is used with heat excitation on the surface by a circular Gaussian heat source, and the resultant heat conduction follows Fourier’s law. Ignoring the effects of heat convection and external radiation, Fourier’s law of heat conduction can be expressed as [26]:
where is the thermal diffusivity, , is the material density, and is the specific heat capacity. is the temperature distribution of the model under thermal excitation, the temperature change rate of each point after being heated is proportional to is the heat input per unit time, and if the effect of thermal excitation is removed, then .
For the semi-infinite model without crack, the surface temperature distribution along the y-axis direction under the excitation of gaussian pulse heat source is [22]:
Consider the semi-infinite model, which contains infinite surface vertical cracks. On the model surface, axis is perpendicular to the crack direction and axis is parallel to the crack direction, and circular Gaussian pulse heat source excitation is applied at a distance of d from the crack, as shown in Figure 2. The total energy obtained by the model is , and based on the heat conduction Equation (2) and the boundary conditions, the temperature distribution along y-axis can be obtained [22]:
where is the interference term of the crack on the temperature distribution, is the radius of the laser spot (at of the intensity), is the thermal diffusion length, and is the thermal effusivity. Air is the main filling medium inside the crack; its thermal conductivity is , and the width of the crack contained in the model is , so the thermal resistance coefficient of the crack is expressed as . reflects the resisting effect of the crack, and with the increase in , the blocking effect on heat conduction becomes more significant. is the heat absorption energy fraction of the model, which denotes the energy absorption efficiency. Then, , where is the y-axis coordinate of the laser spot center [22].
Based on Equations (3) and (4), we perform the calculations by MATLAB, and the thermal response of the cracked model under pulse excitation is obtained, as shown in Figure 3. Thus, the influence of material properties and laser power on the distribution of surface temperature and temperature gradient can be analyzed, which provides reference for the simulation and experiment. Several commonly used materials are selected, and their thermodynamic parameters are shown in Table 1. The distance between the circular Gaussian heat source and the crack is set as = 1 mm, the spot radius of the heat source is set as = 1 mm (at of the intensity), the total energy of the pulse heat source is set as = 300 mJ, and the excitation time is set as 0.3 s. The crack width is set as 40 μm and the thermal resistance coefficient at the crack is . At 0.05 s after excitation, the surface temperature distribution and temperature gradient of the model along y-axis are shown in Figure 3a,b, where the surface temperature gradient is defined as:
It can be seen from the results that there are significant temperature changes at the crack, so the temperature gradient can be used as the characteristic quantity to describe the shape and geometric distribution of the crack. The thermal conductivity has a significant effect on the temperature field amplitude and gradient. Note that the thermal gradient amplitude of titanium alloy material is the largest, and the crack characteristics are easier to be extracted. When studying the influence of laser power, a nickel-based alloy is selected as the model material and the total energy using the model is set as = 100~600 mJ, and other parameters remain unchanged. As shown in Figure 3d, the temperature abruptness at the crack is sharper with the increase in laser power.
We can see that the temperature gradient can be used as an important indicator to evaluate the detection quality, which will be further analyzed by the temperature gradient results in the following section.
3. Simulation Analysis of Factors Affecting Detection Effect
In laser thermography methods, key parameters, such as laser power and scanning speed, have an important influence on the detection quality [29,30]. In order to guide the selection of experimental parameters of laser thermography, based on finite element method, a simulation model with a vertical surface crack is established. Circular Gaussian heat source is used to simulate the point laser, and the surface temperature response of the model under different heat source parameters is calculated. According to the simulation results, the effects of material properties, laser power and laser scanning speed, thermal image acquisition frequency on the temperature gradient at the crack are analyzed.
3.1. Establishment of Simulation Model
The simulation model is established using ABAQUS as shown in Figure 4 [31]. The size of the model is 40 mm × 10 mm × 5 mm, and the model includes a vertical surface crack with a length of 6 mm, a width of L and a depth of 1 mm. In order to improve the accuracy of calculation and reduce the calculation time, more dense mesh is only set at the crack and near the crack. A point laser is scanning and exciting along the horizontal centerline of the model surface, and the heat flux density of the point laser satisfies a Gaussian distribution [24,32]:
where is the effective power of the laser, which indicates the thermal effect caused by the heat flux to the model surface, without considering the heat dissipation, is the radius of the laser (at of the intensity), and is the distance from the center of the laser heat source.
The scanning speed of laser spot is set as 10 mm/s, the total scanning time is 4 s, the acquisition frequency of thermal images is 50 Hz, the total number of thermal images is 200, the radius of the heat source is 1 mm, and the effective power of the laser is 1200 mW. Taking nickel-based alloy K438 as the model material, and the thermodynamic parameters of the material are shown in Table 1. When the laser spot scans in the direction perpendicular to the crack and approaches the crack, as shown in Figure 5, the conduction of heat wave will be hindered by the crack boundary, so there is an obvious temperature rise at the crack edge. The surface temperature gradient can reflect the shape and geometric distribution of the crack. When the laser gets closer to the crack, the range of the thermal barrier influence expands and the temperature rise increases, and the temperature rise is the largest when the center of the point laser overlaps with the crack.
The temperature field under laser excitation contains two parts of temperature information: the background temperature without thermal excitation and the temperature change under laser excitation. Taking the temperature image of the initial moment as the background temperature field, and the background is removed for the temperature field of other times to obtain the temperature change field . Based on this, the post-processing analyses are carried out.
3.2. Crack Width
Due to the difference in LR processes, materials and service conditions, the size and distribution of the surface cracks generated in the repair layer are different, which results in a distinct detection difficulty of laser thermography [29,33]. Therefore, the temperature and temperature gradient value of different crack widths under laser excitation are studied, so as to reflect the sensitivity of crack width to laser point excitation. A nickel-based alloy K348 is used as the repair layer material. The simulation model is shown in Figure 4. The effective power of the heat source is 1200 mW, the scanning speed of the heat source is 10 mm/s, the frequency of thermal image acquisition is 50 Hz, and the scanning time is 2 s. The crack widths are set as 40 μm, 80 μm, 160 μm, and 320 μm. Figure 6 shows the distribution of the temperature change field and temperature gradient field under the given crack width.
Figure 6 shows the simulation results which indicate that the temperature gradient at the crack increases rapidly with the increase in the crack width. When the crack width is larger than 80 μm, the location and geometry of the crack can be clearly observed from the temperature change field without image enhancement, as shown in Figure 6a, which makes it easier to detect the crack. When the crack width is larger than 160 μm, the two sides of the crack boundary gradually separate. However, when the width of the crack is 40 μm, the temperature rise at the crack is difficult to be identified from the temperature change field, and the crack characteristics need to be enhanced. A good identification result can be obtained by gradient calculation, as shown in Figure 6b.
3.3. Thermodynamic Properties of Materials
When using laser scanning thermography to detect cracks, the difference in material thermodynamic parameters will affect the detection effect, so it is necessary to explore the influence of thermodynamic parameters. Aluminum, titanium, nickel-based and iron-based alloys are used as model materials for the simulation analyses, and the width of crack is set to be 40 μm. The laser effective power is 1200 mW, the laser scanning speed is 10 mm/s, and the thermal image acquisition frequency is 50 Hz.
Figure 7a shows the superposition results of temperature change images of four materials under laser excitation. Figure 7b shows the superposition results of temperature gradient field of temperature change images, from which the geometric characteristics of cracks can be clearly observed. represents the gradient value of the temperature change field. Due to the scanning excitation of the circular Gaussian heat source, at the crack also satisfies the Gaussian distribution. For several materials with different thermodynamic parameters, the distribution and amplitude of are obviously different.
The results show that the thermal conductivity is the main thermodynamic parameter that affects the thermal response [34]. Among the four materials, aluminum alloy has the largest thermal conductivity, so it has the fastest thermal diffusion under heat excitation, and the smallest surface temperature and temperature gradient amplitude. Although this is not conducive to highlighting the edge features of cracks, it is conducive to expanding the detection range of cracks. Titanium alloy material has the minimum thermal conductivity , the diffusion rate of thermal wave is slow, and the amplitude of surface temperature rise and thermal gradient caused by heat source excitation is the largest, but the heat affected zone is small, so it is necessary to reduce the scan line spacing to ensure the integrity of defect detection. Due to the similar thermal diffusivity of nickel-based and iron-based alloys [35], the characteristics of temperature change field of the two materials are similar under circular Gaussian heat source excitation, and the difference in crack detection is small [36].
3.4. Thermographic Process Parameters
The selection of laser parameters directly determines the quality of surface crack detection, so the optimization of thermographic process parameters is crucial. Based on the simulation model shown in Figure 4, the influences of laser effective power , scanning speed and thermal image acquisition frequency on the detection results are studied. A nickel-based alloy is selected as the repair material, the crack width is 40 μm, and the laser spot radius is 1 mm. The setting of parameters to be discussed is shown in Table 2.
Figure 8 shows the calculation results of field under different laser effective powers, and the results of the display range with fixed temperature are shown in Figure 8a. With the increase in laser effective power, the heat input per unit time of the model increases, and the thermal resistance effect of the crack on the heat wave increases, so does the amplitude of the temperature gradient. Figure 8c shows that there is a linear relationship between the amplitude of and the effective power of the heat source. The increase in effective laser effective power will increase the heat affected zone, accordingly, for materials with low thermal conductivity, the increase in laser effective power is generally used to expand the heat affected zone and improve the quality of detection. However, excessively high laser effective power will cause damage to the specimen surface, so the appropriate laser effective power should be selected under the premise of considering the material properties.
Laser scanning speed is one of the important parameters which determines the detection efficiency and quality. With the increase in laser scanning speed , the following phenomena can be observed:
- (1)
- Due to the rapid movement of the laser, the heat input to the model decreases, and the amplitude of the surface temperature field decreases;
- (2)
- The trailing phenomenon is more significant in the laser scanning process (Figure 9a), the temperature field contour gradually becomes flat, the heat-affected zone decreases, and the crack characteristics are weakened;
- (3)
- When the heat source scans through the crack, the maximum thermal gradient on the specimen surface decreases due to the weakening of the thermal blocking phenomenon, as shown in Figure 9c.
When selecting the laser scanning speed, the detection quality should be mainly considered, which is reflected by the thermal gradient . Secondly, the detection time should also be considered, which is determined by the scanning speed and the scanning line spacing. On the one hand, when the scanning speed of laser is too low, especially below 10 mm/s, the scanning time is too long and the amount of data obtained is large, the time for processing costs longer time. Besides, the thermal diffusion range will become limited, which may lead to an incomplete detection of defects. On the other hand, when the speed of laser scanning is too high, the thermal resistance phenomenon is cut down, and resolution for detecting crack will be lower. For the detection of iron-based alloy and nickel-based alloy repair layer, the scanning speed should not be too large. It is recommended to select 10–20 mm/s in the experiment, and it should still be properly adjusted in combination with the specimen size.
Figure 10 shows the crack shape and geometric distribution characteristics under different thermal image acquisition frequencies, which is reflected by the temperature gradient field. Based on this, it can be seen that at the laser scanning speed of 10 mm/s, when the acquisition frequency is 20 Hz, there is almost no information missing along the scanning path. At this time, two frames of thermal images are collected within the laser moving distance of 1 mm. The laser radius is 1 mm, reflecting the size of the heat-affected area, so the minimum thermal image acquisition frequency should be , where is the laser scanning speed and is the laser spot radius. When the thermal image acquisition frequency is lower than the detection information is easy to be lost. Consequently, a better characterization of the crack characteristics, i.e., a better detection quality can be obtained by increasing the acquisition frequency.
Considering the performance of infrared camera and laser scanning speed commonly used at present, the acquisition frequency of thermal image is generally set in the range of 20~50 Hz. If the laser scanning speed is higher, a higher-speed infrared camera is needed. For example, the maximum acquisition frequency of Vari oCAM® HD series camera developed by InfraTec in Germany can reach 240 Hz, and the number of pixels in thermal images reaches 2048 × 1536 pixels. However, its price is relatively expensive, so its application in the field of nondestructive testing is limited. Therefore, in order to improve the detection quality, we mainly focus on the more controllable parameters, such as laser scanning speed and laser power.
3.5. A Scheme for Selecting Laser Thermography Parameters
Considering the influence of laser power, laser scanning speed and thermal image acquisition frequency on the temperature gradient at the crack, we give the selection window for the following thermographic process parameters:
- (1)
- For materials with low thermal conductivity, such as nickel-based alloys and iron-based alloys with similar thermodynamic properties, considering the detection time and quality, in the detection process of cracks with a width within 40~80 μm, the laser scanning speed is set to be 10–20 mm/s. Considering the thermal influence range under this scanning speed, the scanning line spacing can be selected as 1~3 mm. Additionally, considering the diffusion of heat, the laser power should be controlled at 3000 mW.
- (2)
- For components with cracks less than 40 μm in width, the scanning speed and scanning line spacing should be reduced, and a higher frequency of thermal image acquisition should be used to achieve more accurate detection. If the detection area is large, the laser scanning speed should be appropriately increased.
4. Scanning Thermography for Crack Detection of Repair Component
In order to achieve higher quality detection of surface cracks on the repaired components, we adopt the laser point scanning thermography technique to detect cracks on the real components repaired using iron-based alloy powders. The optimization window of laser thermography parameters is verified by experiments. Meanwhile, the thermal image processing algorithm is optimized to improve the accuracy and efficiency of surface crack detection.
4.1. Experimental Setup System and Detection Scheme
The system adopted in the experiment is shown in Figure 11 and Figure 12a, which mainly includes laser transmitter, image acquisition device, infrared camera and tested components [18]. VarioCam HR infrared camera produced by Infratec in Germany is used, with a resolution of 1024 × 768 pixels, the measurable temperature range is −40~1200 °C, the measurement accuracy is ±1 °C or ±1%, the temperature resolution (30 °C) is up to 0.02 K, and the maximum thermal image acquisition frequency is 30 Hz.
Fiber Laser Marking Machine (XQFL-G50 W) is used as the laser transmitter, and its maximum laser power is 50 W. Based on the parameter analyses in the simulation, we set the laser scanning speed in the experiment to be 15 mm/s, and the laser power 3 W to ensure no damage to the specimen surface. Set the image acquisition frequency to be 30 Hz to obtain enough thermal image data and reduce the loss of information.
The edge area of the plate-like specimen shown in Figure 12b is repaired using LENS technique. The repair layer is made of iron-based alloy, and the surface cracks are formed in the process of manufacturing. The repair layer is divided into three main areas: Area-1, Area-2 and Area-3, where the area of Area-1 is 8.4 × 2.2 cm2. Area-1 was detected by a combination of various scanning modes. As shown in Figure 12c, assuming that the direction perpendicular to the molten pool is 0°, and the angle between the scanning direction and the 0° direction is , The scanning combination modes are shown in Table 3. The line spacing of the laser scanning path is set to be 3 mm to improve the detection efficiency.
The other two areas (Area-2 and Area-3) are detected by scanning in the four directions of 0°, 45°, 90° and 135°. To ensure the detection quality, the line spacing of area-2 and area-3 is set to be 2 mm and 1 mm to achieve more precise scanning.
4.2. Experimental Results and Analysis
The thermal image processing and analyses are at the core of crack detection quality. Therefore, we take thermal images scanned along the direction of 0° as an example to show the process of thermal image processing, as shown in Figure 13. Firstly, the infrared camera is used to collect the n-frame thermal image in the laser scanning process, n = 1550. Then, MATLAB is used to digitize the thermal image sequence, as shown in Figure 13b. Further analysis is conducted based on digital image processing technique. The first image is taken as the reference image, representing the background temperature field without thermal excitation. The temperature change sequence is obtained by subtracting the reference image from other frames, and the post-processing analysis is conducted on this basis. In the post-processing process, the shape and geometric distribution of cracks are extracted by the enhancement and segmentation algorithms of temperature change images. The commonly used post-processing algorithms include first-order and second-order gradient algorithms, edge detection algorithms, etc., and the detection quality is different to some extent [10,38,39,40,41].
In Figure 13c, we compare and analyze the detection effects of the traditional gradient algorithm and several commonly used edge detection algorithms. In Table 4, we compare the number of parameters and calculation time of several algorithms. The processor type used for calculation is Intel (R) Core (TM) i7-10870H CPU. The results show that the traditional first-order and second-order gradient algorithms require more parameters, the parameter adjustment process is relatively tedious and the calculation time is long.
The edge detection algorithms based on Prewitt, Robert and Sobel operators can achieve higher SNR detection results, and the crack edge positioning is more accurate, the detection precision can be improved to be 1 pixel, and the calculation time is reduced. Among them, edge detection based on Prewitt has the shortest computation time, and has significant detection capability for horizontal and vertical cracks.
For the thermographic detection of the surface crack of laser-repaired components, the SNR and calculation time of the detection results are taken into consideration, and the edge detection based on Prewitt operator is selected for post-processing of the temperature change image sequence. By calculating the edge information of the temperature change image, the high-precision and rapid detection of the crack shape and geometric position is achieved.
Figure 14 shows the scanning and detection results of laser spot along the four directions: 0°, 45°, 90° and 135°. The edge detection algorithm based on Prewitt operator is used to process the temperature change image sequence. As can be seen that when scanning along a certain direction, the crack parallel to the laser scanning direction can be clearly detected, while not the case for the perpendicular cracks. When scanning in a single direction, it is impossible to detect all the crack information, so the combination of scanning in multiple directions must be used [10].
Therefore, several combinations of laser scanning modes are considered to achieve comprehensive crack detection. After the collection and processing of thermal image, the detection results are obtained as shown in Figure 15. When the scanning combination along 0° and 90° is adopted, the horizontal and numerical crack detection can be achieved, but the detection effect along oblique crack is not good. When the scanning combination of 0°, 45°, 90° and 135° is adopted, better detection effect can be obtained, and the resulting image contains more crack details. When six or more scanning directions are used for detection, the detection effect is not significantly improved and the detection efficiency is low. Therefore, it is recommended to use the scanning combination of 0°, 45°, 90° and 135° to ensure the detection effect and efficiency.
Thermography method has good detection results in different repair areas. As shown in Figure 16, in the detection of the other two areas, the edge detection algorithm based on Prewitt operator is used to process the temperature change image sequence by combining the four-direction scanning combination mode. Clear crack shape and geometric distribution can be obtained. Therefore, it can be seen that laser scanning thermography has good applicability in the detection of different areas. By using laser scanning thermography in three areas, we can obtain the crack shape and geometric distribution in each part of the repair layer, as shown in Figure 17.
From the detection results shown in Figure 17, obvious cracks exist in the tested area with a dendritic distribution. The main cracks are distributed along the direction of 0°, and the angle between the secondary cracks and the main cracks is mostly 45~90°. By observing Area-1 with a 50× microscope, a clear crack shape and geometric distribution can be obtained as shown in Figure 18a, which is in good agreement with the results of thermographic detection as shown in Figure 18b. Based on the laser spot scanning thermography, a crack with a minimum width of 10.07 μm can be detected, which proves that the thermography method has good applicability and high detection sensitivity for the detection of irregular surface cracks.
5. Discussion
Influence Analysis of Surface Roughness of Repair Layer
The periodic cladding track structure formed in the LR process poses a challenge to the detection of crack defects [20,27]. When using laser scanning thermography to detect crack defects, the cladding track structure introduces noise to the temperature field, which needs to be further discussed and analyzed.
In order to study the influence of the repair layer surface roughness on the thermographic detection, taking the polished smooth surface as a reference, thermographic detection is carried out for the smooth surface and the repair layers with different process parameters. Since the thermal emissivity of smooth surface is low, and the infrared camera mainly realizes temperature measurement based on the thermal radiation, uniform black matte paint is sprayed on its surface to improve the thermal emissivity and capture the change in temperature field more clearly. Figure 19a,d or Figure 20a,d represent the 3D surface morphology of repair area 1, smooth area, repair area 2 and repair area 3, respectively. They are obtained under the 3D-Super Depth of Field Microscope (KEYENCEVHX-600ESO) with a magnification of 200×. During laser deposition, periodic cladding track structure is formed. The fluctuation amplitude of surface height in repair area 1, smooth area, repair area 2 and repair area 3 are 104.9 μm, 39.6 μm, 688.9 μm and 368.3 μm, respectively. This reflects the surface roughness. The repair layer material is the iron-based alloy, the material with smooth surface is the 304 stainless steel. The repair layer and smooth surface are stimulated by laser scanning in four directions of 0°, 45°, 90° and 135°. Thermal image sequences are collected by an infrared camera for further processing and analysis.
In the processing of thermal images, the temperature change fields excited by laser in four directions of 0°, 45°, 90° and 135° are averaged to obtain the combined form of temperature change field. Then, the image dilation algorithm is used to process the pixels with temperature higher than 2 °C in each frame of thermal images, and further obtain the surface temperature distribution formed by the cladding track structure [18]. In the temperature field shown in Figure 19e, as the specimen surface is relatively smooth, the surface temperature distribution under laser excitation is relatively uniform. As shown in Figure 19b or Figure 20b,e, periodic cladding track structure exists in repair area 1, repair area 2 and repair area 3. Under laser excitation, the surface temperature field also presents periodic distribution, which is consistent with the cladding track structure. With the increase in surface fluctuation amplitude of repair layer, periodic temperature distribution becomes more obvious.
Prewitt edge detection is used to extract the edge characteristics of the combined temperature change field and to detect the surface defects of the specimen. As shown in Figure 19c, surface cracks exist in repair area 1, and the fluctuation of cladding track is small, with the amplitude of height difference being 104.9 μm. High quality crack shape and geometric distribution can be detected by laser scanning thermography. The temperature noise caused by non-uniform cladding track structure can be eliminated by global threshold segmentation, and the influence of cladding channel structure on crack detection is small. As shown in Figure 20c,d, the fluctuation of cladding track is large, and there is an obvious cladding track noise in the edge detection result, which has a significant influence on the crack detection.
In Figure 19b,e and Figure 20b,e, the vertical line at the position of the 800th pixel on the horizontal axis is selected, and is perpendicular to the cladding track. The temperature distribution curves along are drawn in the combined temperature change field, as shown in Figure 21. Due to the same laser scanning parameters and thermal image processing process, the temperature distribution curves of several surface structures are similar. The distribution of temperature change under the influence of cladding track structure is periodic, and the periodicity of repaired areas 2 and 3 is more significant, while the temperature fluctuation of the smooth area is small.
6. Conclusions
In this paper, the laser scanning thermography technique for detecting surface cracks of laser-repaired parts with irregular surface structure is studied. The main conclusions of this paper are as follows:
- (1)
- Based on the simulation results of laser spot thermal excitation, the influences of the repaired component materials, the laser power and scanning speed of the thermal excitation device, and the capturing frequency of the infrared camera on the temperature gradient at the crack are analyzed. The results show that for nickel-based alloys and iron-based alloys used for laser repairing, when detecting surface cracks in the width range of 40–80 μm, the scanning speed is set to be 10~20 mm/s, the scanning line spacing 1~3 mm, and the laser power 3000 mW, higher precision detection results can be obtained.
- (2)
- For real LR components, a thermal image post-processing algorithm based on Prewitt gradient operator is applied to achieve high SNR and fast detection of surface crack shape and geometric distribution. Compared with the traditional gradient algorithm, this algorithm has the advantages of high automation and computational efficiency, and can be applied to the crack detection on rough surfaces. The detection sensitivity of crack width can reach 10 μm.
- (3)
- Thermographic detection is carried out on LR layers with and without a smooth surface, and the influence of surface roughness on inspection is analyzed. The results show that the periodic temperature distribution is caused by the periodic cladding tracks structure. When the amplitude of surface fluctuation is small, the global threshold segmentation algorithm can effectively eliminate the cladding track noise.
Author Contributions
Conceptualization, C.G., W.S. and H.X.; Funding acquisition, H.X.; Methodology, C.G., W.S., Z.L. and H.X.; Project administration, H.X.; Software, C.G. and W.S.; Supervision, H.X.; Validation, W.H.; Visualization, C.G.; Writing—original draft, C.G.; Writing—review & editing, C.G., W.S., H.X. and W.H. All authors have read and agreed to the published version of the manuscript.
Funding
This research was funded by the National Natural Science Foundation of China (Grant Nos. 12032013 and 11972209), the National Key Research and Development Program of China with grant No. 2017YFB1103900 and the National Science and Technology Major Project (2017-VI-0003-0073).
Institutional Review Board Statement
Not applicable.
Informed Consent Statement
Not applicable.
Conflicts of Interest
The authors declare no conflict of interest.
References
- Saboori, A.; Aversa, A.; Marchese, G.; Biamino, S.; Lombardi, M.; Fino, P. Application of directed energy deposition-based additive manufacturing in repair. Appl. Sci. 2019, 9, 3316. [Google Scholar] [CrossRef] [Green Version]
- Liu, R.; Wang, Z.; Sparks, T.; Liou, F.; Newkirk, J. Aerospace applications of laser additive manufacturing. In Laser Additive Manufacturing; Elsevier: Amsterdam, The Netherlands, 2017; pp. 351–371. [Google Scholar]
- Thompson, S.M.; Bian, L.; Shamsaei, N.; Yadollahi, A. An overview of Direct Laser Deposition for additive manufacturing; Part I: Transport phenomena, modeling and diagnostics. Addit. Manuf. 2015, 8, 36–62. [Google Scholar] [CrossRef]
- Shamsaei, N.; Yadollahi, A.; Bian, L.; Thompson, S.M. An overview of Direct Laser Deposition for additive manufacturing; Part II: Mechanical behavior, process parameter optimization and control. Addit. Manuf. 2015, 8, 12–35. [Google Scholar] [CrossRef]
- He, W.; Shi, W.; Li, J.; Xie, H. In-situ monitoring and deformation characterization by optical techniques; part I: Laser-aided direct metal deposition for additive manufacturing. Opt. Lasers Eng. 2019, 122, 74–88. [Google Scholar] [CrossRef]
- Xu, Z.; Ouyang, W.; Jia, S.; Jiao, J.; Zhang, M.; Zhang, W. Cracks repairing by using laser additive and subtractive hybrid manufacturing technology. J. Manuf. Sci. Eng. 2020, 142, 031006. [Google Scholar] [CrossRef]
- Li, P.-H.; Guo, W.-G.; Huang, W.-D.; Su, Y.; Lin, X.; Yuan, K.-B. Thermomechanical response of 3D laser-deposited Ti–6Al–4V alloy over a wide range of strain rates and temperatures. Mater. Sci. Eng. A 2015, 647, 34–42. [Google Scholar] [CrossRef]
- Chen, X.; Fu, Y.; Kong, F.; Li, R.; Xiao, Y.; Hu, J.; Zhang, H. An in-process multi-feature data fusion nondestructive testing approach for wire arc additive manufacturing. Rapid Prototyp. J. 2021, 28, 573–584. [Google Scholar] [CrossRef]
- Chua, Z.Y.; Ahn, I.H.; Moon, S.K. Process monitoring and inspection systems in metal additive manufacturing: Status and applications. Int. J. Precis. Eng. Manuf. -Green Technol. 2017, 4, 235–245. [Google Scholar] [CrossRef]
- Jiao, D.; Shi, W.; Liu, Z.; Xie, H. Laser Multi-mode Scanning Thermography Method for Fast Inspection of Micro-cracks in TBCs Surface. J. Nondestruct. Eval. 2018, 37, 30. [Google Scholar] [CrossRef]
- Zhao, Z. Review of non-destructive testing methods for defect detection of ceramics. Ceram. Int. 2021, 47, 4389–4397. [Google Scholar] [CrossRef]
- Qu, Z.; Jiang, P.; Zhang, W. Development and application of infrared thermography non-destructive testing techniques. Sensors 2020, 20, 3851. [Google Scholar] [CrossRef] [PubMed]
- Usamentiaga, R.; Venegas, P.; Guerediaga, J.; Vega, L.; Molleda, J.; Bulnes, F.G. Infrared thermography for temperature measurement and non-destructive testing. Sensors 2014, 14, 12305–12348. [Google Scholar] [CrossRef] [PubMed] [Green Version]
- Mohr, G.; Altenburg, S.J.; Ulbricht, A.; Heinrich, P.; Baum, D.; Maierhofer, C.; Hilgenberg, K. In-Situ defect detection in laser powder bed fusion by using thermography and optical tomography—Comparison to computed tomography. Metals 2020, 10, 103. [Google Scholar] [CrossRef] [Green Version]
- Qiu, J.; Pei, C.; Yang, Y.; Wang, R.; Liu, H.; Chen, Z. Remote measurement and shape reconstruction of surface-breaking fatigue cracks by laser-line thermography. Int. J. Fatigue 2021, 142, 105950. [Google Scholar] [CrossRef]
- Tong, Z.; Xie, S.; Liu, H.; Zhang, W.; Pei, C.; Li, Y.; Chen, Z.; Uchimoto, T.; Takagi, T. An efficient electromagnetic and thermal modelling of eddy current pulsed thermography for quantitative evaluation of blade fatigue cracks in heavy-duty gas turbines. Mech. Syst. Signal Process. 2020, 142, 106781. [Google Scholar] [CrossRef]
- Salazar, A.; Mendioroz, A.; Oleaga, A. Flying spot thermography: Quantitative assessment of thermal diffusivity and crack width. J. Appl. Phys. 2020, 127, 131101. [Google Scholar] [CrossRef] [Green Version]
- Shi, W.; Ren, Z.; He, W.; Hou, J.; Xie, H.; Liu, S. A technique combining laser spot thermography and neural network for surface crack detection in laser engineered net shaping. Opt. Lasers Eng. 2021, 138, 106431. [Google Scholar] [CrossRef]
- An, Y.-K.; Yang, J.; Hwang, S.; Sohn, H. Line laser lock-in thermography for instantaneous imaging of cracks in semiconductor chips. Opt. Lasers Eng. 2015, 73, 128–136. [Google Scholar] [CrossRef]
- An, Y.-K.; Min Kim, J.; Sohn, H. Laser lock-in thermography for detection of surface-breaking fatigue cracks on uncoated steel structures. NDT E Int. 2014, 65, 54–63. [Google Scholar] [CrossRef]
- Liu, Z.; Jiao, D.; Shi, W.; Xie, H. Linear laser fast scanning thermography NDT for artificial disbond defects in thermal barrier coatings. Opt. Express 2017, 25, 31789–31800. [Google Scholar] [CrossRef]
- Pech-May, N.W.; Oleaga, A.; Mendioroz, A.; Salazar, A. Fast characterization of the width of vertical cracks using pulsed laser spot infrared thermography. J. Nondestruct. Eval. 2016, 35, 22. [Google Scholar] [CrossRef]
- Pech-May, N.W.; Mendioroz, A.; Salazar, A. Simultaneous measurement of the in-plane and in-depth thermal diffusivity of solids using pulsed infrared thermography with focused illumination. NDT E Int. 2016, 77, 28–34. [Google Scholar] [CrossRef]
- Pech-May, N.W.; Oleaga, A.; Mendioroz, A.; Omella, A.J.; Celorrio, R.; Salazar, A. Vertical cracks characterization using lock-in thermography: I infinite cracks. Meas. Sci. Technol. 2014, 25, 115601. [Google Scholar] [CrossRef]
- González, J.; Mendioroz, A.; Sommier, A.; Batsale, J.C.; Pradere, C.; Salazar, A. Fast sizing of the width of infinite vertical cracks using constant velocity Flying-Spot thermography. NDT E Int. 2019, 103, 166–172. [Google Scholar] [CrossRef]
- Li, T.; Almond, D.P.; Rees, D.A.S. Crack imaging by scanning laser-line thermography and laser-spot thermography. Meas. Sci. Technol. 2011, 22, 035701. [Google Scholar] [CrossRef] [Green Version]
- Hwang, S.; An, Y.-K.; Kim, J.-M.; Sohn, H. Monitoring and instantaneous evaluation of fatigue crack using integrated passive and active laser thermography. Opt. Lasers Eng. 2019, 119, 9–17. [Google Scholar] [CrossRef]
- Boué, C.; Holé, S. Comparison between multi-frequency and multi-speed laser lock-in thermography methods for the evaluation of crack depths in metal. Quant. InfraRed Thermogr. J. 2019, 17, 223–234. [Google Scholar] [CrossRef]
- Mandache, C. Overview of non-destructive evaluation techniques for metal-based additive manufacturing. Mater. Sci. Technol. 2019, 35, 1007–1015. [Google Scholar] [CrossRef]
- Zhengwei, Y.; Xingyu, X.; Yin, L.; Wei, Z.; Gan, T. Influence analysis of key parameters in laser scanning thermography nondestructive testing. Infrared Laser Eng. 2019, 48, 1105008. [Google Scholar] [CrossRef]
- Colom, M.; Rodriguez-Aseguinolaza, J.; Mendioroz, A.; Salazar, A. Sizing the depth and width of narrow cracks in real parts by laser-spot lock-in thermography. Materials 2021, 14, 5644. [Google Scholar] [CrossRef]
- D’Ostuni, S.; Leo, P.; Casalino, G. FEM simulation of dissimilar aluminum titanium fiber laser welding using 2D and 3D Gaussian heat sources. Metals 2017, 7, 307. [Google Scholar] [CrossRef] [Green Version]
- Alhuzaim, A.; Imbrogno, S.; Attallah, M.M. Direct laser deposition of crack-free CM247LC thin walls: Mechanical properties and microstructural effects of heat treatment. Mater. Des. 2021, 211, 110123. [Google Scholar] [CrossRef]
- Philipp, A.; Pech-May, N.W.; Kopera, B.A.F.; Lechner, A.M.; Rosenfeldt, S.; Retsch, M. Direct measurement of the in-plane thermal diffusivity of semitransparent thin films by lock-in thermography: An extension of the slopes method. Anal. Chem. 2019, 91, 8476–8483. [Google Scholar] [CrossRef] [PubMed] [Green Version]
- Gaverina, L.; Bensalem, M.; Bedoya, A.; González, J.; Sommier, A.; Battaglia, J.L.; Salazar, A.; Mendioroz, A.; Oleaga, A.; Batsale, J.C.; et al. Constant velocity flying spot for the estimation of in-plane thermal diffusivity on anisotropic materials. Int. J. Therm. Sci. 2019, 145, 106000. [Google Scholar] [CrossRef]
- Puthiyaveettil, N.; Rajagopal, P.; Balasubramaniam, K. Influence of absorptivity of the material surface in crack detection using laser spot thermography. NDT E Int. 2021, 120, 102438. [Google Scholar] [CrossRef]
- Jiao, D.; Liu, Z.; Shi, W.; Xie, H. Temperature fringe method with phase-shift for the 3D shape measurement. Opt. Lasers Eng. 2019, 112, 93–102. [Google Scholar] [CrossRef]
- Al-Musawi, A.K.; Anayi, F.; Packianather, M. Three-phase induction motor fault detection based on thermal image segmentation. Infrared Phys. Technol. 2020, 104, 103140. [Google Scholar] [CrossRef]
- Fedala, Y.; Streza, M.; Roger, J.P.; Tessier, G.; Boué, C. Open crack depth sizing by laser stimulated infrared lock-in thermography. J. Phys. D Appl. Phys. 2014, 47, 465501. [Google Scholar] [CrossRef]
- Wang, G.; Tse, P.W.; Yuan, M. Automatic internal crack detection from a sequence of infrared images with a triple-threshold Canny edge detector. Meas. Sci. Technol. 2018, 29, 025403. [Google Scholar] [CrossRef]
- Pech-May, N.W.; Ziegler, M. Detection of surface breaking cracks using flying line laser thermography: A canny-based algorithm. In Proceedings of the The 16th International Workshop on Advanced Infrared Technology & Applications, Online. 26–28 October 2021. [Google Scholar]
Figure 1.
The research framework and technical route.
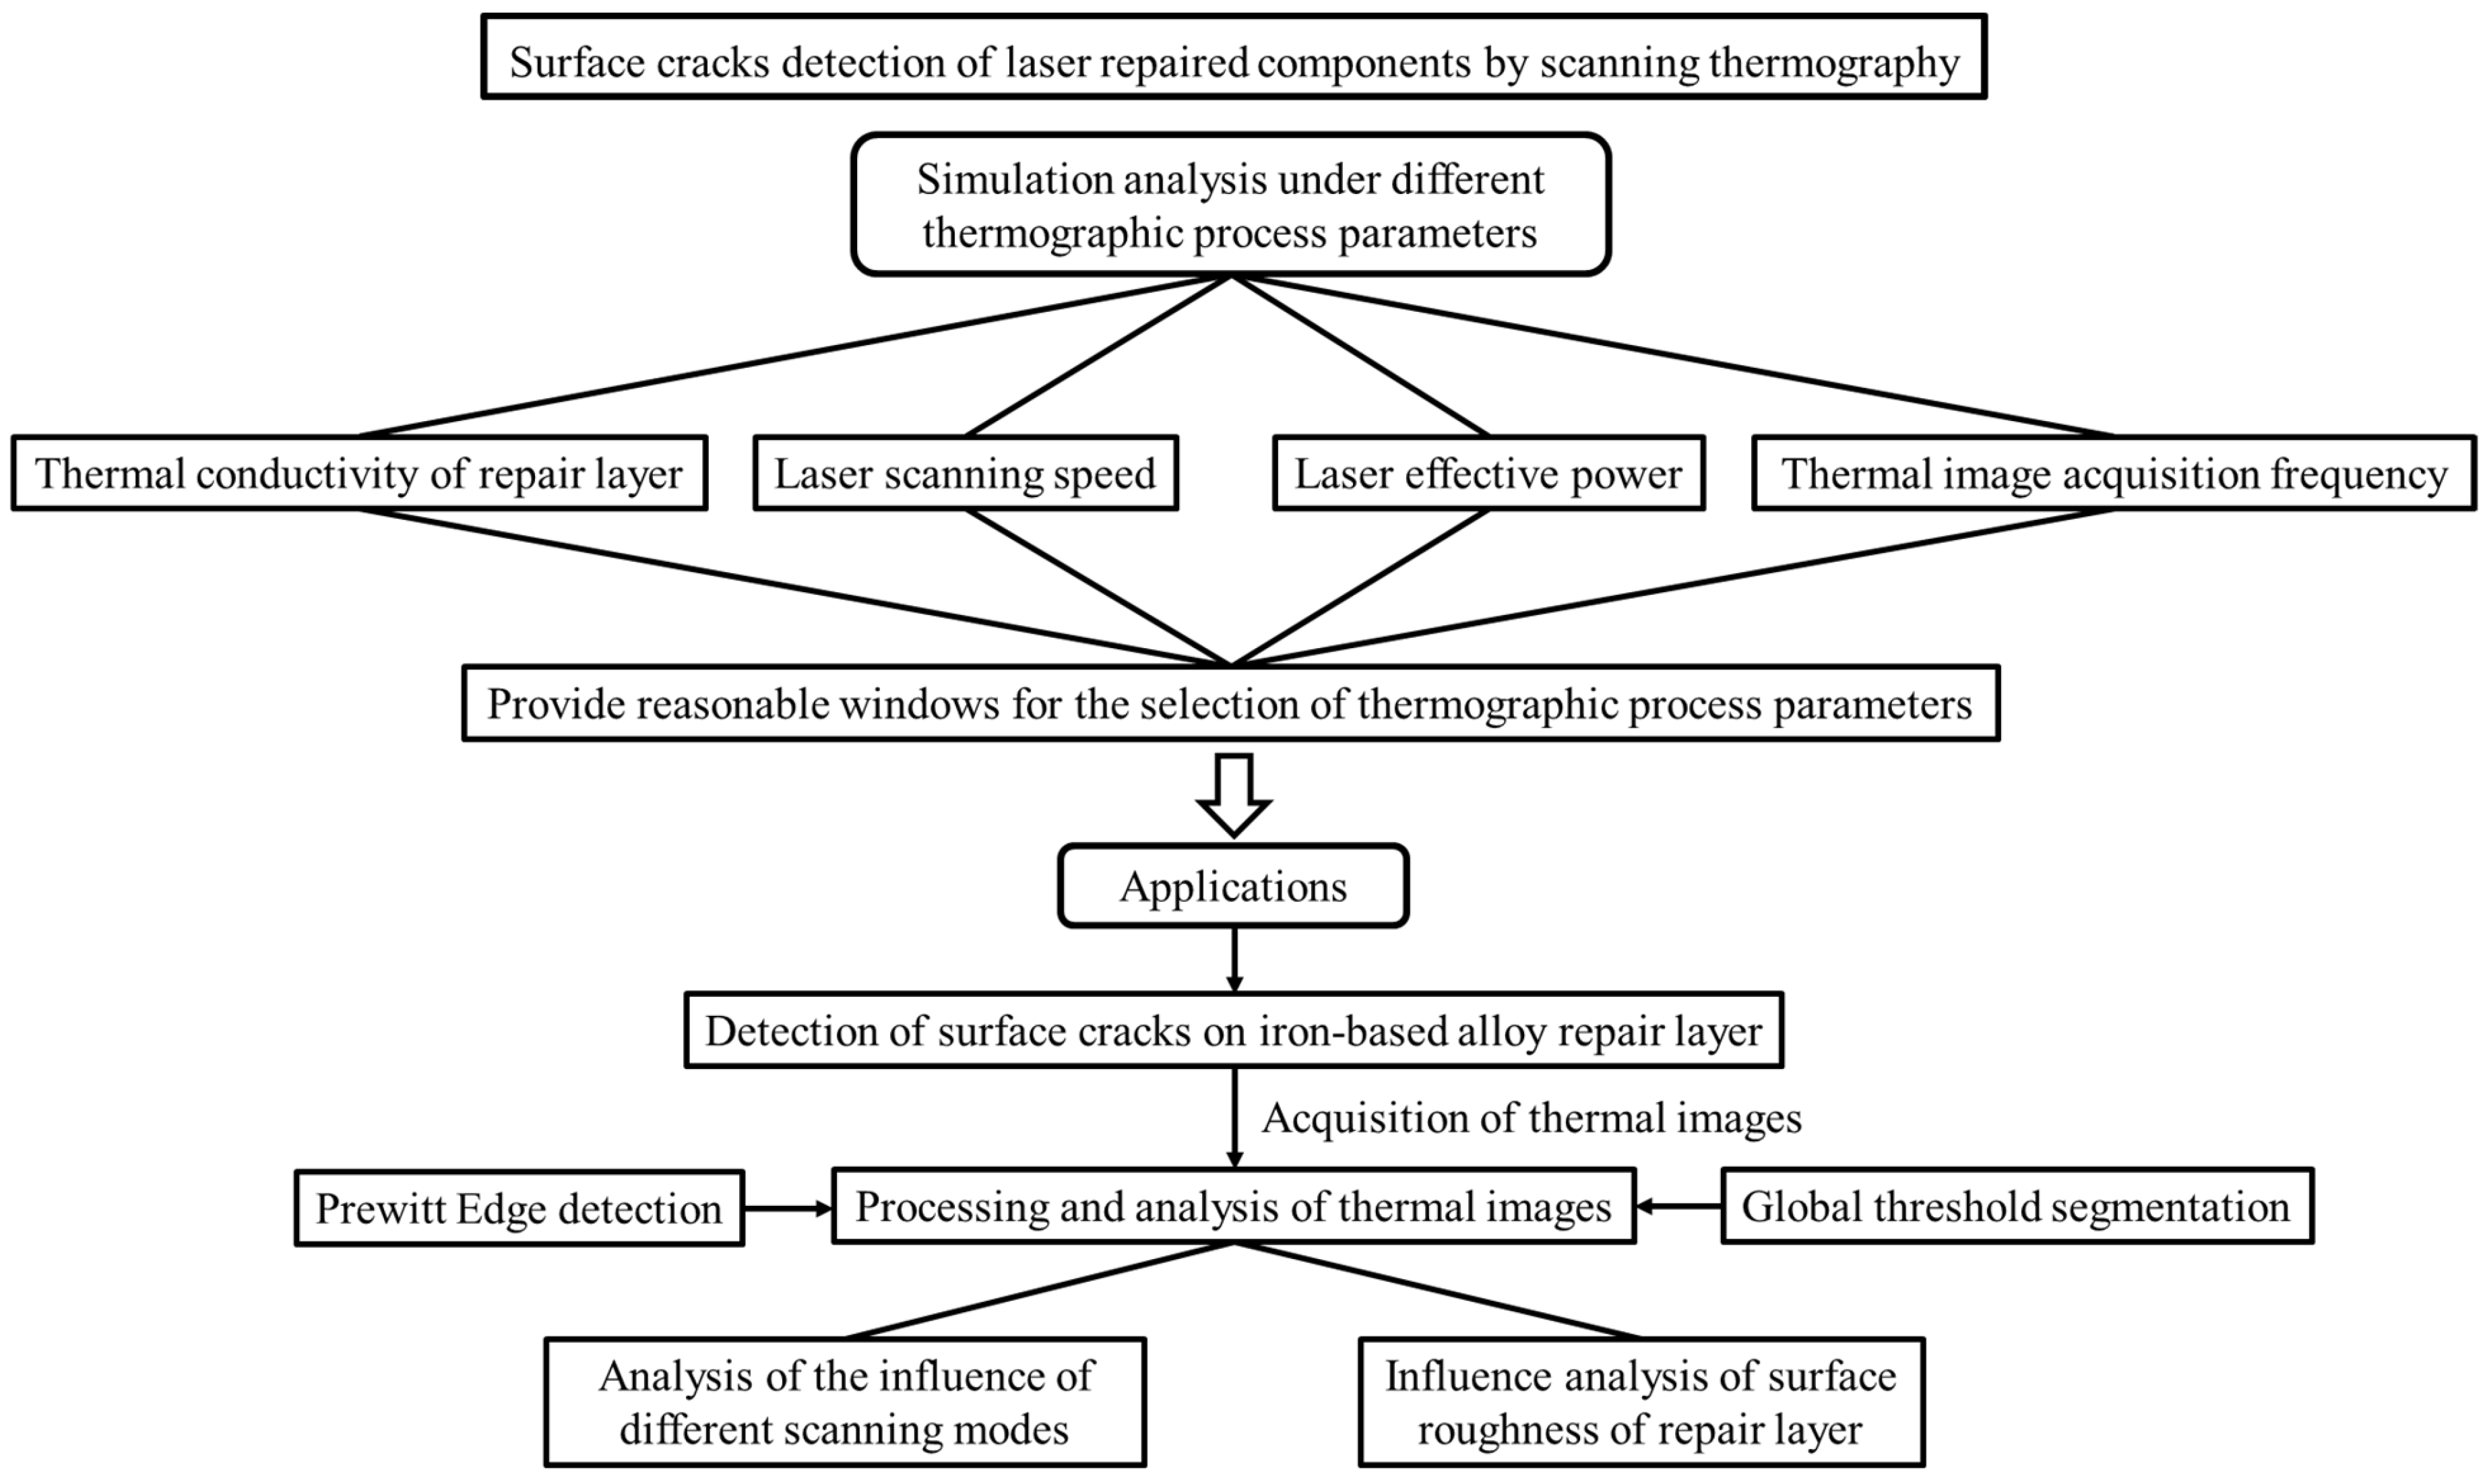
Figure 2.
A theoretical model of heat conduction excited by a circular Gaussian heat source [22,28].

Figure 3.
Analysis of temperature response based on circular Gaussian pulse excitation: (a) Temperature distribution along the y-direction of different materials; (b) Temperature gradient distribution of different materials along the y-direction; (c) Temperature distribution along the y-direction at different times; (d) Temperature distribution along the y-direction of different .

Figure 4.
Geometry and meshing of the simulation model.

Figure 5.
Surface temperature distribution at different frames when a laser scans through a crack.
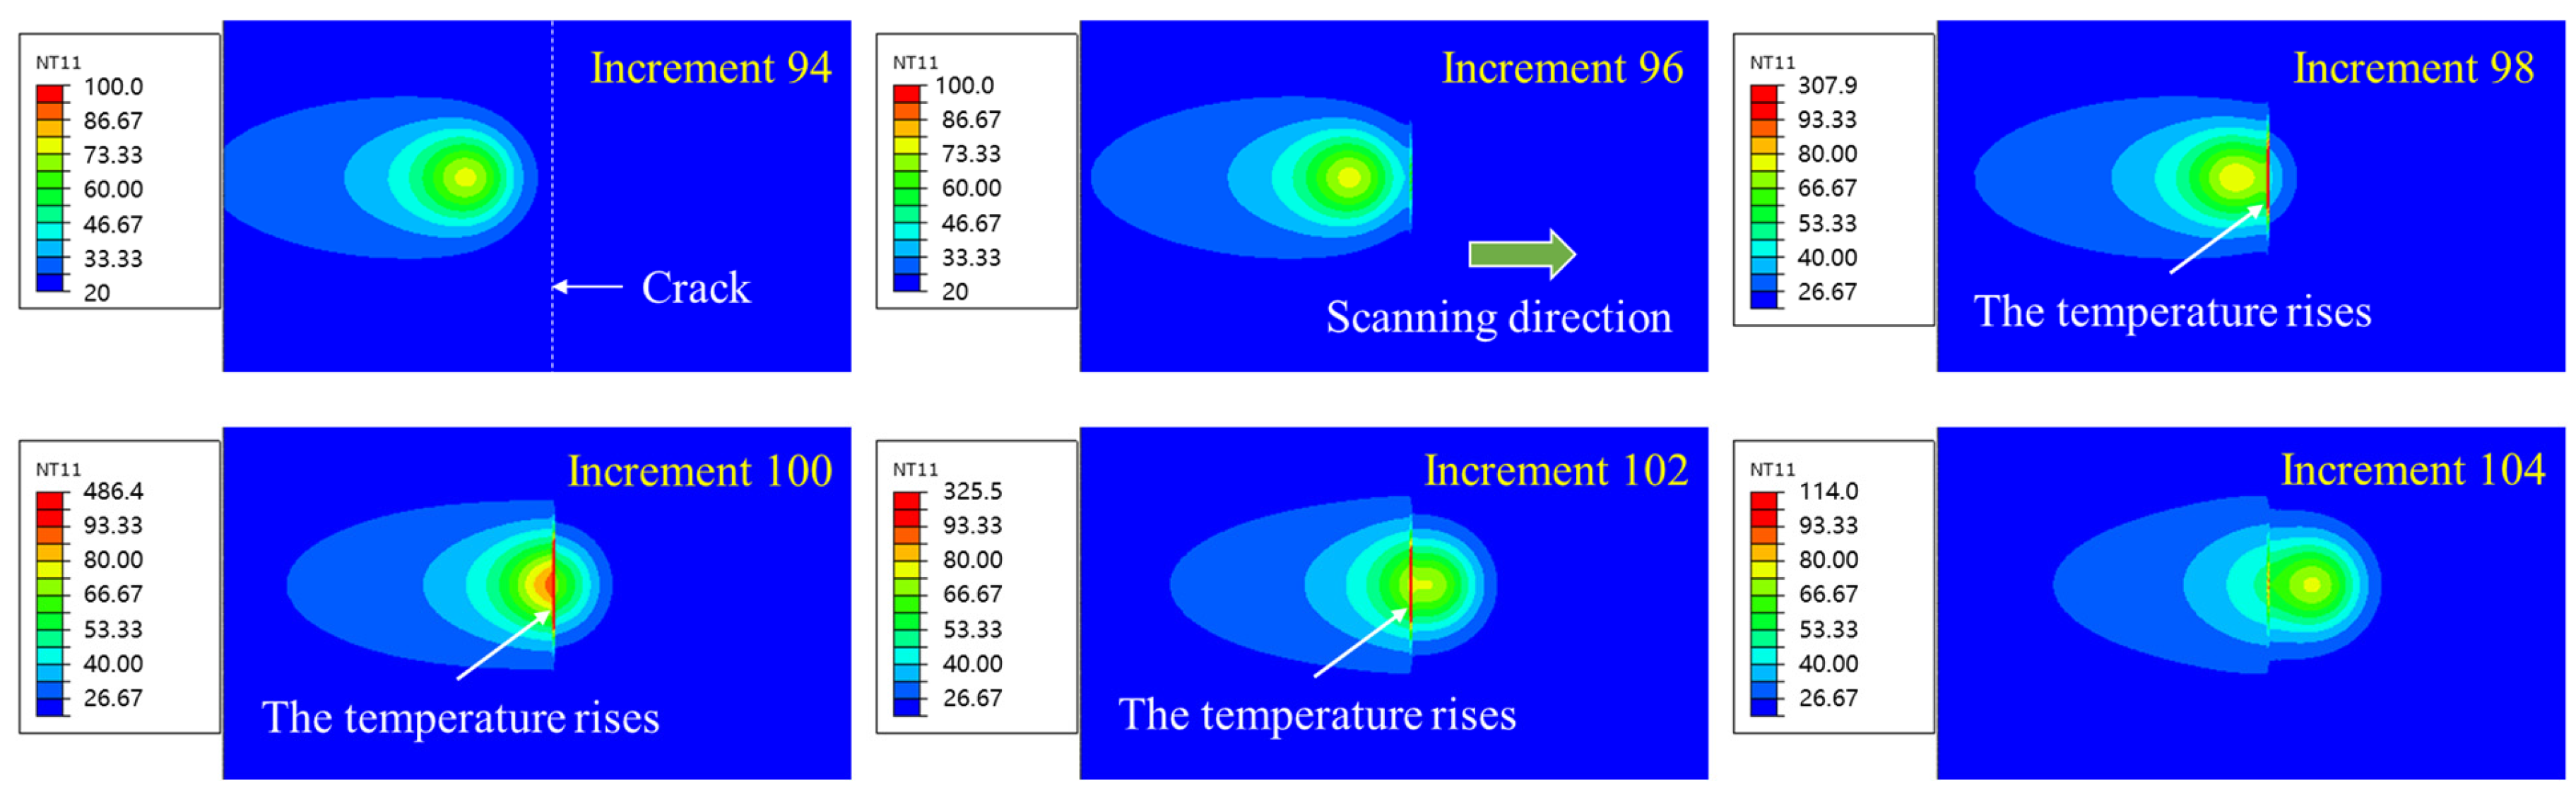
Figure 6.
Crack detection at different crack widths: (a) superposition results of the ; (b) the superposition results of .
Figure 6.
Crack detection at different crack widths: (a) superposition results of the ; (b) the superposition results of .
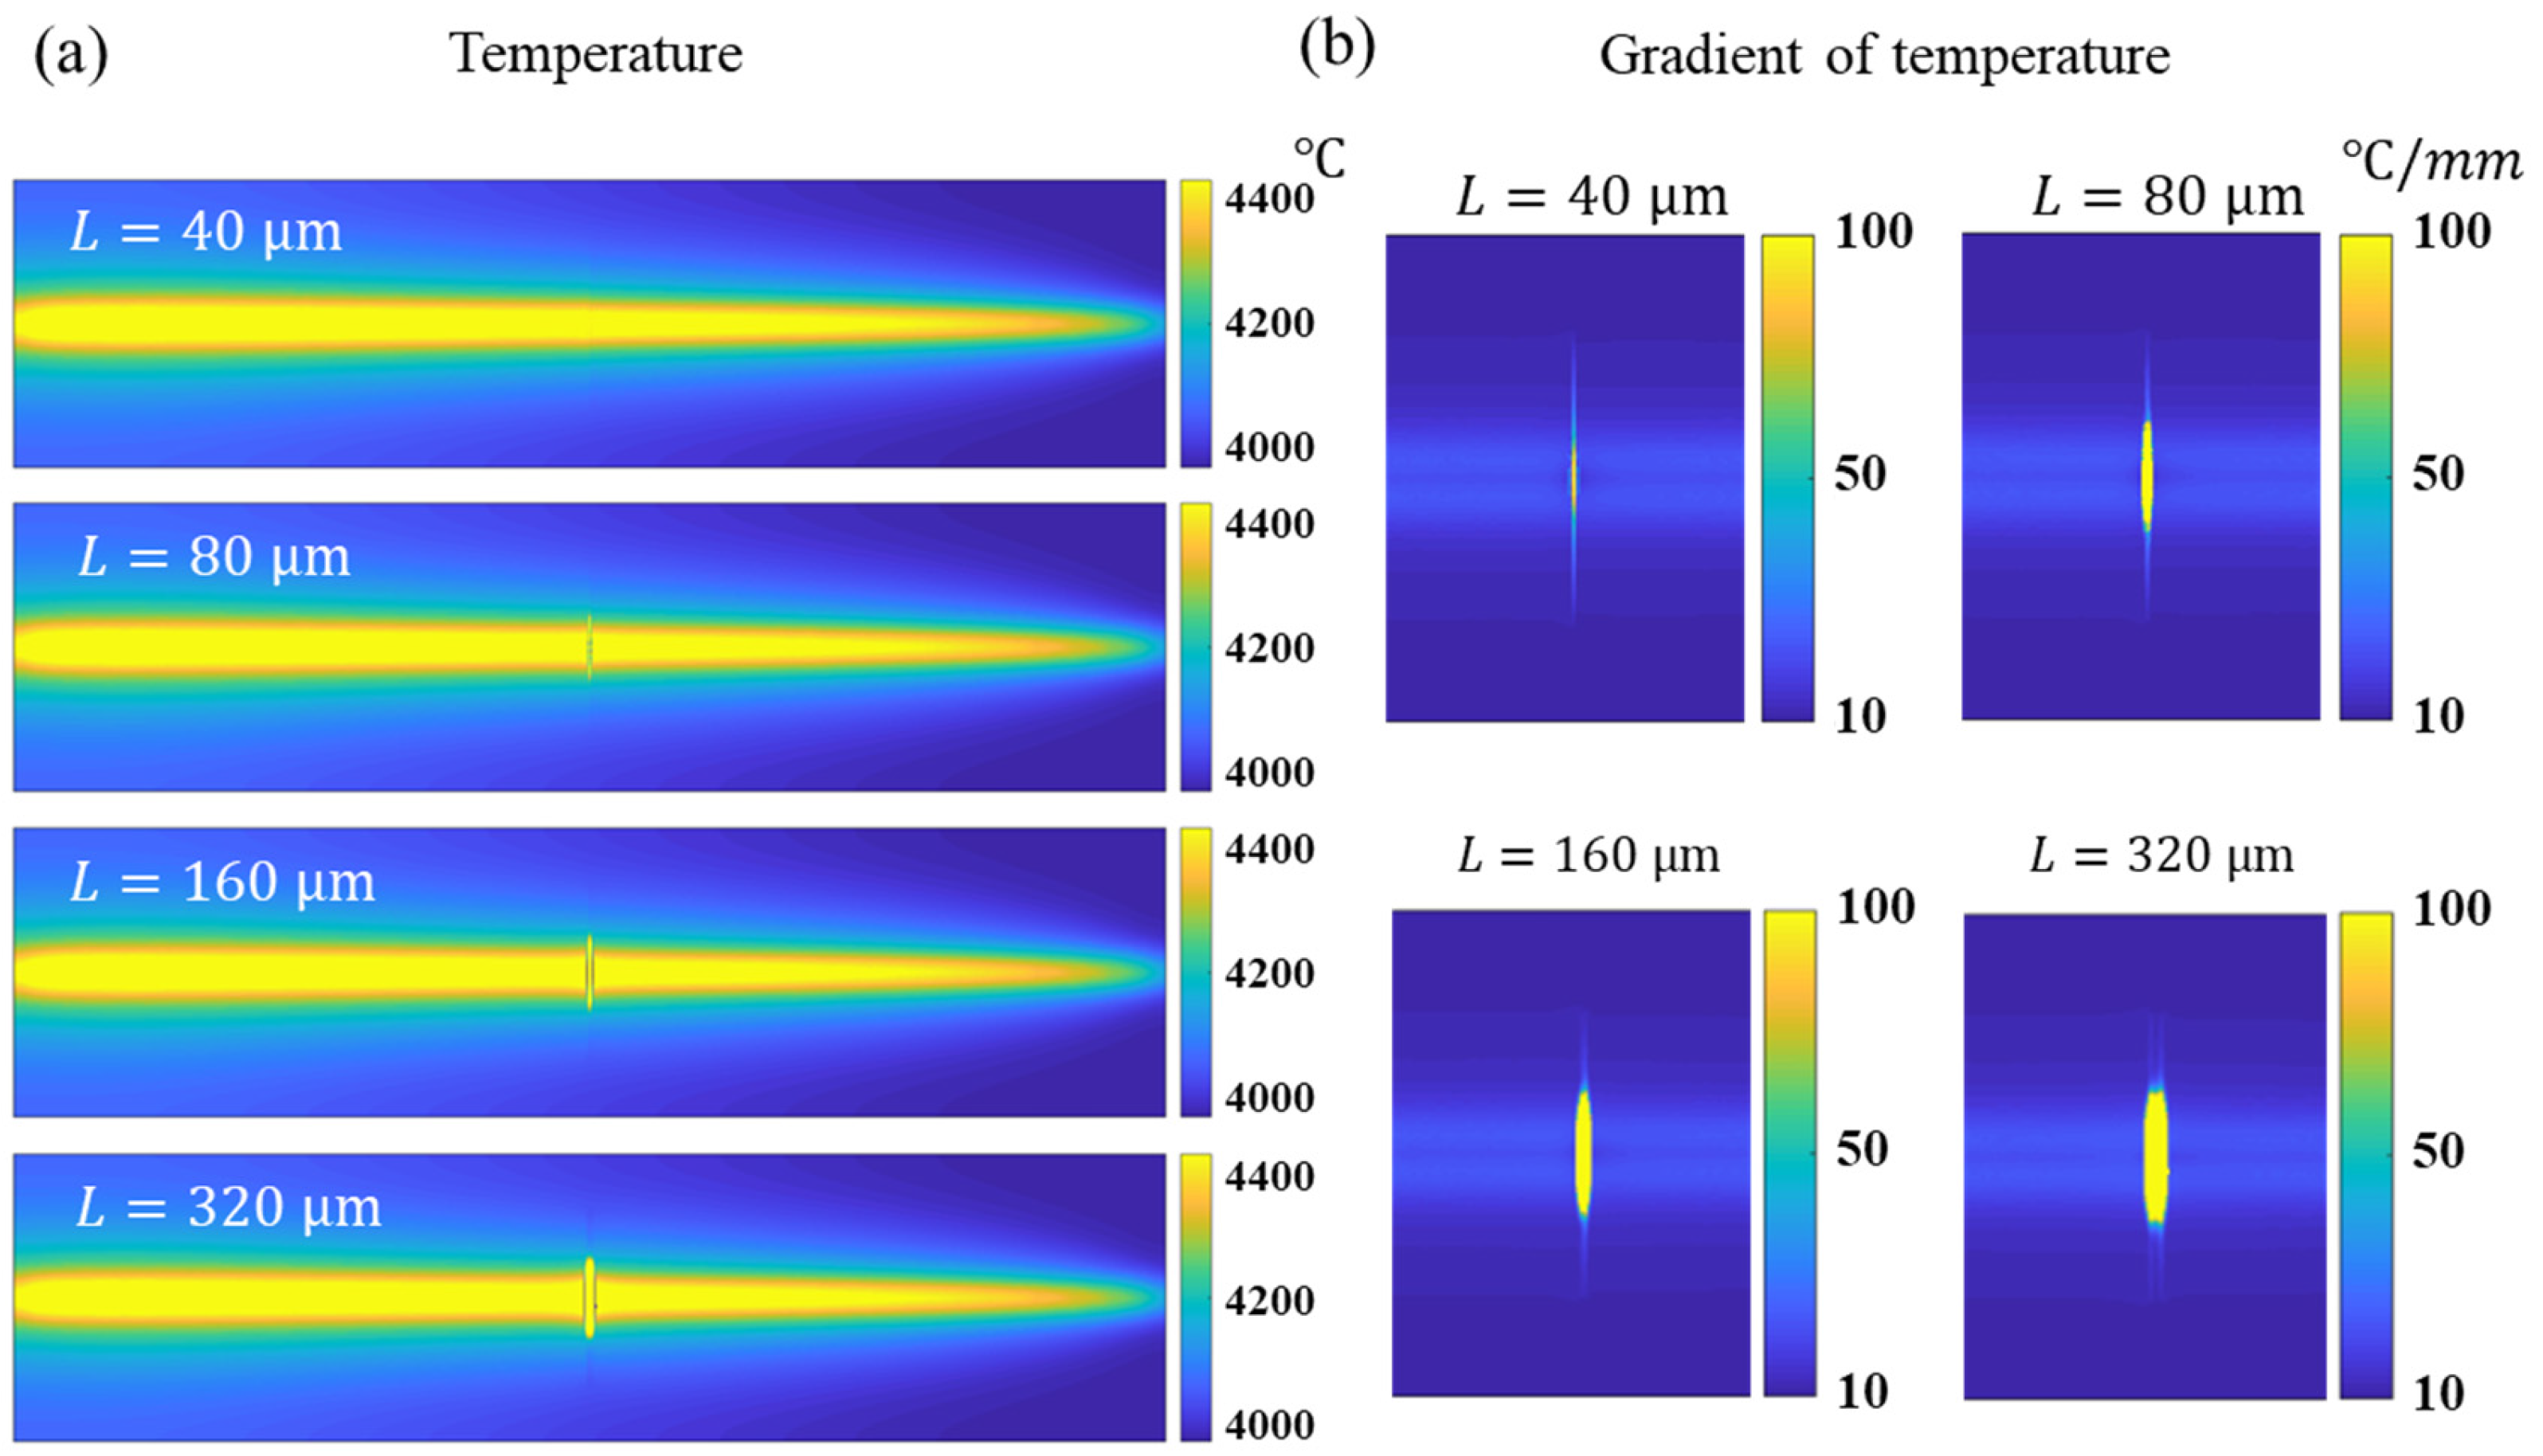
Figure 7.
Crack detection for four kinds of materials with different thermomechanical properties: (a) superposition result of of each frame under laser excitation; (b) gradient results of temperature change field ); (c) along the crack centerline; (d) along the scan path of the laser center point.
Figure 7.
Crack detection for four kinds of materials with different thermomechanical properties: (a) superposition result of of each frame under laser excitation; (b) gradient results of temperature change field ); (c) along the crack centerline; (d) along the scan path of the laser center point.
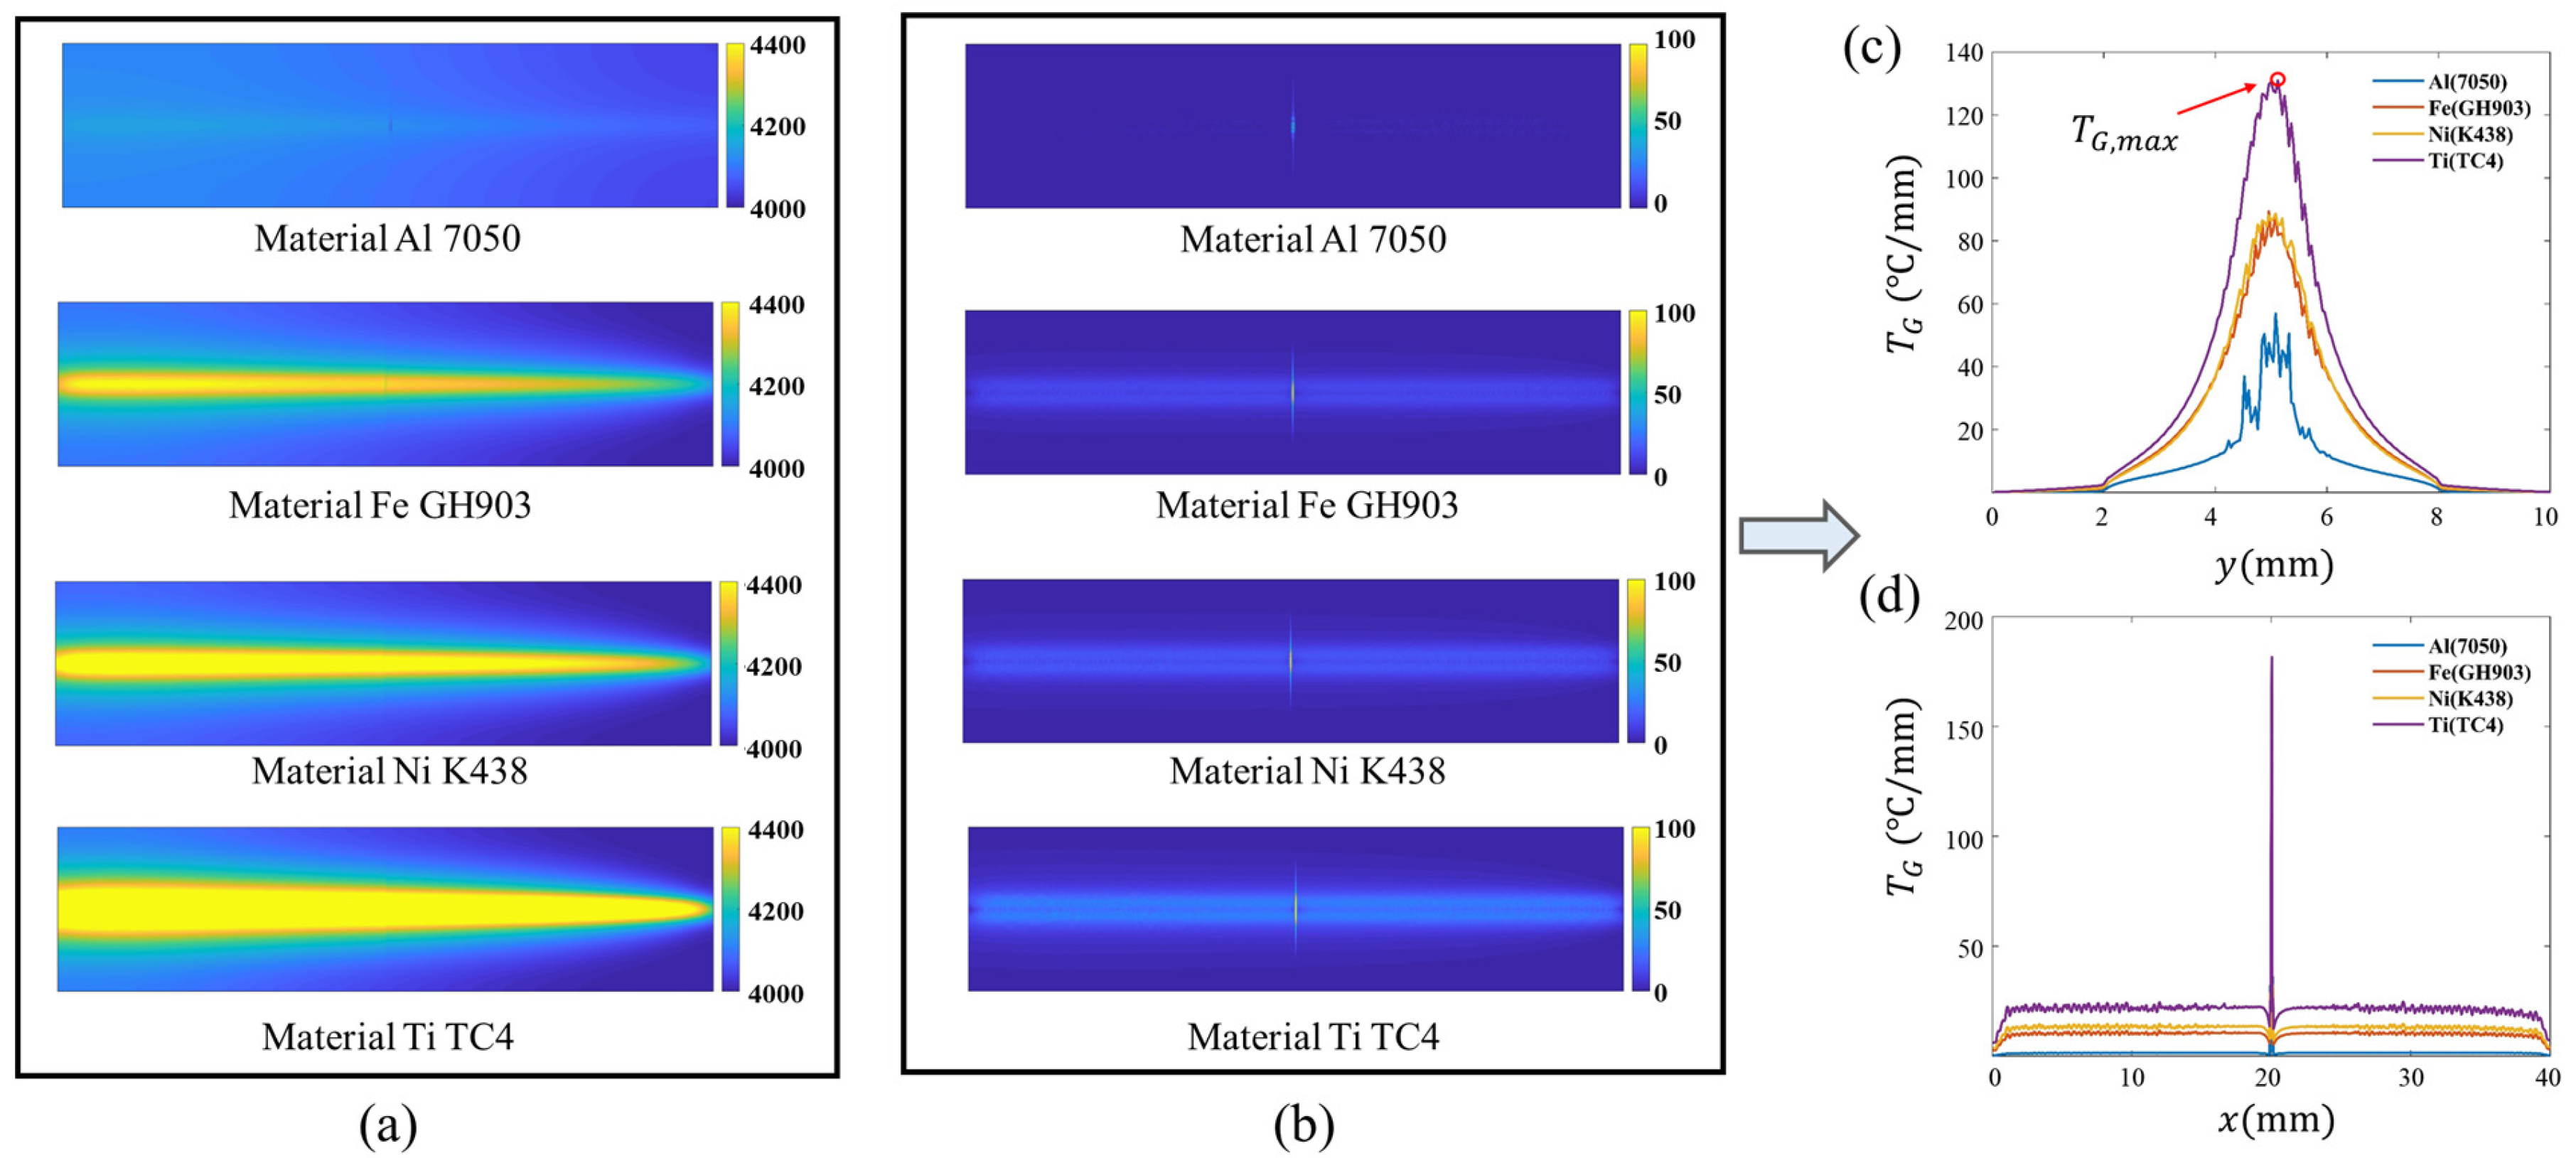
Figure 8.
Crack detection at different laser effective power ( = 10 mm/s, = 50 Hz): (a) superposition results of ; (b) linear fitting relationship between and the maximum of ; (c) the distribution of along crack Center ( ).
Figure 8.
Crack detection at different laser effective power ( = 10 mm/s, = 50 Hz): (a) superposition results of ; (b) linear fitting relationship between and the maximum of ; (c) the distribution of along crack Center ( ).

Figure 9.
Crack detection at different laser scanning speed (= 1800 mW, = 50 Hz): (a) temperature field of laser scanning through the crack; (b) superposition results of ; (c) temperature gradient field ( ).
Figure 9.
Crack detection at different laser scanning speed (= 1800 mW, = 50 Hz): (a) temperature field of laser scanning through the crack; (b) superposition results of ; (c) temperature gradient field ( ).
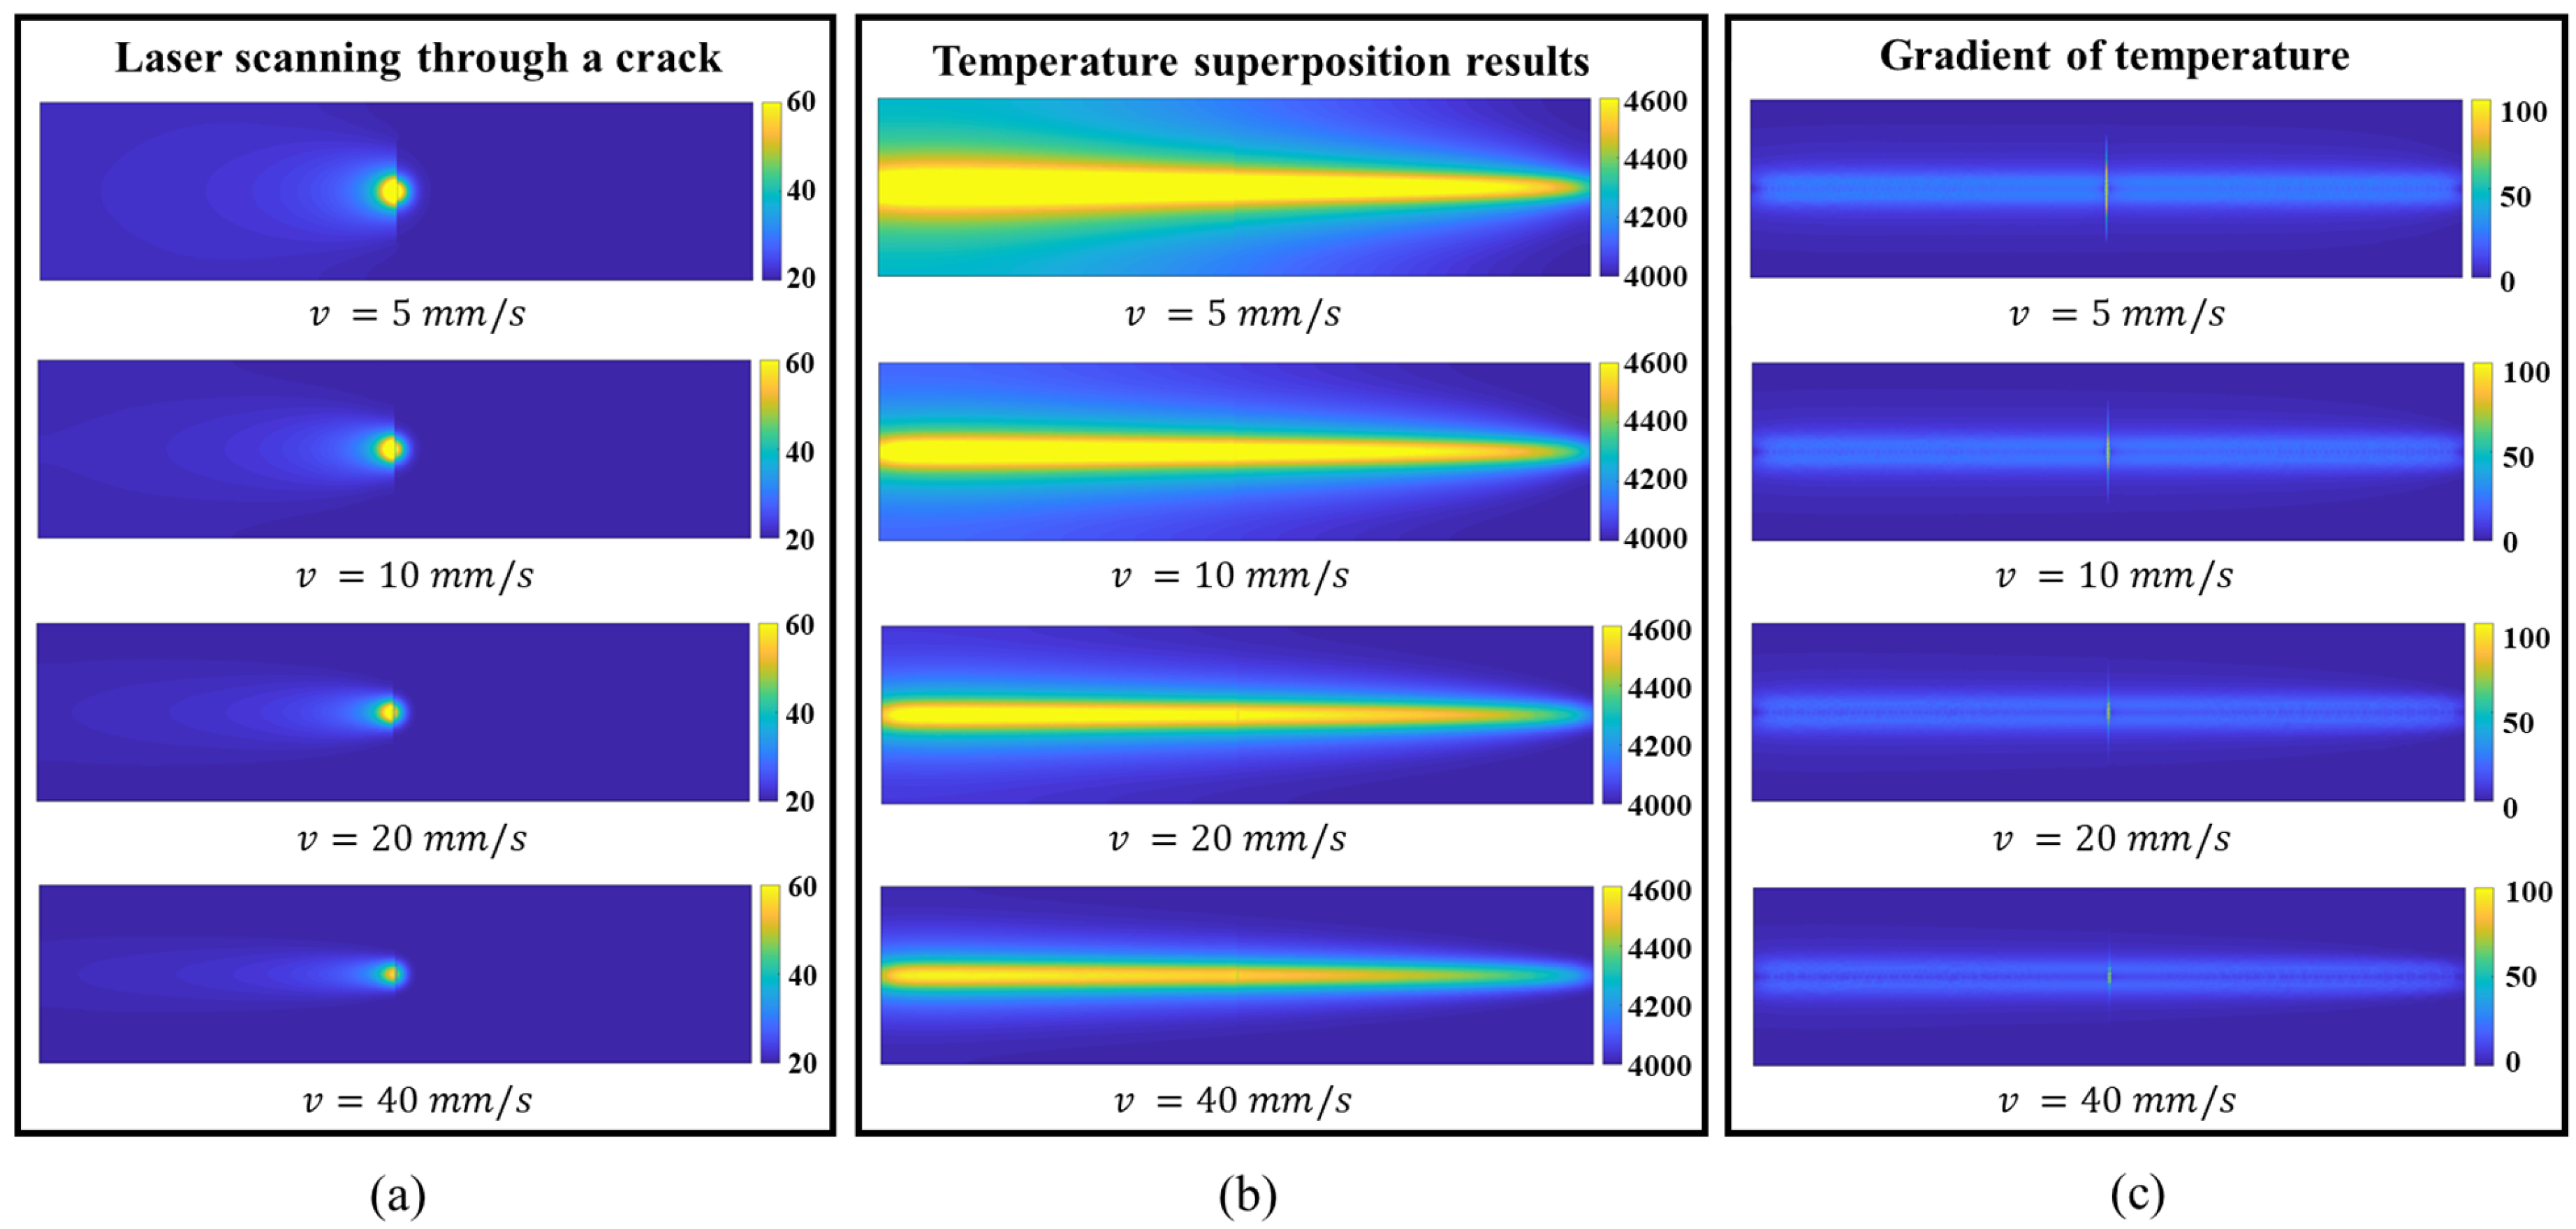
Figure 10.
at different thermal image acquisition frequencies ( = 10 mm/s, = 1200 mW and acquisition time is 2 s): (a) = 10 Hz; (b) = 20 Hz; (c) = 50 Hz; (d) = 100 Hz.
Figure 10.
at different thermal image acquisition frequencies ( = 10 mm/s, = 1200 mW and acquisition time is 2 s): (a) = 10 Hz; (b) = 20 Hz; (c) = 50 Hz; (d) = 100 Hz.


Figure 12.
Experimental system: (a) laser thermography system; (b) laser-repaired component; (c) Setting of laser scanning direction.
Figure 12.
Experimental system: (a) laser thermography system; (b) laser-repaired component; (c) Setting of laser scanning direction.

Figure 13.
Detailed processing workflow for thermal images: (a) Thermal images acquired by an infrared camera; (b) Digital thermal image sequence converted by MATLAB; (c) Post-processing results of digital thermal image sequence.
Figure 13.
Detailed processing workflow for thermal images: (a) Thermal images acquired by an infrared camera; (b) Digital thermal image sequence converted by MATLAB; (c) Post-processing results of digital thermal image sequence.

Figure 14.
Temperature field of laser scanning in four directions and extraction results of crack morphology: (a) 0° direction; (b) 45° direction; (c) 90° direction; (d) 135° direction.
Figure 14.
Temperature field of laser scanning in four directions and extraction results of crack morphology: (a) 0° direction; (b) 45° direction; (c) 90° direction; (d) 135° direction.

Figure 15.
Detection results of six different scanning direction combination schemes.

Figure 16.
Detection results of two small areas: (a) results of individual scans along each direction and their superimposed results in Area-2; (b) results of individual scans along each direction and their superimposed results in Area-3.
Figure 16.
Detection results of two small areas: (a) results of individual scans along each direction and their superimposed results in Area-2; (b) results of individual scans along each direction and their superimposed results in Area-3.

Figure 17.
The crack detection results of each part of the repair layer.

Figure 18.
Comparison of laser scanning thermography detection result and microscope observations result of surface cracks in Area-1: (a) microscopic observation of surface cracks (50×); (b) surface crack detection result based on thermography; (c) cracks width measurement in area A under microscope; (d) cracks width measurement in area B under microscope.
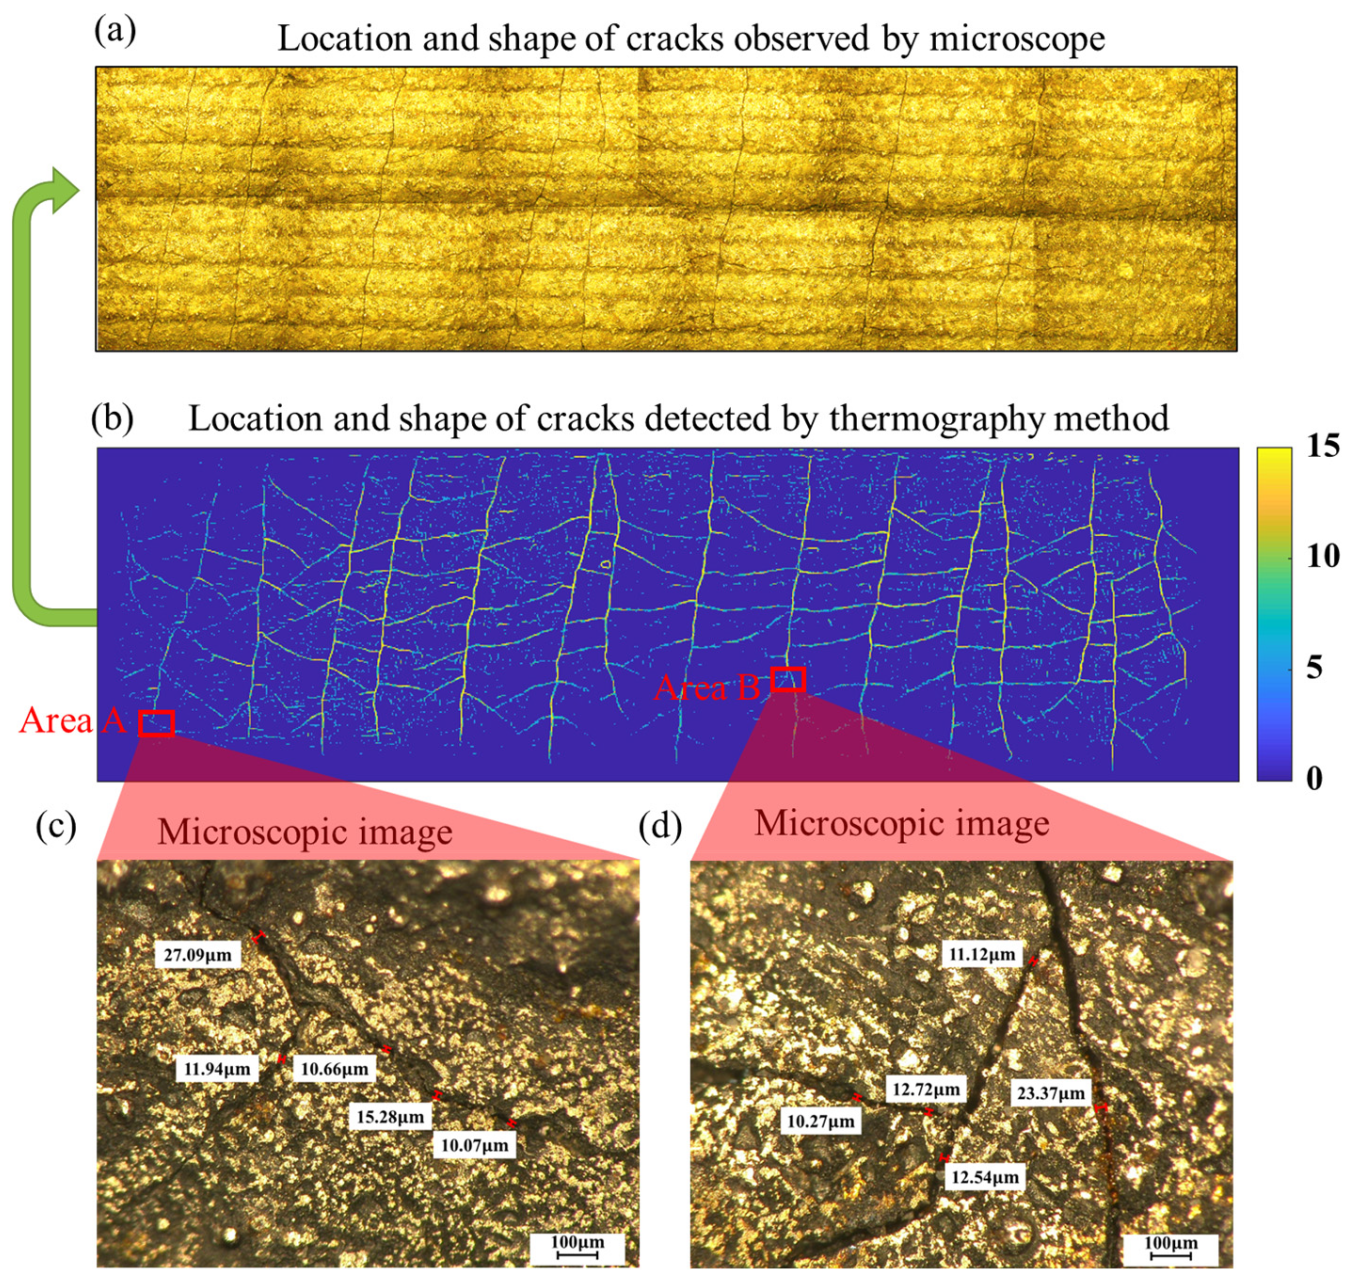
Figure 19.
Thermographic detection of different surface structures: (a) local 3D morphology of repair area 1; (b) combined form of temperature change field in repair area 1; (c) Prewitt edge detection results for temperature change field in the repair area 1; (d) local 3D morphology of smooth area; (e) combined form of temperature change field with smooth area after mask treatment; (f) Prewitt edge detection for temperature change field in smooth areas.

Figure 20.
Thermographic detection of different surface structures: (a) local 3D morphology of repair area 2; (b) combined form of temperature change field after mask treatment in repair area 2; (c) Prewitt edge detection results for temperature change field in the repair area 2; (d) local 3D morphology of repair area 3; (e) combined form of temperature change field after mask treatment in repair area 3; (f) Prewitt edge detection for temperature change field in the repair area 3.

Figure 21.
Temperature distribution of several different measured surfaces along a line .


Table 1.
Thermodynamic parameters of commonly used repair materials.
| Materials | Density | Specific Heat | Thermal Conductivity | Diffusivity |
|---|---|---|---|---|
| Aluminum alloy (7050) | 157 | 57.8 | ||
| Titanium alloy (TC4) | 6.8 | 4.8 | ||
| Nickel-based Alloys (K438) | 11.85 | 3.12 | ||
| Iron-based alloys (GH903) | 16.7 | 2.5 | ||
| Air | 0.023 |
Table 2.
The setting of heat laser parameters and thermal image acquisition parameters.
| P(mW) | v(mm/s) | f(Hz) | |
|---|---|---|---|
| 1 | 1200 | 5 | 10 |
| 2 | 1400 | 10 | 20 |
| 3 | 1800 | 20 | 50 |
| 4 | 2400 | 40 | 100 |
Table 3.
Detecting Area-1 using different laser scanning combinations.
| Combinations | θ |
|---|---|
| Single angle | One of 0°, 20°, 40°, 45°, 60°, 80°, 90°, 100°, 120°, 135°, 140°, 160° |
| 2 angles | 0°, 90° |
| 3 angles | 0°, 60°, 120° |
| 4 angles | 0°, 45°, 90°, 135° |
| 6 angles | 0°, 20°, 90°, 120°,140° |
| 9 angles | 0°, 20°, 40°, 60°, 80°, 100°, 120°, 60°, 40°, 160° |
Table 4.
Comparison of two post-processing algorithms.
| Number of Parameters | Computing Time/s | |
|---|---|---|
| First-order gradient | 5 | 19.7 |
| Second-order gradient | 5 | 24.6 |
| Prewitt edge detection | 2 | 3.32 |
| Sobel edge detection | 2 | 3.41 |
| Roberts edge detection | 2 | 5.16 |
Publisher’s Note: MDPI stays neutral with regard to jurisdictional claims in published maps and institutional affiliations. |
© 2022 by the authors. Licensee MDPI, Basel, Switzerland. This article is an open access article distributed under the terms and conditions of the Creative Commons Attribution (CC BY) license (https://creativecommons.org/licenses/by/4.0/).
Share and Cite
MDPI and ACS Style
Geng, C.; Shi, W.; Liu, Z.; Xie, H.; He, W. Nondestructive Surface Crack Detection of Laser-Repaired Components by Laser Scanning Thermography. Appl. Sci. 2022, 12, 5665. https://doi.org/10.3390/app12115665
AMA Style
Geng C, Shi W, Liu Z, Xie H, He W. Nondestructive Surface Crack Detection of Laser-Repaired Components by Laser Scanning Thermography. Applied Sciences. 2022; 12(11):5665. https://doi.org/10.3390/app12115665
Chicago/Turabian StyleGeng, Chuanqing, Wenxiong Shi, Zhanwei Liu, Huimin Xie, and Wei He. 2022. "Nondestructive Surface Crack Detection of Laser-Repaired Components by Laser Scanning Thermography" Applied Sciences 12, no. 11: 5665. https://doi.org/10.3390/app12115665
Note that from the first issue of 2016, this journal uses article numbers instead of page numbers. See further details here.