
Aging Study of In-Use Lithium-Ion Battery Packs to Predict End of Life Using Black Box Model


1
FEMTO-ST Institute, Univ. Bourgogne Franche-Comté, UTBM, CNRS, 90000 Belfort, France
2
Escuela Técnica Superior de Ingenieria Aeronautica y del Espacio, Universidad Politécnica de Madrid, 28040 Madrid, Spain
*
Author to whom correspondence should be addressed.
Appl. Sci. 2022, 12(13), 6557; https://doi.org/10.3390/app12136557
Submission received: 16 May 2022
/
Revised: 14 June 2022
/
Accepted: 25 June 2022
/
Published: 28 June 2022
(This article belongs to the Special Issue Advances in Lithium-Ion Automobile Batteries)
Abstract
:In order to study the state of health (SOH) of unbalanced battery packs in real life, a thorough analysis is carried out using only data available and standard charging material. The possible relationships between the different parameters and how they affect aging are studied, leading to the identification of five key parameters to indicate aging, as well as parameters influencing aging. Based on the measurement results, a simple black box model using evolutionary genetic algorithm is presented, which is used as end-of-life prediction model of the battery pack, successfully providing an approximate estimation of aging. This approach might thus be used for the supervision of battery systems during real-life use.
Keywords:
battery; analysis; aging; internal resistance; black box; evolutionary algorithms; prediction1. Introduction
Lithium-ion batteries are key enablers for the sustainable use of energy. One important open question is to analyze the aging of batteries in real use. Numerous works are conducted in laboratory conditions based on isolated battery cells in order to understand the aging [1], and subsequently, models which are capable of predicting aging based on analytical [2], black box [3], or hybrid are proposed [4]. These might be valid for single cell applications such as cell phones in well-defined conditions. However, for most applications, battery packs with multiple cells in series and parallel supervised by a battery management system (BMS) are used. For these kinds of applications, the aging might be more difficult to track due to the influence of BMS, and therefore fewer studies are known [5]. Still, there are quite a few applications using small unsupervised battery modules of some cells in series without supervision by a BMS. This kind of application can be found not only in model aircrafts, as in the presented study, but also in small mobility solutions such as scooters [6].
This project conducts a simplified study of the aging of lithium-ion batteries from a database taken from the real use of nine Hacker Topfuel Eco-x batteries packs of 5000 mAh and 10 lithium cells [7] used in aeromodeling of aircrafts during the years 2016 to 2021. The objective of the first part of the analysis is to discuss the relationships between the data obtained and to provide an explanation about the performance evolution of these batteries. The aim is to determine which of the parameters analyzed are most decisive in aging. A nondimensional representation is chosen to harmonize influence of parameters.
Subsequently, different evolution algorithms used to make black box battery models are compared. The implementation of the chosen model is presented, as well as a battery life prediction model design, using a genetic algorithm (GA) in MATLAB. The purpose of the project is to explain a procedure for studying and modeling the performance of small unsupervised battery packs. Based on this kind of model, it would be possible to provide a robust prediction or remaining useful life (RUL) in real time using limited amount of memory, so that it might be integrated in a VCU (vehicle control unit). Although the data show trends conforming to the theory, the results still must be discussed carefully, as the measurements are performed in real use and not in laboratory conditions.
In the next section, the experimental setup is presented. A thorough analysis of measurement results with the goal to identify parameters indicating cell aging is presented in Section 3. The black box model based on GA is presented in Section 4 and it is trained with various sets of data with the goal of predicting battery aging. The paper closes with conclusions in Section 5.
2. Experimental Setup
Firstly, a database including nine Hacker Topfuel Eco-x batteries [7] of 10 lithium cells each, 5000 mAh of factory capacity, 3.7 V of nominal voltage, and 4.2 V of charge voltage per cell is created. These cells were used in the racing of aeromodeling aircrafts during the last five years, from 2016 to 2021. Some values are recorded on the cell level, others on a pack level.
The data collected for each battery cell include the following:
- Number of charging processes.
- Dates of charging processes.
- Initial voltage of each battery cell in the charging processes.
- Final voltage of each battery cell in the charging processes.
- The data collected for each battery pack include the following:
- Charge capacity stored during each charging process, measured in mAh.
- Measurements of the internal resistance at the end of the charging processes.
- Estimations of relaxation voltage drop.
- Estimated ambient temperature in flight.
- Differentiation between flight types between “training flight” and “competition flight”.
To obtain the data related to the charging processes, an intelligent charger, model “icharger 4010 duo” [8], was used (Figure 1). This charger can charge two batteries in parallel with a maximum power of 2000 W (max 1400 W per channel) and has some integrated options, such as the measurement of the voltage with a precision of 1 mV and the internal resistance with a precision of 0.1 Ω. All values can be saved on a micro SD card.
Since the purpose of data collection was not initially to conduct a further academic study on them, the measurement conditions such as ambient temperature and rest times between use and charging were not predesigned, so full homogeneity cannot be expected. Still, this presents the kind of data that can be obtained for real-life applications.
The charge profile used for these batteries was the same in all cycles performed, except for the initial voltage of each lithium cell, which depended on the previous use. A linear loading ramp was made at 3.8 A (0.8 C) until reaching 4.05 V; then the C-rate was halved, and another linear load ramp was made at 1.9 A up to 4.15 V; at that point, the charger automatically gradually reduced the current to 1/10 until about 4.17 V; finally, the battery finished charging at that final C-rate (0.19 A), reaching 4.2 V per cell. Therefore, the final voltage of each cell in all charging processes is 4.2 V (Figure 2). This charging profile was designed after multiple tests, looking to extend the life of the battery, but with an adequate charging time.
The ambient room temperature and storage temperature were considered between 21 and 22 °C. The temperature of the battery during charging is estimated to have evolved from room temperature to approximately 41 °C maximum. These values are considered common, and the effects of possible variations were not considered.
To estimate the ambient temperature during the discharge of the battery in flight, the official data of AEMET [9] are taken knowing the dates and the location where the corresponding training and competitions took place. As AEMET only offers maximum and minimum temperature data, a relevant rough estimate was made, taking into account the training timetables.
Due to the high variability in aircraft flights, it is difficult to establish a clear differentiation between them. However, it was considered interesting to separate between training and competition flights, since in this case there is a clear difference in the rate of discharge. On average, approximately 65 A of average discharge current were estimated in training flights and 80 A in competition flights.
Due to the particularity of real data collection, the resulting analyses cannot be considered to be purely scientific in nature. However, the use of real data can help to analyze the process itself and highlight main trends that contribute to battery aging, which can be connected to existing theory.
Moreover, as the analysis is based on real data, the variability of battery performance is included in the study. The use of real data also contrasts with conventional analysis processes performed in laboratories where conditions are preplanned, whereas in laboratory analysis, we usually try to eliminate parameters from the study by designing the conditions of experimentation in a certain way. In this case, all the available variables are evaluated, and an attempt is made to identify the parameters dominating the cell aging. These factors were later integrated in the model (Section 4).
3. Data Analysis
First, the evolution of the main parameters of each battery were analyzed individually; common parameters between them were identified and then subsequently linked to scientific explanation. A comparative analysis was then performed to identify which of these parameters most significantly affects battery performance [10].
The studied parameters include internal resistance, relaxation voltage drop, depth of discharge, voltage dispersion between cells, the ambient temperature during operation, storage time between uses, discharge rate, and loss of capacity through the relationship between charged mAh and variation of operating voltage experienced in the battery during each charge. The goal of this study is not only to identify parameters that influence aging, but also to identify parameters on which a model should be based.
3.1. Internal Resistance
The internal resistance is a fundamental parameter in the analysis of batteries since their increase is one of the most accepted indicators of aging [11]. It is one of the measurements that is conventionally used to indicate the end of life of batteries, along with the fall in capacity and the increase in relaxation voltage drop [10].
The internal resistance measurement was not foreseen initially due to the great variability of the values obtained and the low accuracy of the meter. However, they were noted at certain moments, only when they were consolidated changes in the values obtained, that is, when all the lithium cells were stabilized at a higher internal resistance value. Despite this, the number and accuracy of measurements are considered sufficient to study their evolution. The icharger [8] was used to take the measurements, as it allows to obtain the internal resistance value of each cell. The battery pack internal resistance was registered, as the sum of the cells’ values.
Finally, the internal resistance will be the parameter on which the prediction models will be focused. To study its evolution, its percentage increase in reference to its factory value, 35 mΩh (100%) will be considered.
Figure 3 presents the evolution of the internal resistance in the nine Hacker Topfuel Eco-x batteries that were studied. The points indicate the internal resistance measurements taken at different moments of battery life. The lines are connected by polynomial for easier reading. Three different groups of batteries can be distinguished: for batteries 1, 2, 5, and 6, the internal resistance stays practically constant at the beginning of life, preceding an exponentially increasing growth. The growth of internal resistance can be linked to a deep discharge, such as for battery 1 in cycle 64, where a 4905 mAh discharge resulted in a 23% increase in internal resistance. Generally, the increase of internal resistance is mainly caused by contact loss, including the binder decomposition, current collector corrosion, the oxidation of conductive agent, and eventual loss of ionic concentration in electrolytes [12]. Some batteries (B3 and B4) encounter even a slight decrease of internal resistance during the beginning of life. The internal resistance of battery 4 dropped to 91.5% and remained stable for several cycles; one explanation is the good use of the cells. These batteries also happened to have the longest lifetime. This phenomenon is called passive electrode effect and is linked to [13].
It is also interesting to study the case of battery 7, whose internal resistance began to grow considerably and early in use, presenting a different evolution from the rest. This was due to the poor use of this battery in the first few months and indicates poor battery health. This is the battery of the group with the shortest life (42 cycles) and it also ended up particularly swollen.
Comparing the evolutions of all cells in the same battery, it can be seen that during much of the battery life, the resistances of the 10 evolve in approximately the same way. However, at the end of life, the cells that are located at the ends of the serial connections experience much greater rises than the cells located in the middle of the battery, because they are more in demand. Despite this phenomenon, no differences were identified in the performance of these cells compared to the others, although it is not ruled out that they exist.
Finally, the comparison of the evolution of internal resistance in all batteries shows, despite the comparable evolution of resistance increases, a clear link between the early increase of internal resistance and battery life. Hence, the slope of the internal resistance will be one of the parameters that will be used to compare aging, together with the number of cycles.
3.2. Relaxation Voltage Drop
In the same way as internal resistance, relaxation voltage drop has been estimated at certain moments of the batteries’ life, usually at the same time that internal resistance measurements were taken (Figure 4). To achieve this, the battery voltage values were taken 2 h after the end of the charging process. Then, relaxation voltage drop was determined:
VSD = V(t = 0) − V(t = 2 h)
As in the internal resistance, the increase in relaxation voltage drop is one of the indicators of the aging of batteries [14]. As was performed with the internal resistance, to study the relaxation voltage drop evolution, its percentage increase, in reference to its first estimated value of approximately 0.005 V, which represents 100%, is taken into account.
Results show that for batteries 1 to 6, the rate of growth of relaxation voltage drop is accelerating throughout the life, so that the evolution turns out to be exponential, to a greater or lesser extent. An exception is found in battery 7 whose evolution of relaxation voltage drop, similar to its evolution of internal resistance, presents quite a different profile from the rest, with a sharp increase from the beginning of life. It was observed that the evolution of relaxation voltage drop turns out to be linked to that of internal resistance, with which the growth rates of both parameters increase at the same time.
Figure 5 underlines that the relationship of both parameters is practically linear, which supports the trend explained above that presupposes a direct relationship between the increase in internal resistance and an increase in relaxation voltage drop. Consequently, in the study of aging, only the increase in resistance will be used as a value to be contrasted with the rest of the parameters, although the same conclusions obtained from the analysis are valid with the value of relaxation voltage drop. The same occurs when creating the prediction model.
3.3. Depth of Discharge
The discharge depth measures the discharged capacity in each use in mAh through the value of the capacity charged in each subsequent charging cycle. Over-discharges can be very harmful to battery performance, especially when performed at a high discharge rate, and their continued repetition can lead to shortening battery life [14].
In this case, the amount of discharged capacity depends on each individual use that was given to the battery, so this parameter will be studied comparatively, taking the average discharged capacity of each battery.
As it can be seen in Figure 6 (excluding the case of battery 1), the relationship between average discharged depth and lifespan is direct, that is, the higher the average discharge capacity per use, the shorter the lifespan. It can also be observed how this relationship is linked to the growth of internal resistance (Figure 7); greater depth of discharge produces a more pronounced increase in internal resistance. The value of the depth of discharge of the figures appears in a dimensionless way based on the average value of depth of discharge of all battery packs. The same applies to the value of the ratio of the internal resistance, which will continue to appear in a dimensionless way in the rest of the comparisons made in this analysis.
The relationship of discharged capacity to lifespan and increased internal resistance is noticeably clear, so it is one of the parameters used to develop the modelization.
3.4. Voltage Dispersion between Cells
The voltage dispersion between cells measures the variation of discharge between the different battery cells [15]. It is interesting, especially in batteries without BMS, as it can indicate battery malfunction that is not able to balance the discharge between the cells [16]. This indicator can also be used to compare the state of the different cells within the battery.
To evaluate the variation of discharge in each cell, the difference between the end and start voltage is subtracted and compared to the difference between end and initial average voltage of all the cells in that charge cycle. As the final voltage is 4.2 V in all cases, the equation is
VDisp = (4.2V − Vinput) − (4.2V − Vinput-avg) = Vinput-avg − Vinput
Figure 8 represents the evolution of the voltage dispersion of each individual cell for battery 5. A high variability of the voltage between the cells can be observed, even though no trend can be seen. No correlation between these values and the individual internal resistance of each cell was identified, although it is not ruled out that it may exist.
To study the evolution of this parameter over the life of the battery, the total dispersion of the 10 cells in each cycle is studied. The values are transformed to dimensionless numbers based on each pack average voltage dispersion.
Figure 9 presents the evolution of the voltage dispersion of battery 5. A slight upward trend throughout life might be observed, but it is not precisely clear because the values are extremely variable between cycles. This same observation can be made for the rest of the battery packs under study.
To observe more clearly the trend of this evolution, a weighted correction of the values obtained was made, taking into account the three previous and subsequent values, so that the peaks in the graph are eliminated. For this purpose, Equation (3) is used:
This weighted correction will continue to be used in this analysis.
Figure 10 shows a clear upward trend in the voltage dispersion in the weighted description. Finally, a direct relationship can be obtained between the aging of the battery and the increase in voltage dispersion between cells. This makes sense, as one may observe that the aging of a battery could cause malfunctions that prevent the cells from balancing well during discharge.
Figure 11 and Figure 12 show the relationship of the average cell voltage dispersion of each battery to the number of cycles and the growth of internal resistance. It is observed that the relationship is concise, a greater dispersion of the voltage leads to the premature aging of the battery and, subsequently, to greater growth of its internal resistance. Due to this trend, voltage dispersion between cells is one of the parameters that will be considered in the final modelization.
It also seems interesting to analyze whether there is a direct relationship between voltage dispersion and discharged capacity, since the greater the discharge depth, the more the battery is stressed, and malfunctions could occur that cause the cells to discharge asynchronously.
Figure 13 presents the evolution of the comparison between both parameters for battery 5 during their service life; the weighted correction of the voltage dispersion was applied. In addition, both parameters are presented in a dimensionless way based on each battery average values. There does not seem to be a clear relationship between them. The same analysis can be made for the rest of the battery packs.
3.5. Temperature
Battery cell temperature is one of the parameters that primarily affects the operation of the battery. Low temperatures can cause lower capacity, pronounced increases in internal resistance, and problems in the balance of discharged cells. On the other hand, elevated temperatures can overstress batteries during discharges and shorten service life [17,18].
Figure 14 shows the comparative evolution between the voltage dispersion (with the weighted correction applied) and the ambient temperature of use for battery 5. Both parameters are presented in a dimensionless way based on their respective average values in each pack. There is no clear correlation between them, and this can be seen in the rest of the batteries in the same way.
It can be concluded that in this case, the temperature of use did not directly affect the operation of the batteries. This may be because temperature peaks are not extreme or continuous enough over time to cause negative effects. The average temperature was 22.5 °C with peaks from 3.5 °C to 39 °C. Hence, in this study, the temperature will not be taken into account to perform the modeling.
3.6. Storage Time
The storage time of each charge/discharge cycle is understood as the number of days the battery has been unused between the previous charge and the new use. Long storage periods can be detrimental to batteries as they produce greater capacity losses in relaxation, in addition to irreversible capacity losses [19]. Unfortunately, it was not possible to study these phenomena directly with the available data.
Regarding the relationship of this parameter with internal resistance, it was observed during measurements that prolonged periods of storage have served to consolidate increases in internal resistance. There is no evidence to indicate that storage time directly influences resistance, but it seems that longer storage time is linked to an increase of internal resistance by stabilizing all cells to an increased value at which they were tending.
Figure 15 and Figure 16 compare the average storage time values of each battery with the final number of cycles of use and with the increase in internal resistance. It is observed how there is a clear relationship between these parameters that supports the theory, that longer storage times lead to a reduction in cyclic battery life and more pronounced increases in internal resistance.
Because of this direct relationship, storage time will be one of the parameters considered in the model.
3.7. Discharge Rate
To study the effect of the discharge rate, we differentiated between two types of flight, training, and competition, the first (65 A average current, approximately) less demanding than the second (80 A approximately). This parameter is very important for the study of the behavior of the batteries, since high discharging rates can cause a decrease and loss of capacity, and therefore a shorter use life [20,21].
An attempt was made to find a relationship between a greater dispersion of voltage between cells coinciding with the competition flights, since it seems logical to think that with a higher discharge rate the battery will be more stressed, and malfunctions may occur that cause bad balancing between cells. If we compare the average voltage dispersion between the two types of flight, we observe how in the competition flights the value is slightly higher (0.038 V > 0.035 V). However, this trend is not sufficiently appreciable to affirm this phenomenon, although it is not out of the question either.
Regarding the relationship with internal resistance, there is no evidence that high discharge rates cause instantaneous peaks in resistance. Observing the evolution of both parameters, this phenomenon does not occur. To study how this parameter affects aging, a comparative analysis is performed between all batteries. In this case, we will use the total percentage of competition flights performed as a measure of the average discharge rate.
Figure 17 and Figure 18 show the ratio of the average discharge rate of each battery compared to the total number of cycles and the growth of internal resistance. It is observed how a higher rate of discharge tends to cause a shortening in cyclical life, as well as a greater increase in internal resistance. This is consistent with the theory explained above [21]. In addition, it was observed how high discharge rates in the first uses of the battery led to a more marked deterioration of performance for the rest of the battery’s life. This may be because these initial surges prevent the battery from stabilizing properly in the first few cycles.
Due to the trends caused by the discharging rate on aging, it will be one of those included when performing the modelization.
3.8. Loss of Capacity
The loss of capacity is an important phenomenon in the study of batteries, since it is the fundamental parameter that is used to analyze aging [22].
To make estimations, the relationship between the discharged capacity in mAh and the difference between the initial and final voltage in the charge are used, resulting in ΔmAh/ΔV.
Prior to further explanations, it is necessary to correctly define the concepts of the state of charge and the state of health of a battery. The state of health (SoH) [23] is a “measurement” that reflects the general condition of a battery and its ability to deliver the specified performance compared with a fresh battery. It takes into account factors such as charge acceptance, internal resistance, voltage, and self-discharge. It is a measure of the long-term capability of the battery and gives an “indication”, not an absolute measurement, of how much of the available “lifetime energy throughput” of the battery has been consumed, and how much is left. During the lifetime of a battery, its performance or “health” tends to deteriorate gradually due to irreversible physical and chemical changes which take place with usage and with age until, eventually, the battery is no longer usable or dead. Therefore, the SOH is an indication of the point that has been reached in the life cycle of the battery and a measure of its condition relative to a fresh battery. The state of charge (SoC) [21] is defined as the available capacity expressed as a percentage of some reference. Figure 19 shows an explanation chart about SoH and SoC:
As a battery loses capacity, its SoH is reduced, while its operating voltages remain constant. In this case, the maximum capacity that the battery can store will be reduced with respect to its factory value (5000 mAh) throughout use, while the voltage values that define the SoC remain the same, so that voltage ranges of equal magnitude when charging will mean less mAh charged as the battery ages. The same approach is also used by the ICA (incremental capacity analysis method) even though this is normally performed in a specified voltage range.
To analyze this phenomenon, the evolution of the parameter ΔmAh/ΔV in all battery packs throughout their useful life is obtained. To better visualize existing trends, the evolution of ΔmAh/ΔV after the application of weighted correction is presented in Figure 20. As previously, the value of the parameter is presented as dimensionless based on the average value for each battery.
The evolution of ΔmAh/ΔV in battery 5 with weighted correction (Figure 20) shows a decreasing trend, which supports the theory. The parameter numerator (mAh discharged) decreases with the time of use, while the denominator (ΔV) remains constant. However, this does not happen in all cases. In the cases of batteries 2 and 7, the evolution turns out to be increasing, which is not coherent with initial observations. This leads to the invalidity of the above reasoning in this case.
Despite these estimates of capacity drop, this phenomenon cannot be studied correctly because data collection is not suitable for it. Therefore, it will not be a parameter that is used to make the subsequent prediction model.
3.9. Resume
This analysis accomplishes the initial objective, which was to choose which of the parameters under study had a real influence on the performance of these batteries and discard those that were irrelevant. The conclusions presented in Table 1 were drawn.
Batteries are very complex devices, and it is very difficult to establish precisely which parameters affect their performance to a greater or lesser extent. Therefore, there is a possibility that the conclusions obtained through this analysis are not accurate enough, so that parameters that have been determined to be influential in the performance of the batteries may have not had a real effect or at least not enough importance, while other noninfluential parameters may have had an effect that was not correctly detected. Despite this, the parameters determined to be influential enough after this analysis are taken into account to design a model of aging of the batteries.
4. Modeling and Prediction
Based on the above-presented analysis, a model is designed that reproduces the behavior of the battery with respect to aging based on the evolution of internal resistance. For this purpose, a black box type model based on an evolutionary algorithm is used.
Black box models rely exclusively on computing data to recreate the relationship between the input and output parameters of a problem. They do not require an understanding of the physics that explains the problem, they are simply able to solve it by processing large amounts of data made up by the experience of the problem [21]. Classically, black box models based on neural networks (ANN) [24], support vector machine (SVM) [25], fuzzy logic clustering (FLC), and Bayesian probable models (BPM), are implemented to estimate the variation of a battery’s parameters with its aging and state of charge [26].
Evolution algorithms are a family of metaheuristic methods for solving optimization problems, without the use of derivation. Their main characteristic is that they are based on natural behaviors that solve optimization problems such as finding the best way to find food or choosing which are the best genes for the conservation of a species. They are usually systems with large populations where each individual tries to find the best possible solution to the problem and interacts with the rest to approach the optimal solution together [23].
Four of the most used evolution algorithms are particle swarm optimization (PSO), genetic algorithm (GA), ant colony optimization (ACO), and artificial bees algorithm (ABA). PSO is based on the interaction of some animals, such as birds, when they go in the swarm in search of a common goal, such as food sources [27,28]. GA is inspired by the biological evolution of species by genetic theory so that individuals continuously evolve adapting better to survive, which is the problem to be optimized [29]. ACO is based on the behaviors of ants when they seek the best ways to find food sources [30]. The ABA is inspired by the bees’ food search for a hive that tends to optimize the use of its members [31].
Among these optimization algorithms, the two most used in battery estimation are PSO and GA. Adaptation of PSO is observed in various works to estimate the state of charge and the state of health of batteries but it strongly depends on population size and quality of the data selected at the beginning, and its solution takes longer to converge and is voluminous to implement on a real-time basis [32] Hence, GA is chosen for this model, as its implementation for this problem is simpler and does not require long computation times. In addition, the PSO can become stuck in optimizations of multidimensional problems, by becoming blocked in a local optimum.
Batteries 1, 2, and 3 are used to train the internal resistance evolution model that will serve as the basis. Subsequently, batteries 4, 5, 6, and 7 are used to validate this model and make some adaptations if necessary. Finally, for the prediction model, the previous seven batteries are used as a historical database and batteries 8 and 9 are used for the final testing.
4.1. Evolution Model
For the black box model of the evolution of battery performance, a GA [28] was used. In this case, the output of the algorithm is the evolution of the internal resistance of the battery, whose growth indicates aging, as seen in the analysis.
After performing the previous data analysis, the following seven parameters that are used are (Figure 21) the following:
- Number of cycles (i).
- Training/competition flight (f).
- Discharged capacity, based on historical average discharged capacity (c).
- Voltage dispersion between cells (d).
- Difference between input and output voltage in each charge (v).
- Days of pre-storage (s).
- Initial factory resistance (R0).
To recreate the evolution of internal resistance in each cycle of charge and discharge, the algorithm operates based on the increase in resistance in that cycle, using Equation (4).
The constants A, B, C, D, E, F, and G are the solution parameters to be optimized by the GA through creating, sorting, crossing, and mutation; and that will lead to the final solution to the problem (Figure 22).
To have a proper relationship between shorter computation time and greater model accuracy, a population of 1000 members was chosen. Considering that the seven batteries are evaluated, the computation time between iterations is approximately 0.2 s, using a computer with 8 GB RAM and an Intel Core i5-7200U processor. The time it takes the algorithm to find a suitable solution depends on its own evolution and is random. The average duration is estimated at around 2.6 min, with about 750 iterations.
For the first population, a number n of random combinations of the constants of the problem are created. Each of these combinations is a possible solution. Each of these combinations is then evaluated with respect to the actual evolution of internal resistance. To achieve this, the evolution of the resistance of the battery resulting from the application of each possible solution is recreated and the difference with the real value in each cycle is obtained. The total sum of the differences in each cycle squared makes up the total evaluation of the solution, which will be better when lower (Equation (5)).
This process is carried out for all the batteries that are under study, and the total sum of the evaluations obtained by combination is the total evaluation of each proposed solution. In this way, solutions that present particularly good results in some batteries and unsatisfying results in others are eliminated. The process is repeated until the stop criteria are met.
Batteries 1, 2, and 3 were used to train the initial model, because they correctly represented an example of a medium, short, and long-life battery, respectively. The results obtained are presented in Table 2 and Figure 23.
The accuracy of the first model for batteries 1, 2, and 3 was remarkably high. The R2 ratings for each battery were R2(B1) = 0.9653; R2(B2) = 0.9974; R2(B3) = 0.9644.
However, when testing this first model with some batteries which were not used to train the algorithm, it was found that the results in these cases were not satisfactory (Figure 24).
Due to these results, it was necessary to make certain corrections to the model, including batteries 4, 5, 6, and 7 as part of the data available to train the algorithm, although it continued to give more weight to batteries 1, 2, and 3 (Table 3 and Figure 25). Particularly, batteries 1, 2, and 3 weighted a value of 3, batteries 4 and 6 weighted 1.5, and, finally, batteries 5 and 7 had a 0.5 value.
This model has a lower accuracy in batteries 1, 2, and 3: R2(B1) = 0.8767; R2(B2) = 0.9052; R2(B3) = 0.9088. However, it makes a more suitable approximation for the rest of the batteries: R2(B4) = 0.7205; R2(B5) = 0. 3101; R2(B6) = 0.8586; R2(B7) = 0.4138. The worst approximations occur in batteries 5 and 7, which is normal given that they have the most exceptional internal resistance evolution of all the batteries under study (Table 3).
It can be inferred that the model draws very irregular internal resistance evolutions compared to the “real” results. This happens because of the simplicity of the equation used to develop the prediction model, in which complex corrections may be needed to increase its accuracy. Furthermore, the predictions in this model are made from data of six different parameters extracted from real use measurements. Therefore, the evolution of these parameters tends to be very anarchic in every cycle, causing these extreme fluctuations. For these reasons, in this case, the proximity of each result tendency to the real evolution should be considered rather than their actual shape comparison, also considering that the real behavior of the internal resistance is not as regular as these graphs show.
It is important to understand that these types of black box models do not really understand the physics inside the battery [33]. This can be observed very clearly in the results obtained, where the constants that multiply the number of cycles and the discharged capacity are negative. This means that the internal resistance decreases as the battery ages or if the discharge depth increases, which is completely contrary to what was seen in the previous analysis. Therefore, although the model designed is accurate enough for primary predictions, it is important to understand the physical interpretation that causes this evolution of internal resistance.
4.2. Prediction
The goal is to understand how batteries work and be able to anticipate their possible ageing and malfunction, to further proactively conduct maintenance accordingly. Therefore, the development of prediction models on the performance of the batteries is essential so that the user can make better use of the battery, which can extend the life of the said battery.
To design the prediction model, the model of the evolution of internal resistance previously created is used as the base. It is virtually impossible to estimate the lifespan of a battery before using it, as it depends directly on the quality of use given to it. It would be similar to trying to figure out how long a person is going to live before they are born.
The objective is to create a range of end-of-life possibilities among which the actual end of life of the battery is expected to be found. For this, the model will be based on the historical data of batteries 1, 2, 3, 4, 5, 6, and 7 and the data obtained from the previous use of the battery under study. The model elaborates two possible evolutions of internal resistance that will correspond to the upper and lower limit between which reality is found. This provides a broader provision of battery performance which includes both the good use and the bad use.
Figure 26 presents the prediction model flow chart including the structure of this prediction model.
First, the values of discharged capacity, previous storage time, and flight type of the new cycle are randomly created. For this, the historical data and the previous experience of the battery are considered, giving more weight to one or the other, depending on the number of cycles prior to the prediction, so that more importance is given to the experience the greater it is.
The values of the voltage dispersion between cells and the difference between input and output voltage in the charge are then randomly created. To achieve this, the model is based on the historical relationship of these parameters with the previously created discharged capacity and the cycle number.
Once all these values have been obtained for a new cycle, the evolution model of the previous section is used to obtain a new internal resistance value. If this value does not exceed the end-of-life value, the process repeats, starting a new cycle.
This structure is repeated to create both the upper and lower limit, including, in each case, variations based on the study of the data, so that in one case the probabilities of good use of the battery are increased and in the other, the opposite occurs. The values created to draw the possible evolution of the resistance are random, but these small variations are used in each case, to ensure that there is a certain trend.
To ensure that the boundaries are adequate, a population of possible solutions is created. In each case, a solution is chosen based on a high safety factor, so that the crossing of the boundaries is avoided, as well as extreme values that are completely unrealistic.
One of the specific aspects of this prediction model is that the range of possibilities is limited with greater previous use of the battery. In this way, the model clarifies where the end of life will be found as it is used.
This can be clearly seen when taking the example of battery 1 and a prediction is made with 20, 50, and 80 cycles (Figure 27). As can be seen, the limits narrow when we make predictions closer to the end of battery life: 53–163 with 20 cycles, 83–138 with 50 cycles, and 87–110 with 80 cycles.
Finally, the results of the prediction model are applied to batteries 8 and 9, which had not been used for the construction of the model and were still in use (Figure 28). At the end of life, a level of approximately 230% of the internal resistance had been used, which is the average between the studied batteries.
To obtain these results, a population of 500 solutions was used for each limit, to achieve acceptable accuracy in a short time. The computation time for each iteration of creating an upper and lower bound pair depends on the length of these solutions. However, it is not estimated to be greater than 0.001 s. On the other hand, the total computation time of the model is approximately 3 s.
The presented black box model thus showed that a rather simple model can give a good prediction of the remaining useful life (RUL) of a battery, integrating the changes throughout the battery life. Moreover, this model needs a limited amount of memory and can still run in real time. It would be interesting to integrate such a model in the charger or vehicle software.
5. Conclusions
The project is based on data acquired during the real use of battery packs in model aircraft. Thus, the simplicity of both the method of analyzing this data and the modeling must be highlighted. The goal was to use basic and available tools that are in line with real applications. This is creating a valuable contribution for realistic performance analysis, building the bridge between scientific studies and application.
Still, despite this simplicity, it is shown that it is possible to visualize clear trends in battery performance, explainable based on the observation of some easily accessible key parameters. Therefore, this type of analysis can be very interesting to assimilate the aging of small, unbalanced battery packs in the field before using more complex methods that often require observation in the laboratory.
The same is true in modeling: it was shown that it is possible to create simple models capable of making approximate predictions of battery performance that might, on a battery charger or vehicle software, show a prediction of RUL integrating measurement throughout battery life.
This is complementary with most research approaches, where precise analyses and models based on the real use of these batteries are necessary. This requires larger databases and more complex tools for analysis design and more accurate models to help new users to use batteries correctly.
Therefore, the presented method to study battery aging providing both an approach using easily accessible data and a black box model to predict future aging provides a different point of view of battery analysis. In the future, the presented approach to identify the aging or batteries bases on internal resistance and/or relaxation voltage drop should be applied to bigger datasets for both batteries with and without BMS to see if it is possible to estimate SOH via those simple-to-measure parameters and integrate an RUL estimation in user software.
Author Contributions
Conceptualization, D.C.; methodology, R.T. and M.F.M.; software, M.F.M.; validation, R.T., M.F.M., D.C. and S.V.; resources, S.V.; writing—original draft preparation, M.F.M.; writing—review and editing, D.C.; visualization, R.T. and S.V.; supervision, D.C. All authors have read and agreed to the published version of the manuscript.
Funding
This research received no external funding.
Institutional Review Board Statement
Not applicable.
Informed Consent Statement
Not applicable.
Acknowledgments
This work has been supported by the EIPHI Graduate School (contract ANR-17-EURE-0002) and the Region Bourgogne Franche-Comté.
Conflicts of Interest
The authors declare no conflict of interest. The funders had no role in the design of the study; in the collection, analyses, or interpretation of data; in the writing of the manuscript, or in the decision to publish the results.
References
- Han, X.; Ouyang, M.; Lu, L.; Li, J.; Zheng, Y.; Li, Z. A comparative study of commercial lithium ion battery cycle life in electrical vehicle: Aging mechanism identification. J. Power Sources 2014, 251, 38–54. [Google Scholar] [CrossRef]
- Santhanagopalan, S.; Guo, Q.; Ramadass, P.; White, R.E. Review of models for predicting the cycling performance of lithium ion batteries. J. Power Sources 2006, 156, 620–628. [Google Scholar] [CrossRef]
- Nidhra, S.A.; Dndeti, J.D. Black box and white box testing techniques-a literature review. Int. J. Embed. Syst. Appl. (IJESA) 2012, 2, 29–50. [Google Scholar] [CrossRef]
- Wang, T.; Lin, Q. Hybrid Predictive Models: When an Interpretable Model Collaborates with a Black-box Model. J. Mach. Learn. Res. 2021, 22, 137. [Google Scholar]
- Xiong, R.; Li, L.; Tian, J. Towards a smarter battery management system: A critical review on battery state of health monitoring methods. J. Power Sources 2018, 405, 18–29. [Google Scholar] [CrossRef]
- Hwang, J.J. Sustainable transport strategy for promoting zero-emission electric scooters in Taiwan. Renew. Sustain. Energy Rev. 2010, 14, 1390–1399. [Google Scholar] [CrossRef]
- Hacker Motor Shop. Hacker Brushless Motors—TopFuel LiPo 20C Eco X 5000mAh. Available online: https://www.hacker-motor-shop.com/Batteries-and-accessories/TopFuel-ECO-X/TopFuel-LiPo-20C-ECO-X-5000mAh-2S-MTAG.htm?shop=hacker_e&SessionId=&a=article&ProdNr=95000231&p=5649 (accessed on 5 May 2022).
- Hacker Motor Shop. Hacker Brushless Motors—iCharger. Available online: https://www.hacker-motor-shop.com/Charge-Equipment-Battery-adapter/Chargers/Junsi-Charger/Junsi-iCharger-4010DUO.htm?shop=hacker_e&SessionId=&a=article&ProdNr=89763005&p=11420 (accessed on 5 May 2022).
- Ministerio para la Transición Energética, Gobierno de España. (s.f.); Agencia Estatal de Meteorología (AEMET). Available online: https://www.aemet.es/es/portada (accessed on 5 May 2022).
- Han, X.; Lu, L.; Zheng, Y.; Feng, X.; Li, Z.; Li, J.; Ouyang, M. A review on the key issues of the lithium ion battery degradation among the whole life cycle. eTransportation 2019, 1, 100005. [Google Scholar] [CrossRef]
- Barai, K.; Uddin, W.; Widanage, D.; McGordon, A.; Jennings, P. A study of the influence of measurement timescale on internal resistance characterisation methodologies for lithium-ion cells. Sci. Rep. 2018, 8, 21. [Google Scholar] [CrossRef]
- Gao, Q.; Dai, H.; Wei, X.; Jiang, B. Impedance Modeling and Aging Research of the Lithium-Ion Batteries Using the EIS Technique. SAE Tech. Paper 2019. [Google Scholar] [CrossRef]
- Bank, T.; Feldmann, J.; Klamor, S.; Bihn, S.; Sauer, D.U. Extensive aging analysis of high-power lithium titanate oxide batteries: Impact of the passive electrode effect. J. Power Sources 2020, 473, 228566. [Google Scholar] [CrossRef]
- Redondo-Iglesias, E.; Venet, P.; Pelissier, S. Global Model for Self-discharge and Capacity Fade in Lithium-ion Batteries Based on the Generalized Eyring Relationship. IEEE Trans. Veh. Technol. 2017, 67, 104–113. [Google Scholar] [CrossRef] [Green Version]
- Bharathraj, S.; Kaushik, A.; Adiga, S.P.; Kolake, S.M.; Song, T.; Sung, Y. Accessing the current limits in lithium ion batteries: Analysis of propensity for unexpected power loss as a function of depth of discharge, temperature and pulse duration. J. Power Sources 2021, 494, 229723. [Google Scholar] [CrossRef]
- Savard, C.; Iakovleva, E.; Ivanchenko, D.; Rassõlkin, A. Accesible Battery Model with Aging Dependency. Energies 2021, 14, 3493. [Google Scholar] [CrossRef]
- Erdinc, B.V.; Uzunoglu, M. A dynamic lithium-ion battery model considering the effects of temperature and capacity fading. In Proceedings of the 2009 International Conference on Clean Electrical Power, Capri, Italy, 9–11 June 2009. [Google Scholar]
- Yang, N.; Zhang, X.; Shang, B.; Li, G. Unbalanced discharging and aging due to temperature differences among the cells in a lithium-ion battery pack with parallel combination. J. Power Sources 2016, 306, 733–741. [Google Scholar] [CrossRef]
- Su, L.; Zhang, J.; Huang, J.; Ge, H.; Li, Z.; Xie, F.; Liaw, B.Y. Path dependence of lithium ion cells aging under storage conditions. J. Power Sources 2016, 315, 35–46. [Google Scholar] [CrossRef]
- Barcellona, S.; Piegari, L. Effect of current on cycle aging of lithium ion batteries. J. Energy Storage 2020, 29, 101310. [Google Scholar] [CrossRef]
- Tan, S.-W.; Huang, S.-W.; Hsieh, Y.L.S.-S. The Estimation Life Cycle of Lithium-Ion Battery Bases on Deep Learning Network and Genetic Algorithm. Energies 2021, 14, 4423. [Google Scholar] [CrossRef]
- Zhang, B.S.; Haran, A.; Durairajan, R.; White, E.; Podrazhansky, Y.; Popov, B.N. Studies on capacity fade of lithium-ion batteries. J. Power Sources 2000, 91, 122–129. [Google Scholar] [CrossRef]
- Krupp, A.; Ferg, E.; Schuldt, F.; Derendorf, K.; Agert, C. Encremental Capacity Analysis as a State of Health Estimation Method for Lithium-Ion Battery Modules with Series-Connected Cells. Batteries 2021, 7, 2. [Google Scholar] [CrossRef]
- Lin, H.-T.; Liang, T.-J.; Chen, S.-M. Estimation of Battery State of Health Using Probabilistic Neural Network. IEEE Trans. Ind. Inform. 2013, 9, 679–685. [Google Scholar] [CrossRef]
- Luzi, M. Design and Implementation of Machine Learning Techniques for Modeling and Managing Battery Energy Storage Systems. Ph.D. Thesis, Sapienza Universita di Roma, Roma, Italy, 2019. [Google Scholar]
- Tamilselvi, S.; Gunasundari, S.; Karuppiah, N.; Razak RK, A.; Madhusudan, S.; Nagarajan, V.M.; Sathish, T.; Shamim, M.Z.M.; Saleel, C.A.; Afzal, A. A Review on Battery Modelling Techniques. Sustainability 2021, 18, 10042. [Google Scholar] [CrossRef]
- Poli, R.; Kennedy, J.; Blackwell, T. Particle swarm optimization. Swarm Intell. 2007, 1, 33–57. [Google Scholar] [CrossRef]
- Liang, J.J.; Qin, A.K.; Suganthan, P.N.; Baskar, S. Comprehensive learning particle swarm optimizer for global optimization of multimodal functions. IEEE Trans. Evol. Comput. 2006, 10, 281–295. [Google Scholar] [CrossRef]
- Albadr, M.-A.T.S.; Ajob, M.; Al-Dhief, F. Genetic Algorithm Based on Natural Selection Theory of Optimization Problems. Symmetry 2020, 12, 1758. [Google Scholar] [CrossRef]
- Dorigo, M.; Birattari, M.; Stutzle, T. Ant colony optimization. IEEE Comput. Intell. Mag. 2006, 1, 28–39. [Google Scholar] [CrossRef]
- Karaboga, D.; Basturk, B. A powerful and efficient algorithm for numerical function optimization: Artificial bee colony (ABC) algorithm. J. Glob. Optim. 2007, 39, 459–471. [Google Scholar] [CrossRef]
- Rozaqi, L.; Rijanto, E.; Kanarachos, S. Comparison between RLS-GA and RLS-PSO for Li-ion battery SOC and SOH estimation: A simulation study. J. Mechatron. Electr. Power Veh. Technol. 2017, 8, 1. [Google Scholar] [CrossRef] [Green Version]
- Loyola-Gonzalez, O. Black-Box vs. White-Box: Understanding Their Advantages and Weaknesses From a Practical Point of View. IEEE Access 2019, 7, 154096–154113. [Google Scholar] [CrossRef]
Figure 1.
Icharger 4010 duo [8].
Figure 1.
Icharger 4010 duo [8].
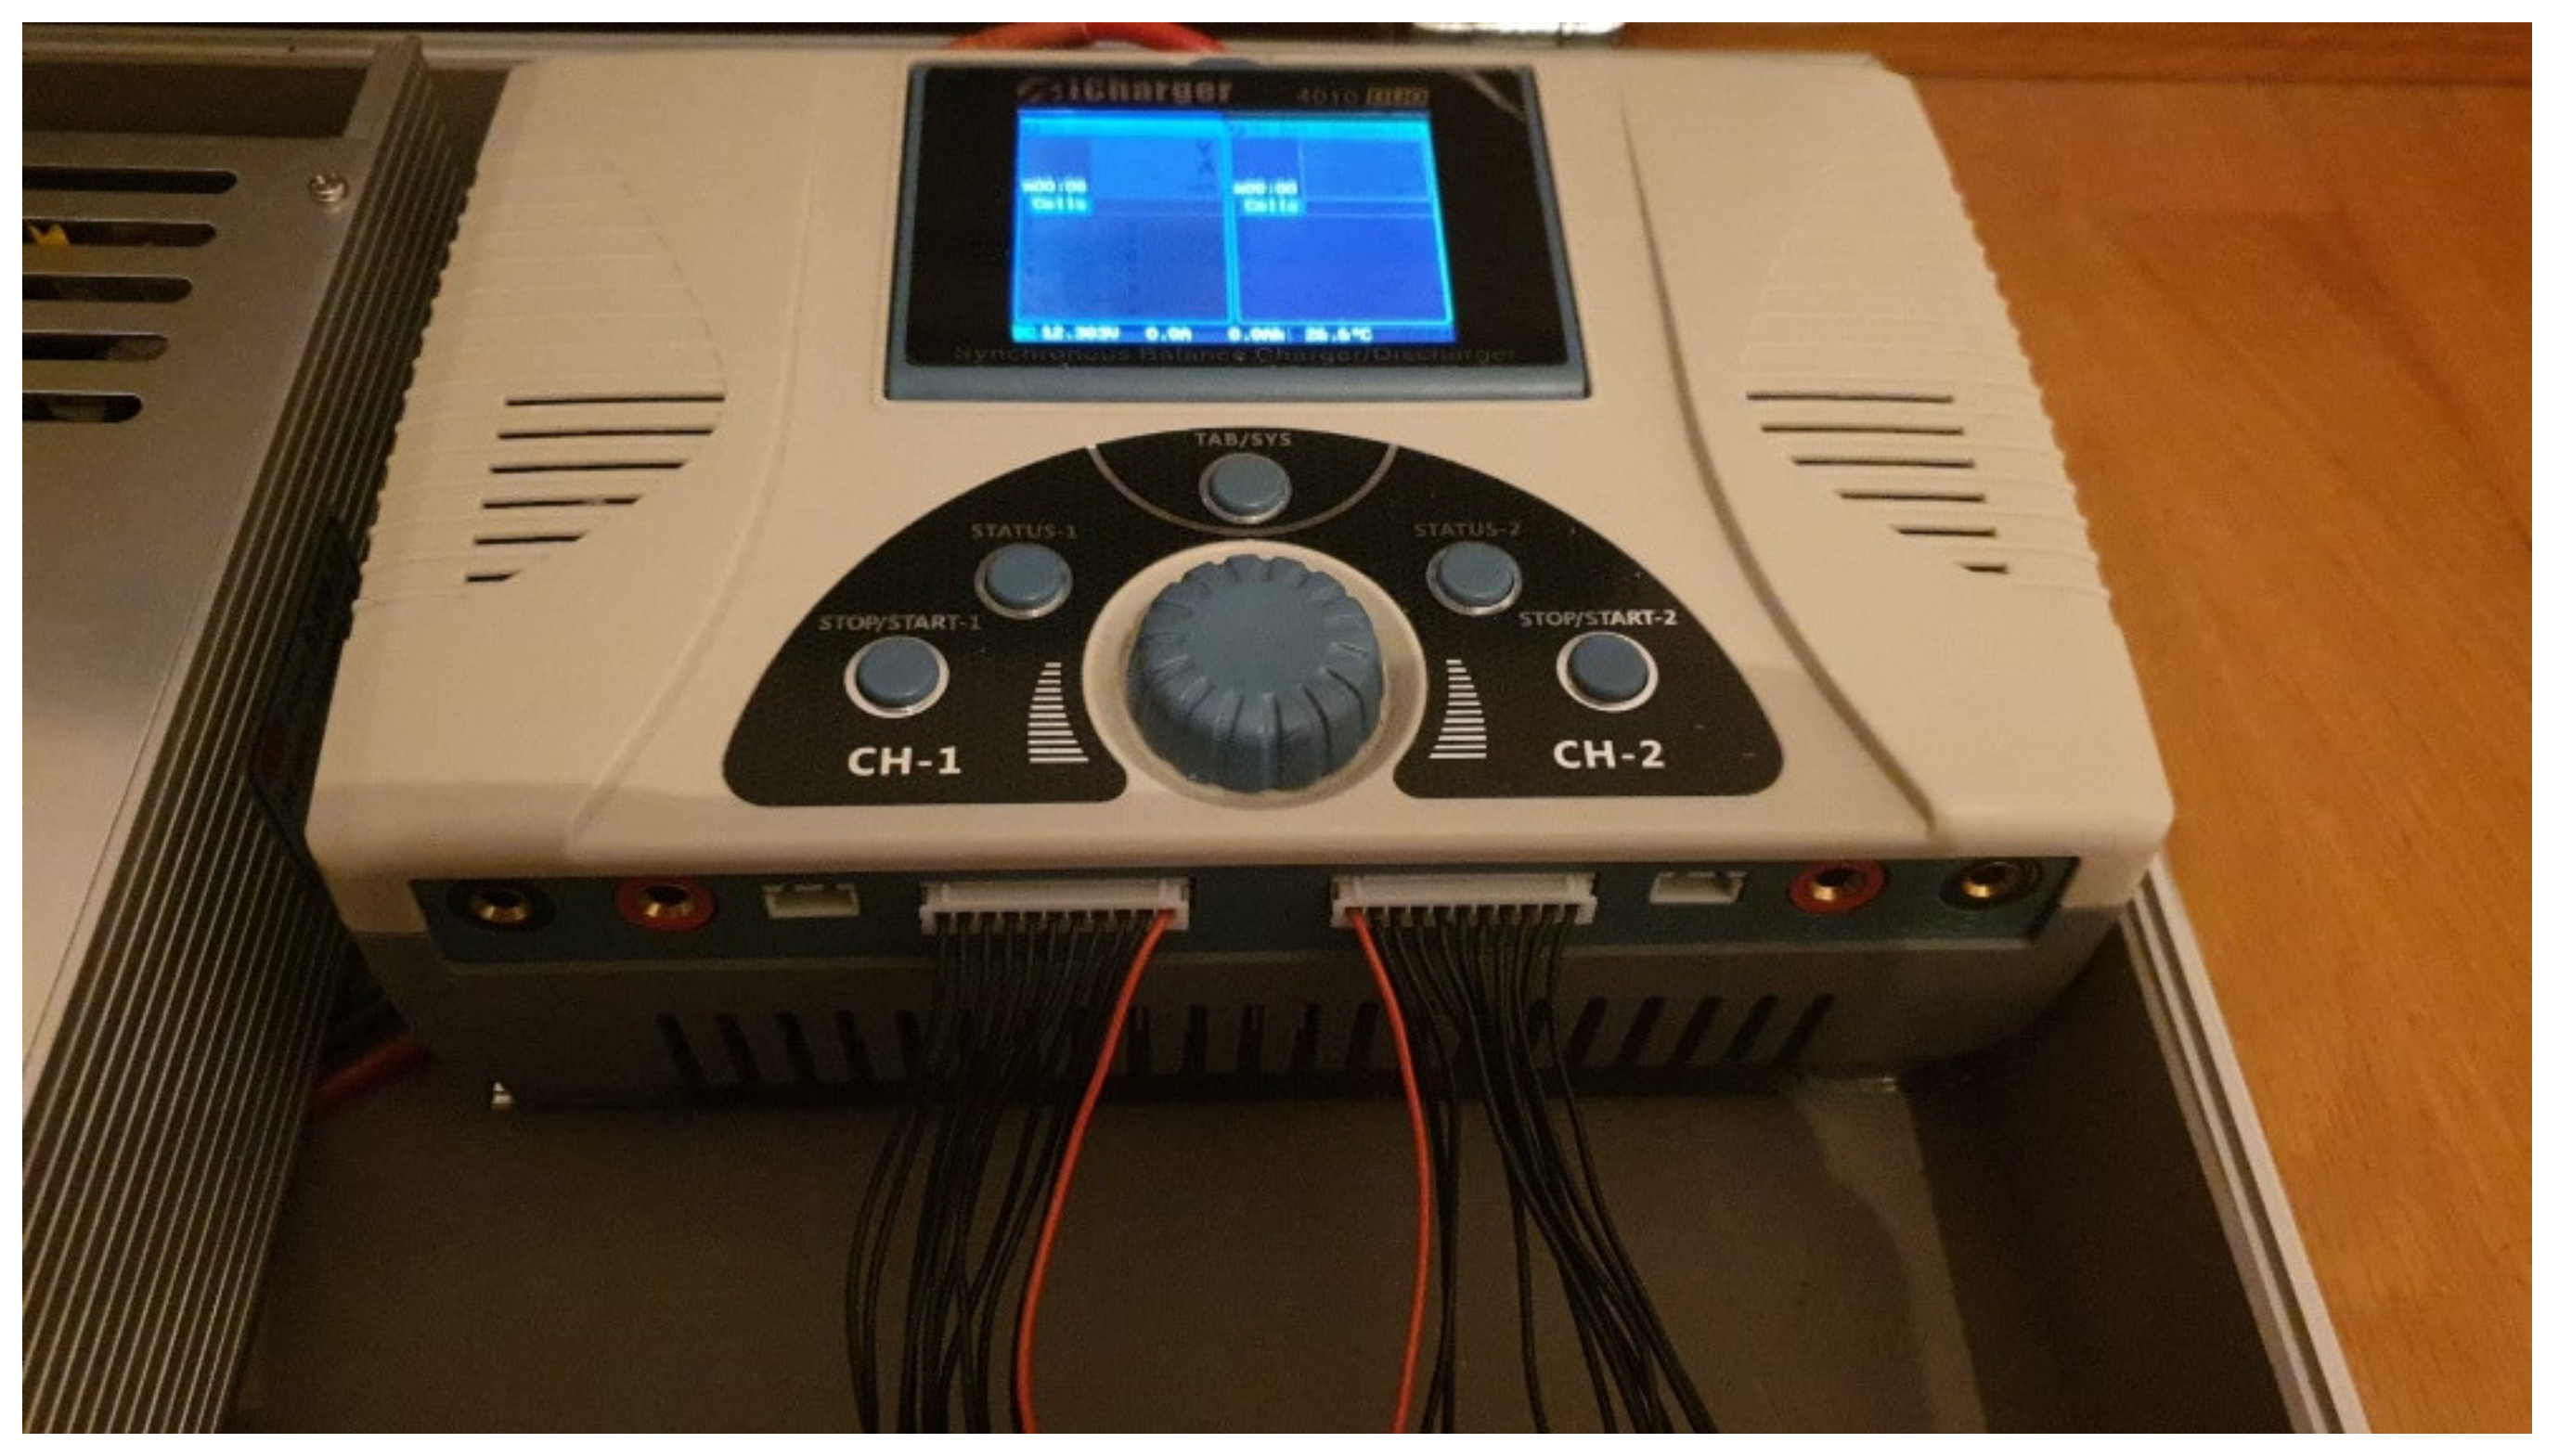
Figure 2.
Charge cycle design.

Figure 3.
Internal resistance evolution.

Figure 4.
Relaxation voltage drop evolution.

Figure 5.
Internal resistance vs. relaxation voltage drop.

Figure 6.
Depth of discharge vs. cycle life.

Figure 7.
Depth of discharge vs. internal resistance growth.

Figure 8.
Voltage disperson per cell (battery 5).

Figure 9.
Voltage dispersion battery 5.

Figure 10.
Weighted voltage dispersion of battery 5.

Figure 11.
Voltage dispersion vs. cycle life.

Figure 12.
Voltage dispersion vs. internal resistance growth.

Figure 13.
Voltage dispersion (w.c.) vs. capacity discharged for battery 5.

Figure 14.
Voltage dispersion (w.c.) vs. temperature for battery 5.

Figure 15.
Average storage time vs. cycle life.

Figure 16.
Average storage time vs. internal resistance growth.

Figure 17.
Competition flight percentage vs. cycle life.

Figure 18.
Competition flight percentage vs. internal resistance growth.

Figure 19.
SoH and SoC.

Figure 20.
∆mAh/∆V charged (w.c.) for battery 5.

Figure 21.
Black box model flow chart.

Figure 22.
Genetic algorithm model flow chart.

Figure 23.
Results of first model for batteries 1, 2, and 3.

Figure 24.
Results of first model applied on batteries 4, 5, 6, and 7.

Figure 25.
Results of final model including batteries 1–7.

Figure 26.
Prediction model flow chart.

Figure 27.
Results of prediction of battery 1: (a) 20 cycles; (b) 50 cycles; (c) 80 cycles.


Figure 28.
Prediction of life for batteries in use: (a) cell 8; (b) cell 9.


Table 1.
Analysis resume.
| Parameter | Influential | Included in Modifications | Comments |
|---|---|---|---|
| Internal resistance | Yes | Yes | Indicator of battery aging. It will be used as center piece in the modelization. |
| Self-discharge | Yes | No | Indicator of battery aging. It will not be used in the model as the internal resistance will be used. However, is has been obtained a clear link between parameters. |
| Depth of discharge | Yes | Yes | Is causes a negative effect in aging. It will be used in the modelization. |
| Voltage dispersion between cells | Yes | Yes | Indicator of battery aging. It will be used in the modelization. |
| Temperature of use | No | No | No effect found in the battery performance. Therefore, it will not be used in the modelization. |
| Storage time | Yes | Yes | It causes a negative effect in aging. It will be used in the modelization. |
| Discharge rate | Yes | Yes | It causes a negative effect in aging. It will be used in the modelization. |
| Capacity loss | No | No | It may be an indicator of battery aging, but not accurate data to draw clear conclusions. Therefore, it will not be used in the modelization. |
Table 2.
Solution parameters results of first model for batteries 1, 2, and 3.
| A | B | C | D | E | F | G |
|---|---|---|---|---|---|---|
| 0.00158 | 0.13230 | 0.76660 | 0.35946 | 0.05849 | 0.02055 | −1.40986 |
Table 3.
Solution parameter results including batteries 1–7.
| A | B | C | D | E | F | G |
|---|---|---|---|---|---|---|
| −0.00198 | 0.06902 | −3.80387 | 15.85996 | 1.64249 | 0.06715 | −4.31879 |
Publisher’s Note: MDPI stays neutral with regard to jurisdictional claims in published maps and institutional affiliations. |
© 2022 by the authors. Licensee MDPI, Basel, Switzerland. This article is an open access article distributed under the terms and conditions of the Creative Commons Attribution (CC BY) license (https://creativecommons.org/licenses/by/4.0/).
Share and Cite
MDPI and ACS Style
Chrenko, D.; Fernandez Montejano, M.; Vaidya, S.; Tabusse, R. Aging Study of In-Use Lithium-Ion Battery Packs to Predict End of Life Using Black Box Model. Appl. Sci. 2022, 12, 6557. https://doi.org/10.3390/app12136557
AMA Style
Chrenko D, Fernandez Montejano M, Vaidya S, Tabusse R. Aging Study of In-Use Lithium-Ion Battery Packs to Predict End of Life Using Black Box Model. Applied Sciences. 2022; 12(13):6557. https://doi.org/10.3390/app12136557
Chicago/Turabian StyleChrenko, Daniela, Manuel Fernandez Montejano, Sudnya Vaidya, and Romain Tabusse. 2022. "Aging Study of In-Use Lithium-Ion Battery Packs to Predict End of Life Using Black Box Model" Applied Sciences 12, no. 13: 6557. https://doi.org/10.3390/app12136557
Note that from the first issue of 2016, this journal uses article numbers instead of page numbers. See further details here.