
Determination of Cycle to Cycle Battery Cell Degradation with High-Precision Measurements


Christian Doppler Laboratory for Measurement Systems for Harsh Operating Conditions, Institute of Electrical Measurement and Sensor Systems, Graz University of Technology, Inffeldgasse 33, 8010 Graz, Austria
*
Author to whom correspondence should be addressed.
Appl. Sci. 2022, 12(23), 11876; https://doi.org/10.3390/app122311876
Submission received: 27 October 2022
/
Revised: 16 November 2022
/
Accepted: 18 November 2022
/
Published: 22 November 2022
(This article belongs to the Special Issue Advances in Lithium-Ion Automobile Batteries)
Abstract
:Due to the long life of lithium ion cells, it is difficult to measure their low capacity degradation from cycle to cycle. In order to accelerate the measurements, cells are often exposed to extreme stress conditions, which usually means elevated temperatures and high charging currents. This raises doubts as to whether the results obtained in this way are representative for real world applications. This work shows that, with the help of very precise capacity measurements, it is possible to determine cell aging in a few days even under normal operating conditions from cycle to cycle. To verify this, a self-built measurement system is used. After demonstrating the capabilities of the system, two different cycling schemes are used simultaneously to determine the various causes of aging—namely cycle aging, calendrical aging and self-discharge due to leakage currents.
1. Introduction
In order to counteract anthropogenic climate change, it is important to be able to produce affordable and high quality energy storage systems for renewable energies [1,2]. Lithium ion cells are electrochemical energy storage systems which are already widely used for this purpose, e.g., in electric cars and stationary energy storage systems, and whose development potential has not yet been exhausted [3]. In battery cell research and development, many cell parameters are of interest. Some of these parameters can be determined quickly, such as capacity, internal resistance and temperature behavior of the cell. However, the development of these parameters over time can usually only be determined with long-term measurements.
Several approaches try to speed up the aging effects by exposing the cells to higher temperatures. The intention is to accelerate the parasitic reactions that degrade the cell according to Arrhenius law [4,5,6]. Other approaches use high cycling currents, thus making many cycles in a short time [5,7,8,9]. Furthermore, both methods can be combined to obtain even faster results [10]. However, with all accelerated test procedures, the question arises as to whether these cells still show the same behavior as in real world applications, or if they age due to excessively high temperatures and extreme loads [11,12].
Therefore, results which examine the cell under normal operating conditions should be used in preference as shown in [13,14,15,16]. The resulting problem, however, is that the duration of the cell tests now increase considerably. A study was done in [14] where cells over 4 years were observed to determine their capacity fade through calendrical and cycle aging. As shown in [16], several cells were studied over a few months during which the cells’ ambient temperature as well as the state of charges (SoC) were varied in a realistic range in order to make statements about calendrical aging. In [15], self-assembled lithium cells were cycled for 600 h in order to determine calendrical aging. At the same time, in [15], a cell of the same type was stored at 100% SoC for the same period of time to determine its calendrical aging.
A few new promising approaches were launched by Jeff Dahn’s Research Group from Dalhousie University. Most of their approaches have in common that they measure the cycling currents and voltages of the cell extremely precisely, whereby very small aging-related changes are supposed to be detected [11,12,17,18,19,20,21,22,23,24]. In [21], it is shown that the sequence in which cells age—with the same electrode chemistry but different electrolyte additives—can be determined with high precision Coulometry, and this after only a few days of measurement. As shown in [19], even cell lifetime predictions can be made using such high-precision measurements, although it is not yet clear how reliably they work. It is worth noting that this research addresses the issue that some cells suddenly experience a severe loss of capacity due to lithium plating [25,26].
Mostly, the researchers use self-built devices as described in [18,22] because none were commercially available with this high measurement precision at that time. The self-built devices allow for countless analysis methods, such as capacity measurements, impedance spectroscopy, Coulombic efficiency measurement, differential capacity analysis (DCA), differential voltage analysis (DVA), delta differential capacity analysis, etc. [27,28]. However, when presenting the results (especially with commercial systems), it is uncommon to consider that the measuring devices used could themselves have an influence on the measurement results. This means that every measured change is automatically attributed to the cell. This conclusion is often misleading as shown, e.g., for DCA and in [27] because, for such precise measurements, there are considerable demands on the measurement system.
In order to meet these requirements and therefore to keep the influence of the measuring system as small as possible, two things are necessary: On the one hand, a nearly drift-free measuring system with superior precision and a temperature stabilization for the cell under test are required. On the other hand, it is necessary to know exactly the measurement uncertainties that nevertheless occur.
During the last several years, a self-built measuring system which fulfills these requirements and whose measurement uncertainties have been investigated in detail was developed of our research group, and its performance regarding the achievable measurement uncertainty is demonstrated in Section 2.1 [27]. Compared to other state-of-the-art solutions, as shown in [22], where precision benchtop multimeters and precision current sources were used, the hardware we use is a single device which has a current measurement range that is much larger, is cheaper to manufacture and more compact.
The aim of this work is to quickly quantify the cyclic and calendrical aging of the cell as well as the leakage charge loss due to leakage currents from cycle to cycle for laboratory purposes. Therefore, commercially available state-of-the-art cells are measured with high precision in order to obtain almost noise-free high quality measurement data. In this way, even the smallest changes in capacity degradation can be detected, from which the sought calendrical aging, cycle aging, and leakage charge can be calculated. Such a fast quantification of these aging effects between cycles would make it possible to quickly assess whether cells are suitable for certain applications, to compare cells with each other, or to make initial estimates about the cell lifetime in different applications.
2. Measurement Setup
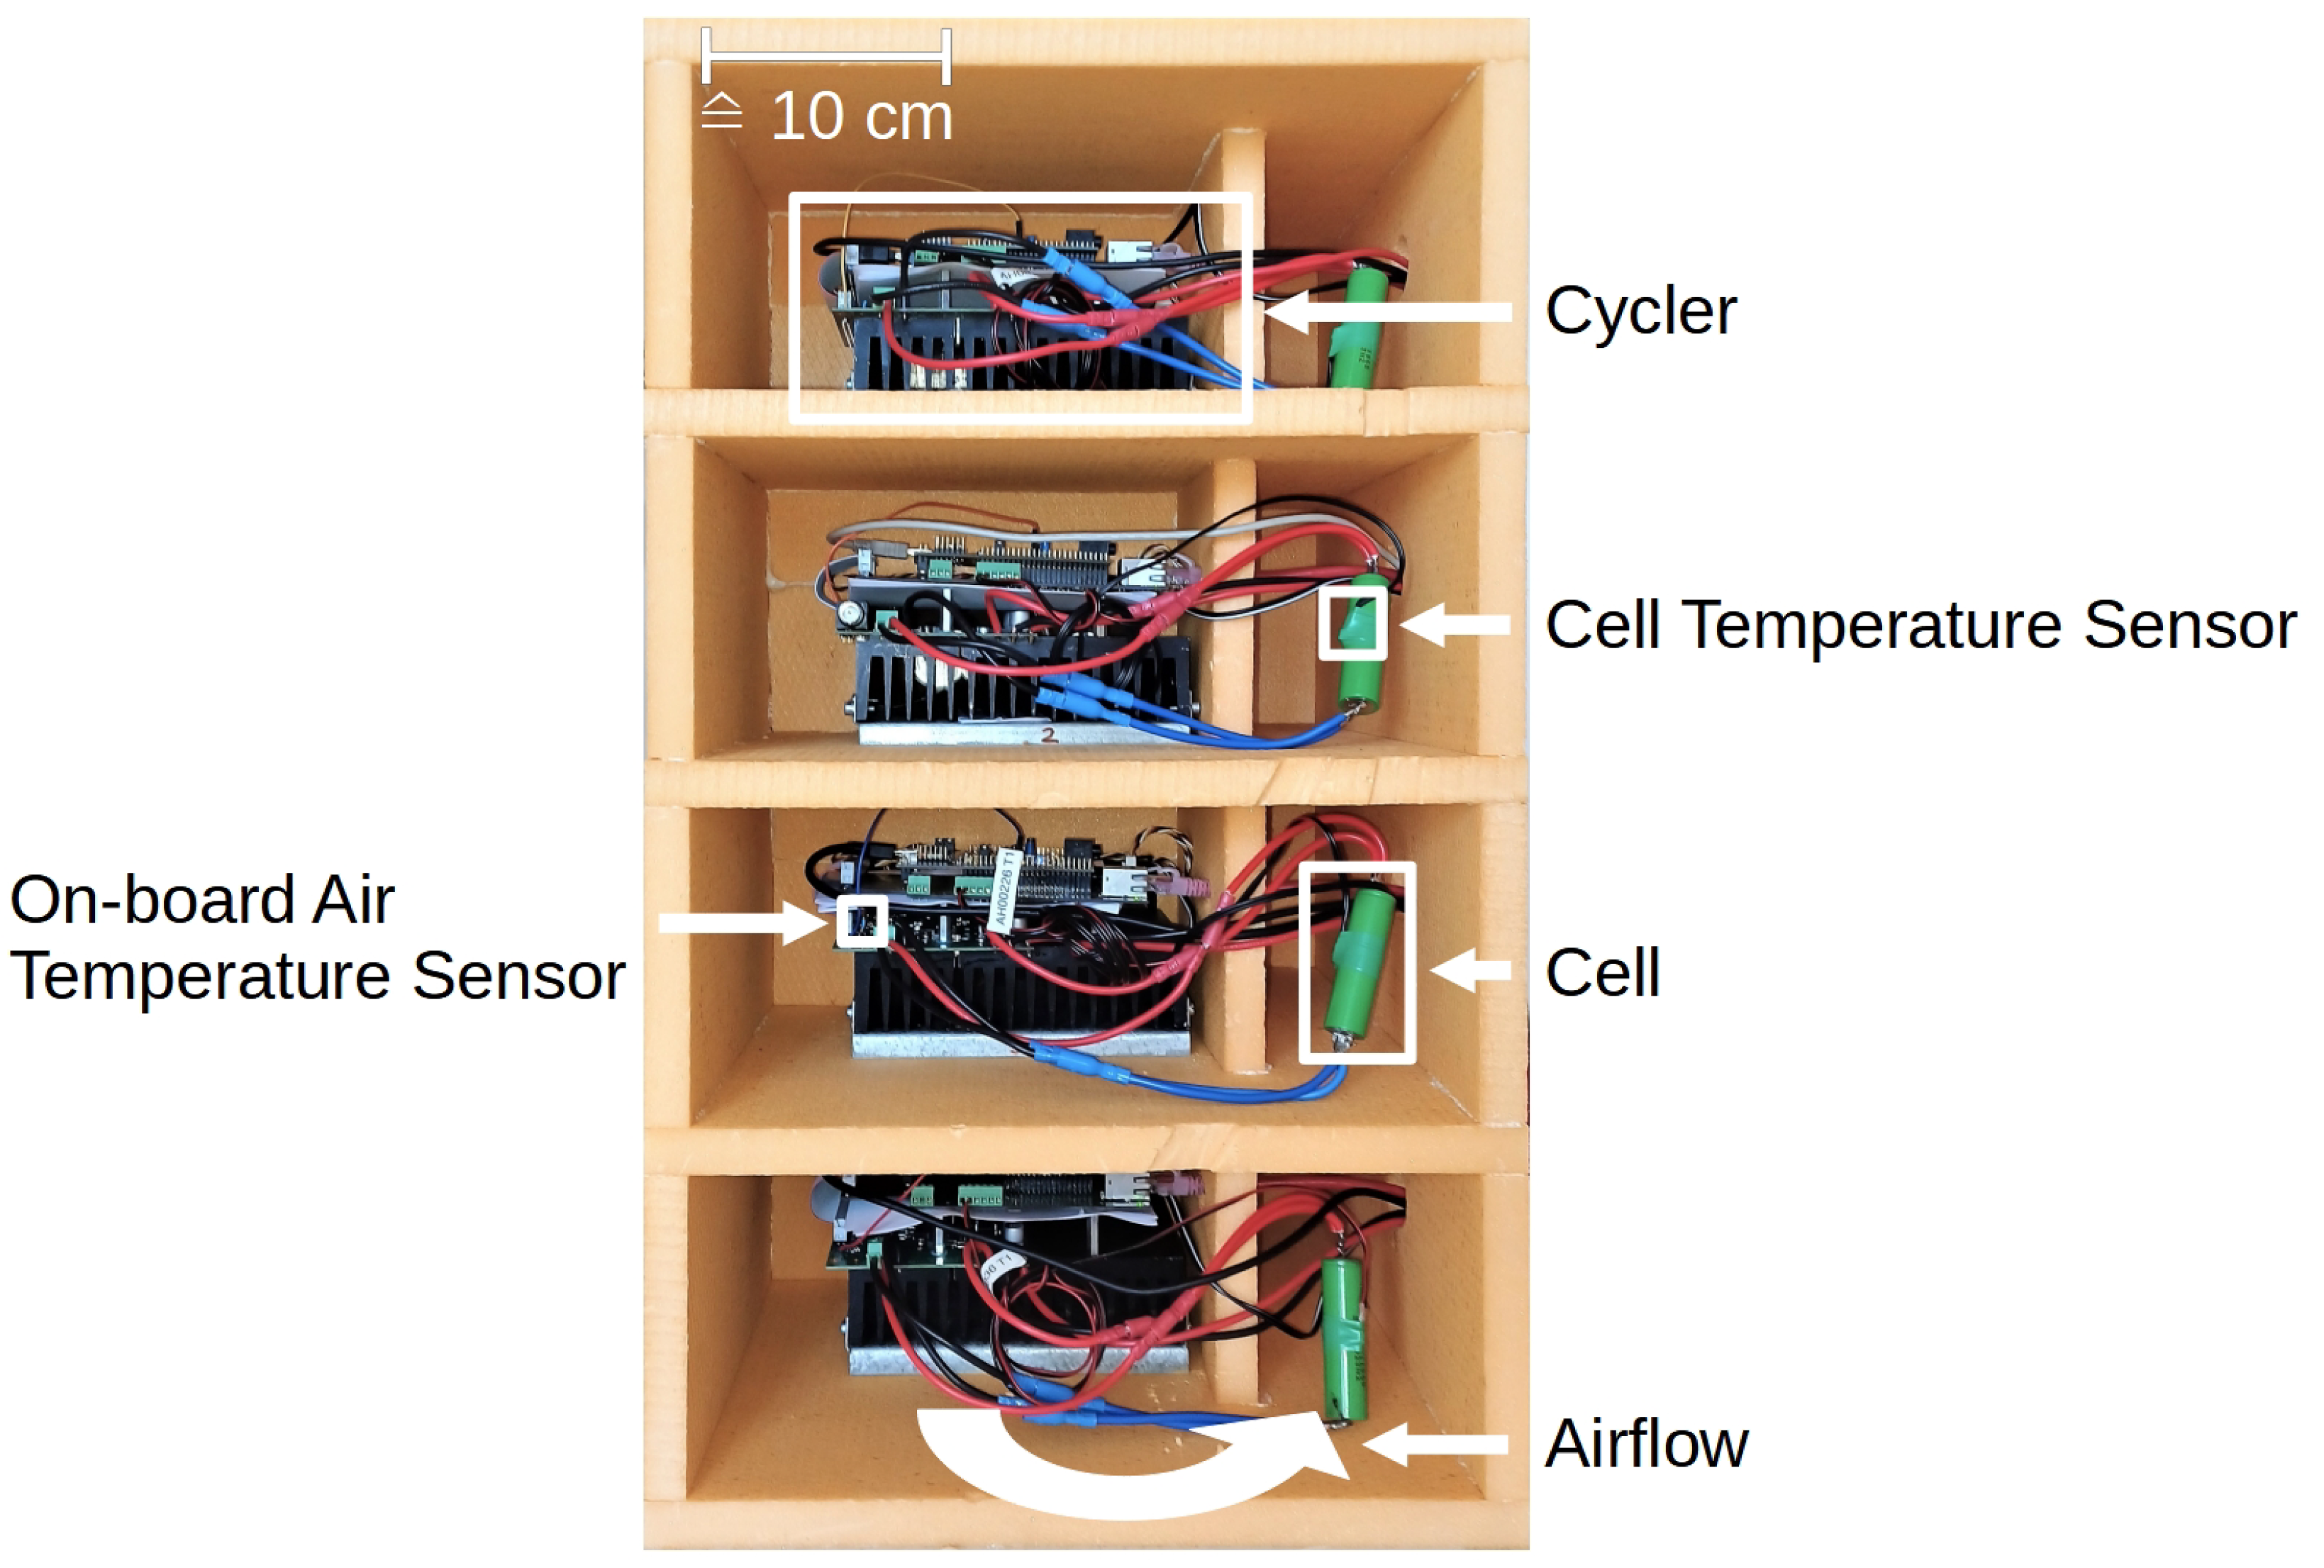
A self-developed high-precision measuring system as shown in Figure 1 is used. All the measurement equipment is placed inside a thermally insulating box which decouples the devices from the environment outside. Nevertheless, the entire measurement setup is located in an air-conditioned room in order to keep unnecessary interferences as low as possible. This allows for cycling four cells in parallel in a temperature-stabilized environment. The air is blown by a fan through the cooling fins of the cycler, past the heating elements attached to the cycler, and past the cell. To keep the temperature constant at 40 °C, the waste heat from the cycler is used and, in addition, electrical heating elements provide the necessary residual heat. The electrical heating elements compensate for the known temperature fluctuations of the cycler with the aid of a feedforward control. Any other disturbances are compensated by using a PI controller.
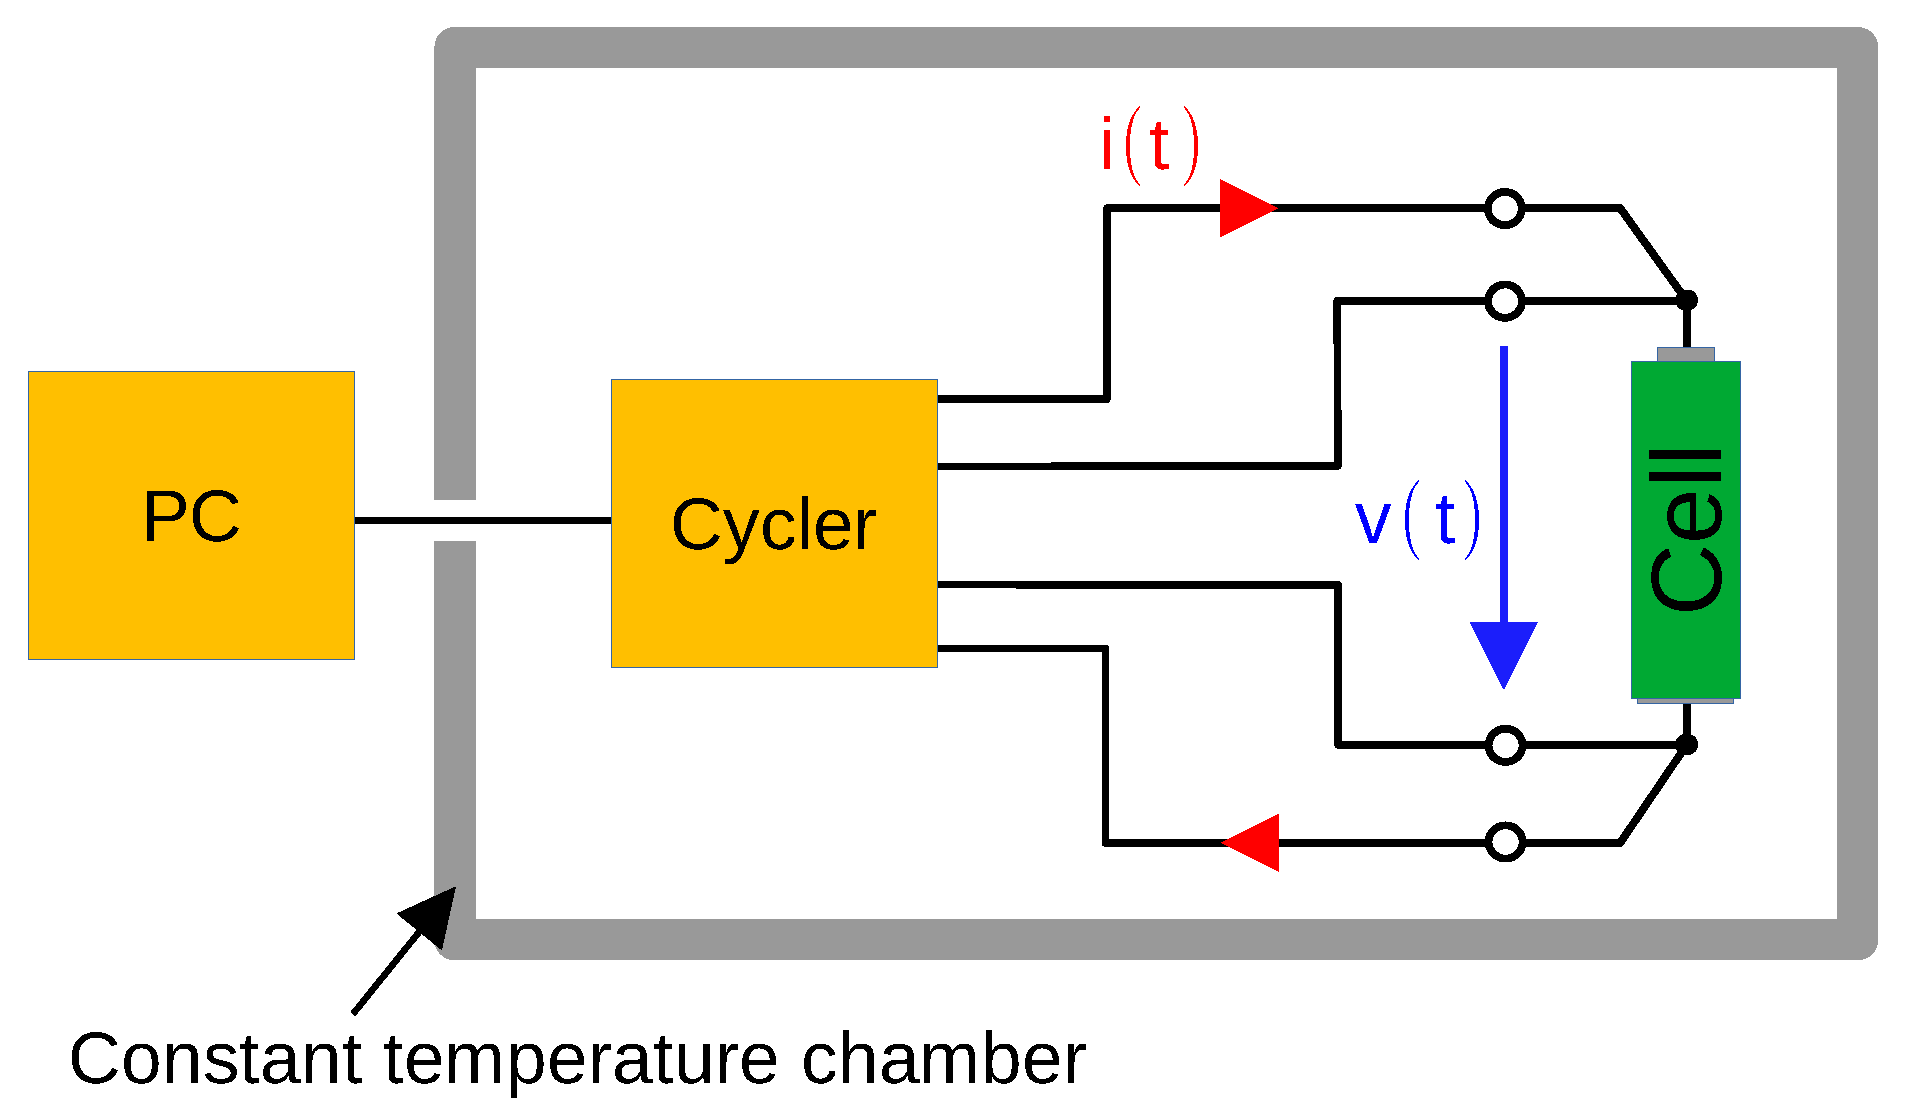
The block diagram used for cell measurements is shown in Figure 2. The cell voltage is measured using four-wire sensing technique. All four cyclers are controlled by a PC and therefore both measurement programs and measurement parameters can be individually adapted.
Each measurement system can cycle single cells within a voltage range between 0 to 5 and a current between 0 to . By adapting the current measurement shunt, the current measuring range could even be increased up to . The current can be output and measured with a resolution of 24 bits at 48 kHz sampling rate. Due to the fast current output frequency, the hardware can also be used for electrochemical impedance spectroscopy in a range from a few up to several kHz.
To suppress the 50 Hz mains hum, these measured values are averaged in -steps, i.e., 20 ms blocks with 960 individual measured values. To ensure the drift stability of the measurement system, the current measurement shunt and the voltage reference of each cycler are separately temperature controlled. In addition, offset- and gain-calibration for the voltage and current measurement is performed several times per second. Because the offset and gain calibration is carried out alternately with the measurements, the total measurement rate is 20 Hz.
2.1. Investigation of Measurement Setup Performance
It is very important to have a temperature stable measurement environment because the cell voltage and the internal resistance of the cell vary with the temperature [27,29,30]. This would cause the cycling time to vary slightly due to fluctuating temperature because the cell’s upper and lower terminal voltage would be reached earlier or later depending on the temperature.
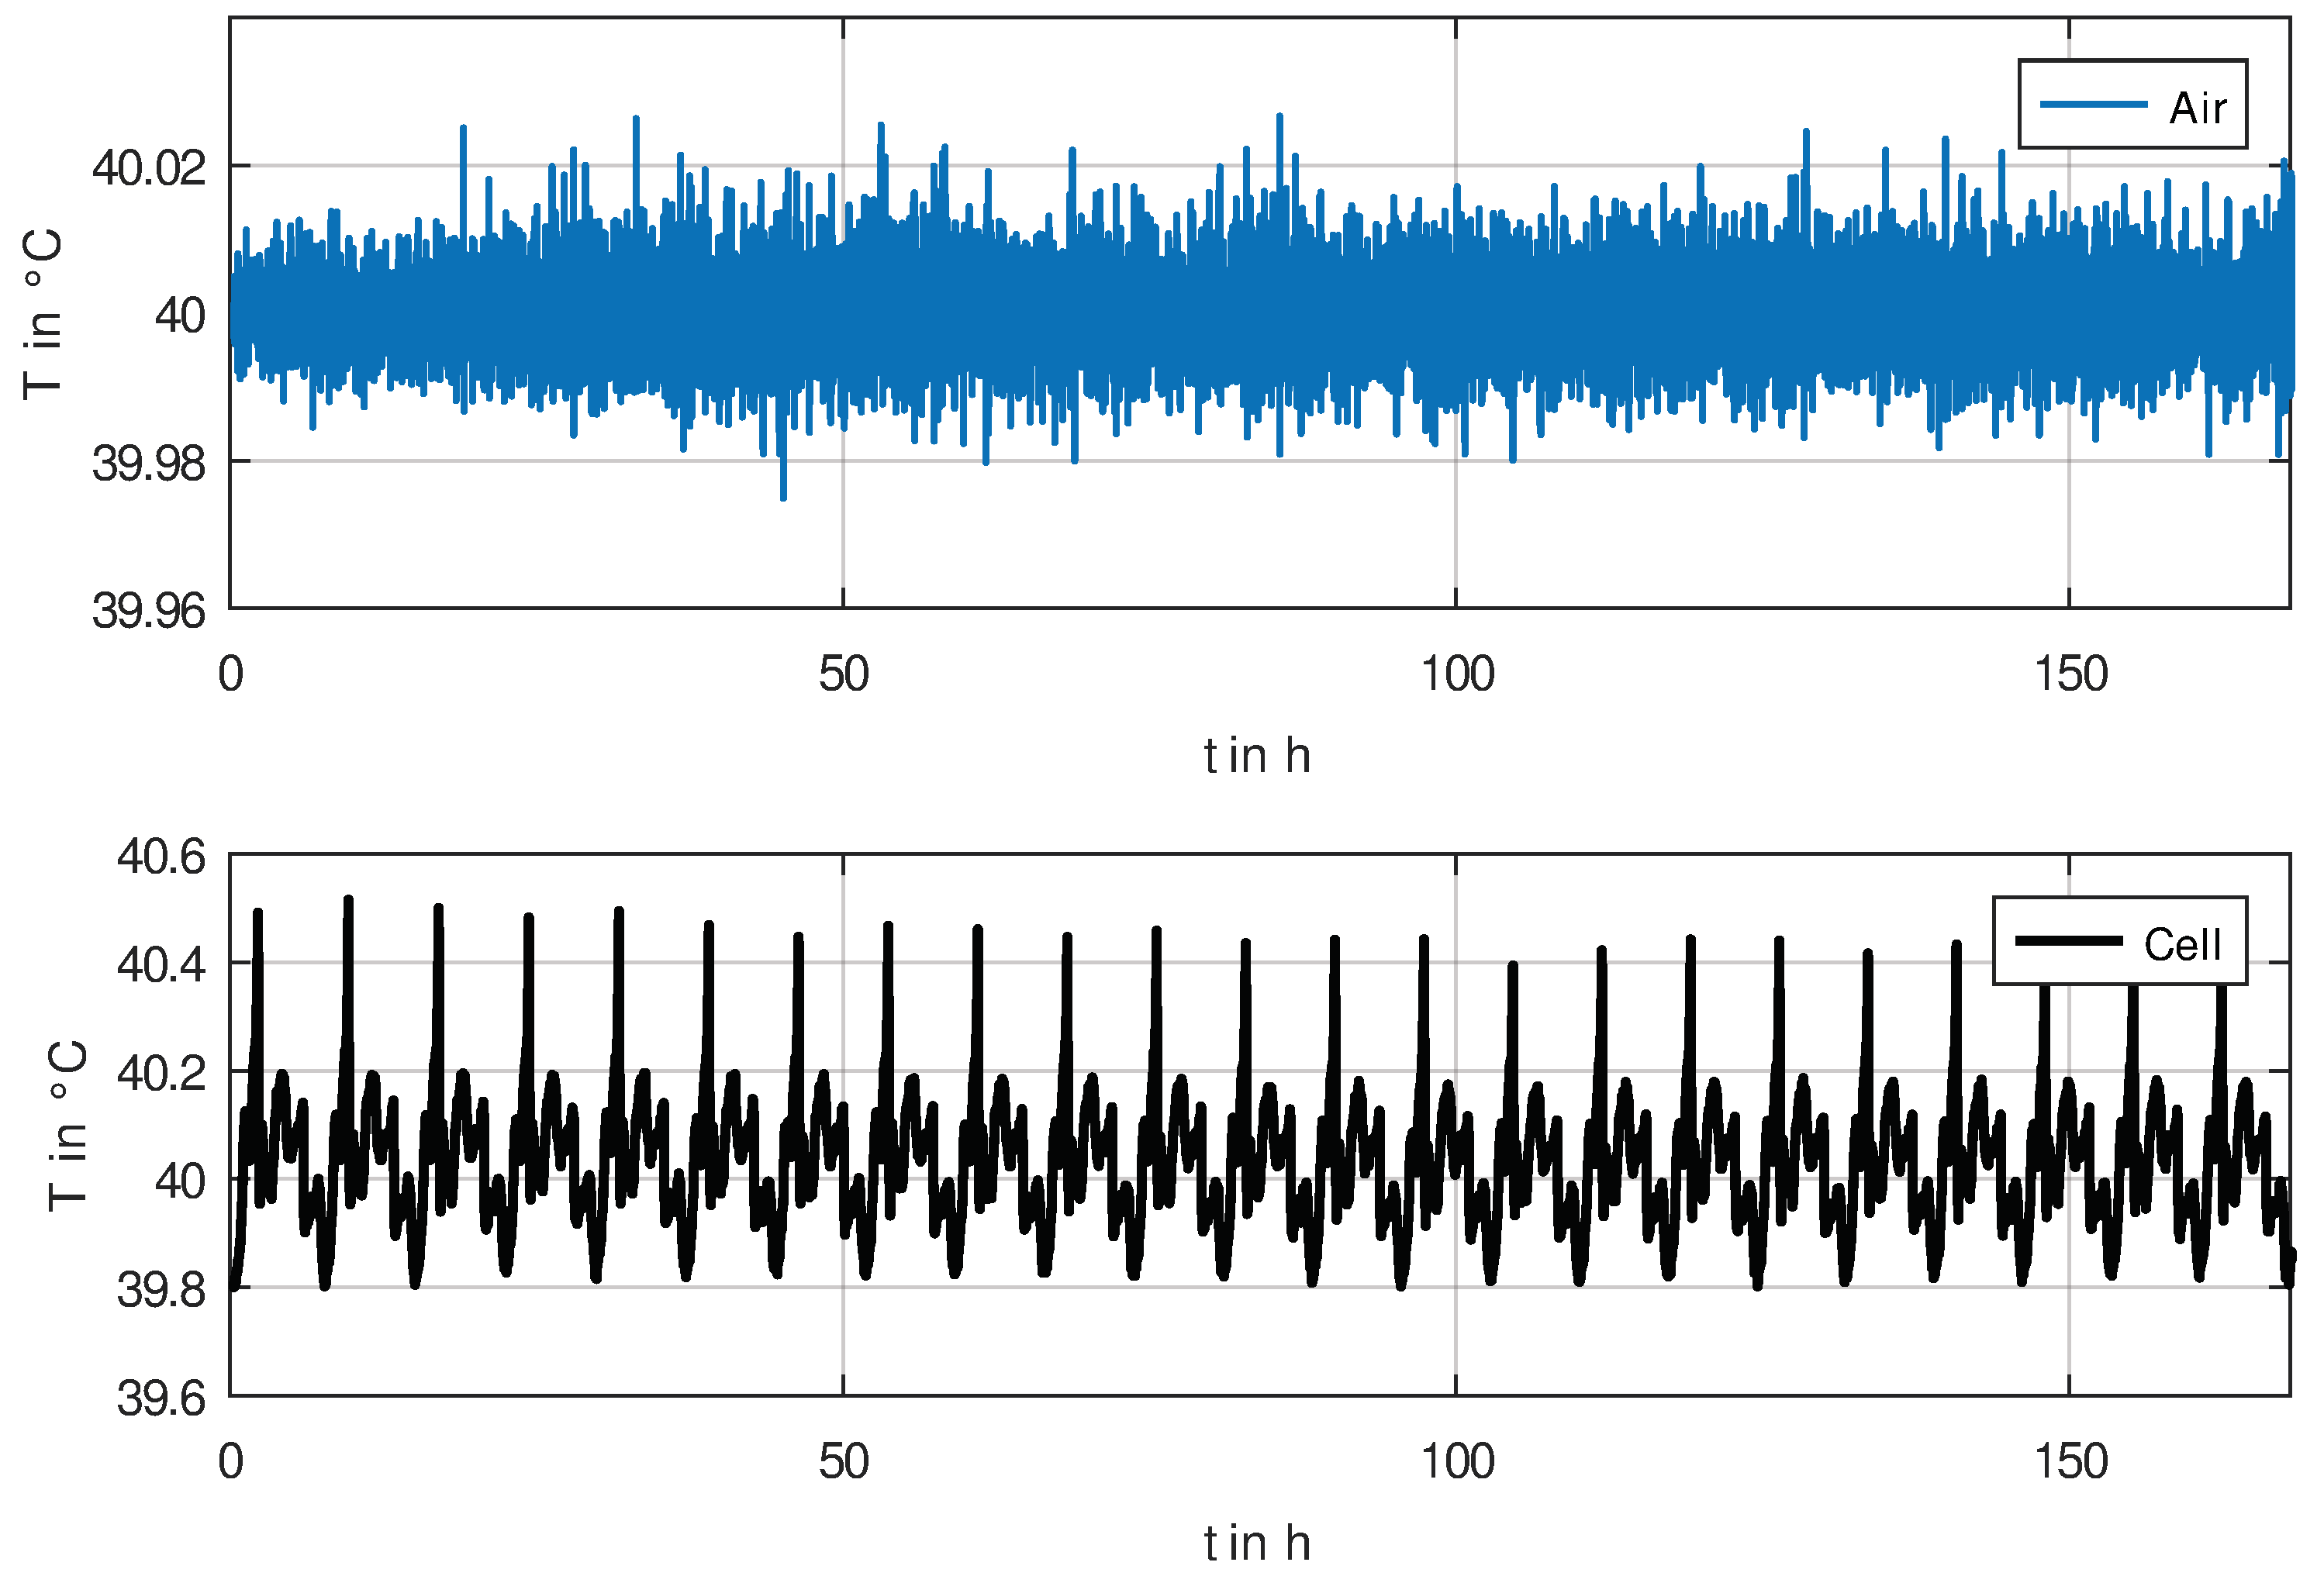
The temperature stability of the measurement setup is demonstrated in Figure 3, where the air temperature has a standard deviation of less than (for an averaging time of 1 min). The cell temperature is affected by electrochemical processes in the cell, but due to the very constant ambient temperature, this temperature pattern is also very repeatable.
Another important performance is the drift stability of the current measurement. The drift stability is determined by the cycler outputting a constant current of 0.9 A which is measured by a 7½ digit benchtop multimeter. The current drift is shown in Figure 4, where the set value of 0.9 A was subtracted from the measured current. This reveals a current drift over a measurement period of one day of approximately , which is to be considered extremely low.
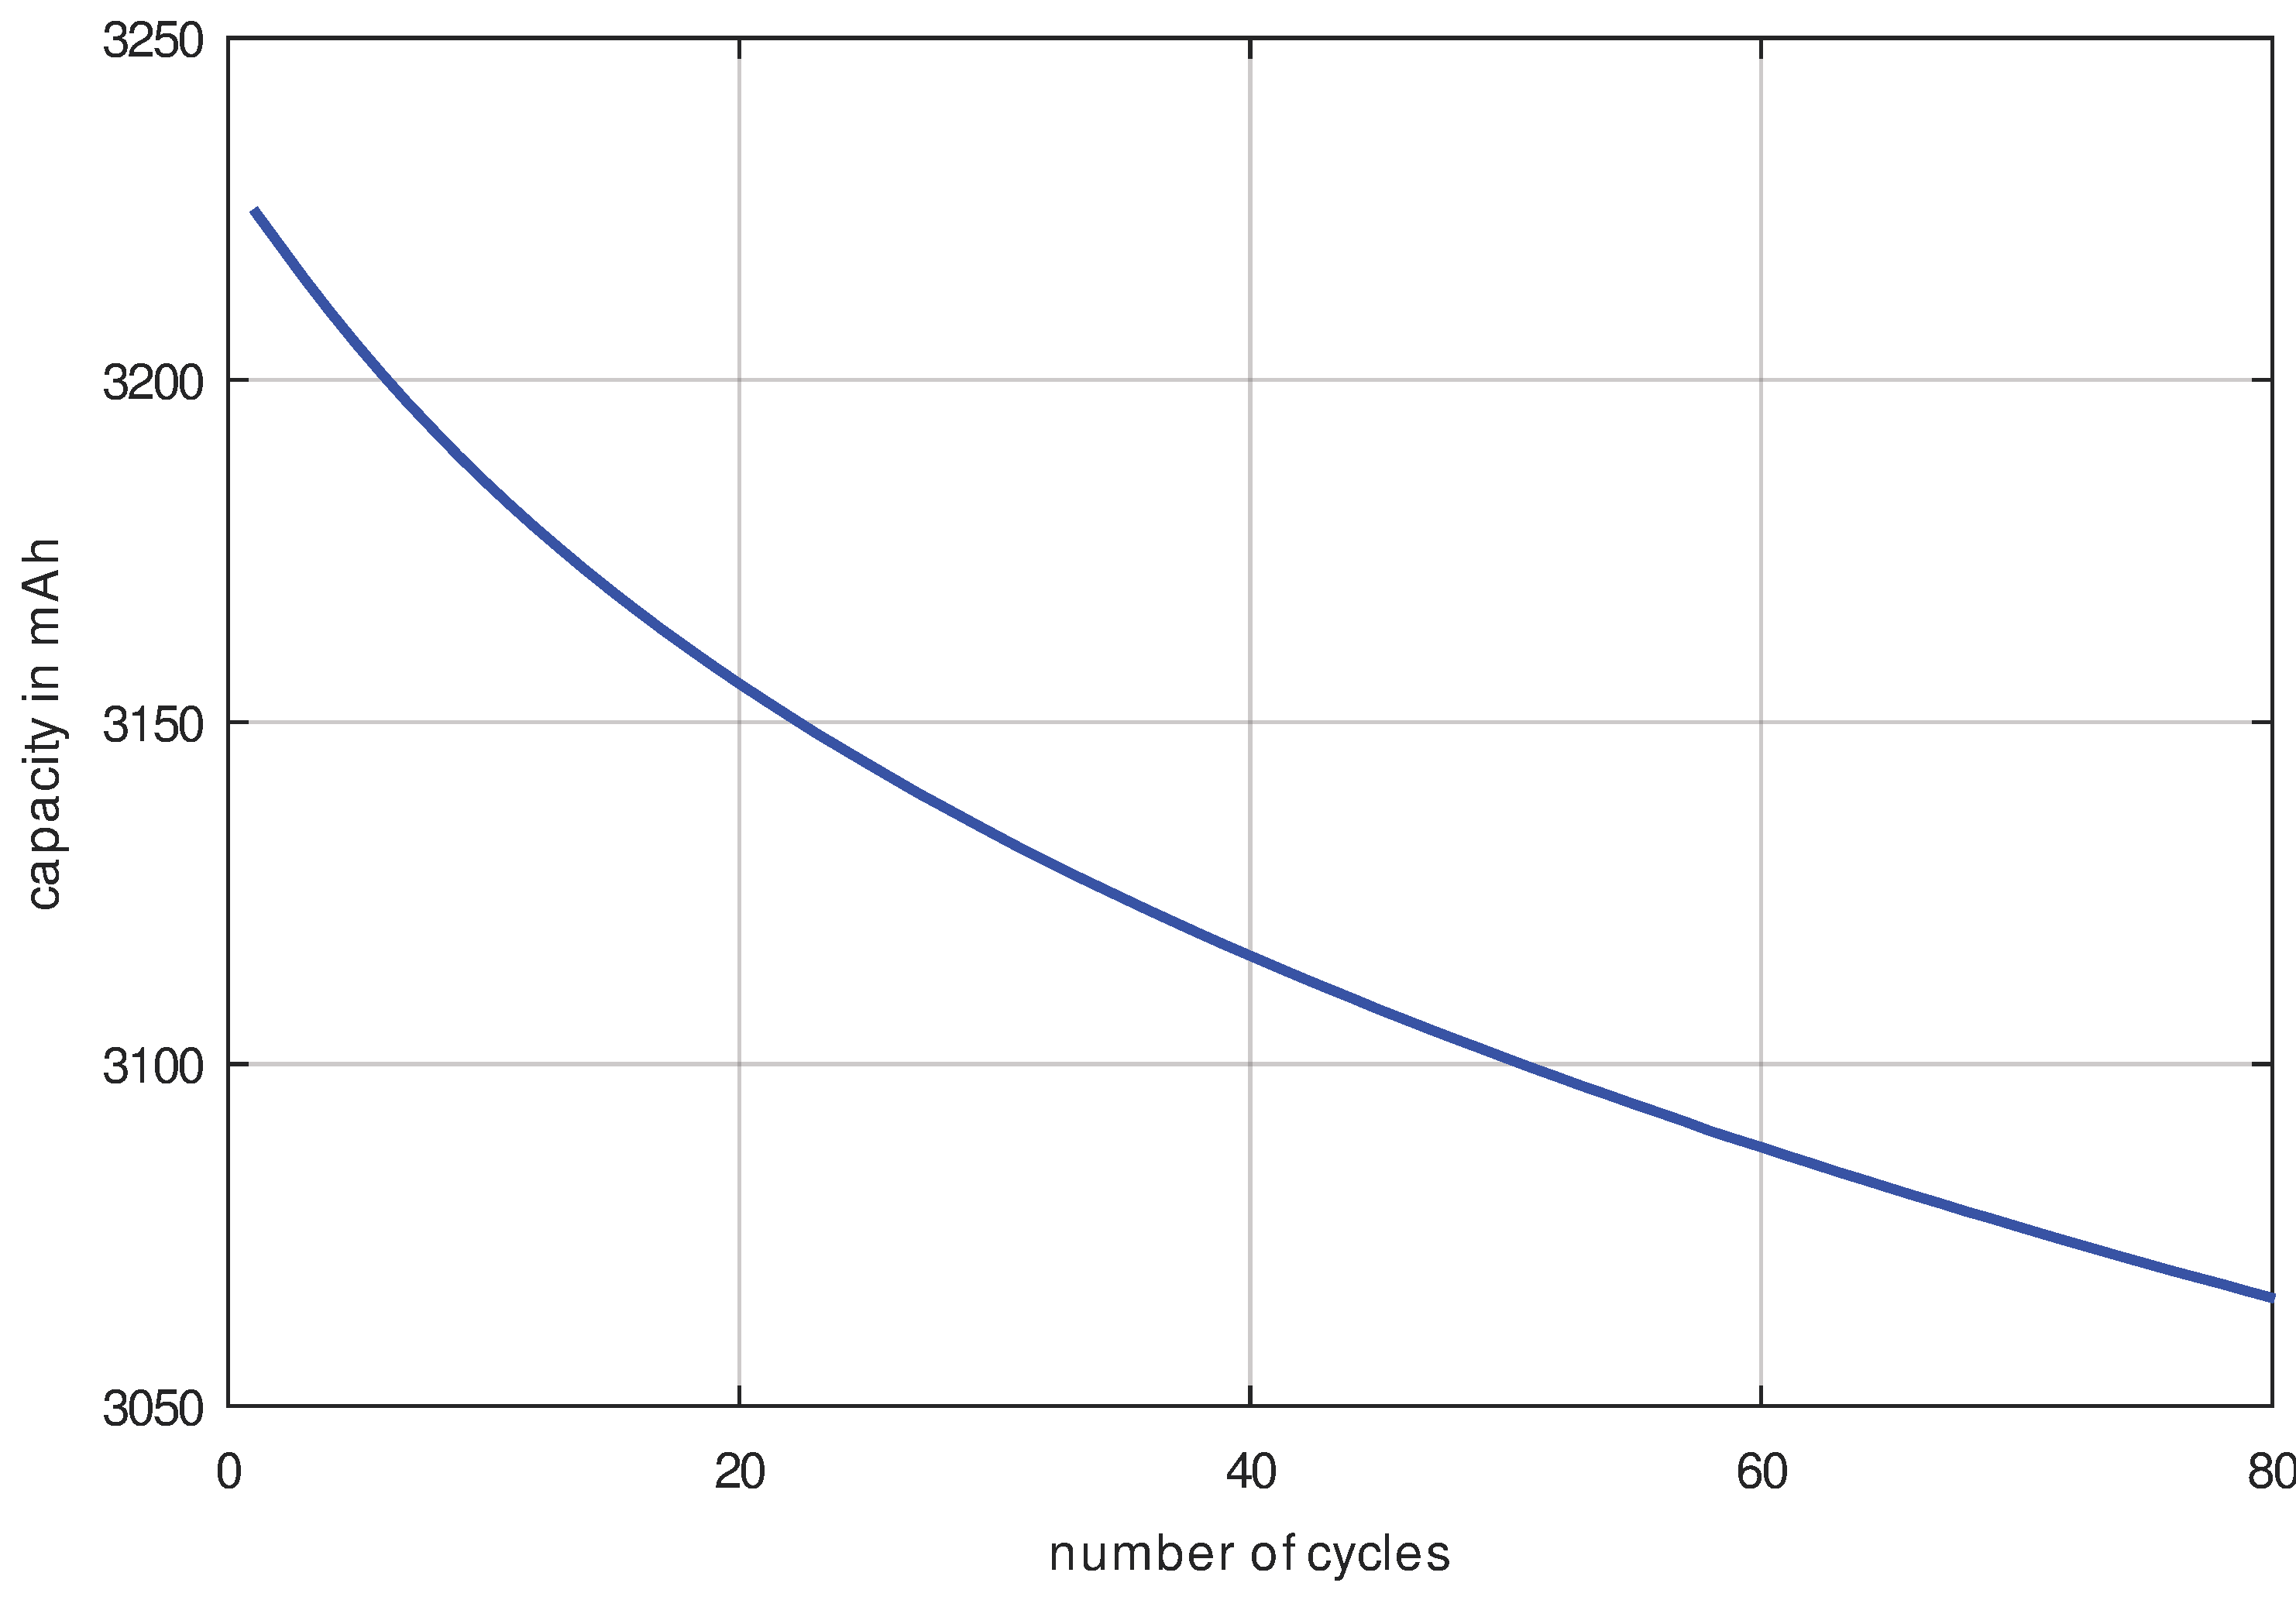
Finally, it is important to know how much noise we have in our measurement result for the analysis we intend to use. Therefore, the capacity curve of an LG INR18650 MJ1 cell was measured at a current rate of C/4 (This means that each charging and discharging takes 4 h, hence the complete cycle has a duration of 8 h.) as shown in Figure 5.
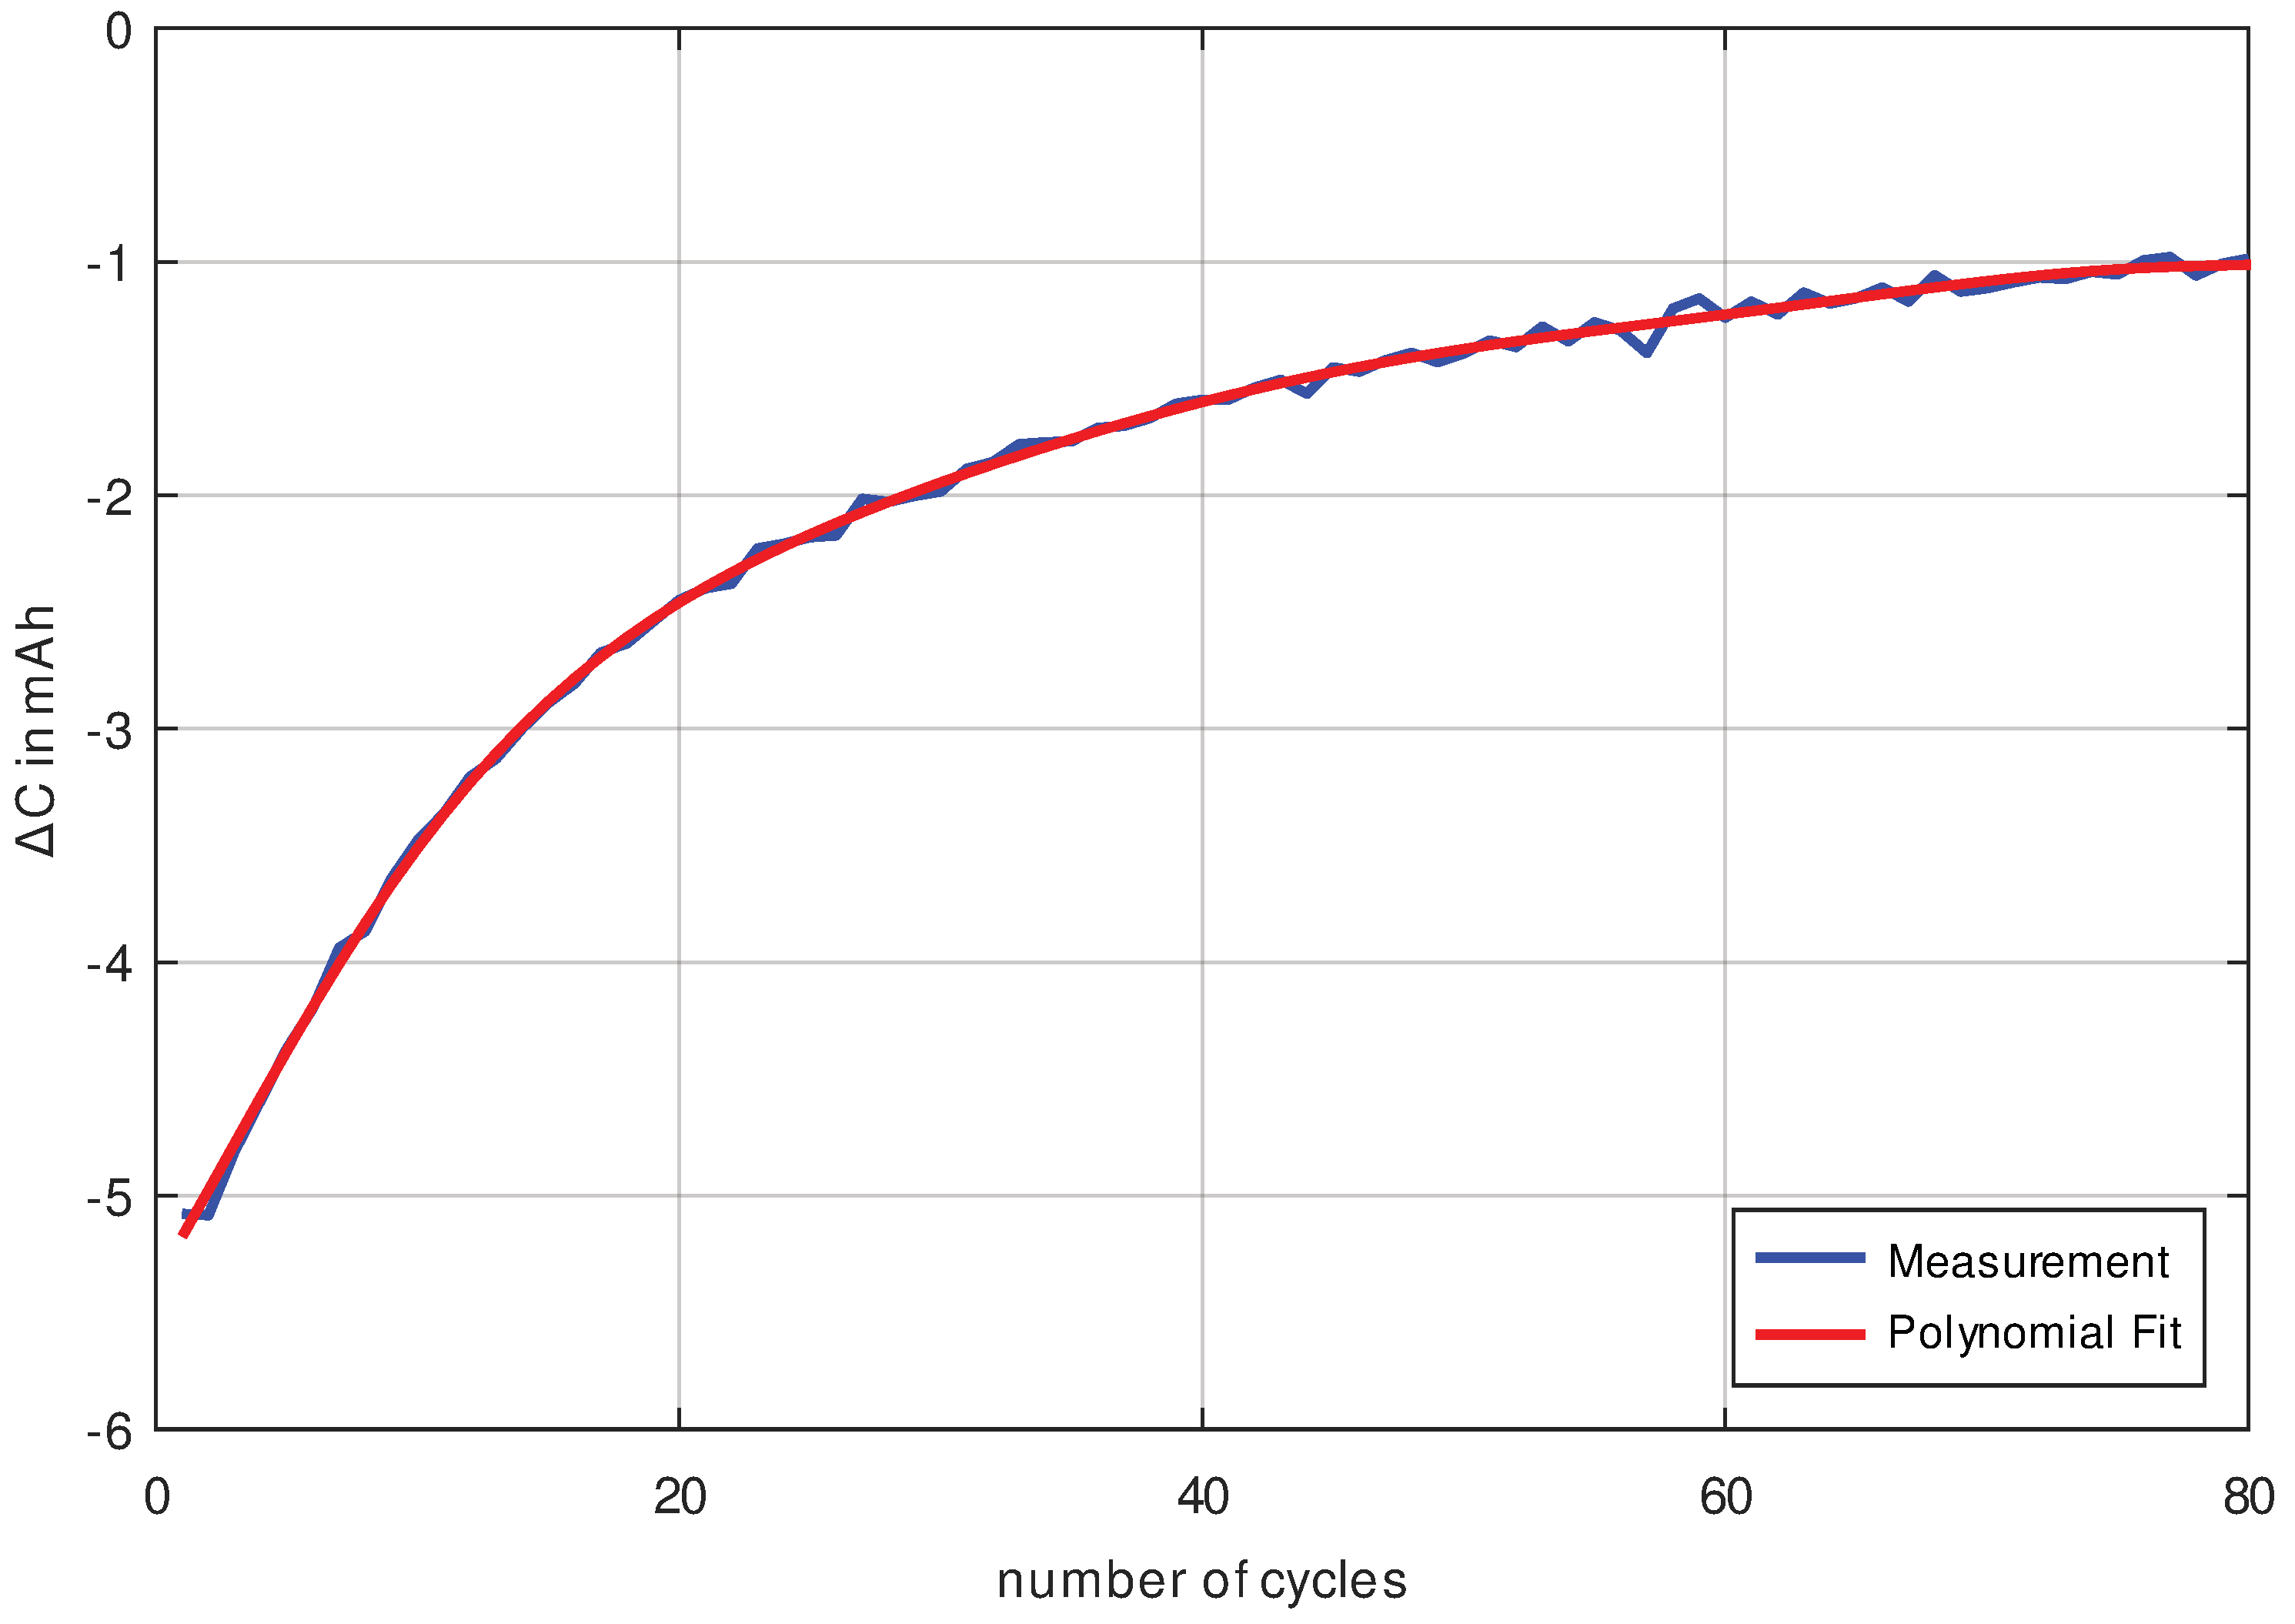
The difference between the measuring points from Figure 5 is calculated, which corresponds to the slope of the curve and thus the differentiation of the same curve (see Figure 6). By differentiating the measured data, the noise component is also increased. In order to check whether the noise component is small enough to be able to determine the aging between consecutive cycles, the measurement data were approximated with an 8th order polynomial. The results of the measurement curve and the approximation are shown in Figure 6. The difference between the approximation polynomial and the measured data results in the measurement noise being shown in Figure 7. Because the measurement noise with a standard deviation of is lower by a factor of 25 than the capacity decrease (with at least ), it can be concluded that the measurement data in Figure 6 are of excellent quality and trustworthy.
3. Experiments
In the course of this section, the measurement procedure, the measurement results, and the corresponding discussion are presented. In Section 3.1, the measurement procedure is explained. In Section 3.2, it is shown how the different cell aging mechanisms affect the measurement results and therefore how the aging rates can be determined from the results. In Section 3.3, the cycle aging and, in Section 3.4, both calendrical aging and leakage charge are determined and the corresponding results are presented.
3.1. Measurement Procedure
The cells are cycled differently in order to determine their charge losses, which allows statements to be made about the calendrical and cycle aging as well as cell-internal leakage currents. Therefore, state-of-the-art LG INR18650 MJ1 cells (NMC chemistry) with a nominal capacity of 3500 mAh and a maximum cell voltage of 4.2 V are used. All cells come from the same production batch.
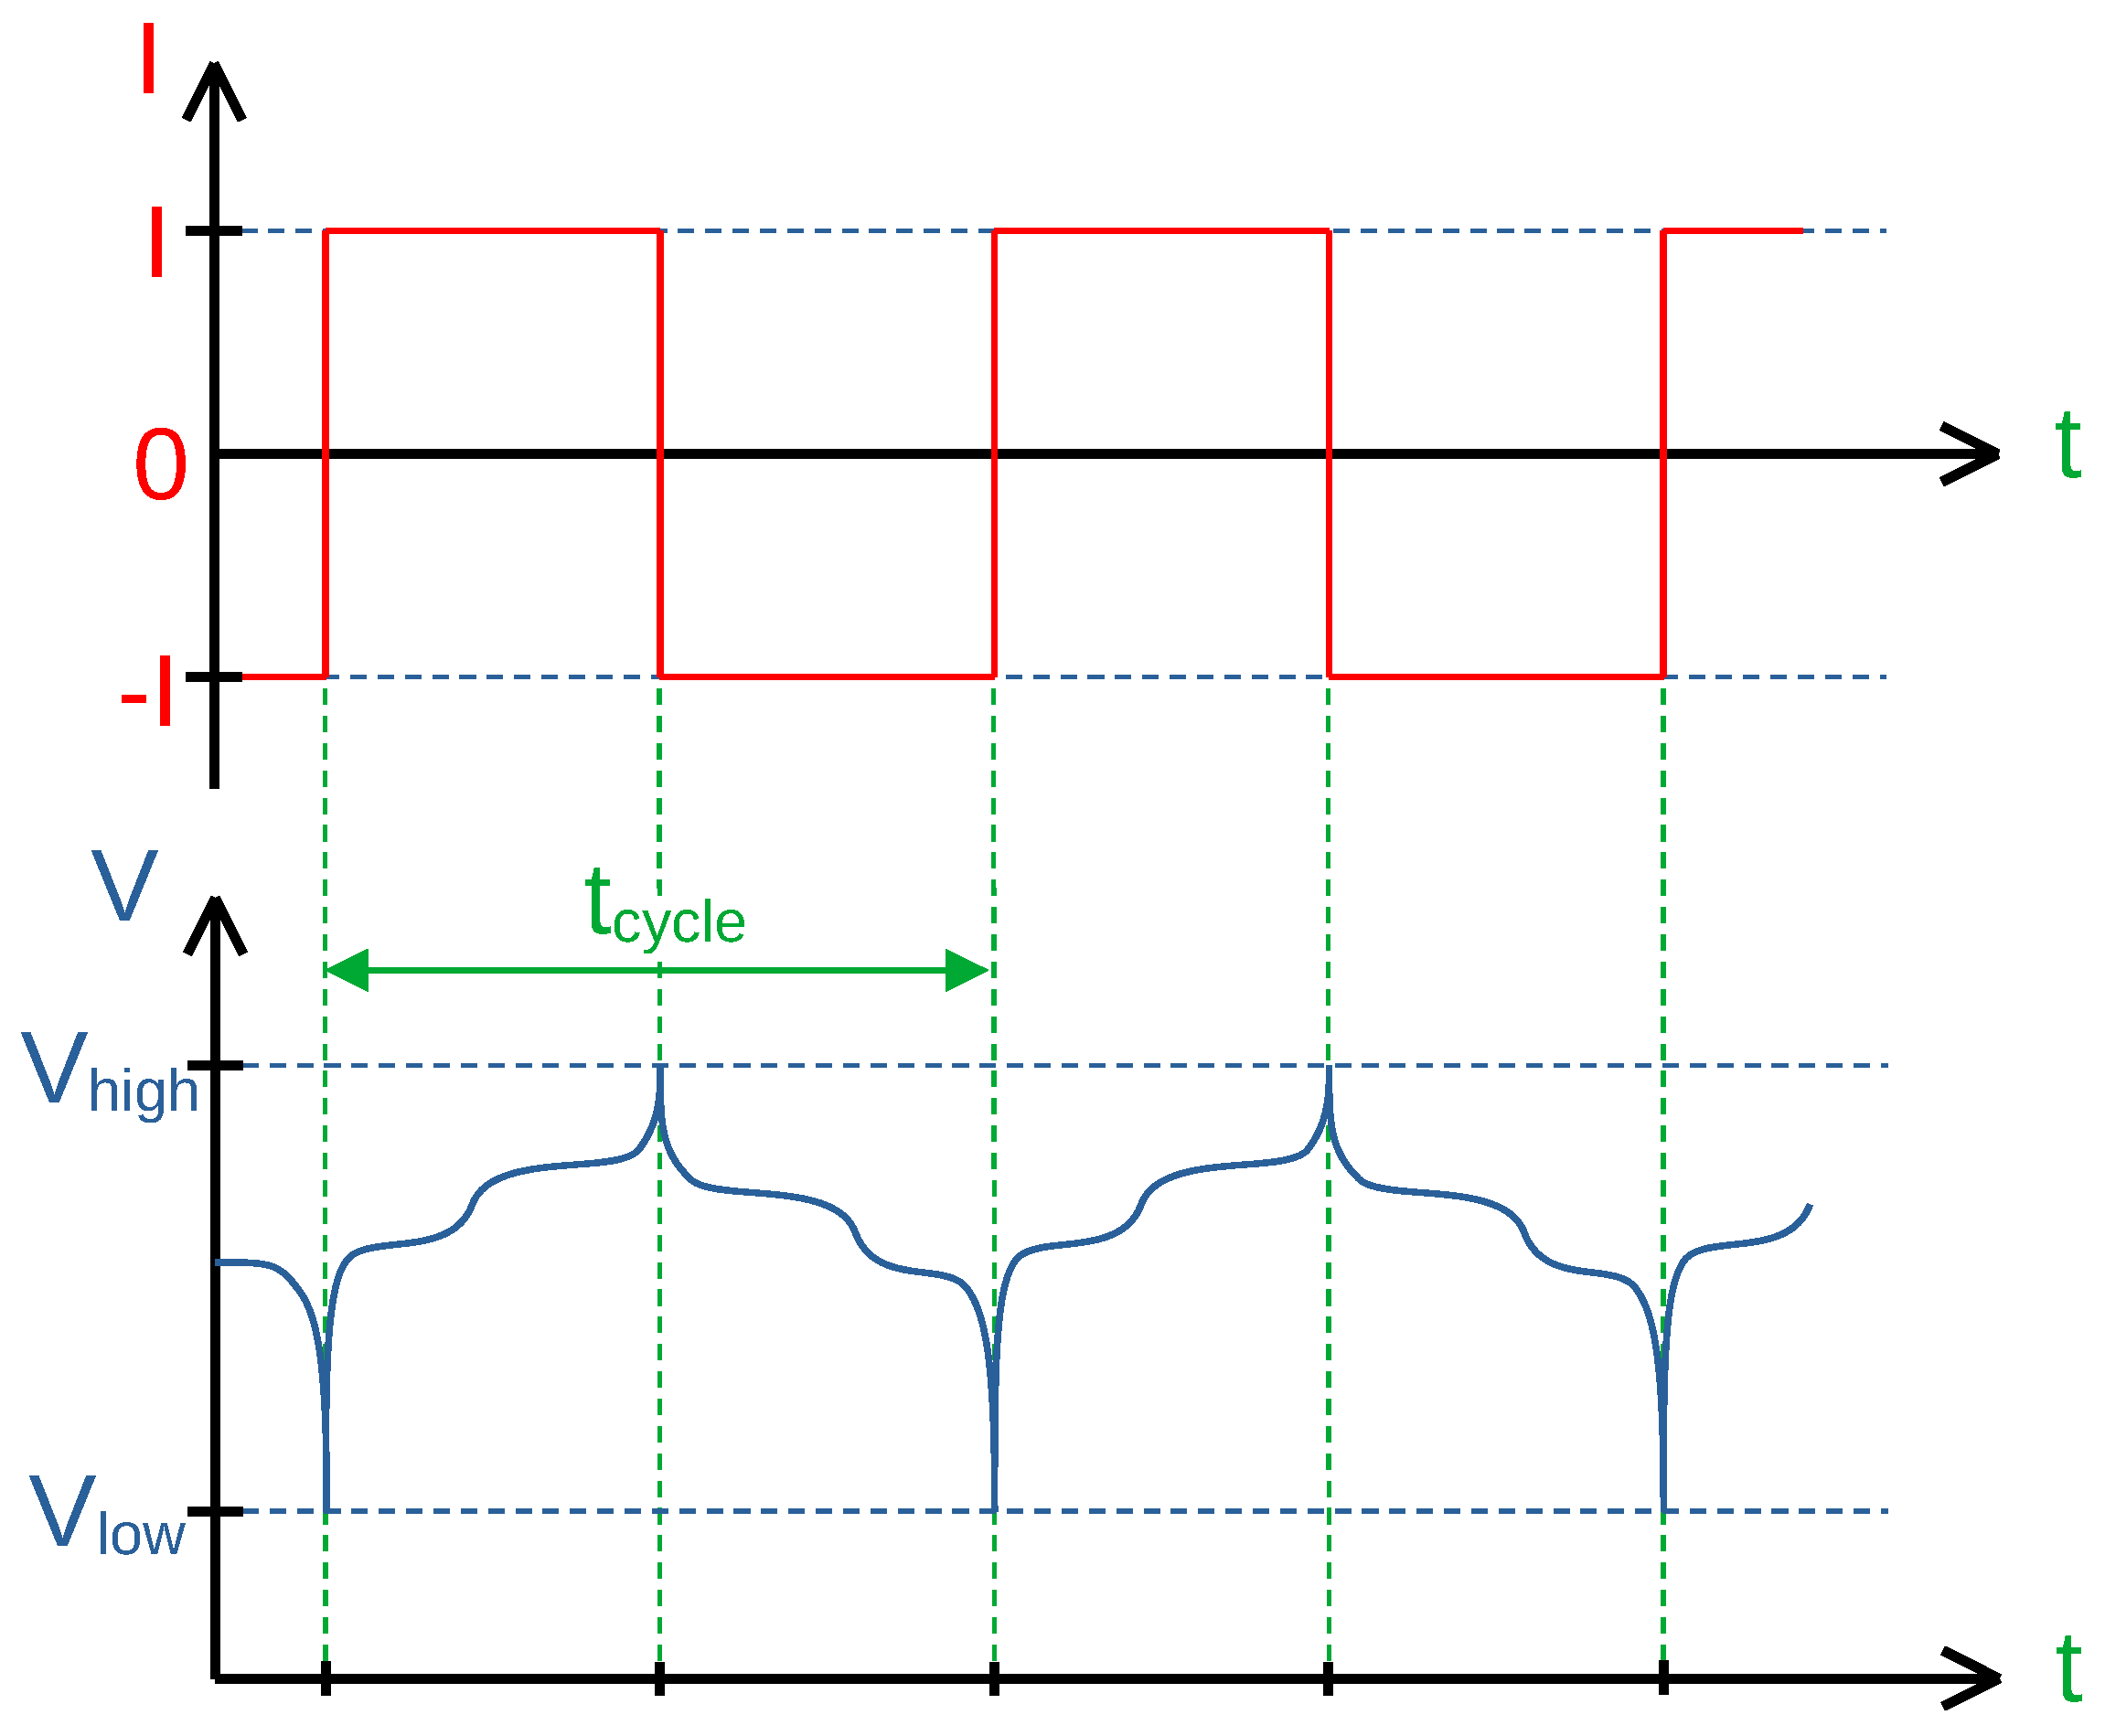
Three cells are cycled with different C-rates (which is referred to as C/x-scheme) between 2.5 V and 4.2 V without any rest period as shown in Figure 8. The first cell was periodically cycled in (C/4), the second in (C/12) and the third in (C/36). This procedure was chosen to determine differences in aging behavior with regard to the magnitude of the cycling current and duration.
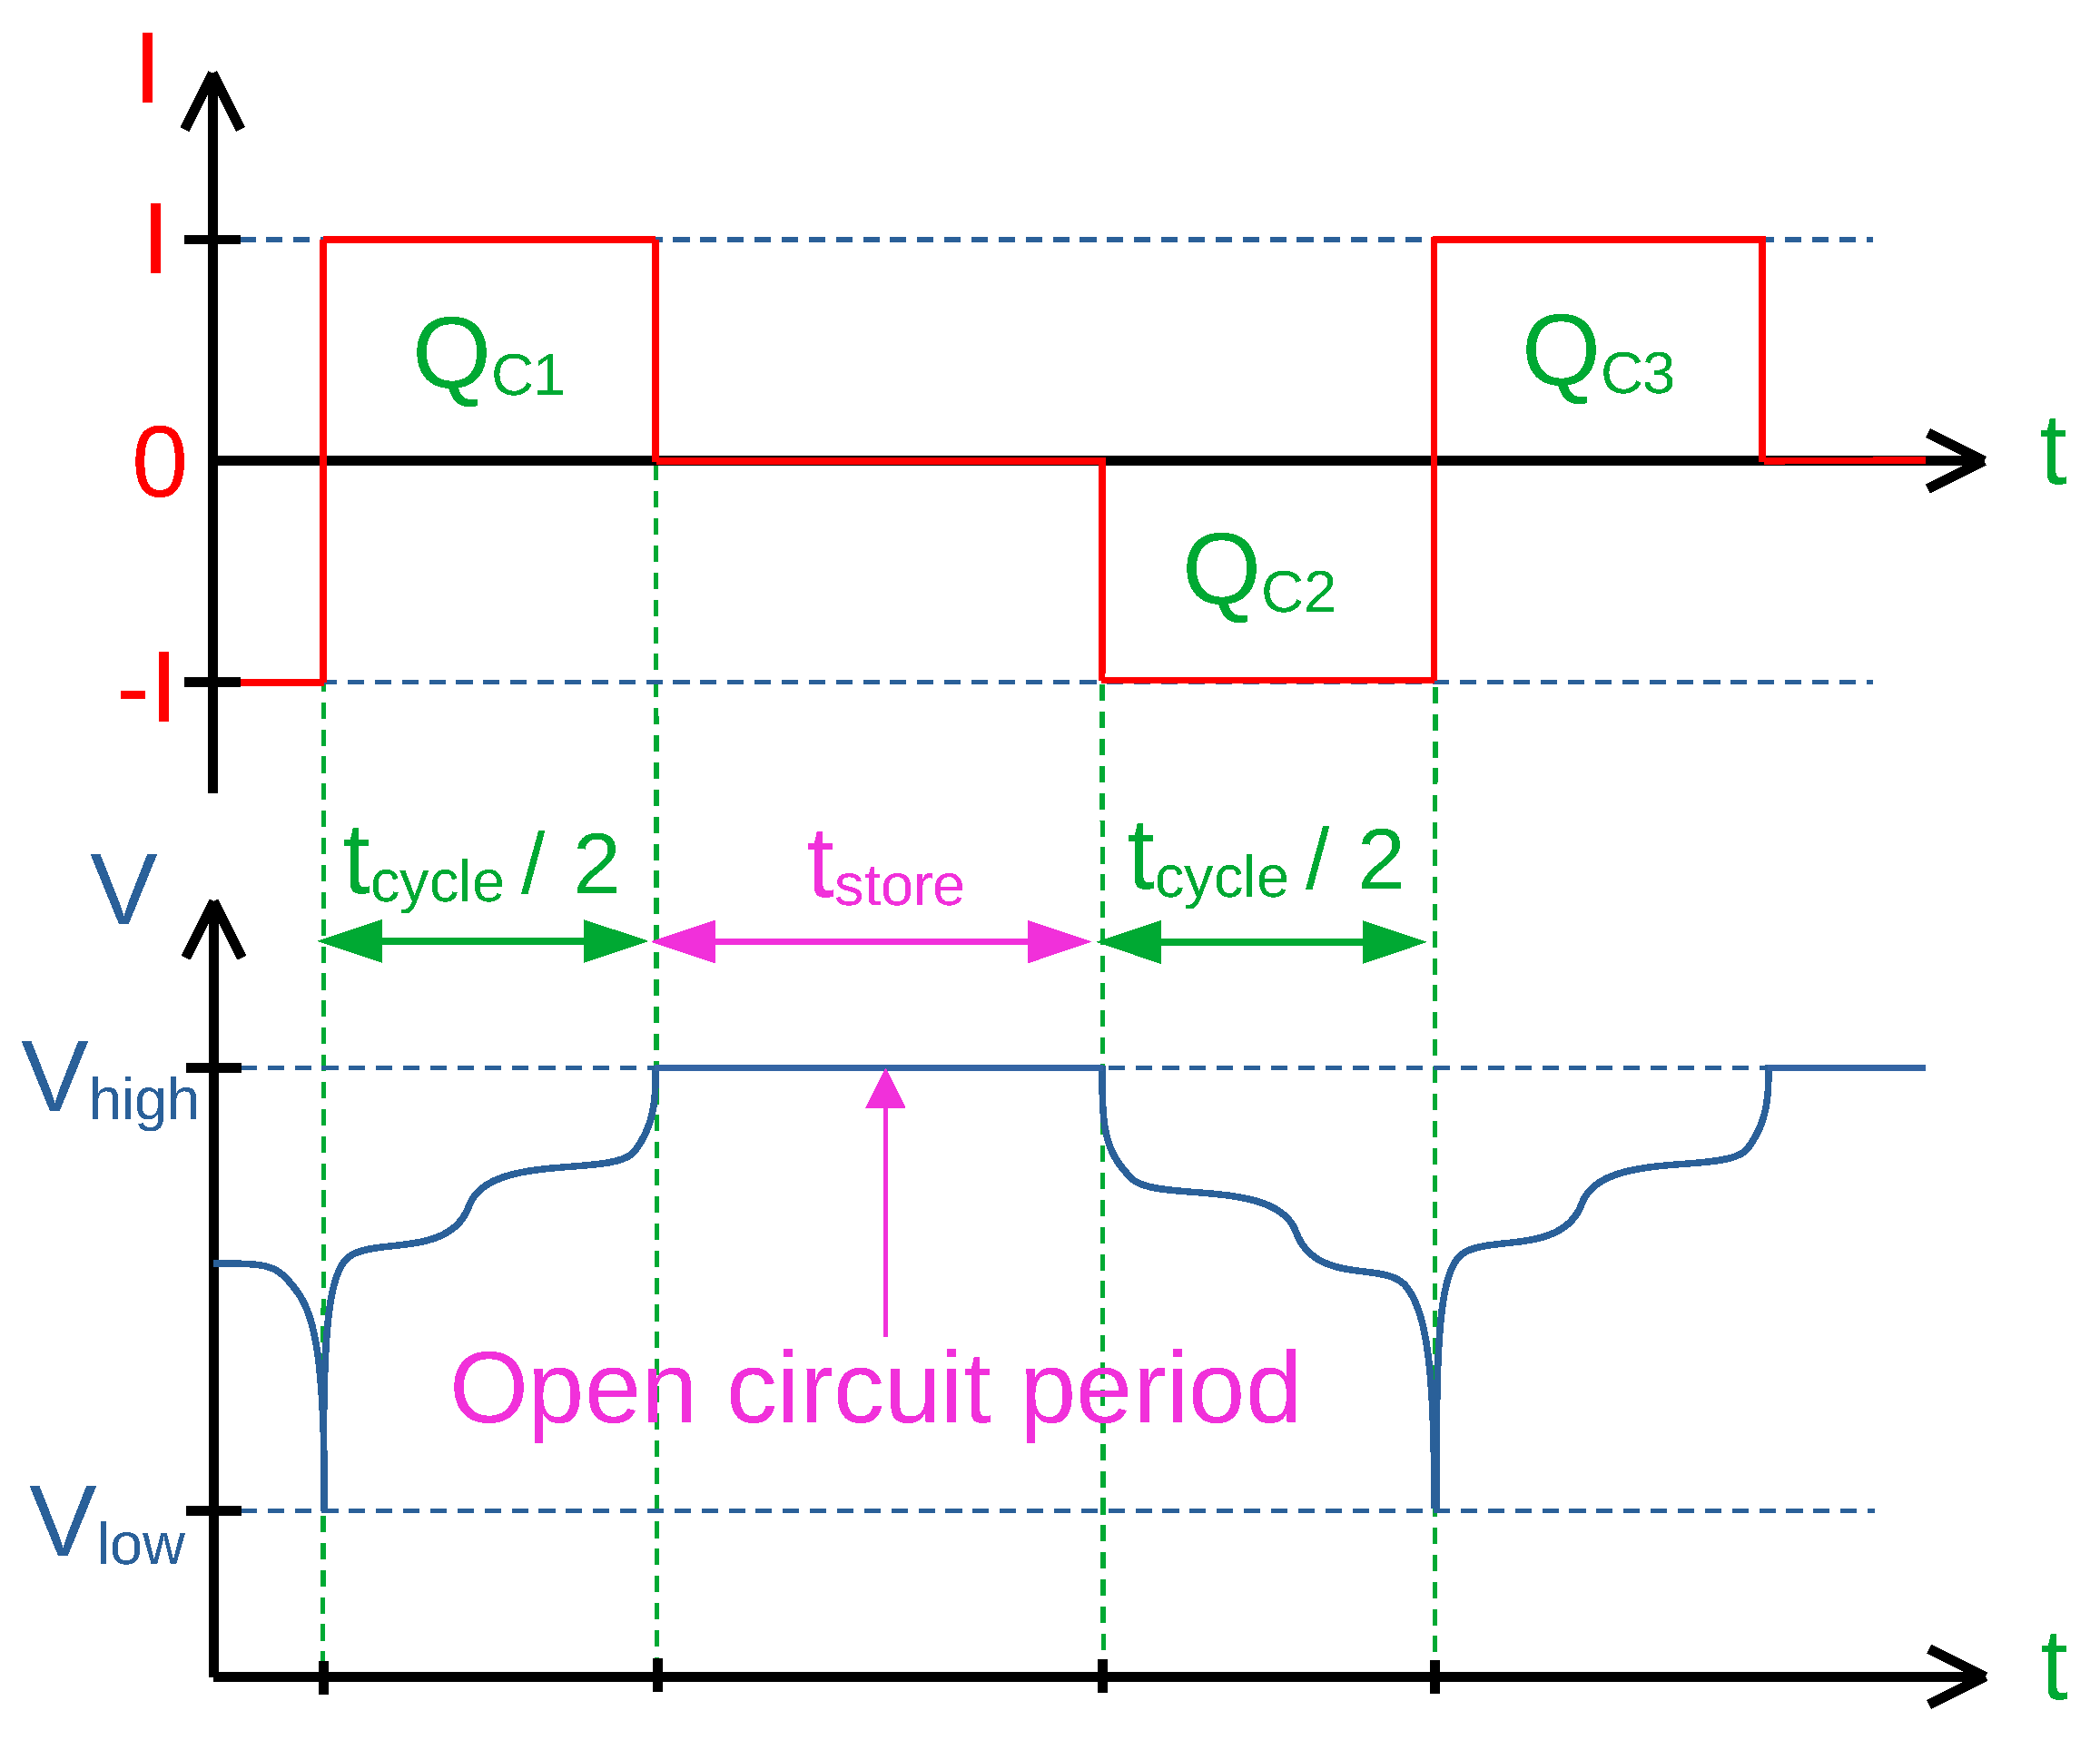
A fourth cell is also cycled between 2.5 V and 4.2 V with the cycling scheme from Figure 9, which takes a total of 72 h per cycle like the C/36 measurement. This cycling scheme is characterized by a holding phase at 100% SoC and is therefore briefly referred to as “high-SoC-scheme”. Due to the same cycling times, the results of the standard cycling method and the alternative cycling scheme are now comparable with each other.
It is expected that the calendrical aging of the high-SoC-scheme is greater than the aging of the C/x-schemes in the same time period, since a high state of charge leads to increased parasitic reactions [31]. To cycle the cell with the high-SoC scheme, it is firstly fully charged to its initial charge capacity . Then, the cell is left floating (open circuit) for . After finishing the open circuit holding period, the cell is cycled, and the cells discharge capacity such as the charge capacity are measured. This cycling process is repeated periodically. differs from because charge is lost due to leakage currents and calendrical aging during the holding period. differs from because the cell suffered calendrical aging from the holding phase and cyclic aging from one cycle. Having , and makes it possible to distinguish between cycle aging, calendrical aging and lost leakage charge due to leakage currents.
3.2. Effect of Different Aging Mechanisms on Capacity Degradation
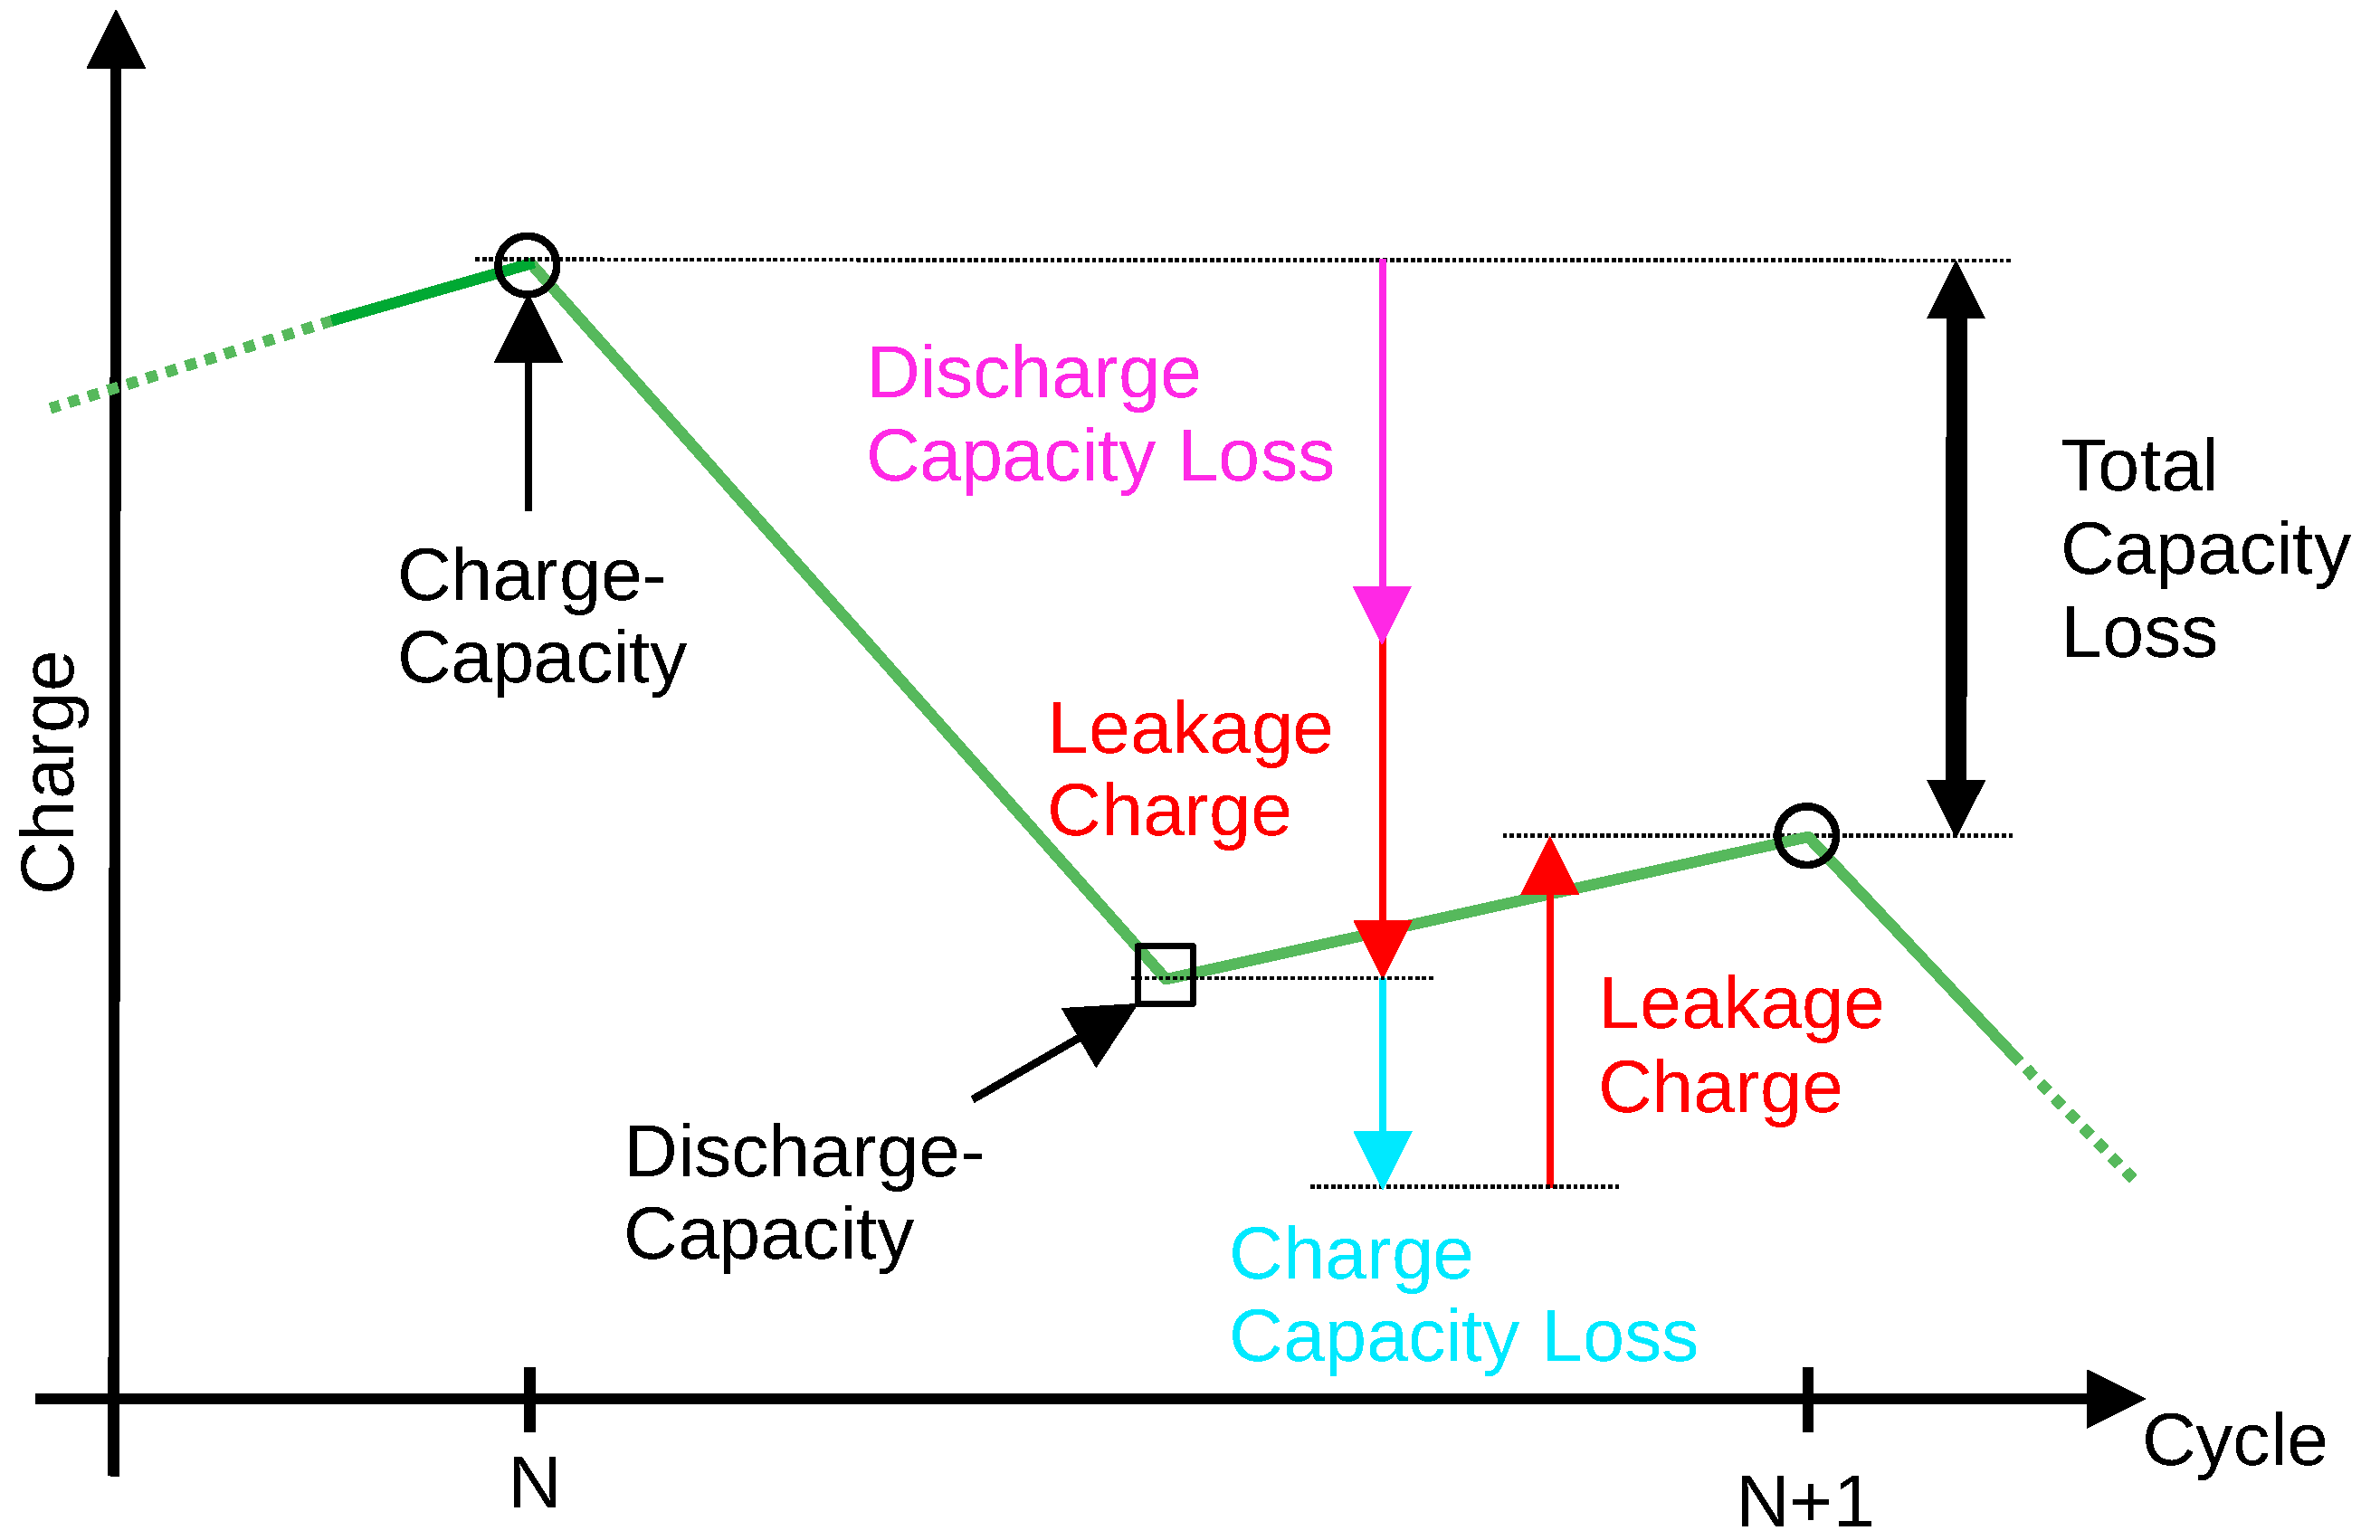
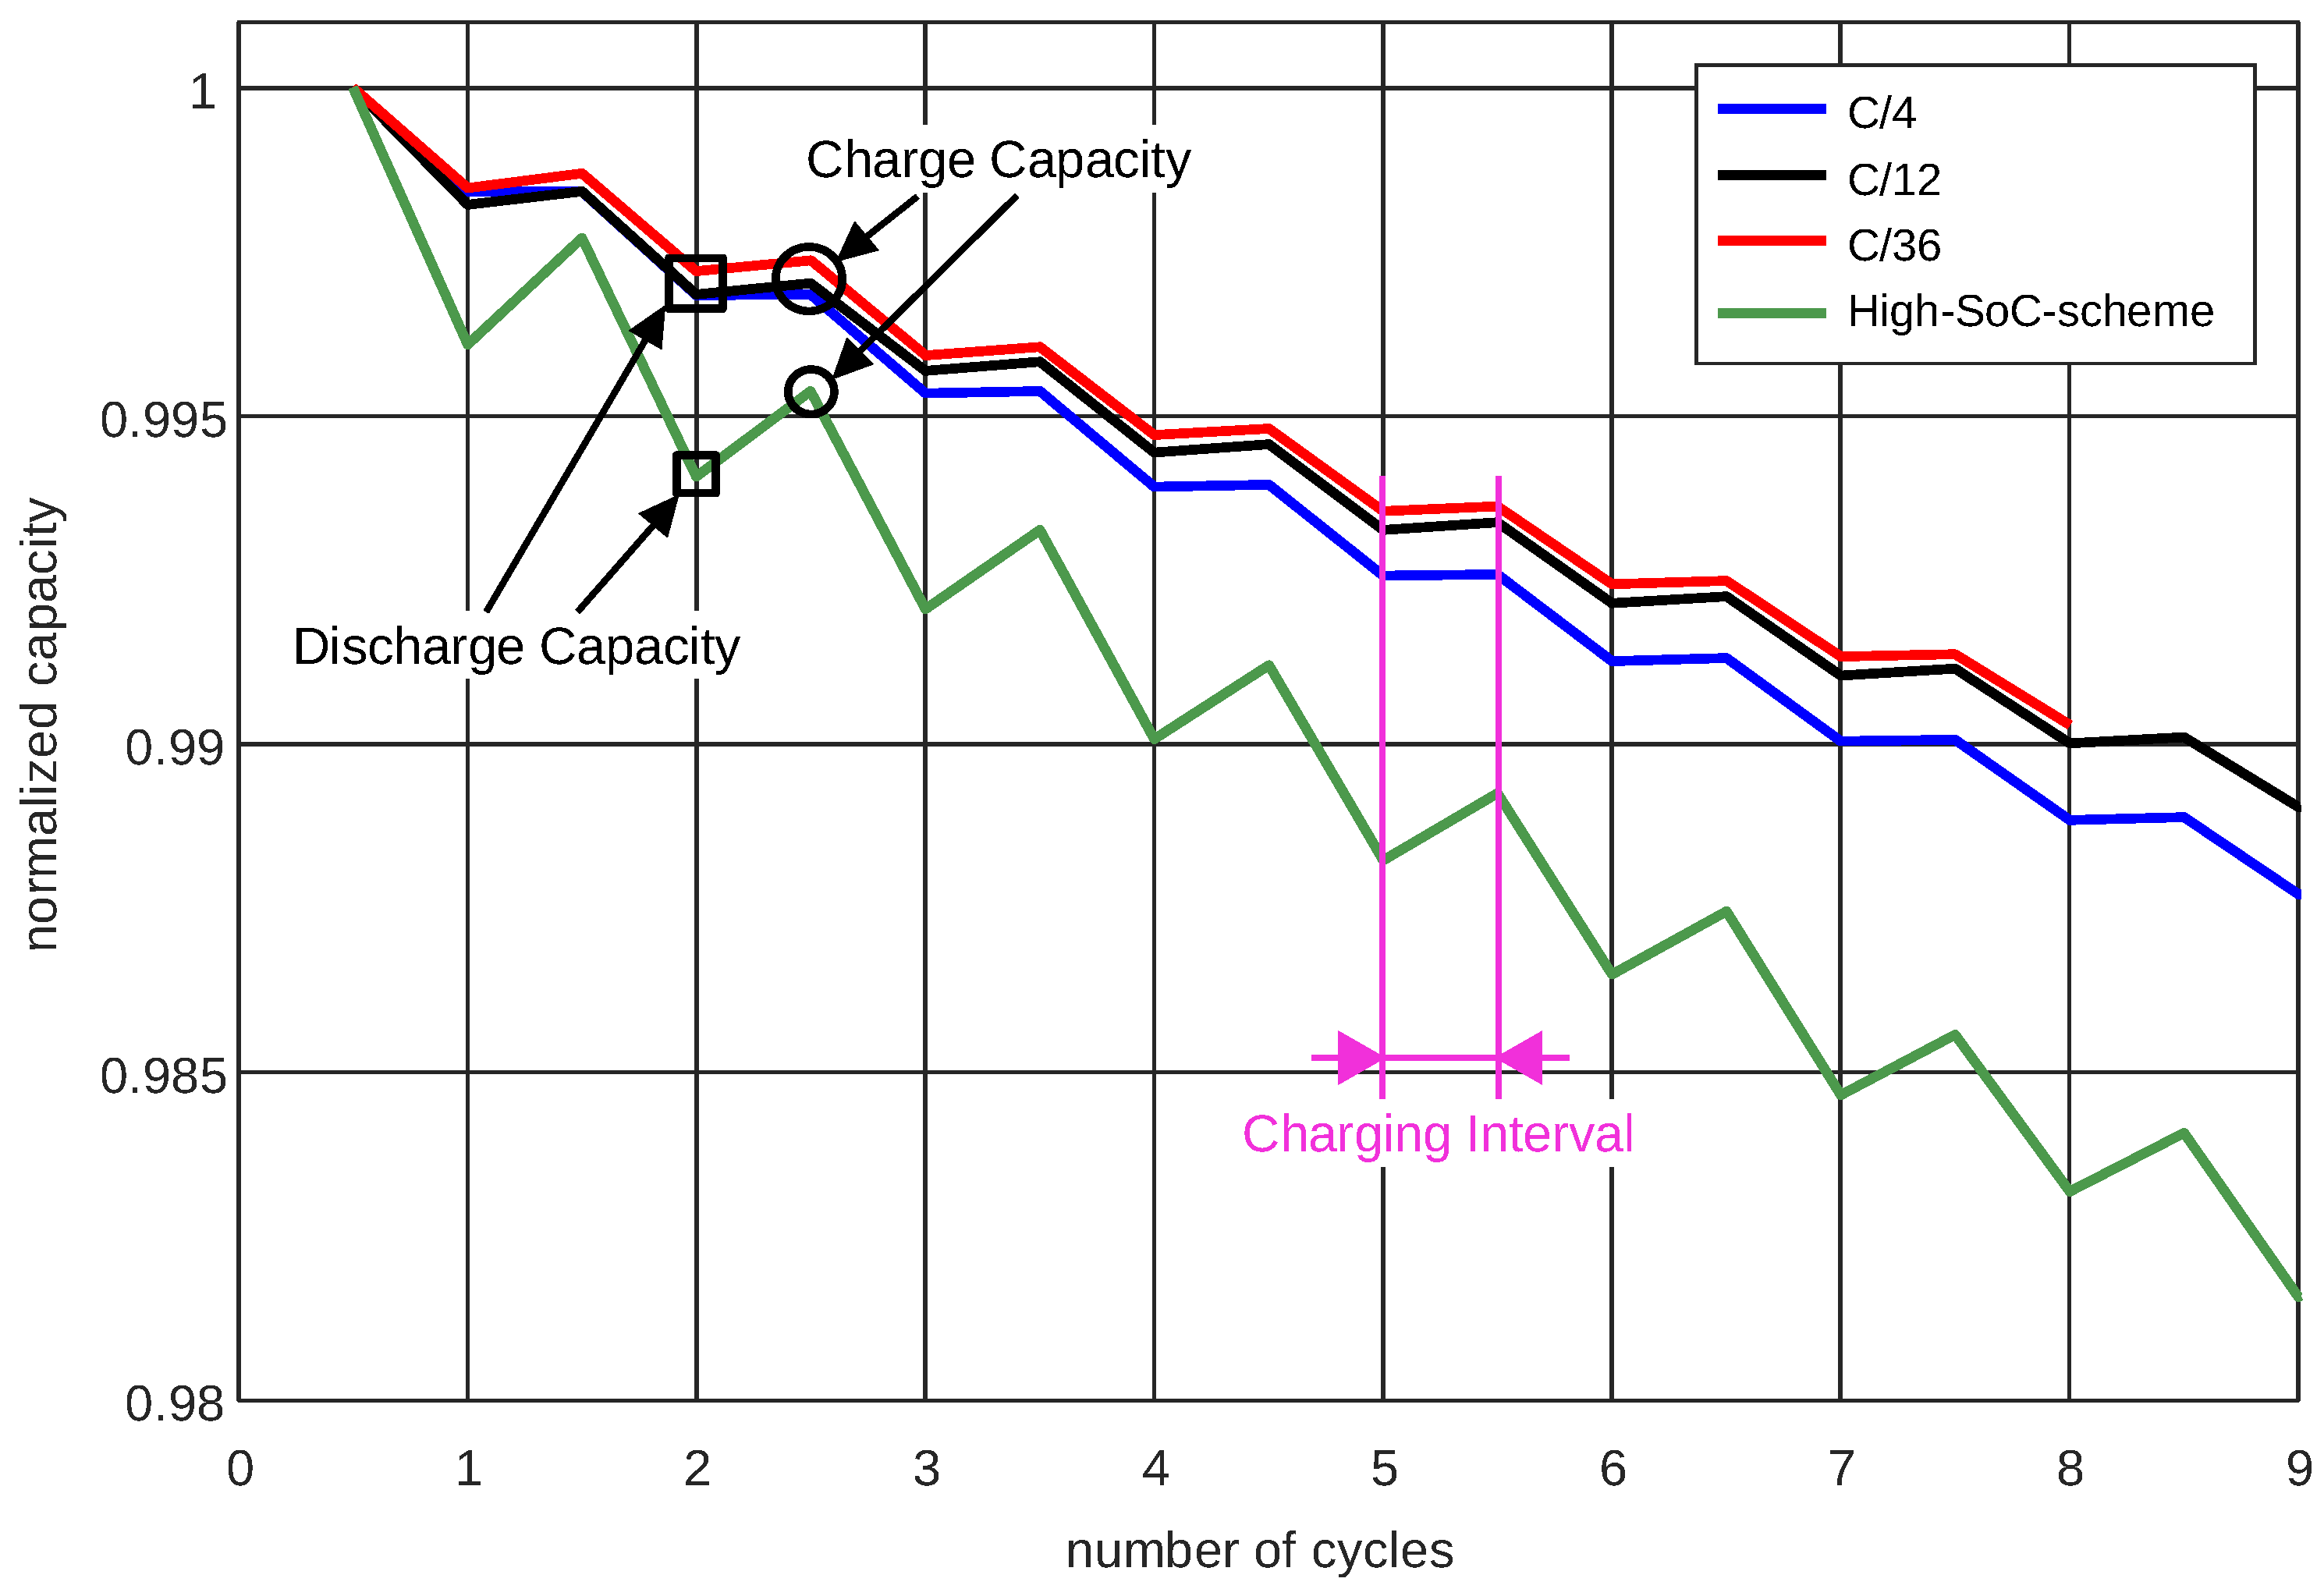
In this section, the relationship between capacity degradation, calendrical aging, cycle aging and leakage charge will be established. Figure 10 shows charging and discharging capacity over the respective cycles.
When a cell is cycled, its capacity decreases during charging and discharging which can be associated with cycle aging. In addition, the cell is permanently discharged by a leakage current. The magnitude of the leakage current most likely depends strongly on the SoC. In contrast, the leakage charge only causes the charge and discharge capacities to be measured incorrectly. It can be seen that the discharge capacity is always measured lower than the actual cell capacity at that time because the leakage charge leads to premature discharge termination of the cell (red arrow pointing down). Furthermore, it turns out that the charge capacity is always measured larger than it actually is because, due to the leakage charge, more charge has to be pushed into the cell until it is full (red arrow pointing up).
Regardless of whether the cell is cycled or stored, a second time-dependent aging effect occurs—the so-called calendrical aging. Calendrical aging depends strongly on the state of charge of the cell and typically increases with increasing SoC. It is assumed that calendrical aging is shared between both the discharge and charge losses shown in Figure 10.
As also shown in Figure 10, the total capacity loss between two successive charge measurements is the sum (magenta arrow + cyan arrow) of damage caused by charging, discharging and by the calendrical aging that occurred in this time interval.
In the next Section 3.3 and Section 3.4, the total charge losses due to calendrical aging, cycle aging and leakage charge between successive cycles are determined by evaluating high-precision measurement data.
3.3. Differentiating between Cycle and Calendrical Aging
In order to separate cycle aging and calendrical aging from each other, cells are cycled at different current rates. It is expected that differences between the capacity degradation rates will be detected, which will indicate the respective cycle aging and calendrical aging. For this purpose, the three measurements C/4, C/12 and C/36 are used.
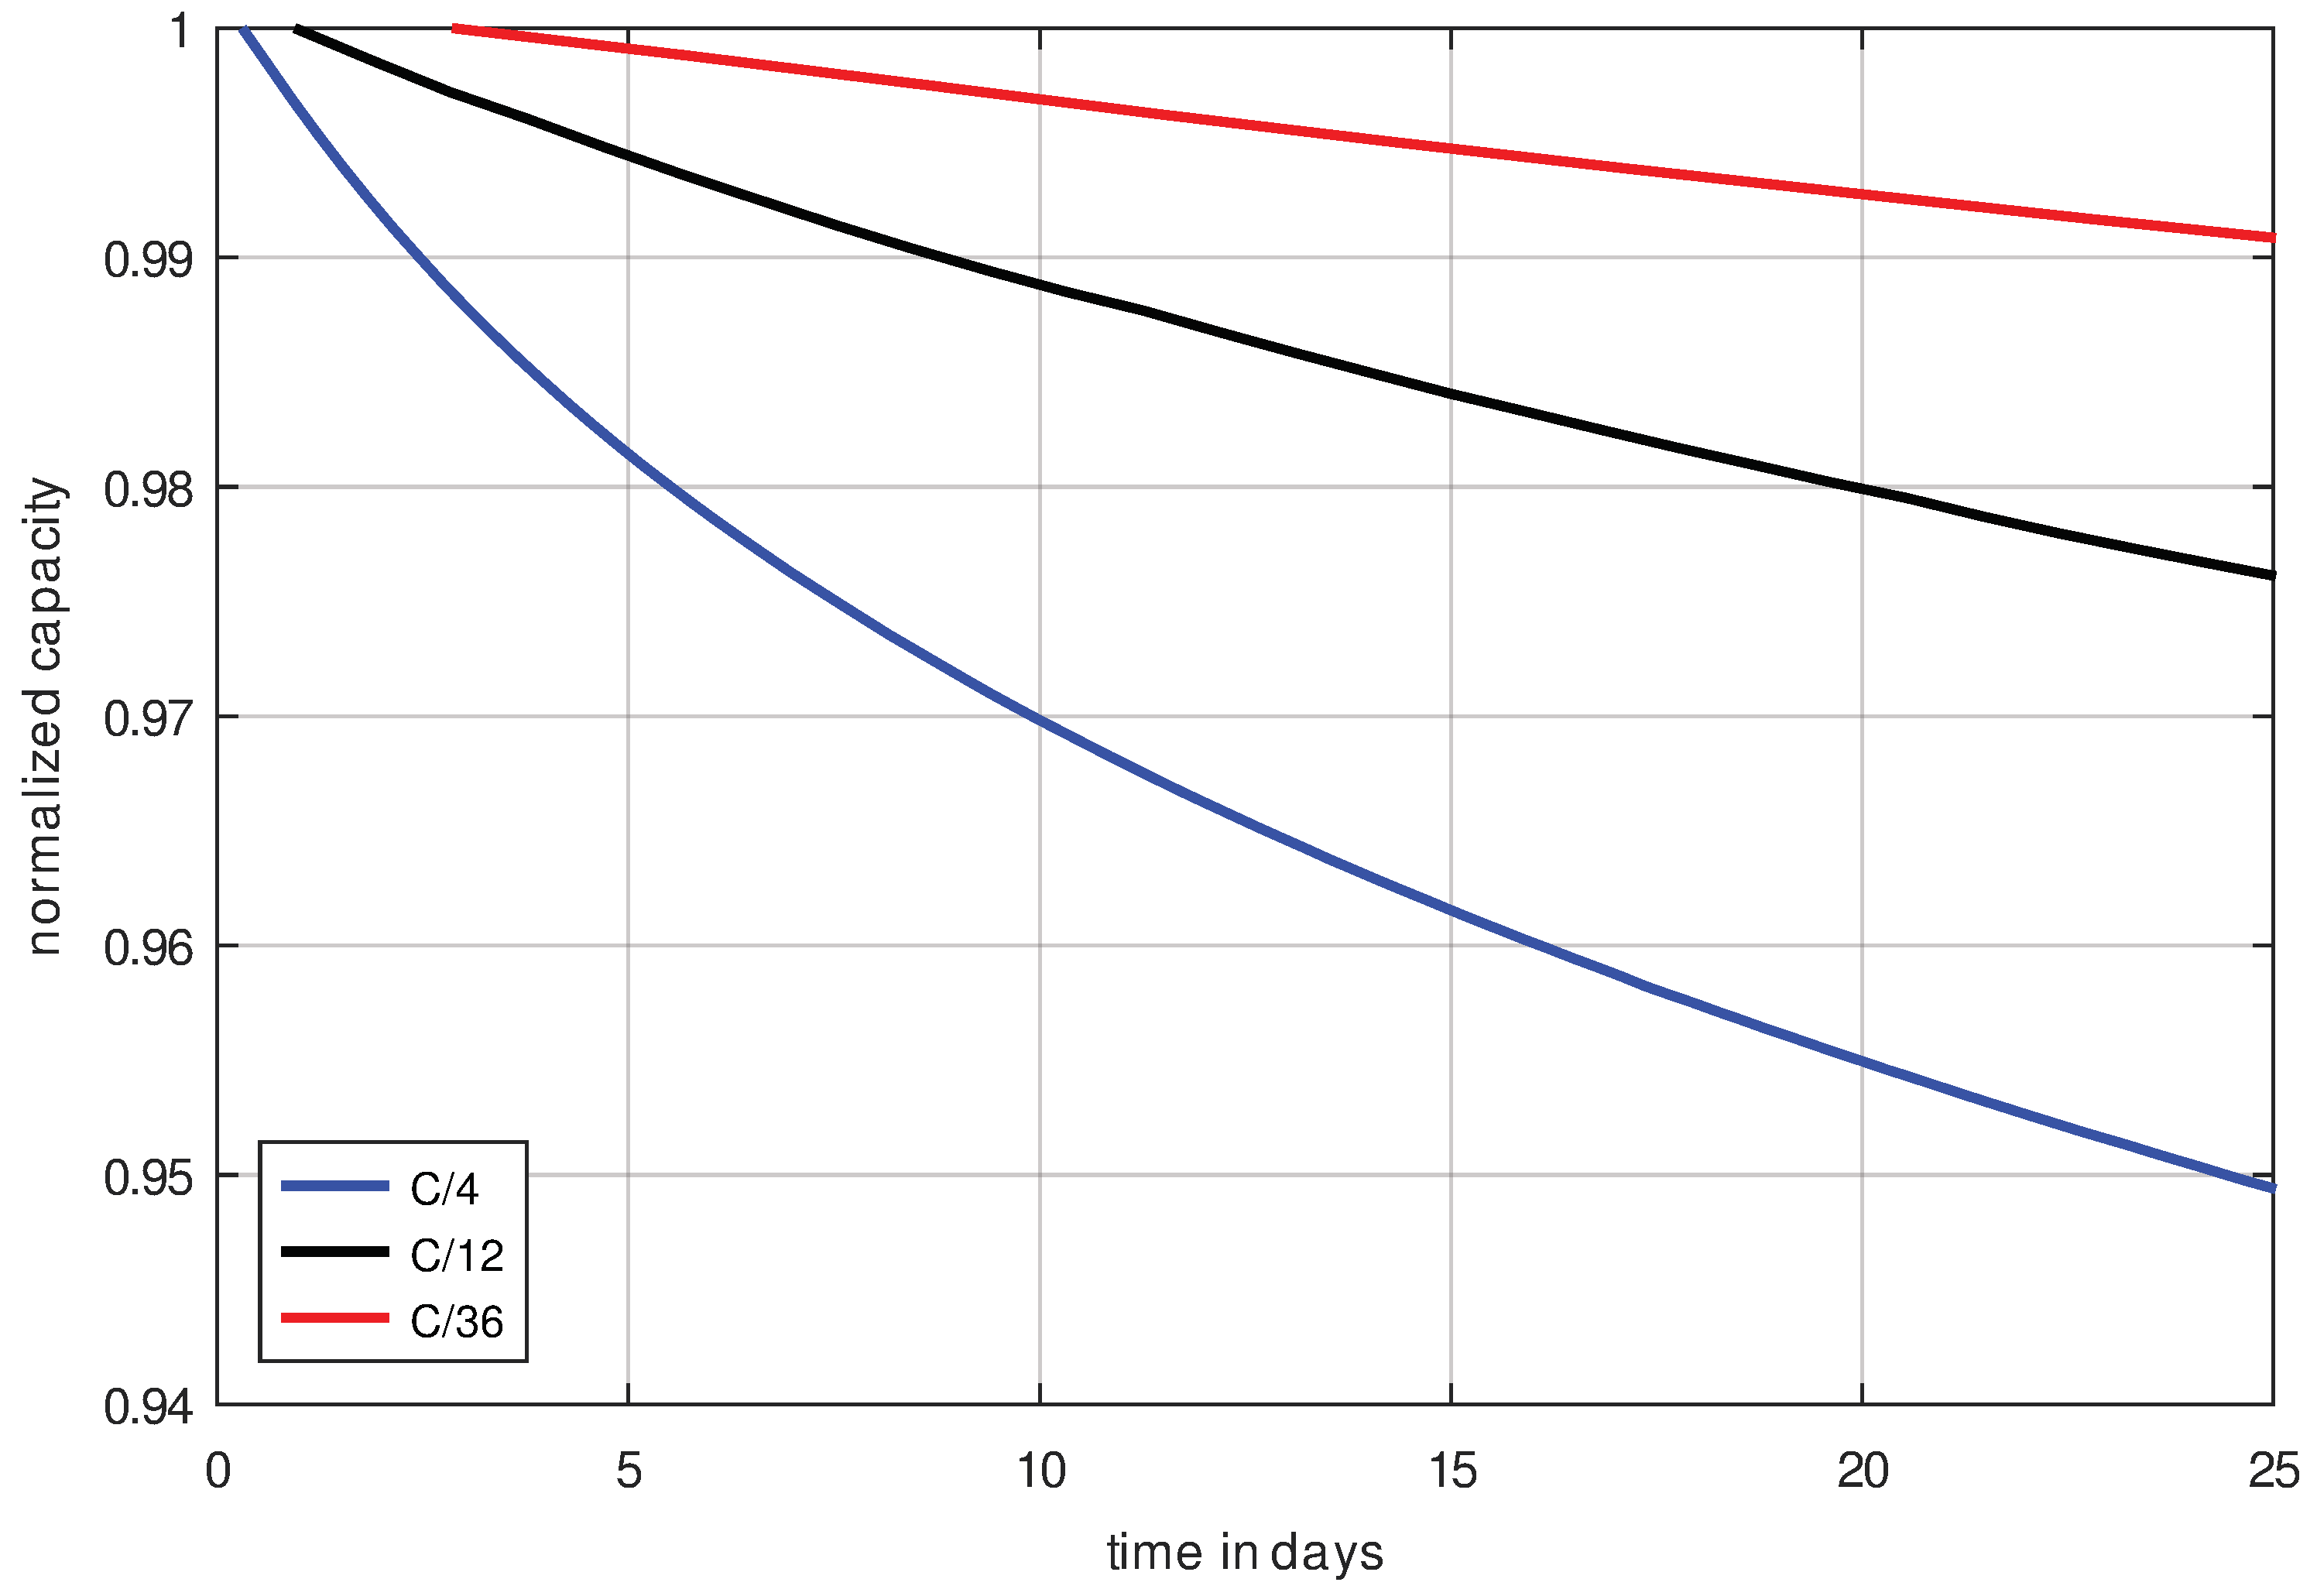
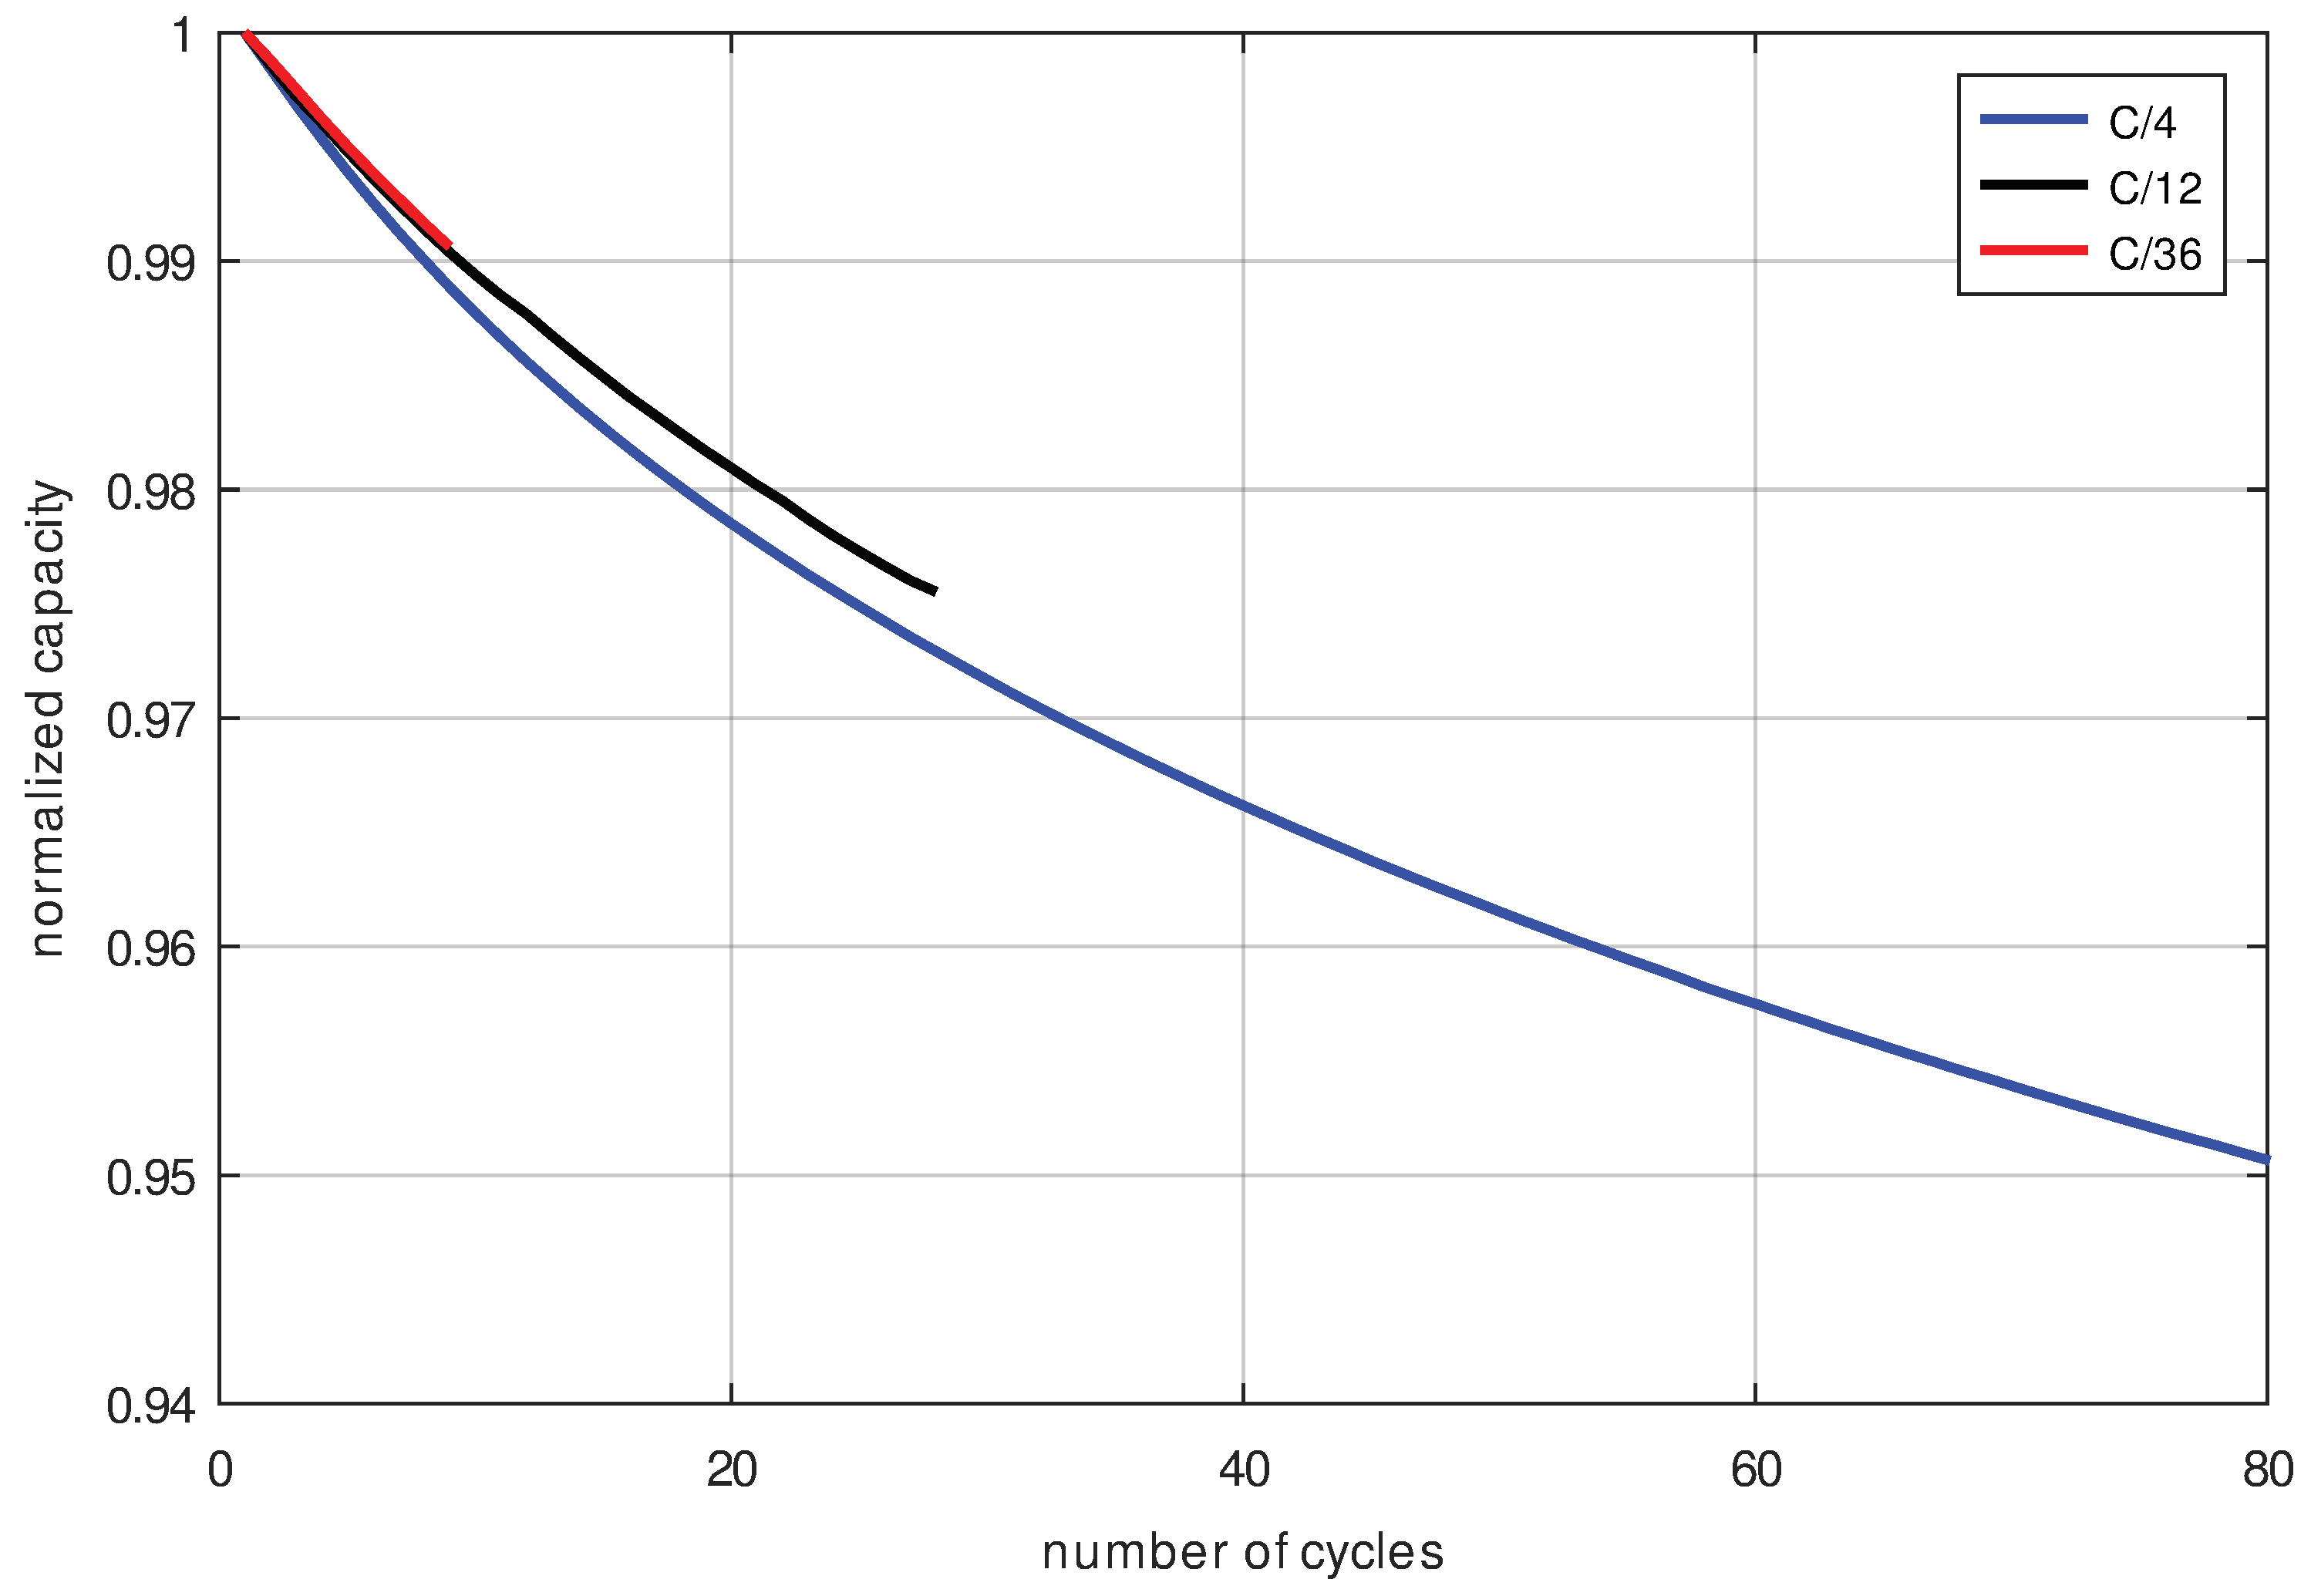
If the calendrical aging of the cells would be the dominant aging mechanism and the cycle aging is negligible, the capacity degradation curves plotted over time (Figure 11) should overlap. However, if cycle aging is dominant, then the capacity degradation curves plotted over the number of cycles (Figure 12) would overlap. To all appearances, the second case is present, so the cell is damaged mainly by cycle aging. This means that calendrical aging is negligible in the C/x-scheme because the SoC in this scheme is an average of 50%, which is too low to cause significant calendrical aging in this cell type.
The following observation further proves that cycle aging is dominant: At the same number of cycles, the cells with a higher charge rate age slightly faster which can be seen from the capacity decrease as shown in Figure 12. This is counterintuitive because, at the same number of cycles, cells with a higher charge rate were in fact exposed to cycling for a shorter measurement period and therefore have less calendrical aging, but still the capacity decrease is faster for a higher cycling current—hence having a shorter measurement time—and the same number of cycles.
This supports the claim that calendrical aging hardly occurs, and cycle aging is the dominant degradation mechanism for this cell type cycled with C/x-schemes.
By investigating Figure 12, one could presume that the aging of the cell increases over-proportionally with the charging current because the C/4 measurement shows a faster decay than the C/12 and C/36 measurements. To investigate this presumption in more detail, the difference between consecutive capacitance measurements was calculated for different C-rates as shown in Figure 13. As it turns out for all measurements, they have similar aging rates as shown in Figure 13. Initially, the rates of the C/12 and C/36 measurements differ slightly from the C/4 measurement, but they gradually begin to converge until, after 13 cycles, the C/12-curve finally overlaps. It can be stated that the cells cycled with the C/x-scheme mainly experience cycle aging and almost no calendrical aging. Furthermore, the cycle aging rate has hardly any current-dependence for the chosen magnitude of cycling currents. Therefore, the measurement results from Figure 13 already turn out to be the sought cycle aging rate. It is assumed that the cycle aging rate is the same for the High-SoC scheme, as the cell is cycled in exactly the same way as in the C/4 measurement.
What turns out to be surprising is that the aging rate of the cells with respect to its capacity decreases significantly in the course of the first 80 cycles (for C/4, the rate changes by factor 5). This transient shows that it does not make sense to look for a single value regarding the cycle aging rate, but that only a curve for the cycle aging rate comprehensively describes the actual process. This transient process can be well explained with the buildup of the solid electrolyte interface as shown in [32].
3.4. Determining Leakage Charge and Calendrical Aging
The resulting capacity degradation of the high-SoC-scheme and the C/x-scheme measurements are shown for comparison in Figure 14 where the charge and discharge capacity curves of both schemes are displayed.
What is striking about the C/x-scheme results in Figure 14 is that, for all cycling currents, in the charging interval, the line remains almost horizontal. A detailed examination of these intervals can be found in Figure 15.
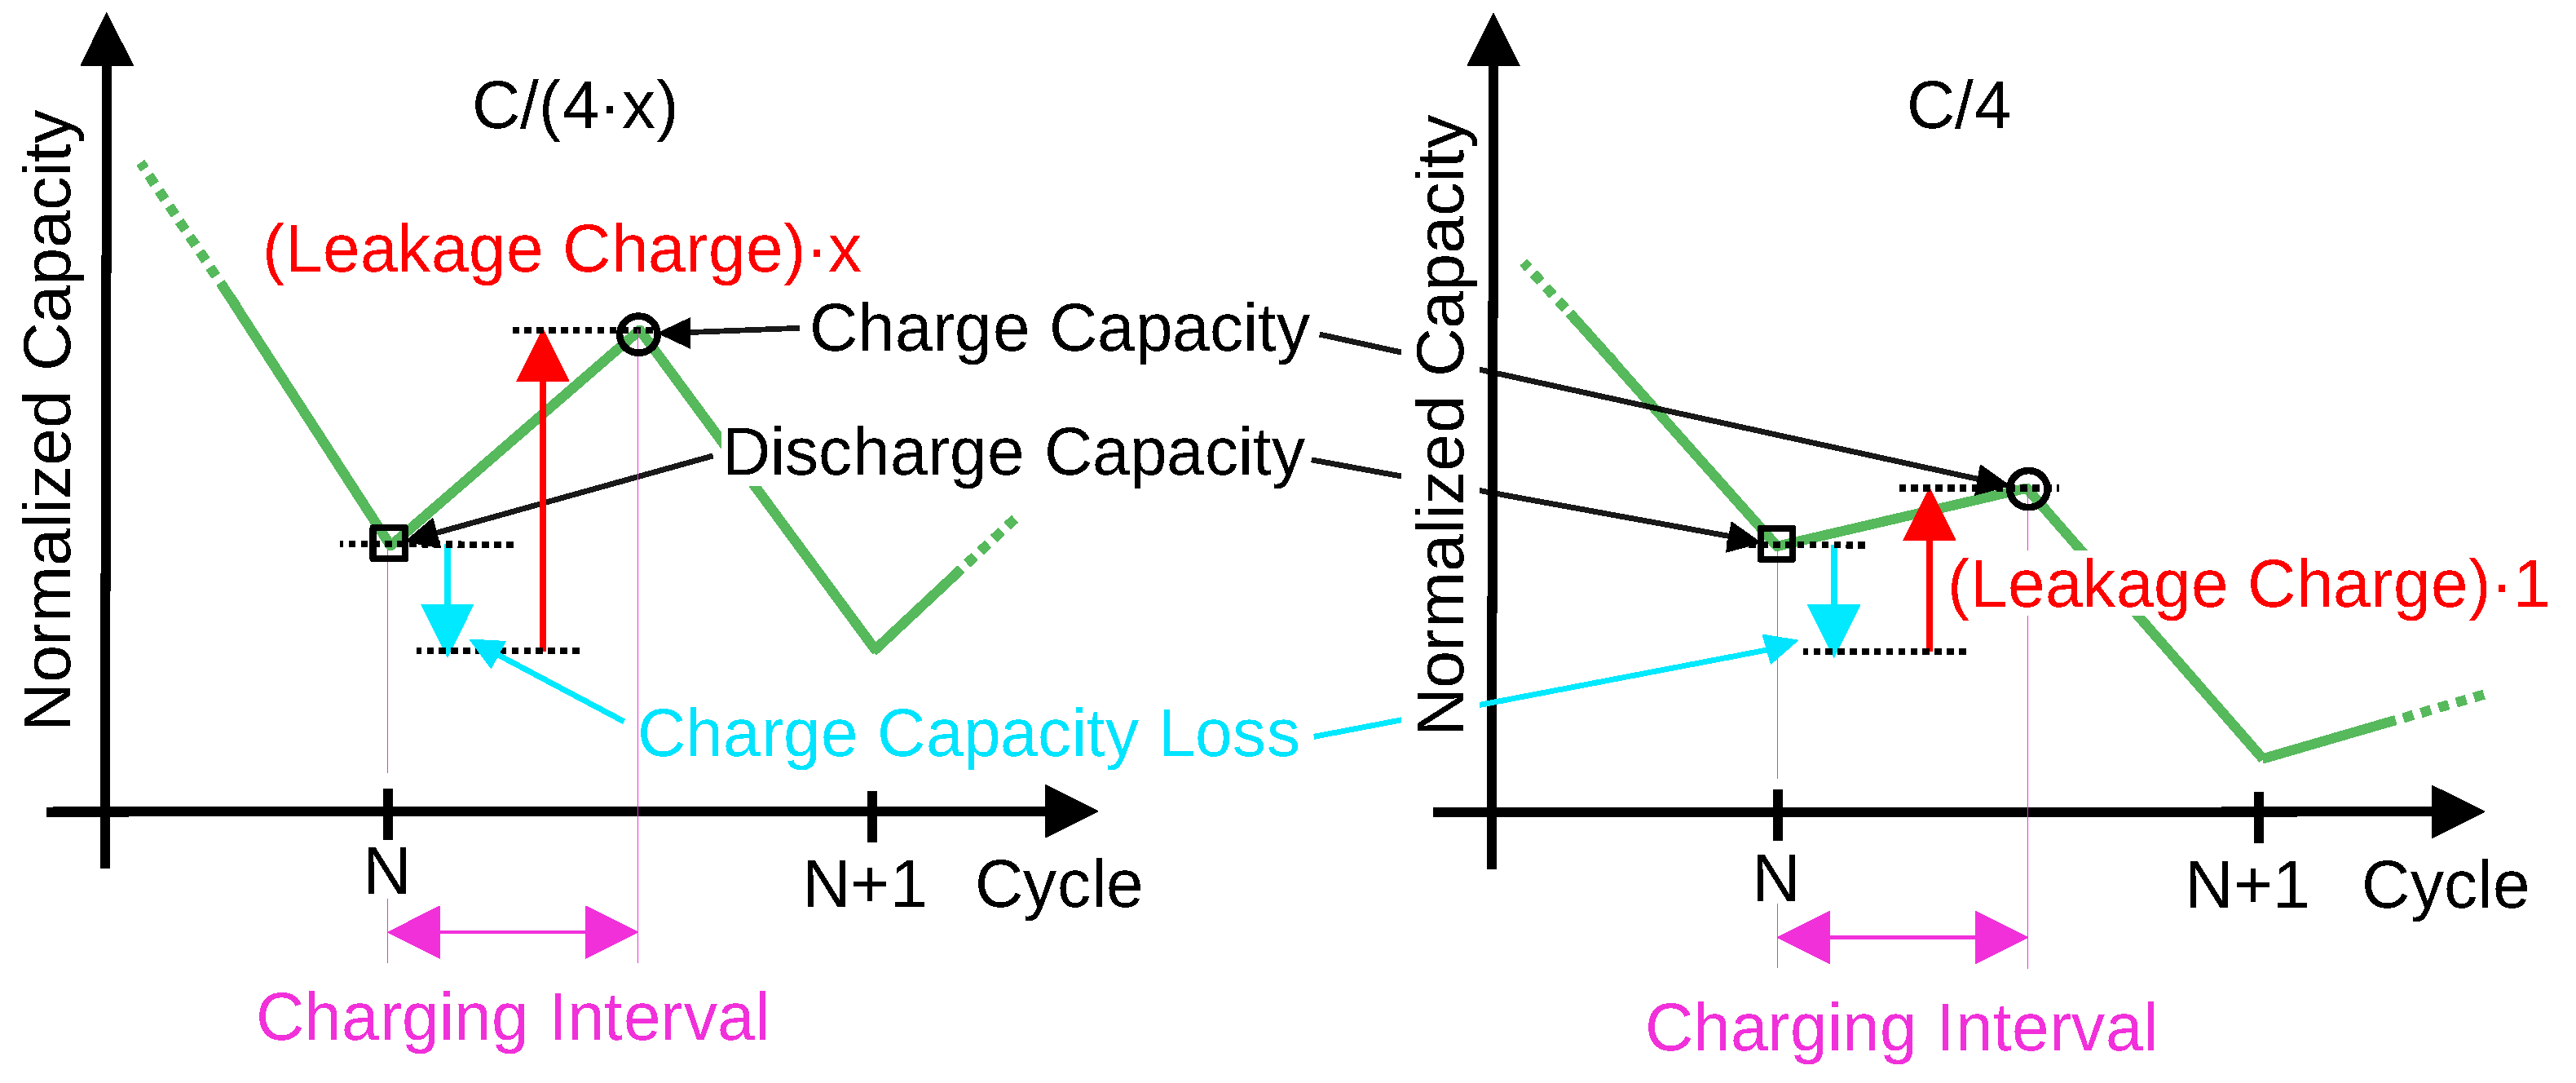
As previously demonstrated in Section 3.3, all C/x-scheme measurements show the same cycle aging. Therefore, it is assumed that all C/x-scheme measurements have the same charge capacity loss at the same number of cycles. Where the measurements differ is in their amount of leakage charge because this depends on the measurement duration. Accordingly, the leakage charge in the C/36 measurement is 9 times bigger than in the C/4 measurement—this is illustrated for a general case in Figure 15. Because, even for the longest lasting C/36 measurement in the charging interval, the leakage charge is negligible (slope is almost horizontal and not inclined), it is also negligible for the shorter C/12 and C/4 measurements.
Because we could demonstrate that virtually no leakage occurs, the C/4 measurement can be used to show that the charge capacity loss is also negligible. This is because the curve in the charge–discharging intervals (magenta arrow) is also horizontal. This explains why the leakage charge and the charge capacity losses are almost non-existent for all the C/x-schemes.
Since, as shown in Section 3.3, the calendrical aging of the C/x-scheme with an average SoC of 50% is negligible, the question arises as to what the calendrical aging looks like when operating cells at higher average SoC. Therefore, the cells are cycled according to the high-SoC-scheme shown in Figure 9 with an average SoC close to 100%. It is found that the capacity loss for the high-SoC-scheme takes place much faster than for the C/x-schemes (see Figure 14). In addition, it can be seen that the leakage charge losses are also very pronounced in the high-SoC-scheme (which can be seen from the incline between discharge and charge as described in Section 3.2) in contrast to the measurement results of the C/x-scheme.
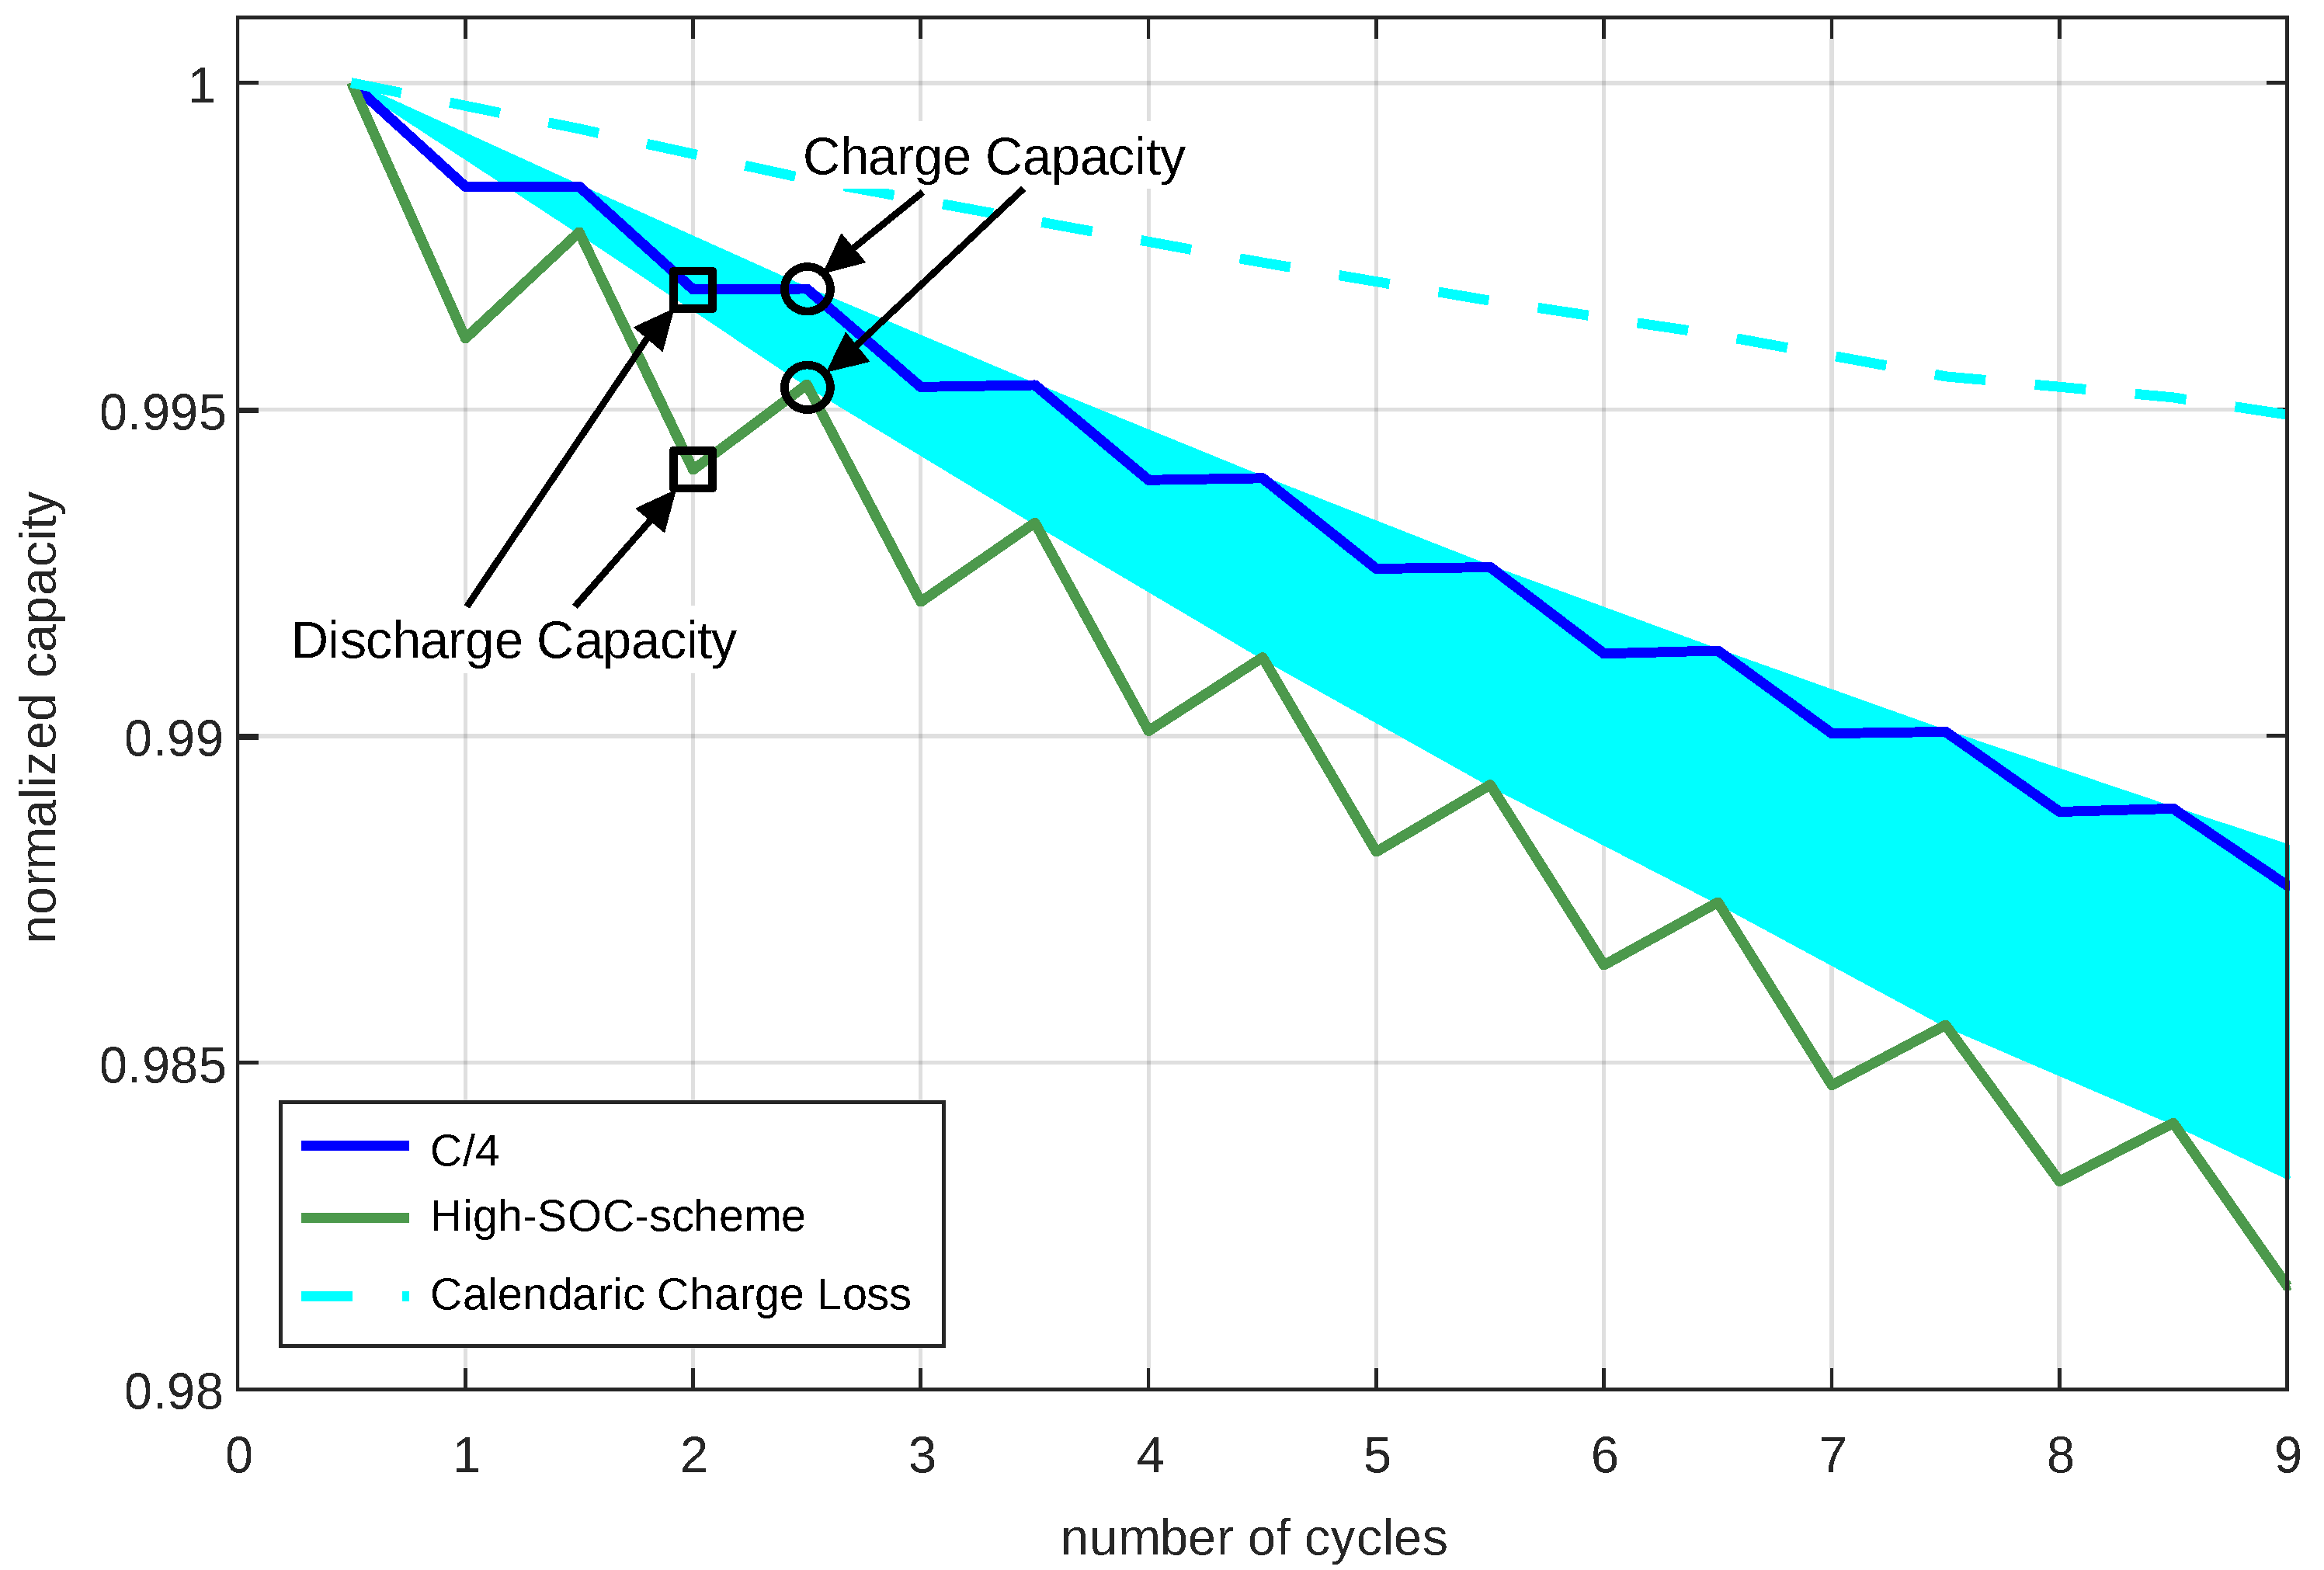
As mentioned in Section 3.3, it is assumed that the high-SoC-scheme has the same cycle aging as the C/x-scheme. This means that the high-SoC-scheme differs only from the C/x-scheme due to calendrical aging. This calendrical capacity degradation is shown in Figure 16 indicated with the cyan area. If the calendrical charge loss is subtracted from 1 (which is the normalized initial capacity), the dashed cyan curve is obtained. This dashed cyan curve displays the capacity degradation of the high-SoC scheme purely by calendrical aging.
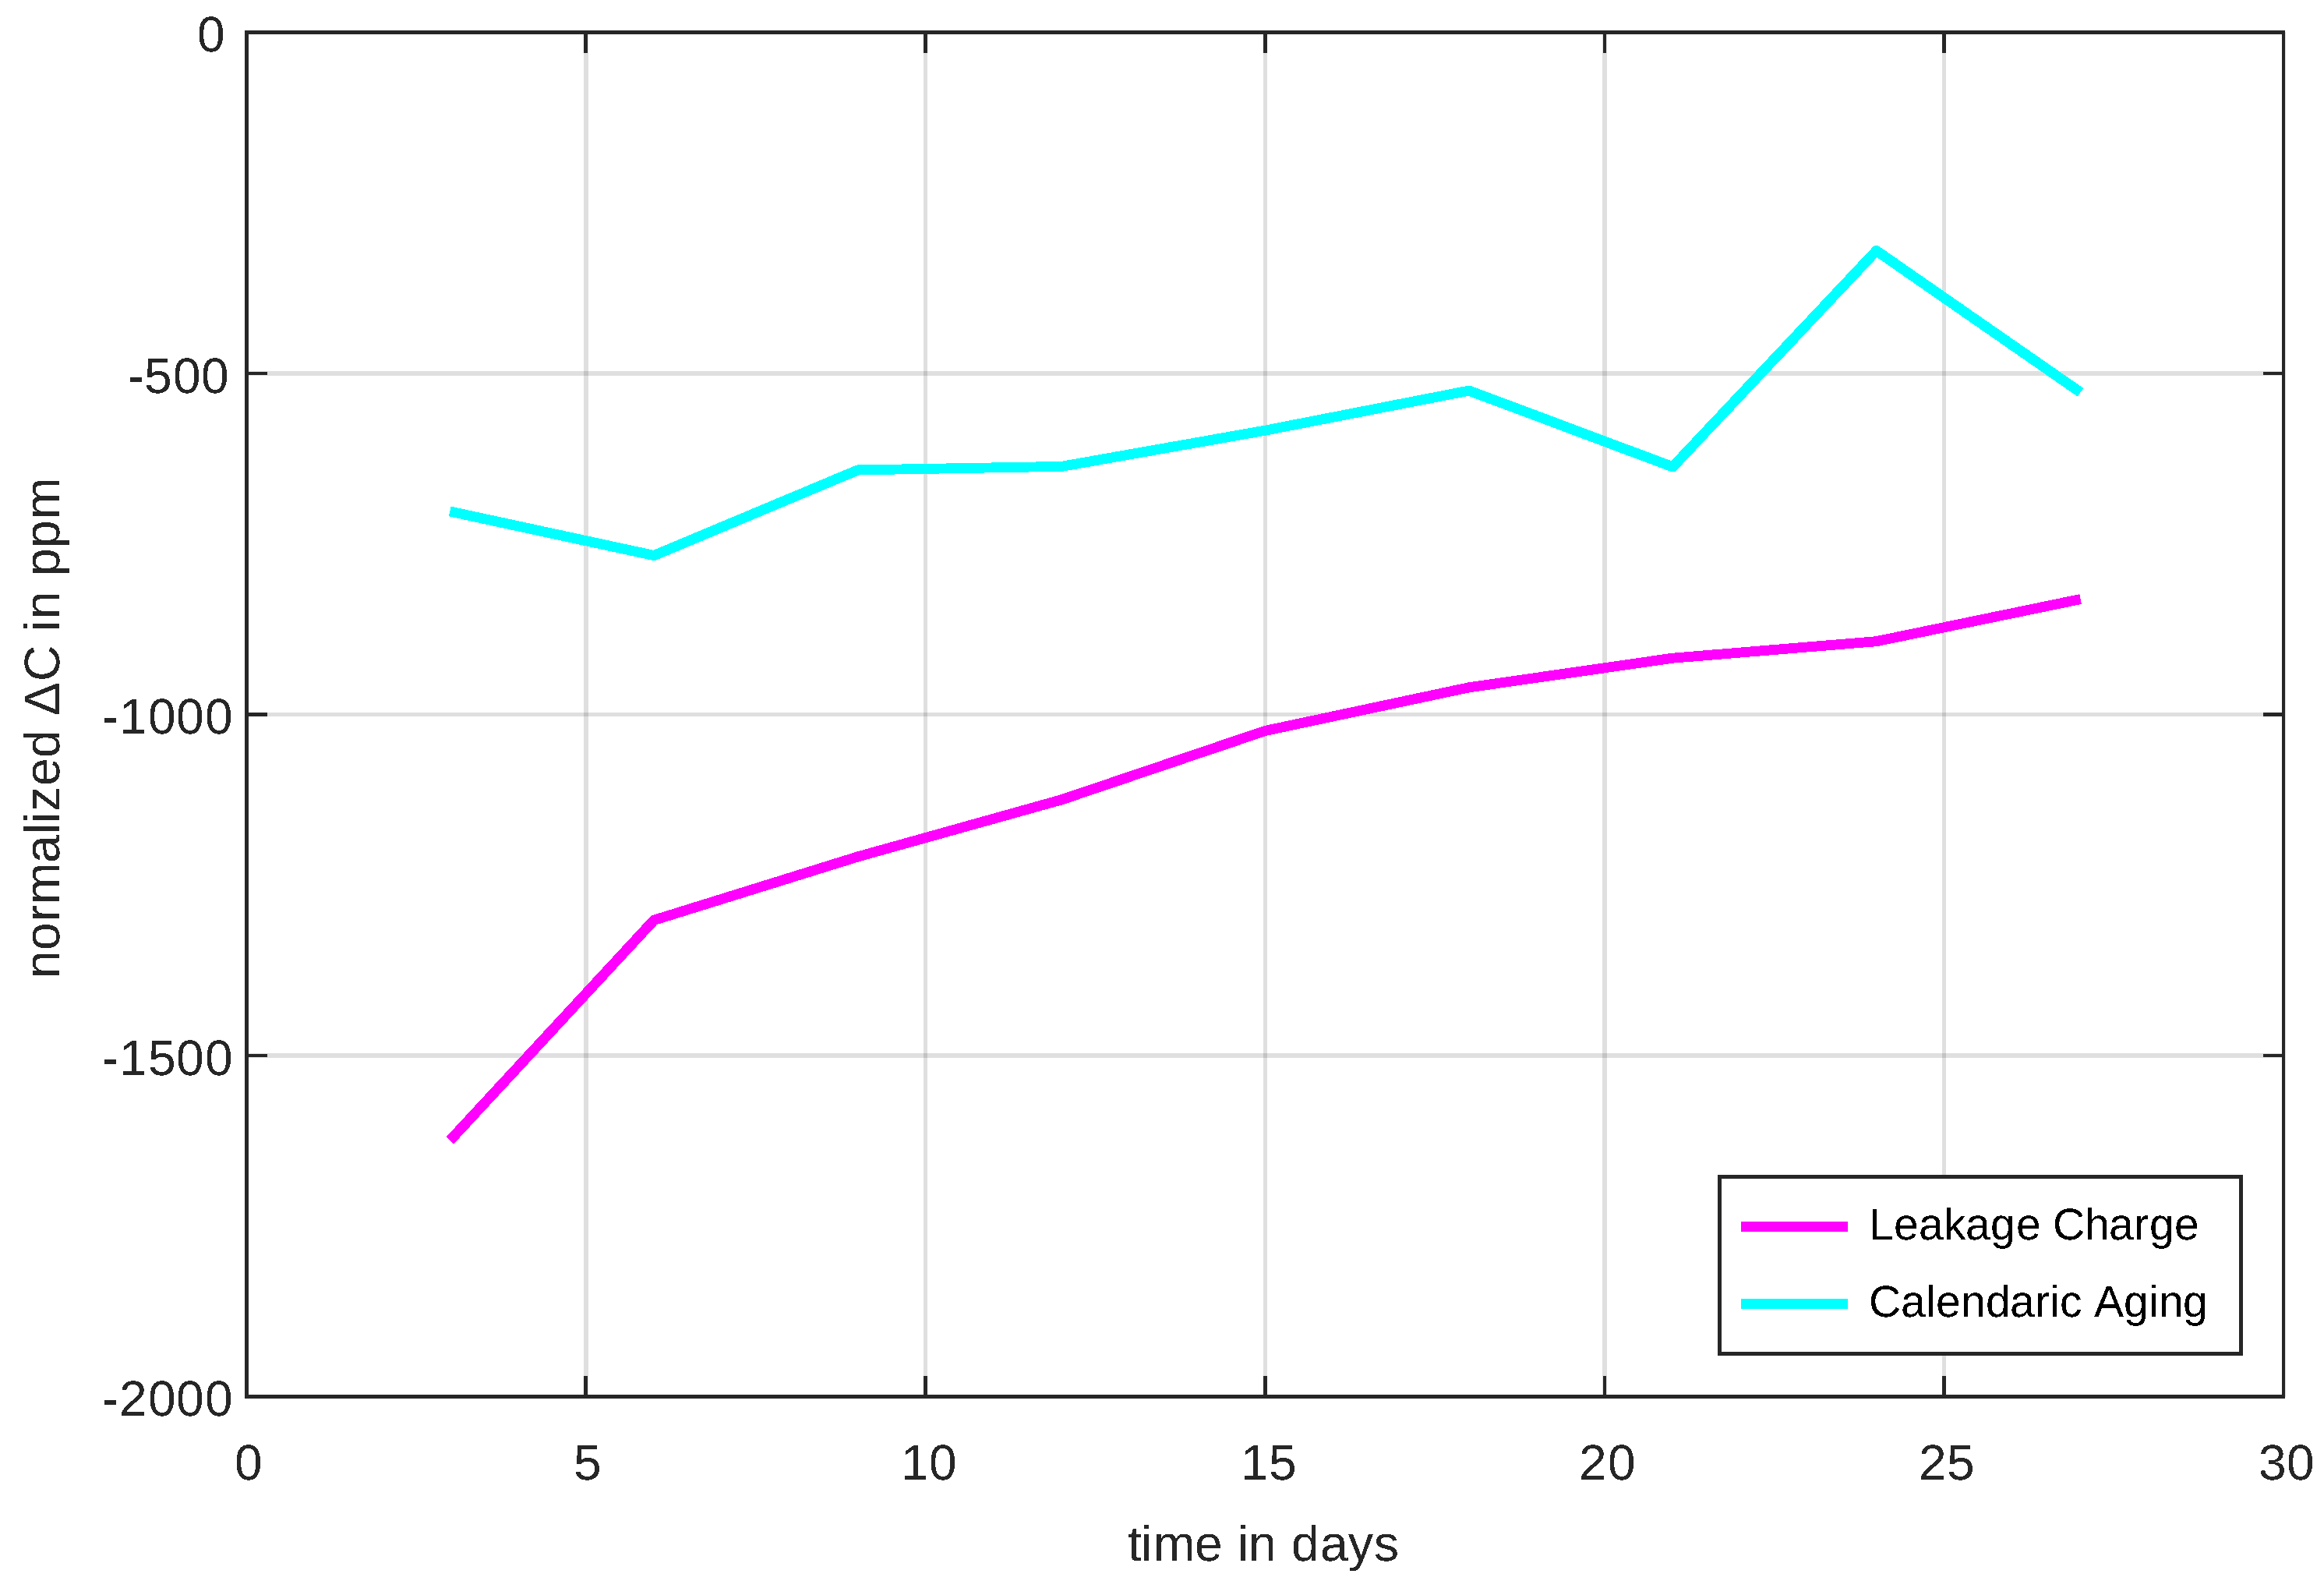
Because it was previously shown that no cycle-related charge capacity loss occurs when cycling with the C/x-scheme, it is assumed that this is also the case with the high-SoC-scheme. Accordingly, the inclinations of the green curve from Figure 16 can only be caused by a leakage current which accumulates over the charging time to the leakage charge. Therefore, the resulting leakage charge can be calculated by measuring the height of the inclinations from Figure 16 as shown in Figure 15, and the results are shown in Figure 17. However, since calendrical aging and leakage charge do not depend on the numbers of cycles but rather on time, their time dependent rate (time derivative or ) is displayed in Figure 17.
It is evident that both leakage rate and calendrical aging rate are not constant but change over time. The calendrical aging decreases by one third over the measurement period and the leakage current by half. It is not yet foreseeable that the rates of change would settle to a constant value. This is an indicator that, even after four weeks of measurement, processes in the cells have not fully settled. However, it is positive that the calendrical aging and leakage current rate obviously decrease with advancing time.
4. Conclusions
In this paper, it was shown how high-precision capacity measurements of Lithium ion cells can be used to determine cell aging from cycle to cycle. Initially, the high temperature stability, high drift stability and low noise of the measurement system was demonstrated, suggesting that it is possible to determine even the smallest capacity changes between individual cycles. Subsequently, the cycle aging, calendrical aging and leakage charge of LG INR18650 MJ1 cells are determined for different cycling schemes. The main difference between the cycling schemes is that the cycling current (C/4, C/12 and C/36) and the average SoC (50%, 100%) are varied. For this particular cell, cycle aging is dominant in all cases and calendrical aging and leakage charge only become problematic at a high state of charges. Furthermore, it was shown that, by observing the cell from cycle to cycle, it is recognized early on that the aging rates vary significantly over cycles and time.
Author Contributions
Conceptualization, D.S., B.S. and H.W.; methodology, D.S. and B.S.; writing—original draft preparation, D.S.; writing—review and editing, B.S., M.N. and H.W.; visualization, D.S.; supervision, H.W.; project administration, H.W.; funding acquisition, H.W., B.S. and M.N. All authors have read and agreed to the published version of the manuscript.
Funding
The financial support by the Austrian Federal Ministry for Digital and Economic Affairs, the National Foundation for Research, Technology and Development, and the Christian Doppler Research Association are gratefully acknowledged.
Data Availability Statement
Not applicable.
Acknowledgments
Open Access Funding by the Graz University of Technology.
Conflicts of Interest
The authors declare no conflict of interest.
References
- Ralon, P.; Taylor, M.; Diaz-Bone, A.I.H.; Kairies, K.P. Electricity Storage and Renewables: Costs and Markets to 2030; Technical Report; International Renewable Energy Agency: Masdar City, United Arab Emirates, 2017. [Google Scholar]
- Arshad, F.; Lin, J.; Manurkar, N.; Fan, E.; Ahmad, A.; un Nisa Tariq, M.; Wu, F.; Chen, R.; Li, L. Life Cycle Assessment of Lithium-ion Batteries: A Critical Review. Resour. Conserv. Recycl. 2022, 180, 106164. [Google Scholar] [CrossRef]
- Grey, C.P.; Hall, D.S. Prospects for lithium-ion batteries and beyond—A 2030 vision. Nat. Commun. 2020, 11, 6279. [Google Scholar] [CrossRef] [PubMed]
- Ma, S.; Jiang, M.; Tao, P.; Song, C.; Wu, J.; Wang, J.; Deng, T.; Shang, W. Temperature effect and thermal impact in lithium-ion batteries: A review. Prog. Nat. Sci. Mater. Int. 2018, 28, 653–666. [Google Scholar] [CrossRef]
- Myung, S.T.; Izumi, K.; Komaba, S.; Sun, Y.K.; Yashiro, H.; Kumagai, N. Role of Alumina Coating on Li-Ni-Co-Mn-O Particles as Positive Electrode Material for Lithium-Ion Batteries. Chem. Mater. 2005, 17, 3695–3704. [Google Scholar] [CrossRef]
- Redondo-Iglesias, E.; Venet, P.; Pelissier, S. Calendar and cycling ageing combination of batteries in electric vehicles. Microelectron. Reliab. 2018, 88–90, 1212–1215. [Google Scholar] [CrossRef] [Green Version]
- Yin, T.; Jia, L.; Li, X.; Zheng, L.; Dai, Z. Effect of High-Rate Cycle Aging and Over-Discharge on NCM811 (LiNi0.8Co0.1Mn0.1O2) Batteries. Energies 2022, 15, 2862. [Google Scholar] [CrossRef]
- Barcellona, S.; Piegari, L. Effect of current on cycle aging of lithium ion batteries. J. Energy Storage 2020, 29, 101310. [Google Scholar] [CrossRef]
- Li, L.J.; Li, X.H.; Wang, Z.X.; Guo, H.J.; Yue, P.; Wei, C.; Ling, W. Synthesis, structural and electrochemical properties of LiNi0.79Co0.1Mn0.1Cr0.01O2 via fast co-precipitation. J. Alloys Compd. 2010, 507, 172–177. [Google Scholar] [CrossRef]
- Ecker, M.; Sabet, P.S.; Sauer, D.U. Influence of operational condition on lithium plating for commercial lithium-ion batteries—Electrochemical experiments and post-mortem-analysis. Appl. Energy 2017, 206, 934–946. [Google Scholar] [CrossRef]
- Smith, A.J.; Burns, J.C.; Xiong, D.; Dahn, J.R. Interpreting High Precision Coulometry Results on Li-ion Cells. J. Electrochem. Soc. 2011, 158, A1136–A1142. [Google Scholar] [CrossRef]
- Smith, A.J.; Burns, J.C.; Dahn, J.R. A High Precision Study of the Coulombic Efficiency of Li-Ion Batteries. Electrochem.-Solid-State Lett. 2010, 13, A177. [Google Scholar] [CrossRef]
- Kassem, M.; Bernard, J.; Revel, R.; Pélissier, S.; Duclaud, F.; Delacourt, C. Calendar aging of a graphite/LiFePO4 cell. J. Power Sources 2012, 208, 296–305. [Google Scholar] [CrossRef] [Green Version]
- Broussely, M.; Biensan, P.; Bonhomme, F.; Blanchard, P.; Herreyre, S.; Nechev, K.; Staniewicz, R. Main aging mechanisms in Li ion batteries. J. Power Sources 2005, 146, 90–96. [Google Scholar] [CrossRef]
- Kalaga, K.; Rodrigues, M.T.F.; Trask, S.E.; Shkrob, I.A.; Abraham, D.P. Calendar-life versus cycle-life aging of lithium-ion cells with silicon-graphite composite electrodes. Electrochim. Acta 2018, 280, 221–228. [Google Scholar] [CrossRef]
- Keil, P.; Schuster, S.F.; Wilhelm, J.; Travi, J.; Hauser, A.; Karl, R.C.; Jossen, A. Calendar Aging of Lithium-Ion Batteries. J. Electrochem. Soc. 2016, 163, A1872–A1880. [Google Scholar] [CrossRef]
- Gyenes, B.; Stevens, D.A.; Chevrier, V.L.; Dahn, J.R. Understanding Anomalous Behavior in Coulombic Efficiency Measurements on Li-Ion Batteries. J. Electrochem. Soc. 2014, 162, A278–A283. [Google Scholar] [CrossRef]
- Smith, A.J.; Burns, J.C.; Trussler, S.; Dahn, J.R. Precision Measurements of the Coulombic Efficiency of Lithium-Ion Batteries and of Electrode Materials for Lithium-Ion Batteries. J. Electrochem. Soc. 2010, 157, A196. [Google Scholar] [CrossRef]
- Burns, J.C.; Kassam, A.; Sinha, N.N.; Downie, L.E.; Solnickova, L.; Way, B.M.; Dahn, J.R. Predicting and Extending the Lifetime of Li-Ion Batteries. J. Electrochem. Soc. 2013, 160, A1451–A1456. [Google Scholar] [CrossRef]
- Yang, F.; Wang, D.; Zhao, Y.; Tsui, K.L.; Bae, S.J. A study of the relationship between coulombic efficiency and capacity degradation of commercial lithium-ion batteries. Energy 2018, 145, 486–495. [Google Scholar] [CrossRef]
- Xia, J.; Ma, L.; Dahn, J. Improving the long-term cycling performance of lithium-ion batteries at elevated temperature with electrolyte additives. J. Power Sources 2015, 287, 377–385. [Google Scholar] [CrossRef]
- Bond, T.M.; Burns, J.C.; Stevens, D.A.; Dahn, H.M.; Dahn, J.R. Improving Precision and Accuracy in Coulombic Efficiency Measurements of Li-Ion Batteries. J. Electrochem. Soc. 2013, 160, A521–A527. [Google Scholar] [CrossRef]
- Smith, A.J.; Burns, J.C.; Dahn, J.R. High-Precision Differential Capacity Analysis of LiMn2O4/graphite Cells. Electrochem.-Solid-State Lett. 2011, 14, A39–A41. [Google Scholar] [CrossRef]
- Harlow, J.E.; Stevens, D.A.; Burns, J.C.; Reimers, J.N.; Dahn, J.R. Ultra High Precision Study on High Capacity Cells for Large Scale Automotive Application. J. Electrochem. Soc. 2013, 160, A2306–A2310. [Google Scholar] [CrossRef]
- Müller, D.; Dufaux, T.; Birke, K.P. Model-Based Investigation of Porosity Profiles in Graphite Anodes Regarding Sudden-Death and Second-Life of Lithium Ion Cells. Batteries 2019, 5, 49. [Google Scholar] [CrossRef] [Green Version]
- Klein, S.; Bärmann, P.; Stolz, L.; Borzutzki, K.; Schmiegel, J.P.; Börner, M.; Winter, M.; Placke, T.; Kasnatscheew, J. Demonstrating Apparently Inconspicuous but Sensitive Impacts on the Rollover Failure of Lithium-Ion Batteries at a High Voltage. ACS Appl. Mater. Interfaces 2021, 13, 57241–57251. [Google Scholar] [CrossRef] [PubMed]
- Schürholz, D.; Schweighofer, B.; Neumayer, M.; Klug, A.; Teichmann, R.; Wegleiter, H. Investigation of Accuracy Requirements for Delta Differential Capacity and Voltage Measurements of Li-Ion Batteries. In Proceedings of the 2022 IEEE International Instrumentation and Measurement Technology Conference (I2MTC), Ottawa, ON, Canada, 16–19 May 2022. [Google Scholar] [CrossRef]
- Smith, A.J.; Dahn, J.R. Delta Differential Capacity Analysis. J. Electrochem. Soc. 2012, 159, A290–A293. [Google Scholar] [CrossRef]
- Inui, Y.; Hirayama, S.; Tanaka, T. Temperature dependence of impedance spectrum of charge-transfer processes in lithium-ion batteries with nickel-manganese-cobalt cathode and graphite anode. J. Energy Storage 2021, 44, 103390. [Google Scholar] [CrossRef]
- Farmann, A.; Sauer, D.U. A study on the dependency of the open-circuit voltage on temperature and actual aging state of lithium-ion batteries. J. Power Sources 2017, 347, 1–13. [Google Scholar] [CrossRef]
- Mao, Z.; Farkhondeh, M.; Pritzker, M.; Fowler, M.; Chen, Z. Calendar Aging and Gas Generation in Commercial Graphite/NMC-LMO Lithium-Ion Pouch Cell. J. Electrochem. Soc. 2017, 164, A3469–A3483. [Google Scholar] [CrossRef]
- Smith, A.J.; Burns, J.C.; Zhao, X.; Xiong, D.; Dahn, J.R. A High Precision Coulometry Study of the SEI Growth in Li/Graphite Cells. J. Electrochem. Soc. 2011, 158, A447. [Google Scholar] [CrossRef]
Figure 1.
The four cyclers and cells under test are exposed to a circulating air stream, which is temperature controlled. A temperature sensor is attached to each cell.
Figure 1.
The four cyclers and cells under test are exposed to a circulating air stream, which is temperature controlled. A temperature sensor is attached to each cell.

Figure 2.
Schematic measurement setup: Cycler and cell are located in a temperature-stabilized box. The cell is measured using four-wire sensing to ensure good measurement precision. The cycler is controlled by a PC, so that measurement programs can be adapted and performed as desired.
Figure 2.
Schematic measurement setup: Cycler and cell are located in a temperature-stabilized box. The cell is measured using four-wire sensing to ensure good measurement precision. The cycler is controlled by a PC, so that measurement programs can be adapted and performed as desired.

Figure 3.
Temperature of the measurement hardware components (top) and cell temperature (bottom).

Figure 4.
Current Drift over 24 h. The current samples were averaged over one minute. The current drift is approximately 1.5 ppm in 24 h.
Figure 4.
Current Drift over 24 h. The current samples were averaged over one minute. The current drift is approximately 1.5 ppm in 24 h.

Figure 5.
Reference measurement shows capacity decrease observed over the measurement cycles. For this purpose, an LG INR18650 MJ1 cell was cycled with C/4 at 40 °C ambient temperature.
Figure 5.
Reference measurement shows capacity decrease observed over the measurement cycles. For this purpose, an LG INR18650 MJ1 cell was cycled with C/4 at 40 °C ambient temperature.

Figure 6.
Difference between single capacity measurements observed over the measurement cycles. For this purpose, an LG INR18650 MJ1 cell was cycled with C/4 at 40 °C ambient temperature. An 8th order polynomial was approximated to the measured data to calculate the noise component, which is shown in Figure 7.

Figure 7.
Noise of the delta capacity measurement of Figure 6.
Figure 7.
Noise of the delta capacity measurement of Figure 6.

Figure 8.
Operating the cell with the C/x-scheme means that it is charged with a constant current between the lower and upper terminal voltage. stands for the approximate duration of a charging or discharging process (the exact time varies with decreasing cell capacity because the cycling current stays constant).

Figure 9.
Cycling scheme with open circuit holding period at 100% SoC (“high-SoC-scheme”) to find out calendrical aging and leakage charge at a high state of charge in contrast to the C/x-scheme which always has an average state-of-charge of 50%.
Figure 9.
Cycling scheme with open circuit holding period at 100% SoC (“high-SoC-scheme”) to find out calendrical aging and leakage charge at a high state of charge in contrast to the C/x-scheme which always has an average state-of-charge of 50%.

Figure 10.
Breakdown of capacity degradation into its individual components: discharge capacity loss, charge capacity loss and leakage charge.
Figure 10.
Breakdown of capacity degradation into its individual components: discharge capacity loss, charge capacity loss and leakage charge.

Figure 11.
Normalized capacity decrease observed over the measurement time. For this purpose, an LG INR18650 MJ1 cell was cycled with C/4, C/12 and C/36 at 40 °C ambient temperature.
Figure 11.
Normalized capacity decrease observed over the measurement time. For this purpose, an LG INR18650 MJ1 cell was cycled with C/4, C/12 and C/36 at 40 °C ambient temperature.

Figure 12.
Normalized capacity decrease observed over the number of cycles. For this purpose, an LG INR18650 MJ1 cell was cycled with C/4, C/12 and C/36 at 40 °C ambient temperature.
Figure 12.
Normalized capacity decrease observed over the number of cycles. For this purpose, an LG INR18650 MJ1 cell was cycled with C/4, C/12 and C/36 at 40 °C ambient temperature.

Figure 13.
Capacity degradation at cycling current C/4, C/12 and C/36 at 40 °C. This capacity degradation in the C/x-schemes corresponds to the cycle aging of the cells. Because all aging rates are approximately equal at given cycle, it is concluded that the cells have a more or less current-independent cycle aging rate (at least for the selected magnitude of the cycling currents).

Figure 14.
Capacity degradation for the C/x-scheme measurements with a cycling current C/4, C/12 and C/36 and high-SoC-scheme at 40 °C. With the C/x-schemes, almost no leakage charge or charge cycling losses occur. The high-SoC-scheme degrades faster than the C/x-schemes indicating significant calendrical aging and also has a significant amount of leakage charge.

Figure 15.
Here, two charging cycles of the C/x-scheme are compared in terms of leakage charge and charge capacity loss. For different C/x-cycling-schemes, the degradation during charging is the same for different cycling rates at the same cycle. However, the leakage charge increases with the measurement time.

Figure 16.
The blue and green curves show the capacity degradation of the C/4-measurement and the high-SoC-scheme-measurement. The cyan-colored area marks the difference between C/x-scheme and high-SoC-scheme due to the calendrical aging of the high-SoC-scheme. The cyan dashed line represents the calendrical aging rate alone. It is legitimate to compare the high-SoC-scheme with the C/4 measurement of the C/x-scheme, as no calendrical aging occurred in the C/x-scheme measurements anyway, as shown in Section 3.3.

Figure 17.
Calendrical aging and leakage current charge losses for the high-SoC-scheme plotted over the measurement time. It can be seen that these rates also change significantly over time.
Figure 17.
Calendrical aging and leakage current charge losses for the high-SoC-scheme plotted over the measurement time. It can be seen that these rates also change significantly over time.

Publisher’s Note: MDPI stays neutral with regard to jurisdictional claims in published maps and institutional affiliations. |
© 2022 by the authors. Licensee MDPI, Basel, Switzerland. This article is an open access article distributed under the terms and conditions of the Creative Commons Attribution (CC BY) license (https://creativecommons.org/licenses/by/4.0/).
Share and Cite
MDPI and ACS Style
Schürholz, D.; Schweighofer, B.; Neumayer, M.; Wegleiter, H. Determination of Cycle to Cycle Battery Cell Degradation with High-Precision Measurements. Appl. Sci. 2022, 12, 11876. https://doi.org/10.3390/app122311876
AMA Style
Schürholz D, Schweighofer B, Neumayer M, Wegleiter H. Determination of Cycle to Cycle Battery Cell Degradation with High-Precision Measurements. Applied Sciences. 2022; 12(23):11876. https://doi.org/10.3390/app122311876
Chicago/Turabian StyleSchürholz, Daniel, Bernhard Schweighofer, Markus Neumayer, and Hannes Wegleiter. 2022. "Determination of Cycle to Cycle Battery Cell Degradation with High-Precision Measurements" Applied Sciences 12, no. 23: 11876. https://doi.org/10.3390/app122311876
Note that from the first issue of 2016, this journal uses article numbers instead of page numbers. See further details here.