
Hydrophobic Antiwetting of Aquatic UAVs: Static and Dynamic Experiment and Simulation

1
Advanced Materials Industry Institute, Guangxi Academy of Sciences, Nanning 530007, China
2
Key Laboratory of Bionic Engineering (Ministry of Education), Jilin University, Changchun 130022, China
3
Weihai Institute for Bionics, Jilin University, Weihai 264200, China
*
Authors to whom correspondence should be addressed.
Appl. Sci. 2022, 12(15), 7626; https://doi.org/10.3390/app12157626
Submission received: 27 June 2022
/
Revised: 24 July 2022
/
Accepted: 26 July 2022
/
Published: 28 July 2022
(This article belongs to the Special Issue Bionic Design and Manufacturing of Innovative Aircraft)
Abstract
:The adhesion of water to the surfaces of unmanned aerial vehicles (UAVs) adversely affects the function. The proposed UAVs will have underwater as well as flight capability, and these aquatic UAVs must shed water to resume flight. The efficient separation of the adhering water from aquatic-UAV surfaces is a challenging problem; we investigated the application of hydrophobic surfaces as a potential solution. Using aquatic-UAV models, one with hydrophilic surfaces and the other with superhydrophobic anisotropic textured surfaces, the antiwetting mechanism of the hydrophobic surfaces was investigated using a simulated-precipitation system and instrumentation to measure the load of the water adhering to the aquatic UAV, and to measure the impact energies. When the model was stationary (passive antiwetting), no adhesion occurred on the superhydrophobic surfaces, while continuous asymmetric thick liquid films were observed on the hydrophilic surfaces. The superhydrophobic surfaces reduced the rain loading by 87.5%. The vibration and movement of the model (dynamic antiwetting, simulating flight motions) accelerated the separation process and reduced the contact time. The observed results were augmented by the use of computational fluid dynamics with lattice Boltzmann methods (LBM) to analyze the particle traces inside the droplets, the liquid phase velocity-field and pressure-field strengths, and the backward bouncing behavior of the derived droplet group induced by the moving surface. The synergy between the superhydrophobic surfaces and the kinetic energy of the droplets promotes the breakup of drops, which avoids the significant lateral unbalance observed with hydrophilic surfaces during simulated flight.
Keywords:
aircraft; UAV; aquatic UAV; hydrophobic; superhydrophobic; hydrophilic; lattice Boltzmann; antiwetting; rain1. Introduction
Over a twenty-year period, 40% of all weather-related aircraft accidents that involved U.S. airlines were related to rainfall, which is more than the share of accidents attributed to wind shear and turbulence [1], and the majority occurred during takeoff and landing. It has historically been difficult to explore the impact of rain-induced penalties on the flight performance, and to develop countermeasures; so far, there is no certain way to deal with the threat of extremely heavy rainfall to flight safety. For commercial aircraft, the safest procedure has been simple avoidance: not taking off, or flying at a distance, until the torrent passes.
Unlike heavy and powerful commercial and military aircraft, the aquatic UAV [2] has a small size, light mass, and low rotational inertia [3], and so it is more sensitive to the impact of precipitation and the drag force of adhering water; the adhesion of the liquid film has a more significant adverse effect on its flight in air and its exit from water [4,5]. Very few physical tests of aircraft in rain have been reported, and most of them are relatively outdated [6,7,8]. At present, the methods for evaluating the impact of precipitation on aircraft are mainly the real-world evaluation of the aircraft [9], model tests [10], and numerical simulations using computational fluid dynamics [11]. Testing with the actual aircraft is the closest to the actual situation in the natural environment, but factors such as high costs, environmental-variable interference, and safety risks limit this research method. A cost-saving yet accurate research method is to select a rationalized model, use it in physical precipitation experiments, and combine the results with numerical simulations.
If the rapid and efficient desorption of the adherent water from the surfaces of aquatic UAVs [2,12] can be achieved, then the negative flight effects from precipitation and adherent water can be reduced to low levels. Aquatic UAVs can enter the water, and they also require excellent dehydration capabilities; the solution for precipitation may be the same one that enables flight promptly after submersion, but there are few reports on how to actively reduce the water adhesion on the model after extended solid–liquid interaction. The aquatic UAV [13,14] is subject to rapid density changes and complex solid–liquid–gas phase transients that can impair the flight balance when transitioning from water to air.
The current micro aerial vehicles (MAVs) are limited in their application because they can only fly. Once the MAVs can be both underwater and in the air [15], they potentially have applications in search and rescue, expeditions, and even military reconnaissance. However, because an MAV has no high-power propulsion system, it must be designed to minimize drag under water and to be efficient upon returning to flight. The inability to rapidly and efficiently desorb the adherent water from surfaces is one of the main bottlenecks that is currently limiting the development of aquatic UAVs.
Unique biomimetic surfaces [16] can substantially reduce the adhesion of water. The water droplets on lotus leaves after rain are almost spherical, and they easily roll off, even at a very low inclination; this phenomenon is known as the “Lotus effect” [17]. To characterize the “lotus effect”, the static contact angle (θ) and roll-off angle (θs) should be considered simultaneously [18], and the superhydrophobic state is achieved when θ > 150° and θs < 10° [19]. The feathers of some small aquatic birds, such as kingfishers [20,21,22] and pigeons [23], also exhibit similar superhydrophobicity, which is not only due to the hydrophobicity of the feathers (θ as high as 160°), but also to the anisotropy [24,25]. There are essential differences in the mechanisms of the liquid repellency exhibited by superhydrophobic feathers and the “lotus effect”. The Cassie state is maintained due to the high critical wetting-pressure value on the feather, which means that the energy required to convert the Cassie state to a fully wet state is high [26,27], and thus can withstand greater hydrodynamic pressure and still maintain the superhydrophobic state. Given the dramatic wetting-control abilities of organisms such as lotuses and birds, researchers in this field expect that applying superhydrophobicity to aquatic-UAV surfaces will reduce the aerodynamic penalty induced by the adherence to water.
Here, the two aquatic-UAV models, with hydrophilic and superhydrophobic surfaces, were used for comparison, according to the biomimetic dynamic wetting control theory [28]. A torque sensor was used to measure the loading of the adhering water on the aquatic UAV; the adhering precipitation was provided by the simulated-precipitation system. The effect of the wettability of the aquatic-UAV surface on the antiwetting behavior was quantitatively analyzed in several trials, where the uniformly repeatable rain and quality instrumentation were critical factors in controlling the variability and obtaining valid useful data.
We investigated the passive antiwetting performance by weighing the model with the torque transducer, which allowed for the determination of the respectable performance mentioned above, where the application of superhydrophilicity reduced the water load by 87.5%. We investigated the dynamic antiwetting [29,30,31] performance and, in particular, the motions and trajectories of the adhering water, by shaking the model in a reliably repeatable pattern. We measured the contact time and motion details at selected shaking amplitudes and frequencies. The backward bouncing behavior of a single droplet and the directional bouncing tendency of the derived droplet group on the surface of the aquatic UAV were experimentally determined in these trials. The results from the subsequent LBM numerical simulations [32] explain the law of the wettability of the aquatic-UAV surface on the adhesion of multiple droplets in the moving state. We analyzed the particle traces inside the droplets, the velocity field, and the lateral pressure to reveal the mechanism of directional bounce; finally, we verified how the vibrating and moving model more quickly desorbed the incident water.
2. Materials and Methods
2.1. Fabrication and Characterization
The models of the aquatic UAV were fabricated via 3D-printing technology [33], using white photosensitive resin (Xiamen Jiecheng 3D Technology Co., Ltd., Xiamen, China). The dimensions of the aquatic-UAV model in the axial and spanwise directions are 103 mm and 99 mm, respectively. A textured microstructure was constructed on both models’ surfaces; its direction is perpendicular to the longitudinal axis of the model, and the grooves and ribs are equidistant. A 3D super-depth-of-field microscope (KEYENCE Co., Ltd., Osaka, Japan, VHX-6000) was used to characterize the surface microstructure, with a magnification of 100 (Figure 1c). The rib length, groove width, and groove depth on the surface of the aircraft are 100 μm, 70 μm, and 50 μm, respectively. Where the model has significant curvature, such as the head and fuselage, the textured structure is annular.
A contact-angle meter (DataPhysics Instruments OCA20, Filderstadt, Germany) characterized the static hydrophobicity using a single-droplet volume of 4 μL (diameter of about 3 mm) at an observation point on the airfoil. The surface with a textured microstructure has a contact angle of about 88° without modification, which is hydrophilic. To create the hydrophobic model, commercial coatings [34] were applied to one model (to the right in Figure 1a) to reduce the surface energy. The modified surface with a low-surface-energy coating has a contact angle of about 155° and a roll-off angle of 3°, which is an anisotropic superhydrophobic surface (see “S6. Superhydrophobicization and Characterization of Surfaces” in the Supplementary Material).
2.2. Devices and Analysis
2.2.1. Experimental Equipment Configuration and Analysis
A rigid “cantilever” structure [35] was used to transmit the weight and impact forces to the torque sensor. The lever length increases the delivered torque, improving the reliability of the measurements. The same cantilever was used to transmit the shaking motions to the model. The cantilever structure also distances other equipment from the rain field. The structure was designed as a hollow shell to minimize its mass and eliminate the potential impact on the measurements; the material is stiff, and so it transmits torque and driven vibrations without significant effects. The surface of the cantilever was also made superhydrophobic by the coating method described above. Through this connection, the torque sensor can directly measure the multidrop impact load (equivalent to torque). The measurement range of the miniature torque sensor is from 0 to 2 Nm, the sampling rate is 200 Hz, and the sensitivity is 1.5 ± 0.001 mV/V. It is connected to the computer through a signal amplifier, and the measured torque is calculated, converted, and written into the computer through the supporting software. The configuration of the cantilever in both its uses is shown in Figure 2.
A high-speed-camera system was designed to quantitatively capture images of the simulated precipitation as it interacted with the models. The small water pump with the adjustable flow has a lift of 5 m and a water-output range from 0 to 10 L/min. The water is filtered by a reverse-osmosis device, and the water outlet of the pump is connected to a transient flowmeter. The working range of the transient flowmeter is from 1 to 10 L/min, and the measurement accuracy is ±1%. By controlling the flowmeter to read 1.10 L/min, the water level in the sprinkler can be kept constant. The model was placed in the simulated-precipitation area; images were captured by the high-speed camera (Phantom v711, Vision Research, Inc., Wayne, NJ, USA), and the physical parameters (speed, vibration status, etc.) were determined by customized open-source image-processing software (ImageJ). The resolution of the images was 1280 × 800 pixels, the sampling rate was 3000 frames per second (fps), and the exposure time was 330 μs. All droplets were released from the same height. The diameter (D0) of the droplets was 4.2 mm, and the critical velocity (v0) of the impact was kept at 1.9 m/s.
Three experimental modes were selected: The first mode was to drive the aircraft with a stepping motor to keep it moving in a straight line at a constant speed of 0.3 m/s (Figure 2b). The second mode was to use resonant speakers to induce the vibration of the aircraft model, simulating the vibration generated by aircraft during flight (Figure 2c); the vibration in this mode was controlled by a computer and analyzed by the Fourier transform method [36] (see “S2. Vibration Control” in the Supplementary Material). The third mode had the model stationary in the rain field to obtain data for comparing the responses of the hydrophilic and superhydrophobic models.
2.2.2. Simulations
We comparatively simulated the moving model in the hydrophilic and superhydrophobic states. The numerical-simulation method of the antiwetting performance of the aquatic UAV was based on the LBM algorithm of the D3Q19 model [22,36] (see details in “S3. Simulation Setup and Analysis” in the Supplementary Material).
3. Results
3.1. Antiwetting Behavior of the Stationary Model
3.1.1. Droplets Impacting on Static Hydrophilic Model
The adhesive behavior of water is evident on the hydrophilic-model surface (Figure 3). It can be seen from the image of the partially enlarged area that, upon initialization (t = 0.00 ms), the surface of the model was in a dry state. A droplet spread rapidly after impacting the upper surface of the wing, and it reached the maximum spread at t = 52.33 ms. The large droplet size (D0 = 4.2 mm), high impact velocity (v0 = 1.9 m/s), and hydrophilic surface together led to the higher viscous force and lower retraction force of the droplet. After a period of time (t = 1125.63 ms), low-thickness liquid films appeared on the hydrophilic surface. The deposition of water on the hydrophilic surface was observed, and the droplet impingement caused the typical “crown splash” phenomenon [5,37] (t = 1758.95 ms), which showed that the liquid film here was remarkably thick. Over time, as more raindrops impinged on the surface of the model, these liquid films became markedly thicker and more continuous and asymmetrical (see more details in “Supporting Movie S1” in the Supplementary Material).
3.1.2. Promotion of Antiwetting by Static Superhydrophobic Surfaces
When immobile, the superhydrophobic surface can remain dry, unlike in models with hydrophilic surfaces. Due to the high droplet-impact velocity and superhydrophobic surface, the energy loss of the droplet is low. After impact, the droplet still has high kinetic energy, and the low-thickness liquid film can sputter many derived droplets during the retraction stage and then break away from the surface. No “crown splashes” [37,38,39] were observed (Figure 4a–c) (see details in “Supporting Movie S2” in the Supplementary Material).
The multiple-fusion process of droplets on superhydrophobic surfaces facilitates the derived droplet bounce-off. Theoretically, the behavior of a derived droplet is still dominated by inertia after detaching from the original droplet, and its energy (including kinetic energy and surface energy) must be much lower than that of the original droplet. After the droplet merges with the low-energy-derived droplet (from t = 1347.96 to 1355.29 ms), the internal energy is converted, the energy of the newly formed droplet is increased through the fusion phenomenon, and a larger high-energy droplet is formed (from t = 1366.63 to 1422.62 ms), which finally promotes the ejection of all the droplets (see details in Figure S4 in the Supplementary Material). The splitting and detachment behaviors of the droplets significantly reduce the loads caused by the droplet impact and adhesion, and there is no continuous wetting phenomenon on superhydrophobic surfaces. The torque peak measured by the torque sensor was 0.001 Nm, compared with having a hydrophilic surface (0.008 Nm peak torque), and so the superhydrophobicity reduced the sensor torque measurement by 87.5%, as shown in Figure 4d.
The “edge effect” of the droplet significantly affects the fluid-mass distribution within the droplet and accelerates the solid–liquid separation process (see Figure S5 in the Supplementary Material). For the droplet size D0 = 4.2 mm, the theoretical contact time [22] is ms. At t = 1754.28 ms, the liquid on the suspended side was the first to leave the surface, and it took 9.66 ms, which was 67% less than the theoretical contact time (tc). The remaining droplets on the surface were completely detached from the surface within 17.66 ms (t = 1762.28 ms), which was 40% less than the theoretical contact time (tc).
3.2. Antiwetting Properties of Models in Motion
3.2.1. Coupled Desorption Properties of Vibration and Wettability
We compared the downshifts of the measured vibration frequencies before and after the impact with successive droplets to evaluate the effect of the droplets adhering to the model surface. The initialization model at t = 1000 ms was selected for analysis. The red dotted line in Figure 5 is the wave crest during vibration, and the yellow dotted line is the wave trough. The images at each moment correspond to the tag numbers from ① to ④ in Figure 5, and the arrows in the figure indicate the direction in which the model is about to move.
Although the model is vibrating, continuous liquid films are observed on the hydrophilic surfaces (Figure 5a). When analysis begins (corresponding to the peak at ① in Figure 5a), the high-thickness liquid films have already existed on the surface and have overflowed to the lower surface. In about half a cycle, when t = 1010.00 ms, the device has reached its lowest point (corresponding to the trough labeled ② in Figure 5a). Even after about a one-half-cycle oscillation (corresponding to the portion from ③ to ④ in Figure 5a), the antiwetting ability of the hydrophilic surface is still at a low level, and the wetting on its surface does not change significantly. Theoretically, the natural frequency of the resonant-speaker system can be represented by the natural frequency (ω = (k/m)0.5) of the single-degree-of-freedom system. When the stiffness (k) is constant, the system mass (m) is inversely proportional to the natural frequency (ω). The theoretical output frequency of the resonant speaker is 60 Hz, the measured amplitude when the model is in a stable state is 0.3062 mm, and the measured frequency is 28 Hz, which is 53.3% lower than the theoretical output frequency (60 Hz). This shows that the adhering water on the hydrophilic surface increases the effective mass of the model, the vibration frequency is lowered, and the amplitude of the model oscillation is significantly lessened by the substantial thickness of the liquid film (see details in “Supporting Movie S3” in the Supplementary Material).
We found that the superhydrophobic surface has excellent antiwetting properties and maintains high antiwetting stability, compared with the model with a hydrophilic surface under vibration (Figure 5b). A large number of derived droplets are created in a full oscillation cycle, and they fall away in the next half cycle (corresponding to ③ to ④ in Figure 5b); as this process continues, the surface can maintain a long-term dry state (see details in “Supporting Movie S4” in the Supplementary Material). Through Fourier transform analysis, the measured amplitude of the model’s oscillation is 0.3294 mm, which is 7.0% (0.3062 mm) higher than the hydrophilic model, and the measured frequency is 52 Hz, which is only 13.3% lower than the theoretical resultant frequency of 60 Hz. This additionally shows that the negative effect of the continuous impact on the superhydrophobic surface is significantly reduced compared with the hydrophilic model. Many derived droplets are generated, and these droplets are accelerated and detached under the action of vibration, which greatly reduces the contact time, and their contribution to the model mass is not as significant as it is for the hydrophilic model.
3.2.2. Liquid Repellency of the Linearly Moving Aquatic UAV
A stepper motor was used to drive the hydrophilic model in a uniform linear motion (vs = 0.3 m/s), passing through the virtual-precipitation area, and the arrow indicates the vector direction (Figure 6a). At t = 583.98 ms, the device moved to the middle of the precipitation area, and obvious water adhesion was observed at the front of the model and at the leading edge of the wing. Due to the short residence time of the device in the precipitation area, only a few discontinuous liquid films were observed on the upper surface of the wing, where, as previously observed, continuous liquid films were prone to occur (the yellow dotted rectangular area in Figure 6a, t = 583.98 ms). Compared with the static state (Figure 3), the thickness of the liquid film on the surface was significantly reduced, and the attached water was mainly located at the junction of the curved surfaces and the upper surface of the wing. When the model was about to exit the field of view of the camera (t = 698.31 ms), only a small area of wetting was observed at its tail. This shows that the motion of the model slightly impairs the wetting, even on hydrophilic surfaces, which reduces the chance of it being continuously wetted (see details in “Supporting Movie S5” in the Supplementary Material).
The positive antiwetting behavior of the moving model with a superhydrophobic surface is shown in Figure 6b. At t = 143.66 ms, the impact point of the droplet was on the side of the front of the model (part of the easily wetted area), and the droplet spread and sputtered. After 258.99 ms (t = 402.65 ms), the model was in a nonwetted state, and the easily wetted area was still in a dry state. The difference from the hydrophilic model was that more derived droplets appeared behind the model (the dashed area of the yellow ellipse in Figure 6b). When t = 492.65 ms, the derived droplet had a significant backward-movement trend. In the final stage (t = 638.98 ms), the derived droplets moved backward to the tail of the model. The overall antiwetting of the model is excellent, and its superhydrophobic surface can always maintain a dry state (see details in “Supporting Movie S6” in the Supplementary Material).
3.3. Simulated Antiwetting Properties of Surfaces of Moving Models
The residual kinetic energy of the droplet after impacting the surface is significantly related to its ability to detach from the surface. If the kinetic energy stored by the droplet after impact is sufficient to drive it off, then the droplet can bounce off, whereas low-kinetic-energy droplets will cause pinning. As shown in the trapezoidal region in Figure 7a left, on the hydrophilic surface, excessive dissipation leads to the accumulation of the continuous liquid film. When the model is moving forward, the liquid film slides backward due to inertia. However, as seen in Figure 7a right, the liquid on the superhydrophobic surface has higher kinetic energy at t = 0.018 s. The superhydrophobic surface has a very low droplet-adhesion effect, and the high kinetic energy-derived droplet group moves backward on the surface. Compared with the hydrophilic surface, the derived droplet group on the superhydrophobic surface can maintain high kinetic energy continuously, maintain the directional bounce ability, and thus effectively avoid the repeated wetting of the same area (see the right trapezoid area in Figure 7a).
At the instant of impact, the kinetic energy of the liquid on the superhydrophobic surface increased significantly (the peak of the solid red line in Figure 7b). The rapid dissipation of the internal energy after the shock and the downward trend eventually stabilized. The mean velocity on the superhydrophobic surface was larger than that on the hydrophilic surface. At t = 0.027 s, the mean velocity on the superhydrophobic surface (0.43686 m/s) was 32% higher than that on the hydrophilic surface (0.29708 m/s). Therefore, on the superhydrophobic surface, after the fusion of the droplet group, the internal energy and surface energy were dissipated to a higher degree, so that the bouncing could be maintained.
The analysis of the mean pressure values showed that the liquid-pressure changes were gentle on the superhydrophobic surfaces, while those on the hydrophilic surfaces were more drastic (Figure 7c). At t = 0.054 s, the pressure of the liquid on the superhydrophobic surface (1734.57 Pa) was 43.33% higher than that on the hydrophilic surface (982.99 Pa), although the pressure on the superhydrophobic surface suddenly increased to 2589.57 Pa at t = 0.069 s. However, at this time, most of the liquid was already detached (see the right trapezoid area in Figure 7a), and the rapid increase in pressure had little effect on the flight stability of the superhydrophobic model.
The droplet fusion is obvious in the hydrophilic case, and continuous liquid film typically forms on the hydrophilic surface in the rain field. A continuous high-thickness liquid film can be observed on the hydrophilic surface of the model, and, when t = 0.081 s, a transient liquid-phase high-pressure region (the black-outlined rectangular area in Figure 8) can be observed. The movement of the model still cannot completely disperse the liquid film, and the liquid film in the high-pressure region is observed to overflow and detach, which is qualitatively similar to the result shown in Figure 6a. The multiple fusion of the liquid film on the hydrophilic surface exacerbates the asymmetry of the liquid film across the width of the model, which causes a large-scale nonuniform distribution of the lateral pressure (see details in “Supporting Movie S5” and ”Supporting Movie S7” in the Supplementary Material).
The droplets fall into three regions: the upper surface of the fuselage, and the wing on each side, shown by the red “Λ-shaped” dotted line in Figure 8. In these three regions, for the superhydrophilic model, the derived droplets appeared clearly spaced, and the interdrop distance gradually increased as time increased (from top to bottom in Figure 8). No large-scale continuous high-pressure liquid film was observed in any of the three regions, and the pressure distribution of the derived droplet population was relatively uniform. The derived droplets on the upper surfaces of the wings on both sides continued to merge and fragmented again to produce numerous derived droplets, which were then synchronously ejected to both sides of the wing. The lateral-pressure distribution of the fluids on the superhydrophobic surfaces was relatively uniform. In addition, the derived droplet groups on both sides can bounce laterally and symmetrically in blocks, which, in a moving state, helps maintain a uniform lateral distribution of drops, eliminating the lateral nonuniform loading of multiple droplets, as occurs on the hydrophilic model (the black rectangle of Figure 8).
4. Discussion
Effects of Surface Wettability and Motion on Liquid Adhesion and Bouncing Behavior
The traces of fluid particles [40] can reveal the intrinsic flow behavior of droplets. Traces can be obtained by numerical solution (computer simulation, see “S3. Simulation Setup and Analysis” in the Supplementary Material). The left and right sides of the center line in Figure 9 are the analysis results of models with hydrophilic and superhydrophobic surfaces, respectively. The tracking target is determined by a cube with a size of 10 mm × 10 mm × 0.3 mm, which contains the upper parts of nine droplets, with a total number of 199 particles (black dotted area in Figure 9 left). The motion range of droplet particles on hydrophilic surfaces is small, and, as can be seen from the analysis of the coordinates (Figure 9), most of the particles exhibit irregular slow outward-sliding behavior. In contrast, there is a regularity in the traces on the superhydrophobic surface, where the particles bounced in a direction and their traces were “parabolic”.
We use the z-axis and y-axis coordinates as examples to reveal the directional bounce behavior of droplets on superhydrophobic surfaces (Figure 10b). When the particle rebounds from the superhydrophobic surface for the first time, its z-coordinate-curve trend changes from falling to rising (the first inflection point). Due to the different projection angles of the droplet rebound, and to some droplets hitting the wall again, some particles show a rapid downward trend, while another portion of the particles rises again after the rapid drop due to the additional collision’s kinetic energy (the second inflection point in Figure 10b). The state of the y-axis coordinate means that the particles on the hydrophilic surface fluctuate randomly (Figure 10 left) due to the pinning of the water adhering to the hydrophilic surface, which is difficult to detach. Motion induces multiple droplets to bounce backward (Figure 10 right, while differences in the surface curvature lead to diverse bounce directions. On the superhydrophobic surface, the bouncing direction is opposite to the motion direction, which accelerates the solid–liquid separation process; the trace is parabolic, and the y-axis coordinate increases monotonically with time. We have been able to confirm that, when the surface is made superhydrophobic, the motion of the model promotes the directionality of the droplet bounce-off, and the wetting phenomenon in the same area is minimized. These findings provide a confirmatory reference for the potential application of superhydrophobic surfaces on aircrafts and, in particular, in the development of aquatic UAVs.
5. Conclusions
To evaluate the passive antiwetting performance of the aquatic-UAV model and verify its surface-based antiwetting performance using the properties of superhydrophilicity, we provided a quantitative simulated-precipitation system, and we inserted models of the aquatic UAV into the rain field by using a superhydrophobic cantilever to support the model and to connect it to a torque sensor and other instrumentation to evaluate the passive and dynamic antiwetting performance of the aquatic-UAV model with superhydrophobic surfaces to verify its surface-based antiwetting performance, and additionally, to compare the characteristics of an identical model with hydrophilic surfaces. We also performed numeric simulations and found the results to be similar to the experimental results. We conclude the following:
- (1)
- The “edge effect” produced by the superhydrophobic surface significantly affects the mass redistribution within the droplet, so that the time for the first detachment of the derived droplet is reduced by 67% compared with the theoretical contact time, and the time required for complete detachment from the surface is reduced by 40%;
- (2)
- Compared with models with hydrophilic surfaces, the superhydrophobicity of the surface enables an 87.5% reduction in precipitation loading, so that the model behaviors are almost unaffected by precipitation;
- (3)
- The superhydrophobic surface has an excellent antiwetting effect when combined with model vibration and forward motion; the motion reduces the surface-droplet adhesion, accelerates the solid–liquid separation, produces directional bounce, and maintains flight stability;
- (4)
- LBM numerical simulations show that, in forward motion, the lateral-pressure distribution of the fluid on a model with hydrophilic surfaces is uneven, which affects the lateral mechanical balance of the aquatic UAV. The lateral-pressure distribution of the fluid on the model with superhydrophobic surfaces is relatively uniform, which is beneficial in maintaining flight balance;
- (5)
- A rain droplet falling onto a hydrophilic surface loses kinetic energy, which diminishes its chance of separation. After falling onto a superhydrophobic substrate, rain droplets can still maintain a high level of kinetic energy, the average absolute velocity is increased by up to 32%, and the derived droplets have enough kinetic energy to quickly separate, with no inclination to pin or adsorb onto the surface. The details of the superhydrophobicity can affect the direction of bounce favorably toward the rear of the craft.
Supplementary Materials
The following supporting information can be downloaded at: https://www.mdpi.com/article/10.3390/app12157626/s1. References [5,20,34,41] are cited in the Supplementary Materials.
Author Contributions
C.Z. and Z.W. conceived the study. Z.H., Y.Z. and Z.W. conducted the experiments. Y.Z. performed the simulations. Y.Z. wrote the manuscript. All authors have read and agreed to the published version of the manuscript.
Funding
This study was supported by the National Key Research and Development Program of China (Grant No. 2018YFA0703300), the Guangxi Natural Science Foundation of China (Grant No. 2021GXNSFBA075053), the Doctoral Research Fund of Guangxi Academy of Sciences (Grant No. 2021YBJ702), and the National Natural Science Foundation of China (Grant No. 51875243).
Institutional Review Board Statement
Not applicable.
Informed Consent Statement
Not applicable.
Data Availability Statement
The data presented in this study are available upon request from the corresponding author.
Conflicts of Interest
The authors declare no conflict of interest.
References
- Rudich, R.D. Weather-Involved US Air Carrier Accidents 1962–1984. In Proceedings of the 24th Aerospace Sciences Meeting, Reno, NV, USA, 6–9 January 1986; Volume 86, p. 327. [Google Scholar]
- Siddall, R.; Kovač, M. Launching the AquaMAV: Bioinspired Design for Aerial-Aquatic Robotic Platforms. Bioinspir. Biomim. 2014, 9, 031001. [Google Scholar] [CrossRef] [PubMed]
- Ortega-Jimenez, V.M.; Dudley, R. Aerial Shaking Performance of Wet Anna’s Hummingbirds. J. R. Soc. Interface 2012, 9, 1093–1099. [Google Scholar] [CrossRef] [PubMed] [Green Version]
- Smyrnaios, D.N.; Pelekasis, N.A.; Tsamopoulos, J.A. Boundary Layer Flow of Air Past Solid Surfaces in the Presence of Rainfall. J. Fluid Mech. 2000, 425, 79–110. [Google Scholar] [CrossRef]
- Yarin, A.L.L. Drop impact dynamics: Splashing, Spreading, Receding, Bouncing. Annu. Rev. Fluid Mech. 2006, 38, 159–192. [Google Scholar] [CrossRef]
- Hansman, R.J.; Craig, A.P. Low Reynolds Number Tests of NACA 64-210, NACA 0012, and Wortmann FX67-K170 Airfoils in Rain. J. Aircr. 1987, 24, 559–566. [Google Scholar] [CrossRef]
- Ashenden, R.; Marwftzt, J.D. A Comparison of the Air Force Water Spray Tanker Artificial Drizzle Cloud Distributions to the Natural Environment. In Proceedings of the 34th Aerospace Sciences Meeting and Exhibit, Reno, NV, USA, 15–18 January 1996. [Google Scholar]
- Adams, K.J. The Air Force Flight Test Center artificial icing and rain testing capability. In Proceedings of the 2nd Flight Testing Conference, Las Vegas, NV, USA, 16–18 November 1983. [Google Scholar]
- Cao, Y.; Wu, Z.; Xu, Z. Effects of Rainfall on Aircraft Aerodynamics. Prog. Aerosp. Sci. 2014, 71, 85–127. [Google Scholar] [CrossRef]
- Bilanin, A.J. Scaling Laws for Testing Airfoils under Heavy Rainfall. J. Aircr. 1987, 24, 31–37. [Google Scholar] [CrossRef]
- Ismail, M.; Yihua, C.; Bakar, A.; Wu, Z. Aerodynamic Efficiency Study of 2D Airfoils and 3D Rectangular Wing in Heavy Rain via Two-Phase Flow Approach. Proc. Inst. Mech. Eng. Part G J. Aerosp. Eng. 2014, 228, 1141–1155. [Google Scholar] [CrossRef]
- Yang, X.; Wang, T.; Liang, J.; Yao, G.; Liu, M. Survey on the Novel Hybrid Aquatic-Aerial Amphibious Aircraft: Aquatic Unmanned Aerial Vehicle (AquaUAV). Prog. Aerosp. Sci. 2015, 74, 131–151. [Google Scholar] [CrossRef]
- Peloquin, R.A.; Thibault, D.; Desbiens, A.L. Design of a Passive Vertical Takeoff and Landing Aquatic UAV. IEEE Robot. Autom. Lett. 2017, 2, 381–388. [Google Scholar] [CrossRef]
- Hang, K.; Lyu, X.; Song, H.; Stork, J.A.; Dollar, A.M.; Kragic, D.; Zhang, F. Perching and Resting-A Paradigm for UAV Maneuvering with Modularized Landing Gears. Sci. Robot. 2019, 4, eaau6637. [Google Scholar] [CrossRef]
- Gao, A.; Techet, A.H. Design Considerations for a Robotic Flying Fish. In Ocean 2011; IEEE: Piscataway, NJ, USA, 2011; pp. 1–8. [Google Scholar]
- Vasileiou, T.; Gerber, J.; Prautzsch, J.; Schutzius, T.M.; Poulikakos, D. Superhydrophobicity Enhancement through Substrate Flexibility. Proc. Natl. Acad. Sci. USA 2016, 113, 13307–13312. [Google Scholar] [CrossRef] [Green Version]
- Jiang, L.; Zhao, Y.; Zhai, J. A Lotus-Leaf-like Superhydrophobic Surface: A Porous Microsphere/Nanofiber Composite Film Prepared by Electrohydrodynamics. Angew. Chem. 2004, 43, 4338–4341. [Google Scholar] [CrossRef]
- Marmur, A.; Della Volpe, C.; Siboni, S.; Amirfazli, A.; Drelich, J.W. Contact Angles and Wettability: Towards Common and Accurate Terminology. Surf. Innov. 2017, 5, 3–8. [Google Scholar] [CrossRef] [Green Version]
- Wang, D.; Sun, Q.; Hokkanen, M.J.; Zhang, C.; Lin, F.Y.; Liu, Q.; Zhu, S.P.; Zhou, T.; Chang, Q.; He, B.; et al. Design of Robust Superhydrophobic Surfaces. Nature 2020, 582, 55–59. [Google Scholar] [CrossRef]
- Zhang, C.; Zheng, Y.; Wu, Z.; Wang, J.; Shen, C.; Liu, Y.; Ren, L. Non-Wet Kingfisher Flying in the Rain: The Water-Repellent Mechanism of Elastic Feathers. J. Colloid Interface Sci. 2019, 541, 56–64. [Google Scholar] [CrossRef]
- Zhang, C.; Wu, Z.; Zhang, X.; Yue, Y.; Wang, J. Effect of Feather Elasticity of Kingfisher Wing on Droplet Impact Dynamics. J. Bionic Eng. 2018, 15, 731–740. [Google Scholar] [CrossRef]
- Zheng, Y.; Zhang, C.; Wang, J.; Yang, L.; Shen, C.; Han, Z.; Liu, Y. Nonwet Kingfisher Flying in the Rain: The Tumble of Droplets on Moving Oriented Anisotropic Superhydrophobic Substrates. ACS Appl. Mater. Interfaces 2020, 12, 35707–35715. [Google Scholar] [CrossRef]
- Bormashenko, E.; Bormashenko, Y.; Stein, T.; Whyman, G.; Bormashenko, E. Why Do Pigeon Feathers Repel Water? Hydrophobicity of Pennae, Cassie-Baxter Wetting Hypothesis and Cassie-Wenzel Capillarity-Induced Wetting Transition. J. Colloid Interface Sci. 2007, 311, 212–216. [Google Scholar] [CrossRef]
- Guo, C.; Zhao, D.; Sun, Y.; Wang, M.; Liu, Y. Droplet Impact on Anisotropic Superhydrophobic Surfaces. Langmuir 2018, 34, 3533–3540. [Google Scholar] [CrossRef]
- Han, J.; Ryu, S.; Kim, H.; Sen, P.; Choi, D.; Nam, Y.; Lee, C. Anisotropic Drop Spreading on Superhydrophobic Grates during Drop Impact. Soft Matter 2018, 14, 3760–3767. [Google Scholar] [CrossRef]
- Whyman, G.; Bormashenko, E. How to Make the Cassie Wetting State Stable? Langmuir 2011, 27, 8171–8176. [Google Scholar] [CrossRef]
- Bormashenko, E.; Gendelman, O.; Whyman, G. Superhydrophobicity of Lotus Leaves versus Birds Wings: Different Physical Mechanisms Leading to Similar Phenomena. Langmuir 2012, 28, 14992–14997. [Google Scholar] [CrossRef]
- Zheng, Y.-H.Y.H.; Zhang, C.-C.C.C.; Sun, J.-H.J.H. The Technology and Application of Bionic Dynamic Dehydration on the Surface. Surf. Technol. 2021, 50, 28–39, 50. [Google Scholar]
- Lin, Y.; Chen, H.; Wang, G.; Liu, A. Recent Progress in Preparation and Anti-Icing Applications of Superhydrophobic Coatings. Coatings 2018, 8, 208. [Google Scholar] [CrossRef] [Green Version]
- Song, M.; Hu, D.; Zheng, X.; Wang, L.; Yu, Z.; An, W.; Na, R.; Li, C.; Li, N.; Lu, Z.; et al. Enhancing Droplet Deposition on Wired and Curved Superhydrophobic Leaves. ACS Nano 2019, 13, 7966–7974. [Google Scholar] [CrossRef] [PubMed]
- Liu, H.; Wang, Y.; Huang, J.; Chen, Z.; Chen, G.; Lai, Y. Bioinspired Surfaces with Superamphiphobic Properties: Concepts, Synthesis, and Applications. Adv. Funct. Mater. 2018, 28, 1707415. [Google Scholar] [CrossRef]
- Strack, O.E.; Cook, B.K. Three-Dimensional Immersed Boundary Conditions for Moving Solids in the Lattice-Boltzmann Method. Int. J. Numer. Methods Fluids 2007, 55, 103–125. [Google Scholar] [CrossRef]
- Murr, L.E. Frontiers of 3D Printing/Additive Manufacturing: From Human Organs to Aircraft Fabrication. J. Mater. Sci. Technol. 2016, 32, 987–995. [Google Scholar] [CrossRef]
- Gupta, R.; Vaikuntanathan, V.; Sivakumar, D. Superhydrophobic Qualities of an Aluminum Surface Coated with Hydrophobic Solution NeverWet. Colloids Surf. A Physicochem. Eng. Asp. 2016, 500, 45–53. [Google Scholar] [CrossRef]
- Gart, S.; Mates, J.E.; Megaridis, C.M.; Jung, S. Droplet Impacting a Cantilever: A Leaf-Raindrop System. Phys. Rev. Appl. 2015, 3, 044019. [Google Scholar] [CrossRef] [Green Version]
- Zheng, Y.; Zhang, C.; Wang, J.; Liu, Y.; Shen, C.; Yang, J. Robust Adhesion of Droplets via Heterogeneous Dynamic Petal Effects. J. Colloid Interface Sci. 2019, 557, 737–745. [Google Scholar] [CrossRef]
- Che, Z.; Matar, O.K. Impact of Droplets on Liquid Films in the Presence of Surfactant. Langmuir 2017, 33, 12140–12148. [Google Scholar] [CrossRef]
- Che, Z.; Matar, O. Impact of Droplets on Immiscible Liquid Films. Soft Matter 2018, 14, 1540–1551. [Google Scholar] [CrossRef] [Green Version]
- Che, Z.; Deygas, A.; Matar, O.K. Impact of Droplets on Inclined Flowing Liquid Films. Phys. Rev. E 2015, 92, 023032. [Google Scholar] [CrossRef] [Green Version]
- Ismail, N.I.; Kuang, S.; Yu, A. CFD-DEM Study of Particle-Fluid Flow and Retention Performance of Sand Screen. Powder Technol. 2021, 378, 410–420. [Google Scholar] [CrossRef]
- Tosco, V.; Monterubbianesi, R.; Orilisi, G.; Procaccini, M.; Grandini, S.; Putignano, A.; Orsini, G. Effect of Four Different Finishing and Polishing Systems on Resin Composites: Roughness Surface and Gloss Retention Evaluations. Minerva Stomatol. 2019, 69, 207–214. [Google Scholar] [CrossRef]
Figure 1.
Surface texture and hydrophobicity characterizations of the models: (a) the 3D-printed models of aquatic UAV for comparative experiments; the insets indicate static wettability characterization of each model, indicating hydrophilic (θ = 88°) on the left, and superhydrophobic (θ = 155°, θS = 3°) on the right; (b,c) show the anisotropic structure of the surface, which promotes the directional flow of liquids, observed by ultra-depth-of-field microscopy; the yellow scale bar is 400 μm, and the magnification is 100.

Figure 2.
High-speed-camera system: (a) Settings for zones of simulated precipitation. The model is placed in a simulated-precipitation area, and the instantaneous flowmeter controls the size of the droplets to be consistent; the droplets fall vertically and hit the model. (b) Configuration of stepper motors. The model, cantilever beam, and linear stepping motor are connected; the model moving speed is 0.3 m/s. (c) Attachment of cantilever for resonant-speaker testing. The computer controls the vibration, driving selected frequencies through the power amplifier to the resonant speaker (see “S1. Devices and Analysis” and “S2. Vibration Control” in the Supplementary Material).

Figure 3.
A liquid film develops on the surface of the hydrophilic model as droplets fail to escape from the hydrophilic surface after impact; the crown phenomenon appears as the liquid film continues to accumulate (see more details in “Supporting Movie S1” in the Supplementary Material).
Figure 3.
A liquid film develops on the surface of the hydrophilic model as droplets fail to escape from the hydrophilic surface after impact; the crown phenomenon appears as the liquid film continues to accumulate (see more details in “Supporting Movie S1” in the Supplementary Material).
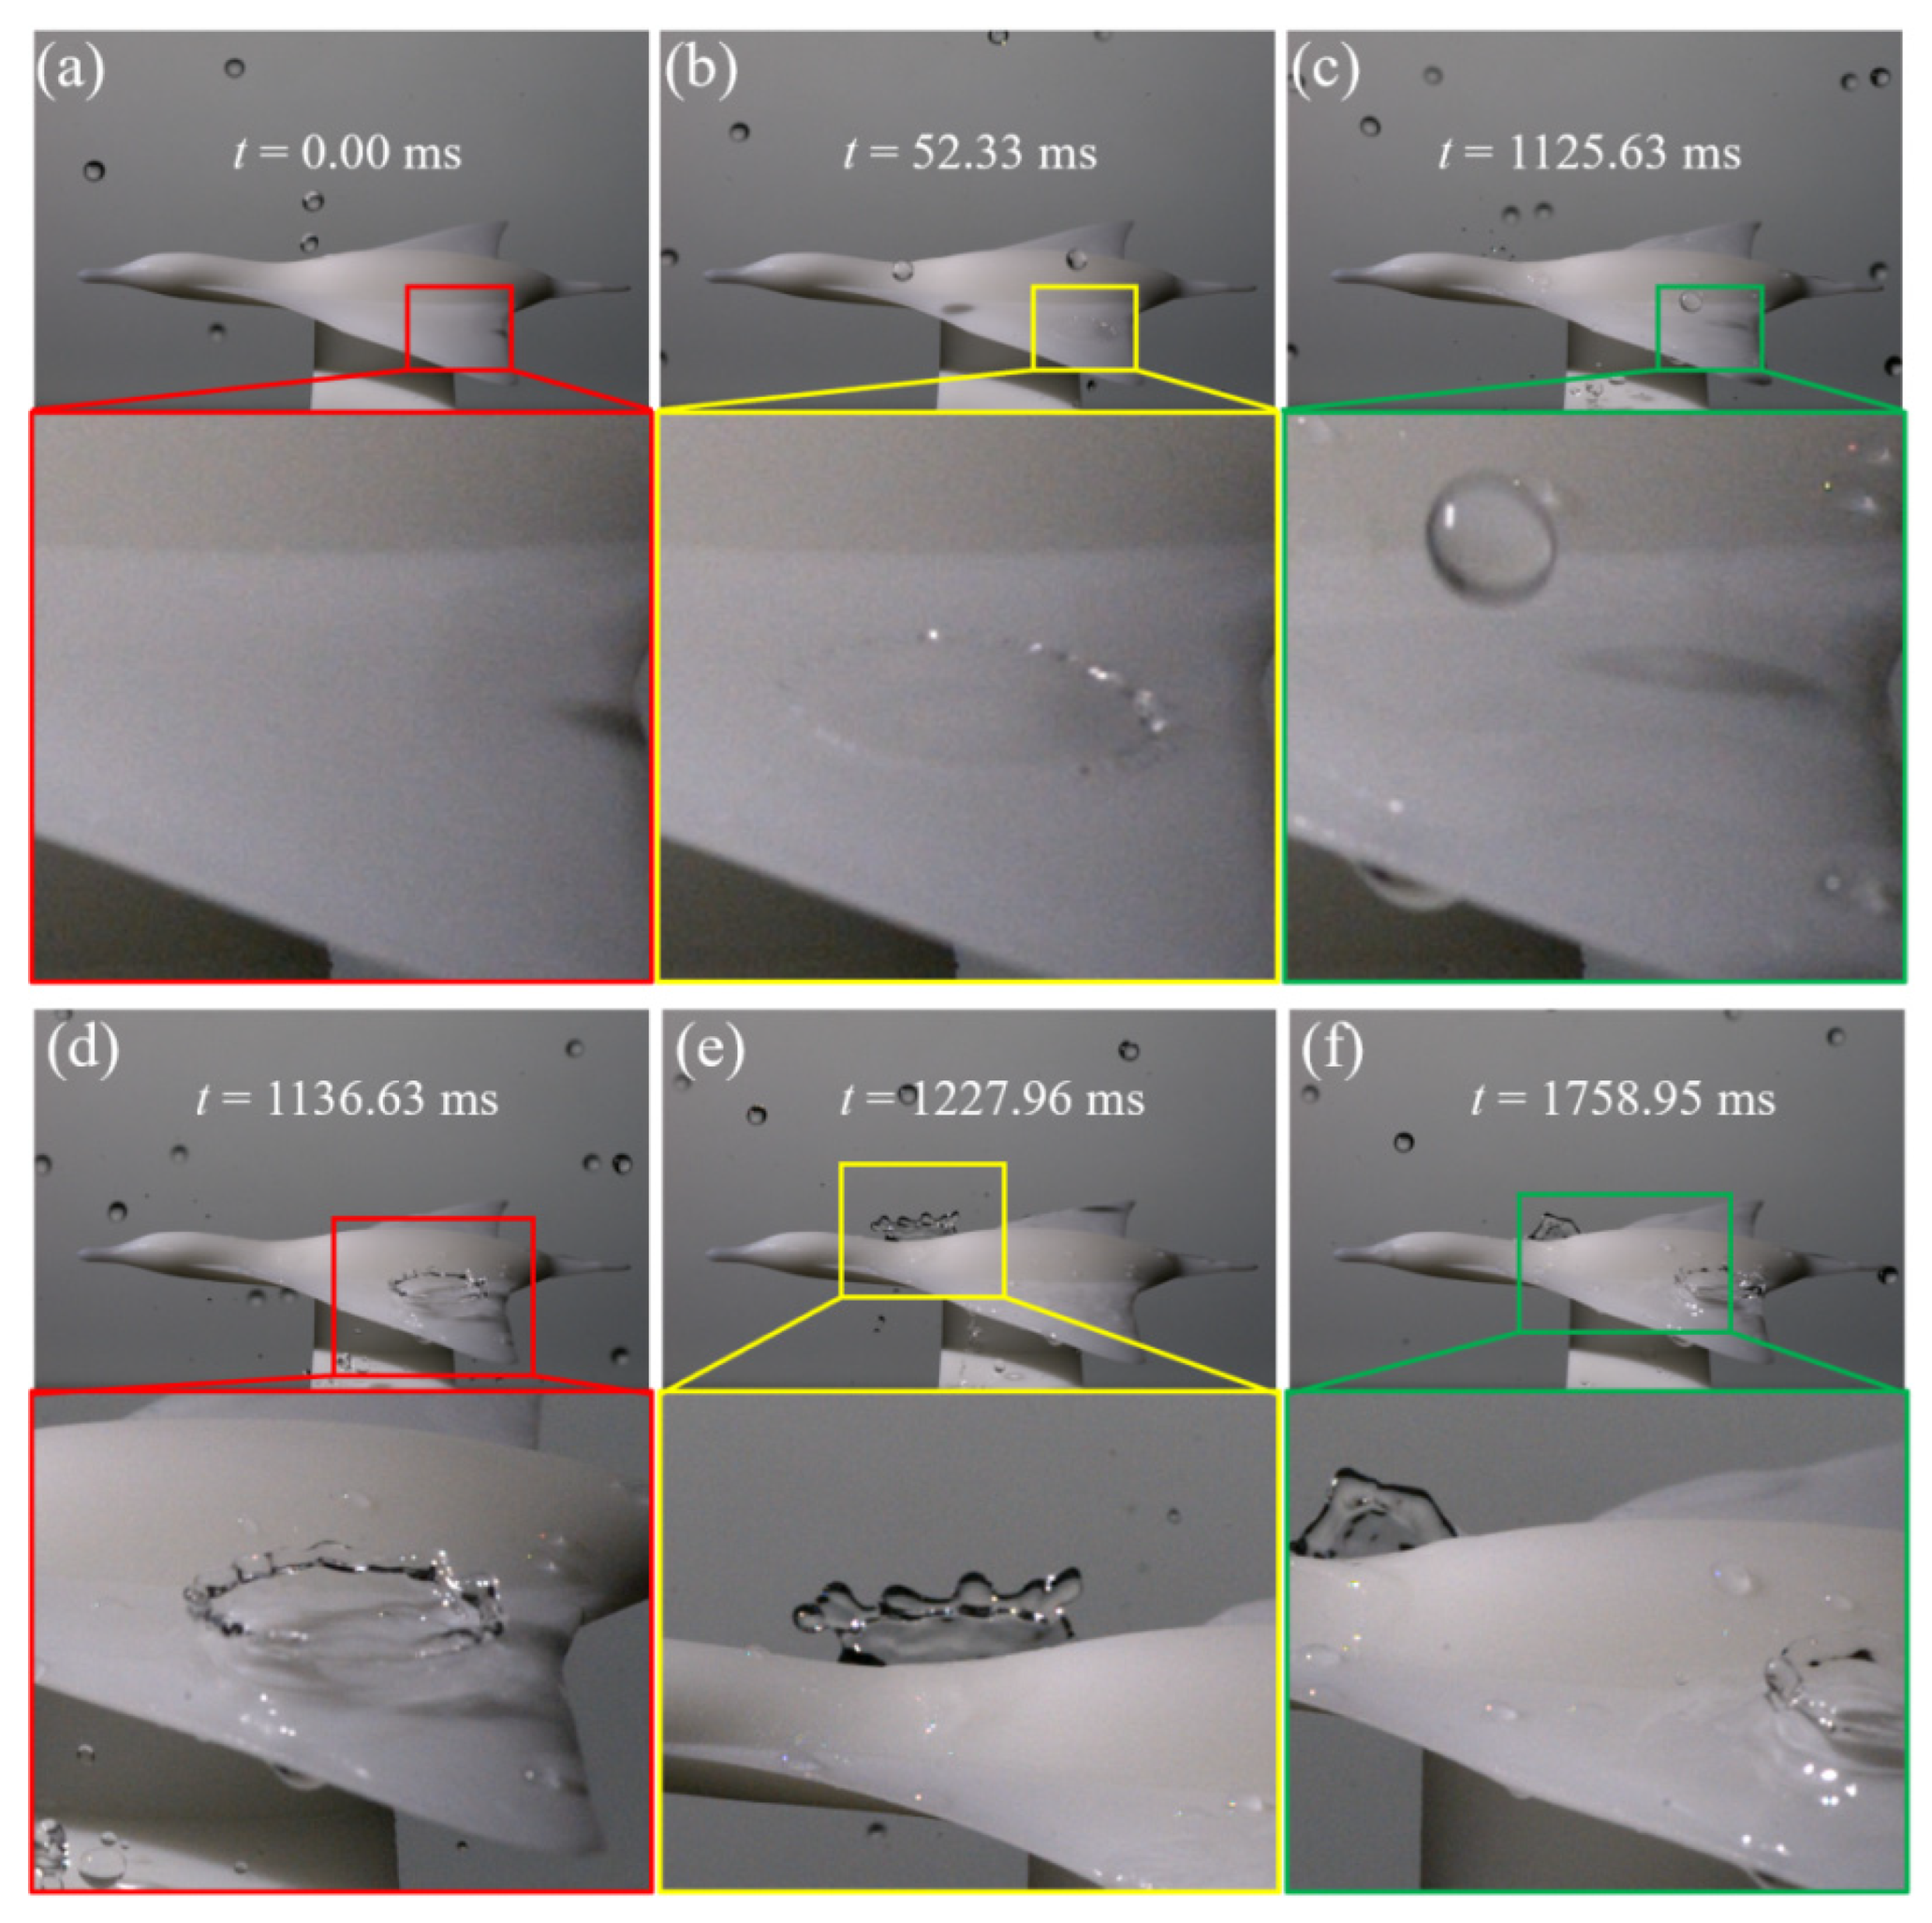
Figure 4.
Multiple droplets hit a stationary superhydrophobic model; the graph shows the impact-level analysis. As indicated from (a–c), the impinging droplets break up and bounce off, and the superhydrophobic surface remains dry. (d) The superhydrophobic surface significantly weakens the impact force (qualitatively equivalent to torque), and the peak torque is only 1/8 of that of hydrophilic surfaces (see details in “Supporting Movie S2” in the Supplementary Material).

Figure 5.
Multiple droplets impinge on hydrophilic and superhydrophobic vibrating aquatic-UAV models. The peaks and troughs of vibration are indicated by red and yellow dashed lines, respectively. The arrows are the vector directions of motion. From ① to ④ represent the corresponding vibration phases. (a) The hydrophilic model with a deep liquid film, even under vibration. (b) The superhydrophobic model, and vibrations promoting liquid repellency (see details in “Supporting Movie S3” and “Supporting Movie S4” in the Supplementary Material).
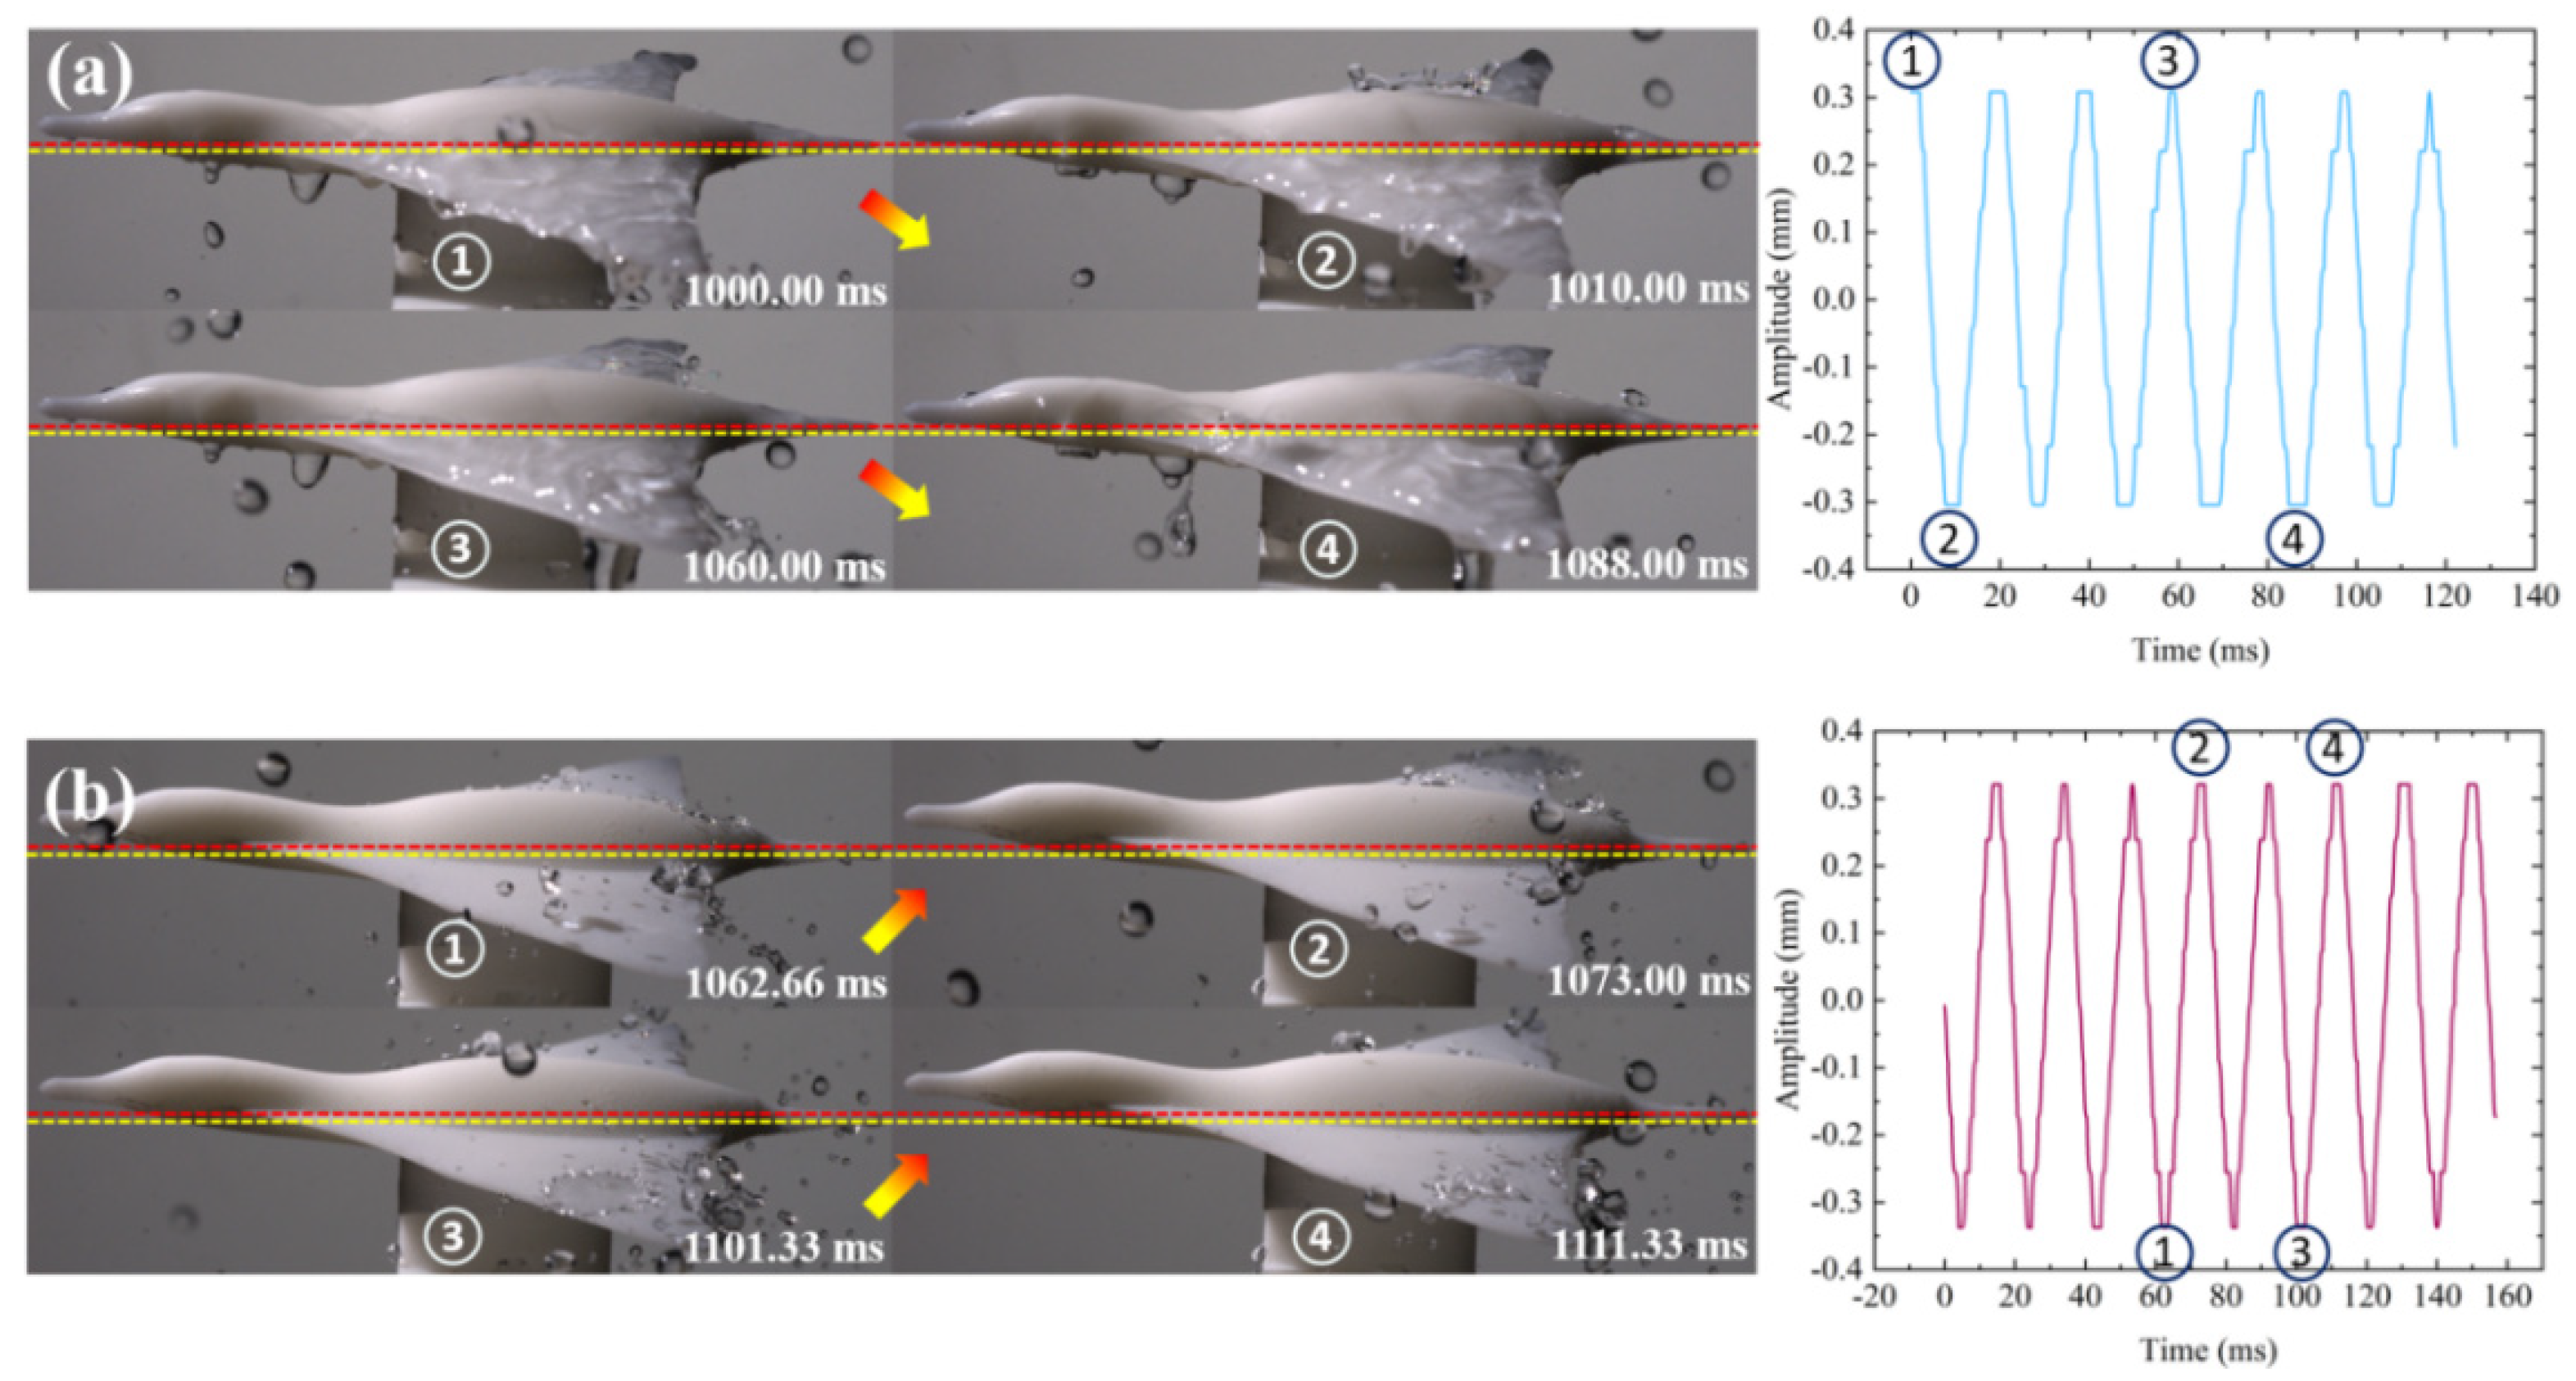
Figure 6.
Comparison of antiwetting properties on the moving hydrophilic and superhydrophobic models. (a) Adhesion of water on moving hydrophilic surfaces. Moving reduces wetting of the surface compared with when the model is stationary; only the trailing edge of the wing is wetted (see the area selected in the yellow square). (b) Excellent antiwetting based on motion and superhydrophobic coupling. The movement of the surface and the superhydrophobicity together promote dynamic water repellency, with smaller-sized droplets occurring in the upstream direction (see elliptical area). No areas were wetted. (See details in “Supporting Movie S5” and “Supporting Movie S6” in the Supplementary Material).
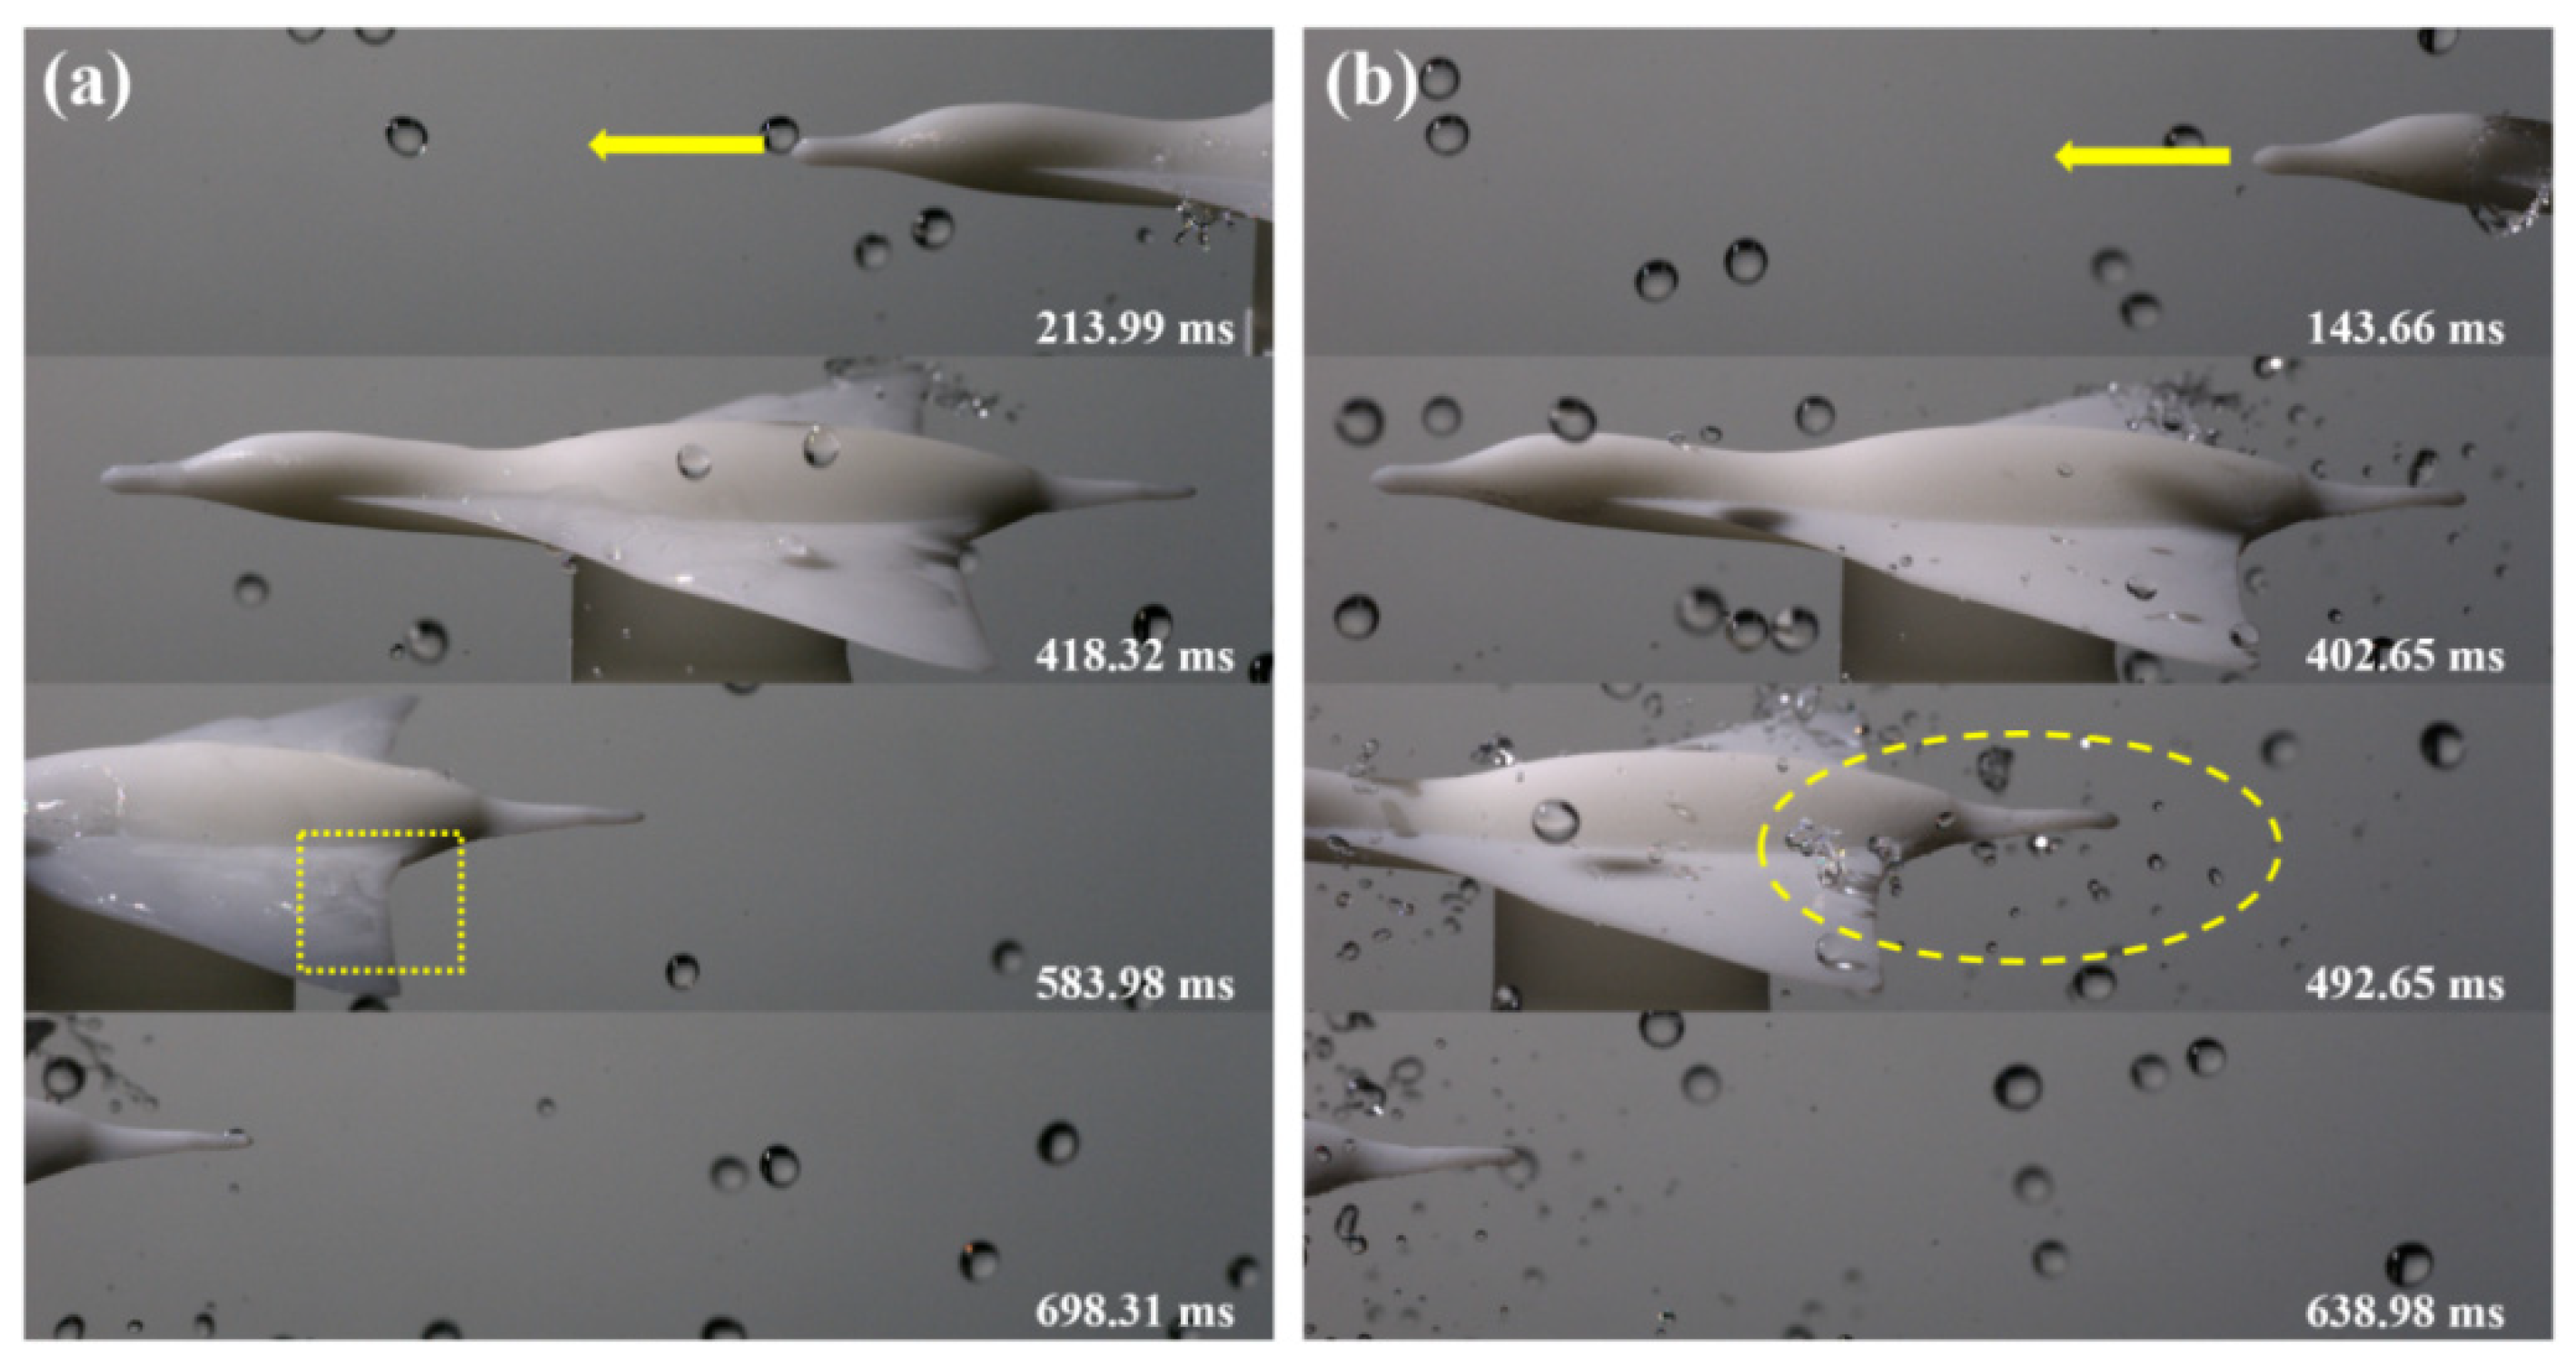
Figure 7.
Simulation and comparative analysis of the effect of surface wettability on antiwetting. (a) Antiwetting properties of moving hydrophilic and superhydrophobic surfaces. The trapezoidal regions indicate a hydrophilic surface producing continuous backward-moving liquid films. However, on the superhydrophobic surfaces, no wetting was observed, and the raindrops bounced off downstream. (b,c) show the velocity and pressure fields, respectively. Overall, hydrophilicity reduces velocity and pressure, while superhydrophobicity and mobile coupling provide the droplet with sufficient energy to bounce off.
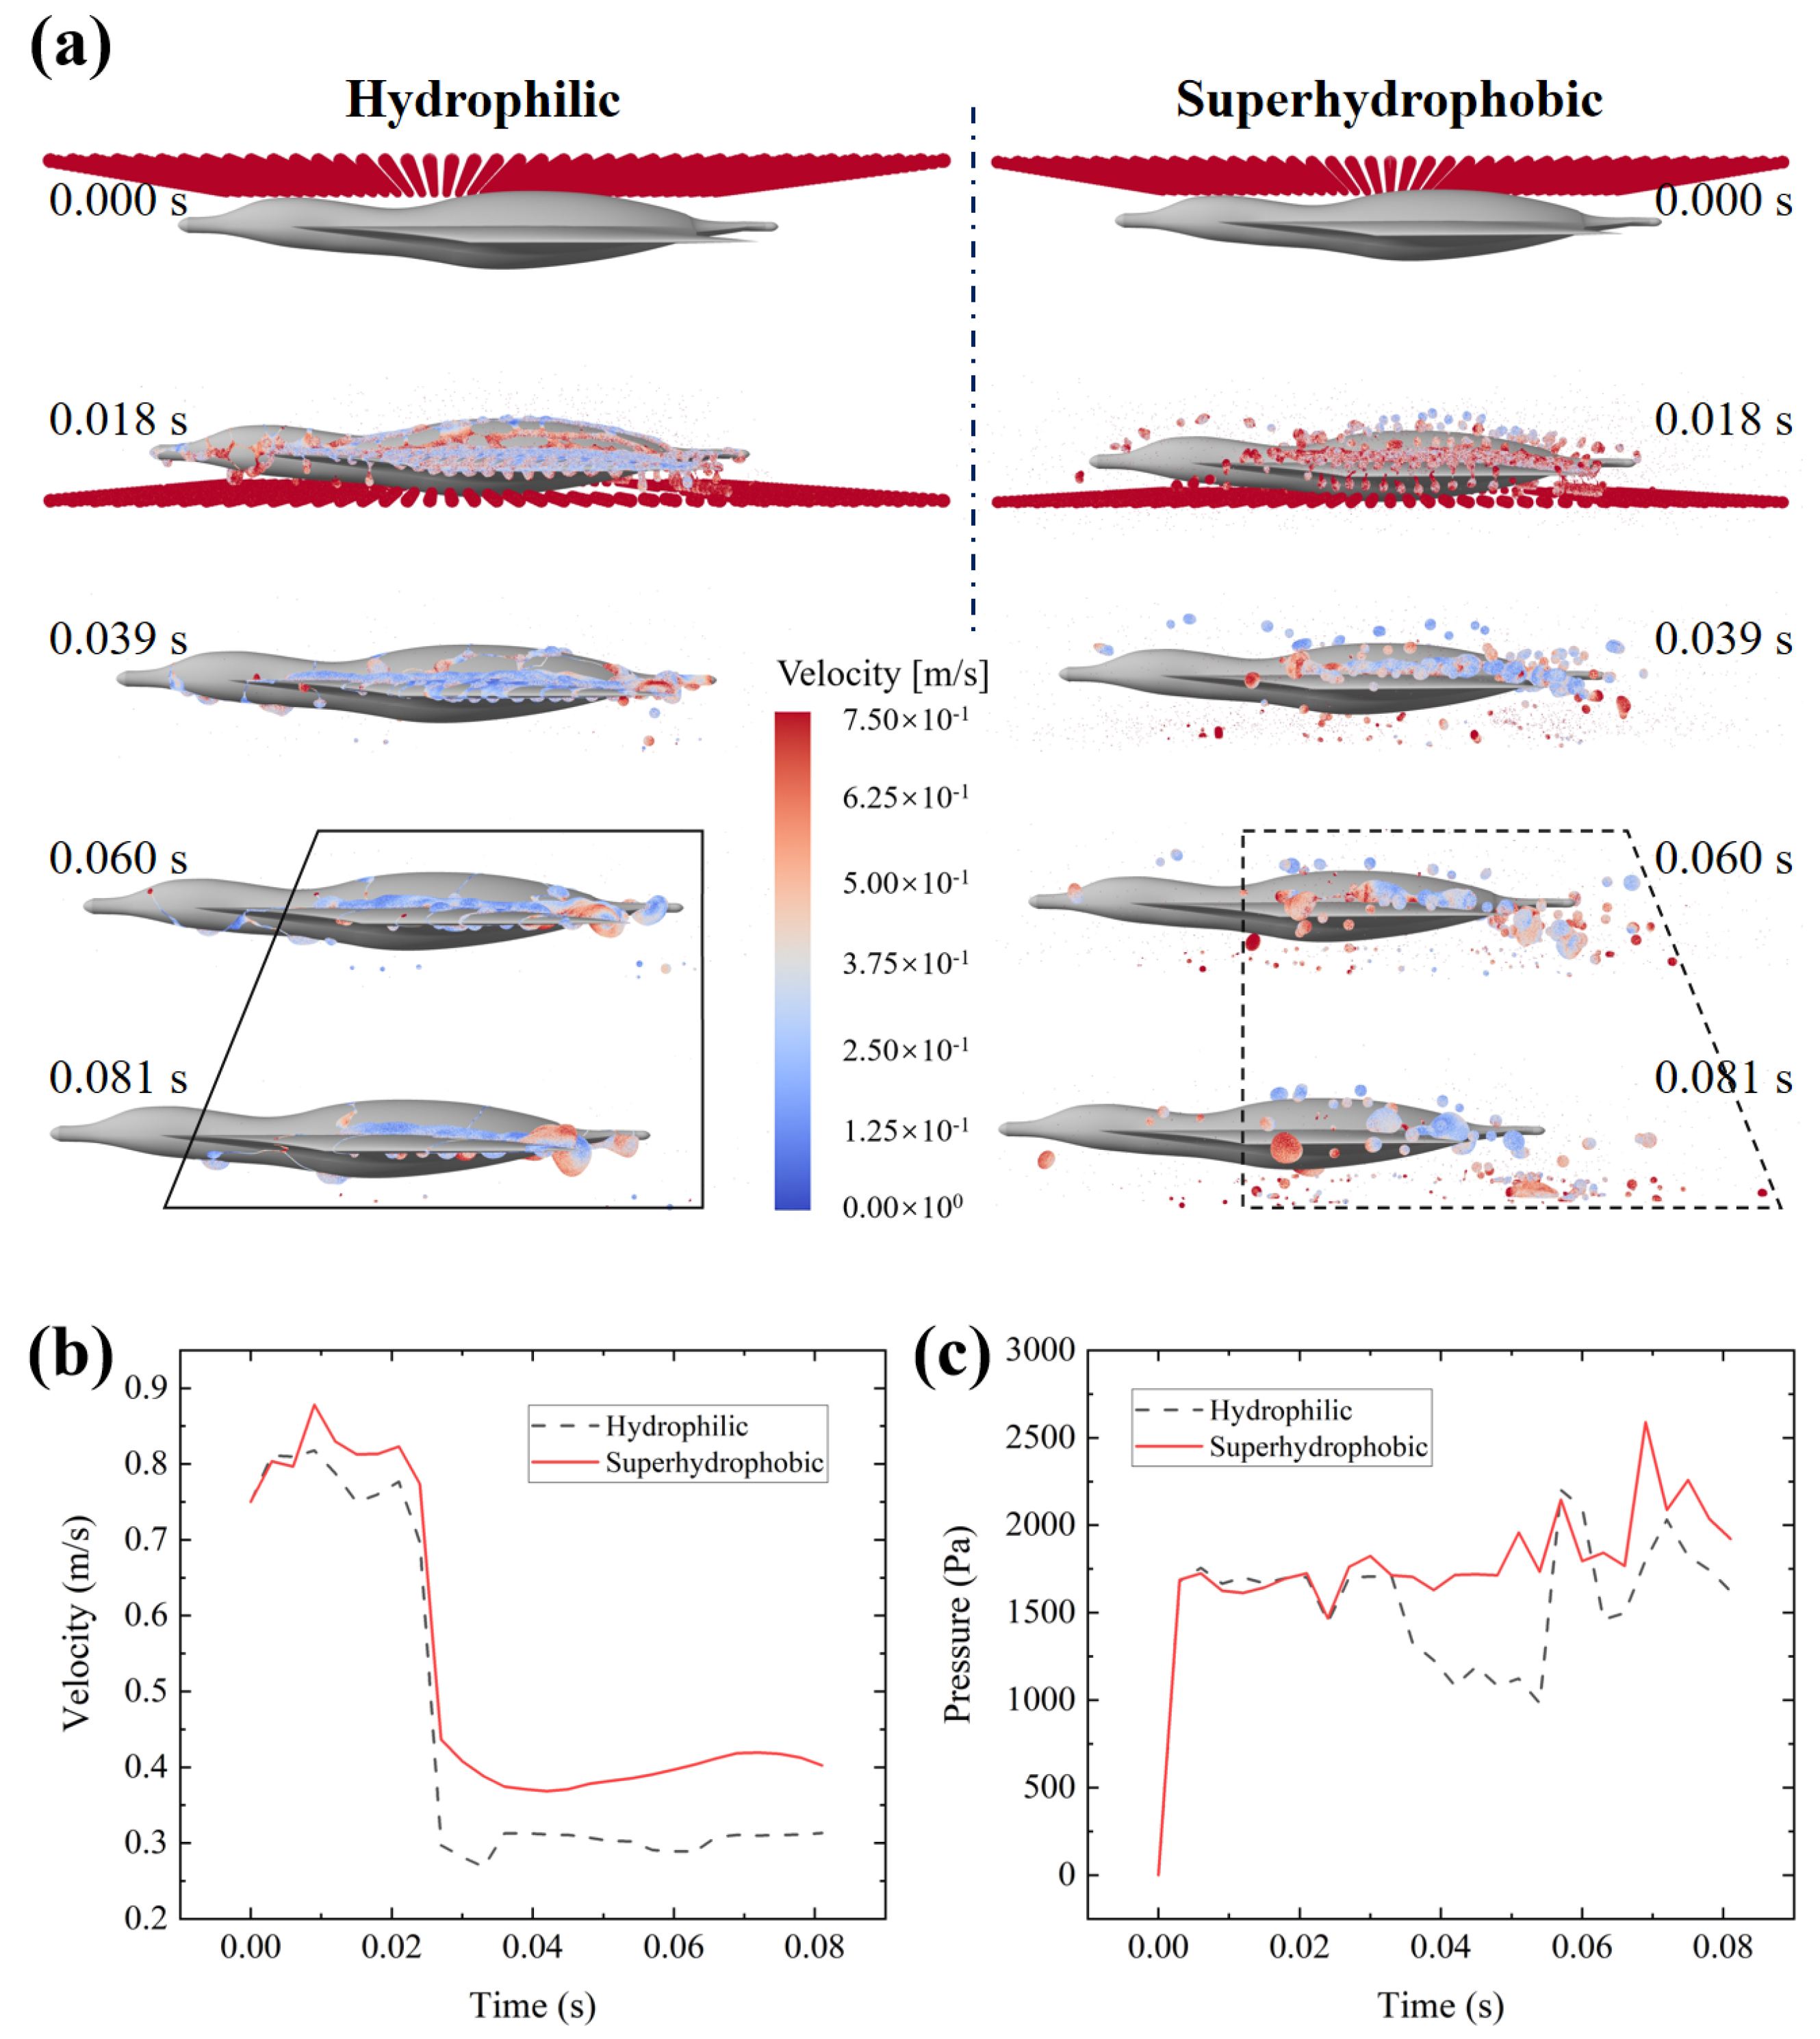
Figure 8.
Comparison of the effects of surface curvature and wettability on lateral-pressure distribution. Water adhering to the hydrophilic surfaces of the wings quickly creates areas of high pressure on the wings, but asymmetrically, which induces nonequilibrium mechanical flight penalties. However, the coupling of superhydrophobicity to the surface curvature can disperse the impact force, no obvious high-pressure region is observed on the superhydrophobic surface, and the lateral interference is thus weakened (see details in “Supporting Movie S5” and “Supporting Movie S7” in the Supplementary Material).
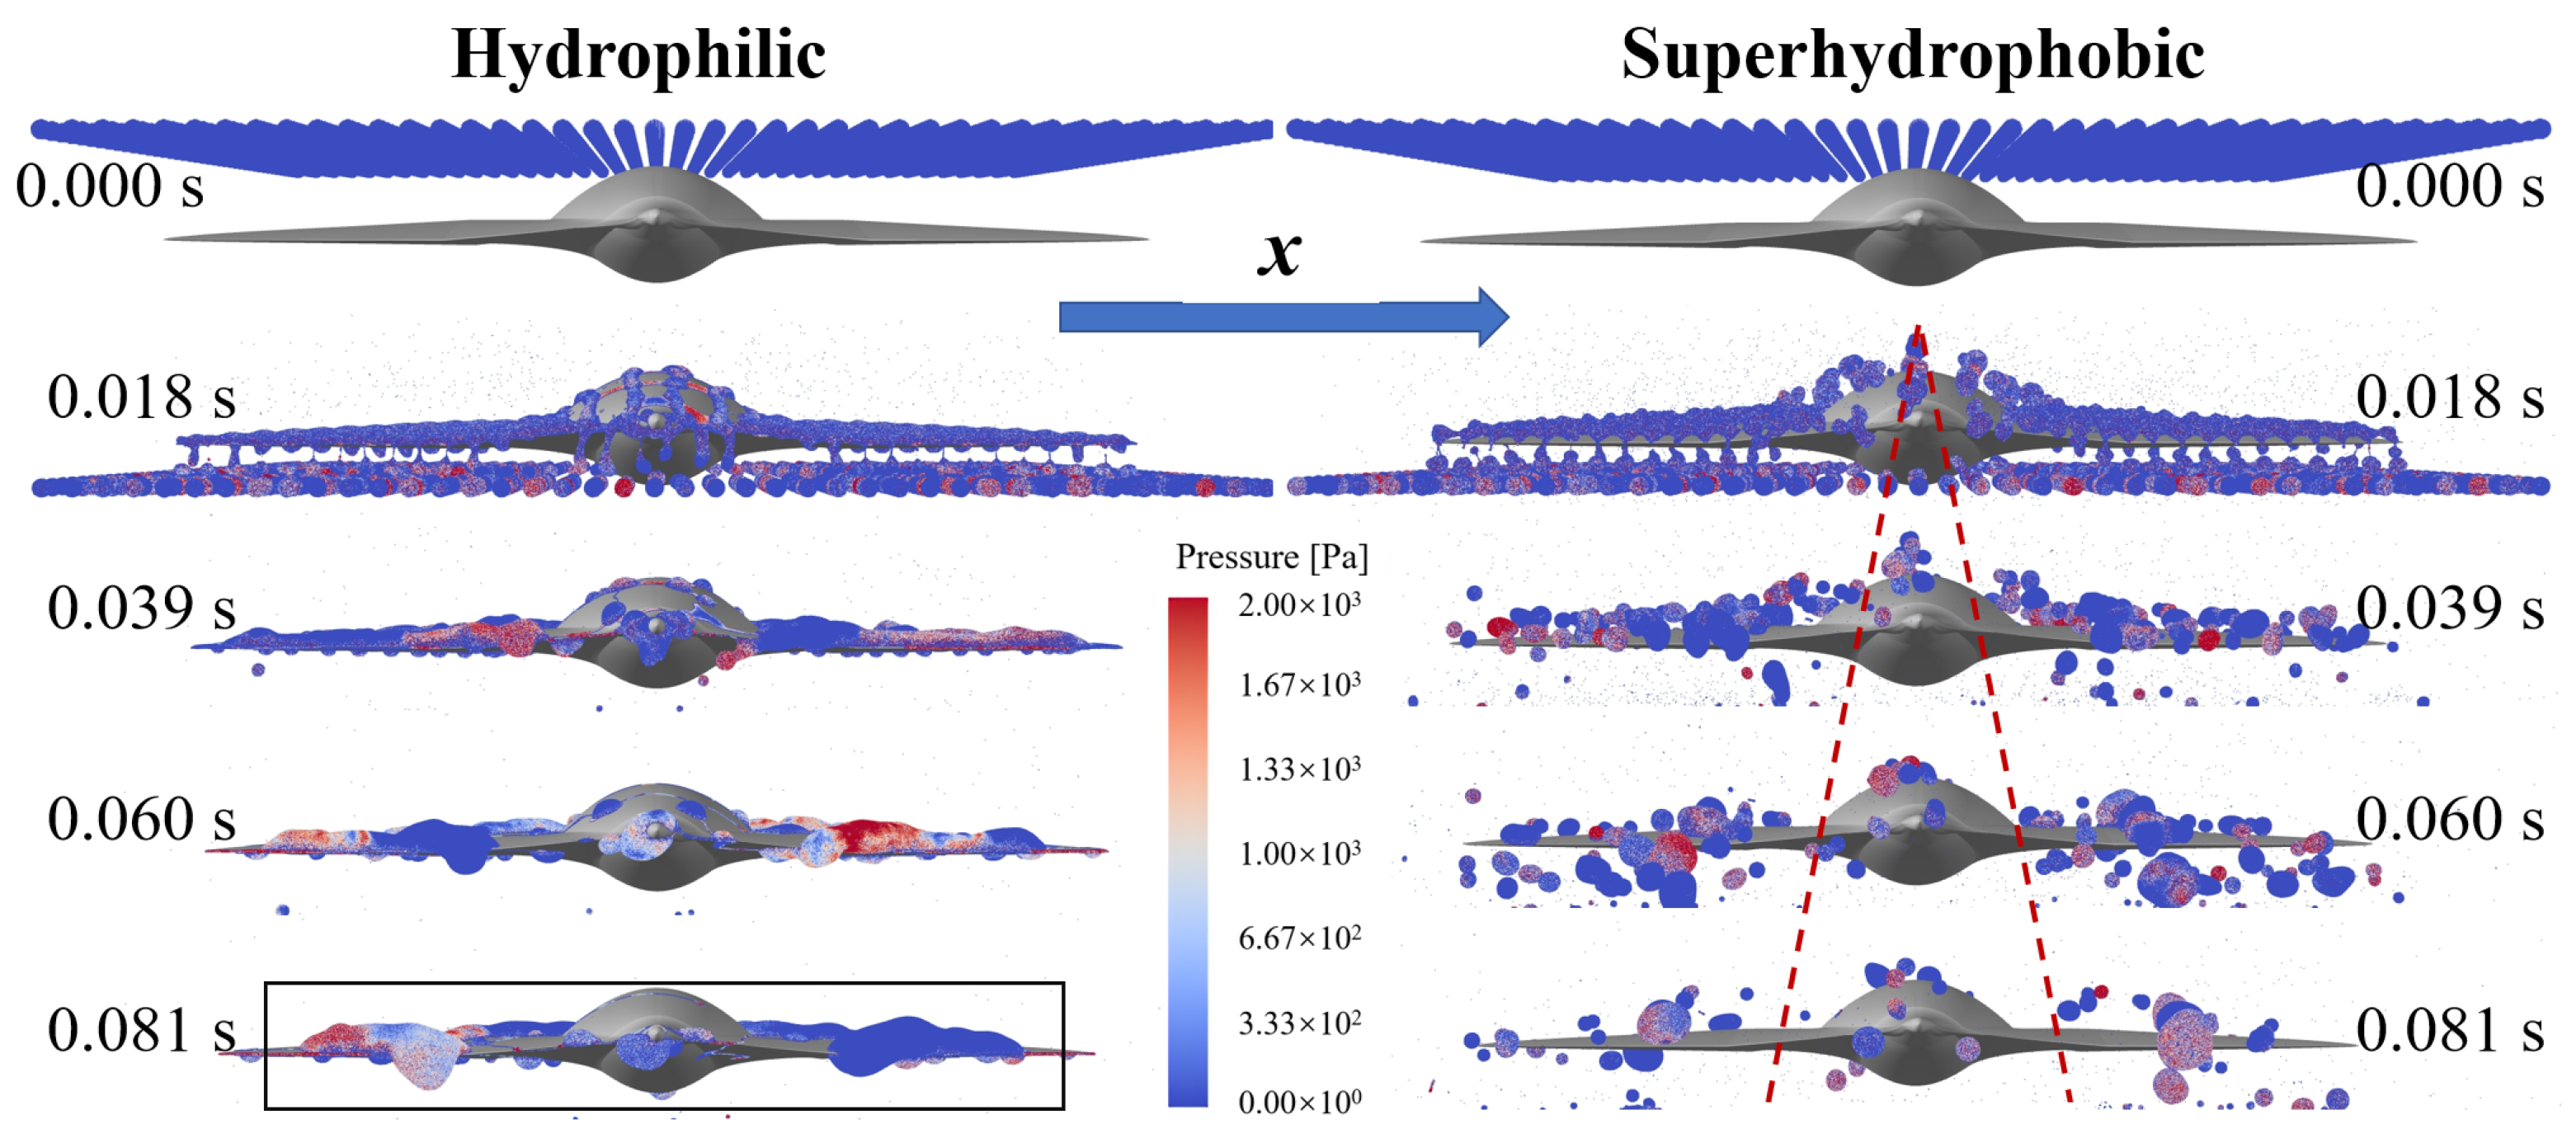
Figure 9.
Comparative analysis of simulated-particle traces on hydrophilic- and superhydrophobic-model surfaces. For hydrophilic surfaces, the traces are staggered, which indicates that the attached water bodies create pinning on the surface (see the selected square area on the left), the adhering water already exists on the surface, and it is difficult to detach. However, regular traces were observed on the superhydrophobic surface, which implies regular directional bouncing during the desorption process (see the selected square area on the right). Directional flow, induced by both motion and superhydrophobicity, can minimize the wetted area (see details in “Supporting Movie S5” and “Supporting Movie S7” in the Supplementary Material).

Figure 10.
Coordinate changes of the simulated traces on the hydrophilic and superhydrophobic models. The staggered traces shown on the left (a,c,e) are on a hydrophilic substrate, implying that wetting occurs even while moving. The difference appears in the model after superhydrophobic modification, and the trend increases or decreases significantly. This suggests that droplets impacting a moving model are accelerated to bounce off (b,d,f).

Publisher’s Note: MDPI stays neutral with regard to jurisdictional claims in published maps and institutional affiliations. |
© 2022 by the authors. Licensee MDPI, Basel, Switzerland. This article is an open access article distributed under the terms and conditions of the Creative Commons Attribution (CC BY) license (https://creativecommons.org/licenses/by/4.0/).
Share and Cite
MDPI and ACS Style
Zheng, Y.; Huang, Z.; Zhang, C.; Wu, Z. Hydrophobic Antiwetting of Aquatic UAVs: Static and Dynamic Experiment and Simulation. Appl. Sci. 2022, 12, 7626. https://doi.org/10.3390/app12157626
AMA Style
Zheng Y, Huang Z, Zhang C, Wu Z. Hydrophobic Antiwetting of Aquatic UAVs: Static and Dynamic Experiment and Simulation. Applied Sciences. 2022; 12(15):7626. https://doi.org/10.3390/app12157626
Chicago/Turabian StyleZheng, Yihua, Zhimin Huang, Chengchun Zhang, and Zhengyang Wu. 2022. "Hydrophobic Antiwetting of Aquatic UAVs: Static and Dynamic Experiment and Simulation" Applied Sciences 12, no. 15: 7626. https://doi.org/10.3390/app12157626
Note that from the first issue of 2016, this journal uses article numbers instead of page numbers. See further details here.