
Parametric Analysis of Cylinder Drying Process in Association with Various Materials

1
Department of Mechanical Engineering, National Yang Ming Chiao Tung University, 1001 University Road, Hsinchu 30010, Taiwan
2
Green Energy & Environment Research Laboratories, Industrial Technology Research Institute, Hsinchu 31040, Taiwan
*
Author to whom correspondence should be addressed.
Appl. Sci. 2022, 12(20), 10489; https://doi.org/10.3390/app122010489
Submission received: 3 October 2022
/
Revised: 11 October 2022
/
Accepted: 14 October 2022
/
Published: 18 October 2022
(This article belongs to the Special Issue Thermophysics and Heat Transfer)
Abstract
:In this study, the heat and mass transfers in the fabric drying process of a single-cylinder dryer are numerically examined in detail by using MATLAB codes and illustrating 3D velocity and temperature profiles obtained by a CFD-ACE+ software package. Seven different drying materials including Polyethylene terephthalate (PET), Polyethylene, Polypropylene, Cotton, Wool, Rayon, and Nylon are employed as drying materials. Influences of the drying-material thickness, contacting percentage, cylinder temperature, feeding velocity, and cylinder diameter are examined in detail. For all cases in this study, it is found that the maximum temperature of the drying material in the drying process is strongly dependent on the thermal diffusivity of the drying material. The higher the thermal diffusivity of the drying material, the greater the peak temperature achieved. The peak temperature of the drying material increases with the increase in the contacting percentage. The higher feeding velocity leads to a faster increase in the temperature of the drying material; however, the peak temperature of the slower feeding velocity is higher than that of the faster one. The heat transfer between the central layer of the drying material and to ambient environment is limited by the thermal diffusivity of the drying material.
1. Introduction
Drying is one of the indispensable steps in many industrial manufacturing processes, such as chemical and pharmaceutical industries, agriculture and food processing, pulp and paper production, wood and minerals processing, solid fuels preparation, etc. [1]. More importantly, the drying process requires a vast amount of energy [2]; this directly impacts the near-future energy shortage and fast global warming. Aiming at gaining better insights into the drying process and reducing the energy consumption as well as decreasing the hazards of drying materials, many researchers were involved in studies of this field.
In which, Fourt et al. [3] examined the drying rate of fabrics. In their study, the drying rate is defined by the weight of water evaporating per unit area per unit time. Their results indicated that most fabrics have the same drying rate; however, the drying time of fabrics not only depends on the drying rate but also depends on the amount of water, which the fabric is holding before drying; therefore, some fabrics can dry sooner than others are. A handbook of industrial drying was introduced by Majumder [4]. In this handbook, various drying methods for many different materials and different drying processes are presented in detail. The drying of porous material was investigated by Bejan et al. [5]. They revealed that in the falling rate period, the drying rate is slower than that of the constant rate period. In the third stage of the falling rate, the moisture contained within the subsurface is continuously evaporated until it is in equilibrium with the ambient environment.
Chen et al. [6] developed a mathematical model for optimizing the energy consumption in a single-tier cylinder dryer. They reported that the single-tier cylinder dryer could save the steam supply up to 4.6%. Roonprasang [7] proposed a new model of multi-cylinder dryers for a paper drying process. In their study, the moisture and temperature of the drying materials, as well as the energy consumption of the drying system, were examined in detail. Fundamental theory and applications of paper drying were introduced by Ghosh [8]. In the book, he suggested applying the anti-blow boxes and vacuum rolls in the drying system for decreasing energy consumption. Kong and Liu [9] developed a static energy model to describe the conventional drying process of a multi-cylinder paper dryer. They employed the specific drying rate, specific heat consumption, and energy efficiency to evaluate the performance of the drying process. Transient heat-and-mass transfers in a cylinder dryer were investigated by Nissan and Hansen [10]. In their study, a computational model was developed to calculate the heat-and-mass transfer processes in the dryer system, and experiments of a single-cylinder dryer were also carried out to verify the numerical results. Although the computational model was developed for examining the heat-and-mass transfer of the paper drying process, they suggested that the computational model could also be applied to predict the drying process of other materials. Concerning the computational model developed by Nissan and Hansen, Majumder [4] commented that the term for containing moving materials (V is the velocity), which was employed in the theory of Nissan and Hansen, can be neglected due to the extremely high rotational speed of the cylinders.
Investigations of the hybrid drying of food and bioproducts were reviewed by Hii et al. [11]. They pointed out that the drying kinetics and efficiency as well as the product quality are significantly influenced by the rate of moisture removal. The reaction engineering approach was proposed and applied by Putranto and Chen [12,13,14]. They revealed that their proposed model could effectively predict the temperature during the composting of sewage sludge compared to that of the experimental results. The reaction engineering approach was also reported by Compaore et al. [15] and Yang et al. [16]. They reported that a new method of the reaction engineering approach could not only avoid the effect of the shrinkage in the first place but also achieved a good prediction.
Heo et al. [17] proposed a dynamic model that described the behavior of the multi-cylinder drying process applied in paper production. Their computational model was developed based on the heat-and-mass balances around the cylinder, and they used the developed model to examine variations of cylinder surface temperatures. Keränen [18] hypothesized that the drying rate of the paper drying process can be enhanced by impinging the hot air on the drying paper through a fabric. To assess the idea, simulations and experiments were carried out, and they concluded that the dryer with the aforementioned impingement not only showed potential for increasing the drying rate but also improved the paper quality by preventing the shrinkage of the paper during the drying process. Wilhelmsson et al. [19] reviewed twenty simulation models of multi-cylinder paper drying. Their work focused on necessary coefficients for each of the reviewed models and how they are determined. Ramaswamy and Formerly [20] proposed a mathematical model for examining the drying process of the web. In the computational model, three different zones, including a wet zone, an intermediate zone, and a dry zone, were determined. At the intermediate zone, the liquid and vapor moved in opposite directions similar to what happened in a heat pipe.
Appleton and Wisconsin [21] reviewed papers on the drying process. They revealed that the main cost for yearly operating dryers is spent on steam production. Low dryer efficiency, less wet pressing, and non-uniformity of web moisture are attributed to reasons leading to higher drying costs. Steady-state modeling of multi-cylinder dryers in a corrugating paper machine was developed by Ghodbanan et al. [22]. The reported dryer contained 35 cylinders, and the cylinders were divided into three groups for the calculation. They asserted that the developed model could be used to predict the evaporation rate and specific drying rate of the multi-cylinder dryers with high accuracy.
The moisture distribution inside textile sheets and the effects of operating variables on the drying process were investigated by Sousa [23]. In their study, the crude cotton fabric was used as a drying material. They reported that the effect of air speed is more important during the constant drying rate period as compared to that of the decreasing rate period. Ryan et al. [24] experimentally reported a through-air drying process. They found that the internal structure of the material plays a very important role in through-air drying, and they suggested that the internal structure of the drying material should be carefully considered to optimize the drying process of a commercial dryer system. In the drying process, the hazards of the drying materials are also considered a problem. Moreover, the chemical structures and properties of the drying material should be clearly understood. Hsieh [25] examined the structures and physical properties of cotton. He warned that overheating can cause the decomposition of cellulose. The morphology of wool was investigated by Bradbury [26]. He reported that the external resistant membrane of wool is not only rich in lysine, but also contains important properties, such as the chemical inertness and hydrophobicity of the wool fibers. The molecular structure and mechanical properties of the Polyethylene terephthalate (PET) fibers were investigated by Ward [27]. The author reported that the glass transition and the dynamic mechanical properties of the PET fibers were significantly affected by both crystallinity and orientation.
Based on the reviewed literature, it is found that most of the existing studies in the drying process focus on paper drying, but information concerning the effects of various parameters of the cylinder drying process with different drying materials is still lacking. Aiming at filling the gap, a study on the influences of drying material types, drying material thickness, heated drum temperature, feeding velocity, and cylinder diameters is numerically carried out in this work.
2. Methodology
2.1. Work Description
In the present study, the effects of various operating and designing parameters on the heat transfer of cylinder drying are numerically investigated in detail by using MATLAB codes. Firstly, the effect of seven transport materials, including PET, Polyethylene, Polypropylene, Cotton, Wool, Rayon, and Nylon, is studied in Section 3.1. Secondly, the influence of contacting percentage, between the sheet and the cylinder, in the range from 50% to 90%, is investigated in Section 3.2. Thirdly, the impact of feeding velocity of drying materials, with velocities in the range from 1.27 m/s to 10 m/s, is examined in Section 3.3. Fourthly, the effect of cylinder temperature, with the temperature range from 100 °C to 150 °C, is examined in Section 3.4. Finally, the impact of cylinder diameter, with the diameter in the range from 0.2 m to 1 m, is assessed in Section 3.5. In addition, the influence of cloth thickness ranging from 1 mm to 3 mm is examined in all of the aforementioned sections.
2.2. Computational Model
Typically, a cylinder dryer is designed with multi cylinders as schematically presented in Figure 1a,b. Although a dryer contains many cylinders, the heat transfer processes in every single cylinder are the same; it only differs in the initial conditions of the drying material.
Therefore, in this study, a single-cylinder dryer, which was experimentally reported by Nissan and Hansen [10], and is also a unit cell of the multi-cylinder dryers, is selected as an examining dryer. The drying process of the dryer in a cylinder is divided into four phases as shown in Figure 1c. The cylinder is driven by a motor, and its rotational speed is controlled by a gear. The cylinder is heated by hot steam flowing inside the cylinder. The drying sheet is fed at the inlet of the cylinder, and it is assumed to move at the same velocity with the cylinder. One surface of the drying sheet is named the basic layer, which is in direct contact with the cylinder in phases I, II, and III, and with the cold air of the ambient environment at phase IV.
Another surface of the drying sheet is called the topmost layer, which has contact with the cold air of the ambient environment at phases I, III, and IV, and with moving felt at phase II. The distribution of the phases is schematically illustrated in Figure 1c. The drying process will release hot air and vapor to the ambient environment, which is driven to leave the drying section by an upwardly ventilated duct. The thickness of the drying sheet is much smaller than the length of the radius of the cylinder; therefore, a short segment of the drying sheet is assumed to be an approximately straight segment. For calculating the heat transfer process within the textile in the drying process, a unit cell of the textile is selected as a computational model of this study, which comprises a length, ∆x, and a thickness, ∆y, as presented in Figure 1d.
2.3. Mathematical Model
Normally, to dry material, especially clothes, the wet pressing process is first conducted, and the rest of the water will be removed in the drying process. During the drying process, the water contained in the wet material is heated until it is evaporated; the heated moisture on the top surface of the drying material is directly released to the ambient environment; this leads to the moisture concentration on the top surface to be lower than that in the inner layer; therefore, the heated moisture inner of the drying material will defuse up to the top surface due to the difference in moisture concentration. The process happens continuously until an equilibrium of moisture between the drying material and the ambient environment is set. Therefore, the water contained in the drying material is decreased during the drying process, and the rate of the loss of moisture,, can be calculated as follows [4]:
where M, Me, and denote the initial moisture amount, the equilibrium moisture amount, and the drying constant, respectively. The drying constant is calculated as follows [4]:
where α and y are the thermal diffusivity and the thickness of the drying material, respectively.
The energy equation of the drying process is expressed as follows:
where α is the thermal diffusivity of the drying material. T, y, and t stand for temperature, the thickness of the drying material, and drying time, respectively.
For calculating the heat transfer characteristics in the computational model, the boundary conditions for the four phases in drying process are expressed as follows [8,10,17,19,20,28,29]:
Phase-I
Phase-II
Phase-III
Phase-IV
where denotes the change in temperature of the cloth along with its thickness, y = 0 denotes the base layer of the cloth, y = 1 denotes the topmost layer of the cloth, Tc denotes the cylinder temperature, Tf denotes the temperature of the felt, Ta denotes the ambient temperature, Ty (at y = Y) denotes the cloth temperature at the subsequent thickness, k denotes the thermal conductivity of the drying material, λ denotes the latent heat of water, denotes the change of mass of water in the drying material on time, hcs denotes the heat transfer coefficient of the cylinder to drying sheet (at the base layer), hsa denotes the heat transfer coefficient of the drying sheet to air (at the top surface), hsf denotes the heat transfer coefficient from sheet to felt.
For more simplicity in the calculation, assumptions for the computational model are as follows:
- There is no heat loss between the cylinder and the ambient environment;
- The temperature of the heated moisture is equal to that of the drying material at the local points;
- The vapor, which is evaporated from the drying material in the drying process, is removed by the cold air of the ambient environment;
- The relative humidity of the ambient environment is constant;
- The temperature of the ambient environment is constant;
- The convection heat transfers between the drying material and the ambient environment in phases I, III, and IV are constant.
2.4. Computational Model Validation
The present computational model is first verified by existing experimental results according Nissan and Hansen [10]. A comparison for dimensionless time versus temperature between the present numerical results and the existing experimental results for the dimensionless thickness of 0.33 and 0.67 is presented in Figure 2. The dimensionless time is calculated as follows:
where t, α, and y are time, the thermal diffusivity, and thickness of the drying material, respectively.
Figure 2 shows a good agreement between the present numerical results and the experiment reported by Nissan and Hansen [10]. The maximum errors between the two compared results are less than 3.3% and 3.6% for the dimensionless thickness of 0.33 and 0.67, respectively. The good agreements substantiated the applicability of the proposed numerical model for examining the heat transfer phenomenon in the cylinder drying process.
3. Results and Discussion
For avoiding inessential repetitions, the drying material utilized in the following sections is Cotton except in Section 3.1. The feeding velocity in sections, which is not mentioned, is 1.27 m/s. The ambient air is 30 °C, and humidity ratio of the ambient air is 12 g/kg. The initial temperature of the drying materials is 40 °C, and initial moisture content in the drying materials is 57.5% [30].
3.1. Effects of Transport Materials
In this section, seven transport materials, consisting of PET, Polyethylene, Polypropylene, Cotton, Wool, Rayon, and Nylon, are investigated in detail at a fixed boundary condition with temperatures of the ambient environment, cloth, and cylinder, being 30 °C, 40 °C, and 100 °C, respectively. The feeding velocity and thickness of the drying material are fixed at 10 m/s and 1 mm, respectively. For computing, the heat transfer process in the drying web, the computational model presented in Section 2.2 is employed.
The cloth thickness used for drying is divided into eight equal slices. Temperature versus drying time of three layers of 12.5%, 50%, and 87.5% thickness subject to seven different transport materials are presented in Figure 3a–c, respectively. Figure 3d,e illustrate 3D outside temperature profiles of computational models with PET, Wool, and Cotton as drying materials. The results show that the temperatures of the four synthetic fibers of PET, Polyethylene, Polypropylene, and Nylon are similar at any stage of the four phases. For all cases in this section, it is found that the heat transfer of the synthetic fibers is superior to those of the natural fibers, and the heat transfer of the natural fibers is significantly different from each other in the group [3,4]. Specifically, at the same boundary conditions, the temperatures of the synthetic fibers are higher than those of the natural fibers.
The temperature of cotton is lowest while wool contains the highest temperature in the natural fiber group; however, it is much lower than that of the synthetic fiber group in phases I, II and III. It is noted that in the same drying process, the higher the temperature material is, the faster the water vapor in the drying material is evaporated into the ambient environment; therefore, the smaller the water mass was kept within the drying material, leading to the faster drying process. This phenomenon prevails throughout in the following Sections.
The higher thermal diffusivities of synthetic fibers relative to those of the natural fibers explains the temperature distributions of different materials in phases I, II, and II as presented in Figure 3. At phase IV, there is no heat supply, and the temperature of the vapor is equal to that of the fabric at the local points as assumed at Section 2.3. In addition, the temperature of a liquid is not changed in an evaporating process; therefore, although the vapor is removed from the drying sheet, the temperature of the sheet is not changed, and the change in temperature of the drying sheet at phase IV is due to the convective heat transfer between the drying cloths and ambient environment. The convective heat transfer is dependent on the heat transfer area, different temperatures, and velocity of the cloths. Note that the heat transfer area in contact with the ambience and the velocity for all materials remain the same. A similar convective heat transfer mechanism prevails except for the temperature difference, thereby the trends look similar.
3.2. Effects of the Contacting Percentage
In this section, five different contacting percentages of 50%, 60%, 70%, 80%, and 90% between the drying materials and the cylinder are examined in detail. The boundary conditions in Section 3.1 are employed. Cotton is utilized as a drying material. Figure 4a,b present the temperature versus drying time subject to two different thicknesses (2 mm and 3 mm) of drying materials at the examining layer of 50%. Figure 4c presents temperature versus drying time at a percentage surface contact of 70% with the two thicknesses subject to three different examining layers of 25%, 50%, and 75%, respectively. Figure 4d,e illustrate 3D outside temperature profiles of the computational model with contacting percentages of 50%, 70%, and 90%. For all cases in this section, it is found that the temperatures of the drying material increase with elapsed drying time, and the maximum temperatures of the drying material at the examining layers also increase with the rise in the contacting percentage.
The peak temperatures of the examining layer of 50% thickness with 90% contact are 11.3% and 8.3% higher compared to those of the 50% contact of the drying material for the drying material thickness of 2 mm and 3 mm, respectively. At the same contacting percentage of 70%, the peak temperature of the drying material decreases with the increase in the thickness of the transport material as presented in Figure 4c. A longer drying time is needed since more heat is required to dry the material; the thicker drying material contains a greater volume of the drying material as well as more water; therefore, it requires more heat to increase the temperature of the drying material [3]; the higher contacting percentage is the larger heat transfer area, leading to more heat to be transferred to the drying material. These explain why the temperature of the drying material with a longer contact or thinner thickness is higher than that of the shorter contact or the thicker thickness, as presented in Figure 4a–c and illustrated in Figure 4d,e.
3.3. Effects of the Feeding Velocity
In this section, six different feeding velocities consisting of 1.27 m/s, 2 m/s, 4 m/s, 6 m/s, 8 m/s, and 10 m/s subject to three different thicknesses of the transport materials of 1 mm, 2 mm, and 3 mm are examined in detail. The boundary conditions in previous sections are utilized. Figure 5a–c present the temperature versus drying time of the aforementioned velocities at a fixed examining layer of 50% for the drying material thickness of 1 mm, 2 mm, and 3 mm, respectively. Figure 5d presents temperature versus drying time of three different examining layers of 25%, 50% and 75% subject to the three different thickness of 1 mm, 2 mm and 3 mm at a fixed velocity of 4 m/s.
Figure 5e,f illustrate 3D velocity and temperature profiles for feeding velocities of 1.27 m/s, 2 m/s, and 4 m/s, respectively. For all cases in this section, it is found that at the same examining layer with the same drying material thickness, the temperature of the examining layer with higher feeding velocity is increased faster than those of the lower feeding velocities.
However, the peak temperature of a transport material with lower velocity is higher than those of the higher velocities as presented Figure 5a–c and illustrated in Figure 5e,f. At the same examining layer, the temperature of the drying material with thinner thickness is increased faster as compared to those with thicker thicknesses, and the maximum temperature of the drying material of the thinner thickness is also higher than those of the thicker thicknesses.
In fact, at a fixed velocity of 4 m/s, the maximum temperature of the layer of 25% of the thickness of 1 mm is 18.3% and 25.5% higher in comparison with those of the thickness of 2 mm and 3 mm, respectively. The higher feeding velocity speeds up the drying process, and it is applicable in phases I, II, III, and IV. However, the shorter time in the drying process not only shortens the thermal diffusion from the hot side to the cold side of the drying material (in phases I, II, and III) but also offers lesser heat transfers from the cold side of the drying material to the ambient environment or the felt. Thus, a faster increase in the temperature of drying material with a lower maximum temperature prevails at a higher feeding velocity as compared to those of the lower velocities as presented in Figure 5a–c and illustrated in Figure 5e,f.
The faster feeding velocity shortens the contact time between the drying material and the cylinder (heat source). As a consequence, the maximum temperature of the drying material with lower feeding velocity is higher than those of the higher velocity as presented in Figure 5a–c and also illustrated in Figure 5e,f. The thicker drying material requires more heat to increase the temperature as compared to those with the thinner material. This explains the temperature distribution of the examining layers with different drying material thicknesses as presented in Figure 5d.
3.4. Effects of the Cylinder Temperature
For examining the effects of the cylinder temperature on the heat transfer of the drying process, three different cylinder temperatures of 100 °C, 125 °C, and 150 °C subject to two different drying material thicknesses are examined in detail. Figure 6a presents the temperature of the drying material with a thickness of 1 mm at the examining layer of 50% versus drying time subject to the three different cylinder temperatures. Figure 6b presents the temperature of the drying material with a thickness of 2 mm at different layers subject to the three different cylinder temperatures. Figure 6c,d illustrate the temperature distributions of computational models with three different cylinder temperatures of 100 °C, 125 °C, and 150 °C.
The results show that the temperature of the drying material with a fixed thickness not only increased with the increase in the cylinder temperature but also increased faster with the increase in the drying time for phases I, II, and III. It is interesting to find that the decrease in temperature of the drying material at the examining layer of 50% at phase IV seems to be independent of the cylinder temperature. Note that the temperature of the drying material reaches the plateau at the end of phase III. The heat from the drying material will be transferred to the ambient environment through convection at phase IV. For convection heat transfer, with a fixed velocity of drying material and fixed heat transfer area (two sides of drying material), the heat transfer rate only depends on the different temperatures between the drying material and the ambient environment.
This means that the higher temperature difference provides a higher heat transfer rate; however, the decrease in temperature at phase IV of the three different cylinder temperatures follows the same trend as presented in Figure 6. In this case, the heat transfer rate of the convective heat transfer is higher by increasing the temperature difference between the drying material and the ambient environment; however, the thermal diffusion from the center layer of the drying material (50%) to two sides of the drying material is smaller than that of the smallest temperature difference (the case with cylinder temperature being 100 °C); therefore, the overall heat transfer from the center layer to an ambient environment is limited by the thermal diffusivity of the drying material.
The limitation of the thermal diffusivity of the drying material is more pronounced in Section 3.1 between the synthetic fibers and natural fibers as presented in Figure 3. It is also the limitation of the thermal diffusivity of the drying material that leads to lower heat transfer from the drying material to the ambient environment. This explains a faster increase in temperature of drying material having higher cylinder temperature at phases I, II, and III as presented in Figure 6.
3.5. Effects of the Cylinder Diameter
For investigating the effects of cylinder diameter on the drying process of the cylinder dryer, five different cylinder diameters consisting of 0.2 m, 0.4 m, 0.6 m, 0.8 m, and 1 m are examined in detail with a thickness of 1 mm. The aforementioned boundary conditions are also employed. Figure 7a presents the temperature of the 50% layer versus the drying time of the five different cylinder diameters.
Figure 7b presents the temperature at the four phases of three different examining layers of 25%, 50%, and 75%. Figure 7c,d illustrate the velocity-and-temperature distributions for three computational models with cylinder diameters of 0.2 m, 0.4 m, and 0.6 m, respectively. Figure 7a shows that the peak temperature is slightly increased with the increase in the diameter from 0.2 m to 0.4 m; however, the maximum temperature is almost unchanged by increasing the diameter from 0.4 m to 1 m. Note that with cylinder diameters of 0.2 m and 0.4 m, the heat transfer area between the cylinder and the drying material is comparatively smaller as compared to those with larger diameters; therefore, the heat transfer rate is not able to raise the temperature of the drying material to an equilibrium temperature. This explains why the peak temperature is slightly increased with the increase in the cylinder diameter from 0.2 m to 0.4 m.
When the cylinder diameter increases from 0.4 m to 1 m, the contacting area between the cylinder and the drying material is so large that the temperature reaches the state where the heat to be transferred from the cylinder to the drying material equals the heat loss from the drying material to ambient environment (equilibrium state). This explains the unchanged peak temperature when increasing the diameter from 0.4 m to 1 m as presented in Figure 7a and illustrated in Figure 7d. It is interesting to find that although the distances between the 50% layer and 25% layer or 75% layer are the same, the temperature difference between the 75% layer and 50% layer is greater than that between the 25% layer and 50% layer as presented in Figure 7b.
The heat is transferred from the cylinder to the drying material through the basic layer; therefore, the temperature of the lower percentage layer is higher than those of the greater percentage layers in phases I, II, and III. The thermal diffusivity of a material with a higher temperature is higher than that of a lower temperature; therefore, the heat diffusion from the 25% layer to the 50% layer is faster than that from the 50% layer to the 75% layer as seen in Figure 7b.
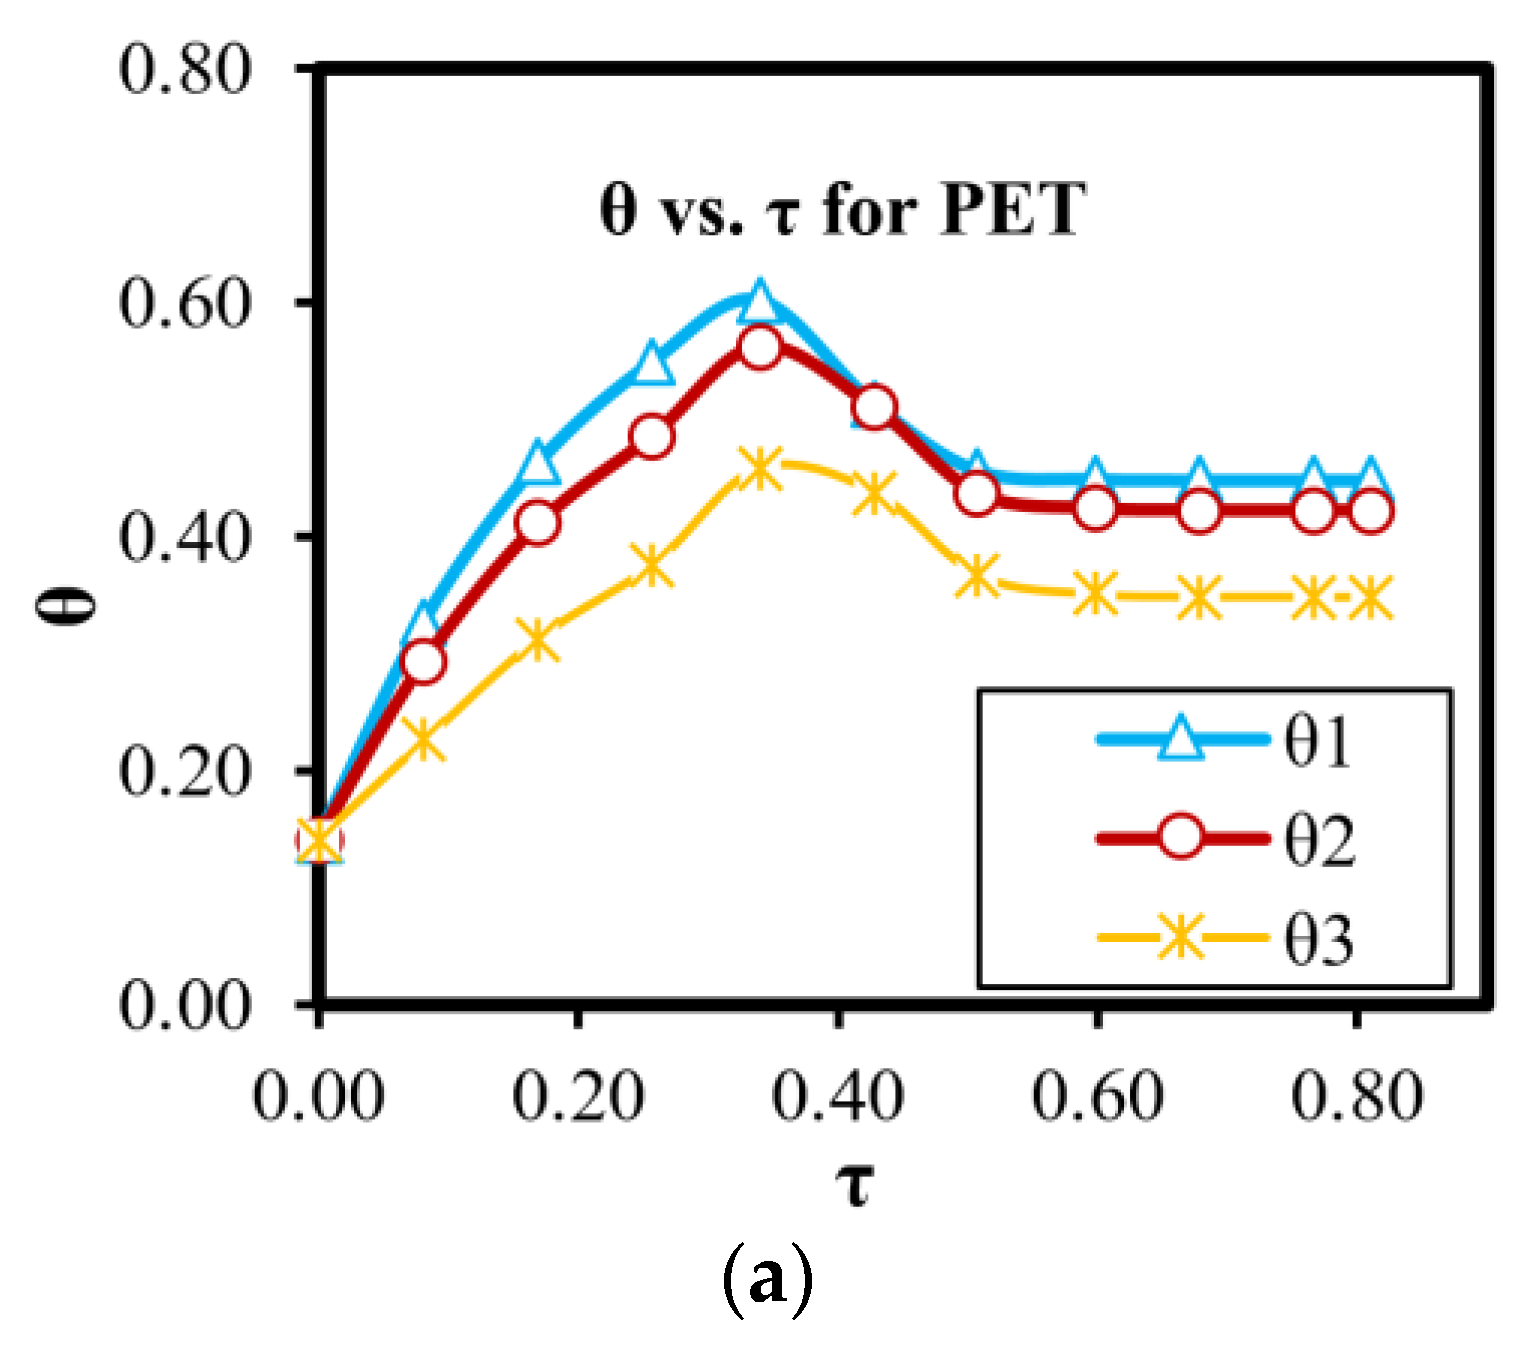
3.6. θ versus τ for Different Drying Materials
Aiming at studying the cumulative effect of all examined parameters on the cylinder drying process and giving more information on the cylinder drying process, the dimensionless time, τ, which was proposed by Nissan and Hansen [10], and the dimensionless temperature, θ, are adopted. The dimensionless time is presented by Equation (12), and the dimensionless temperature is calculated as follows:
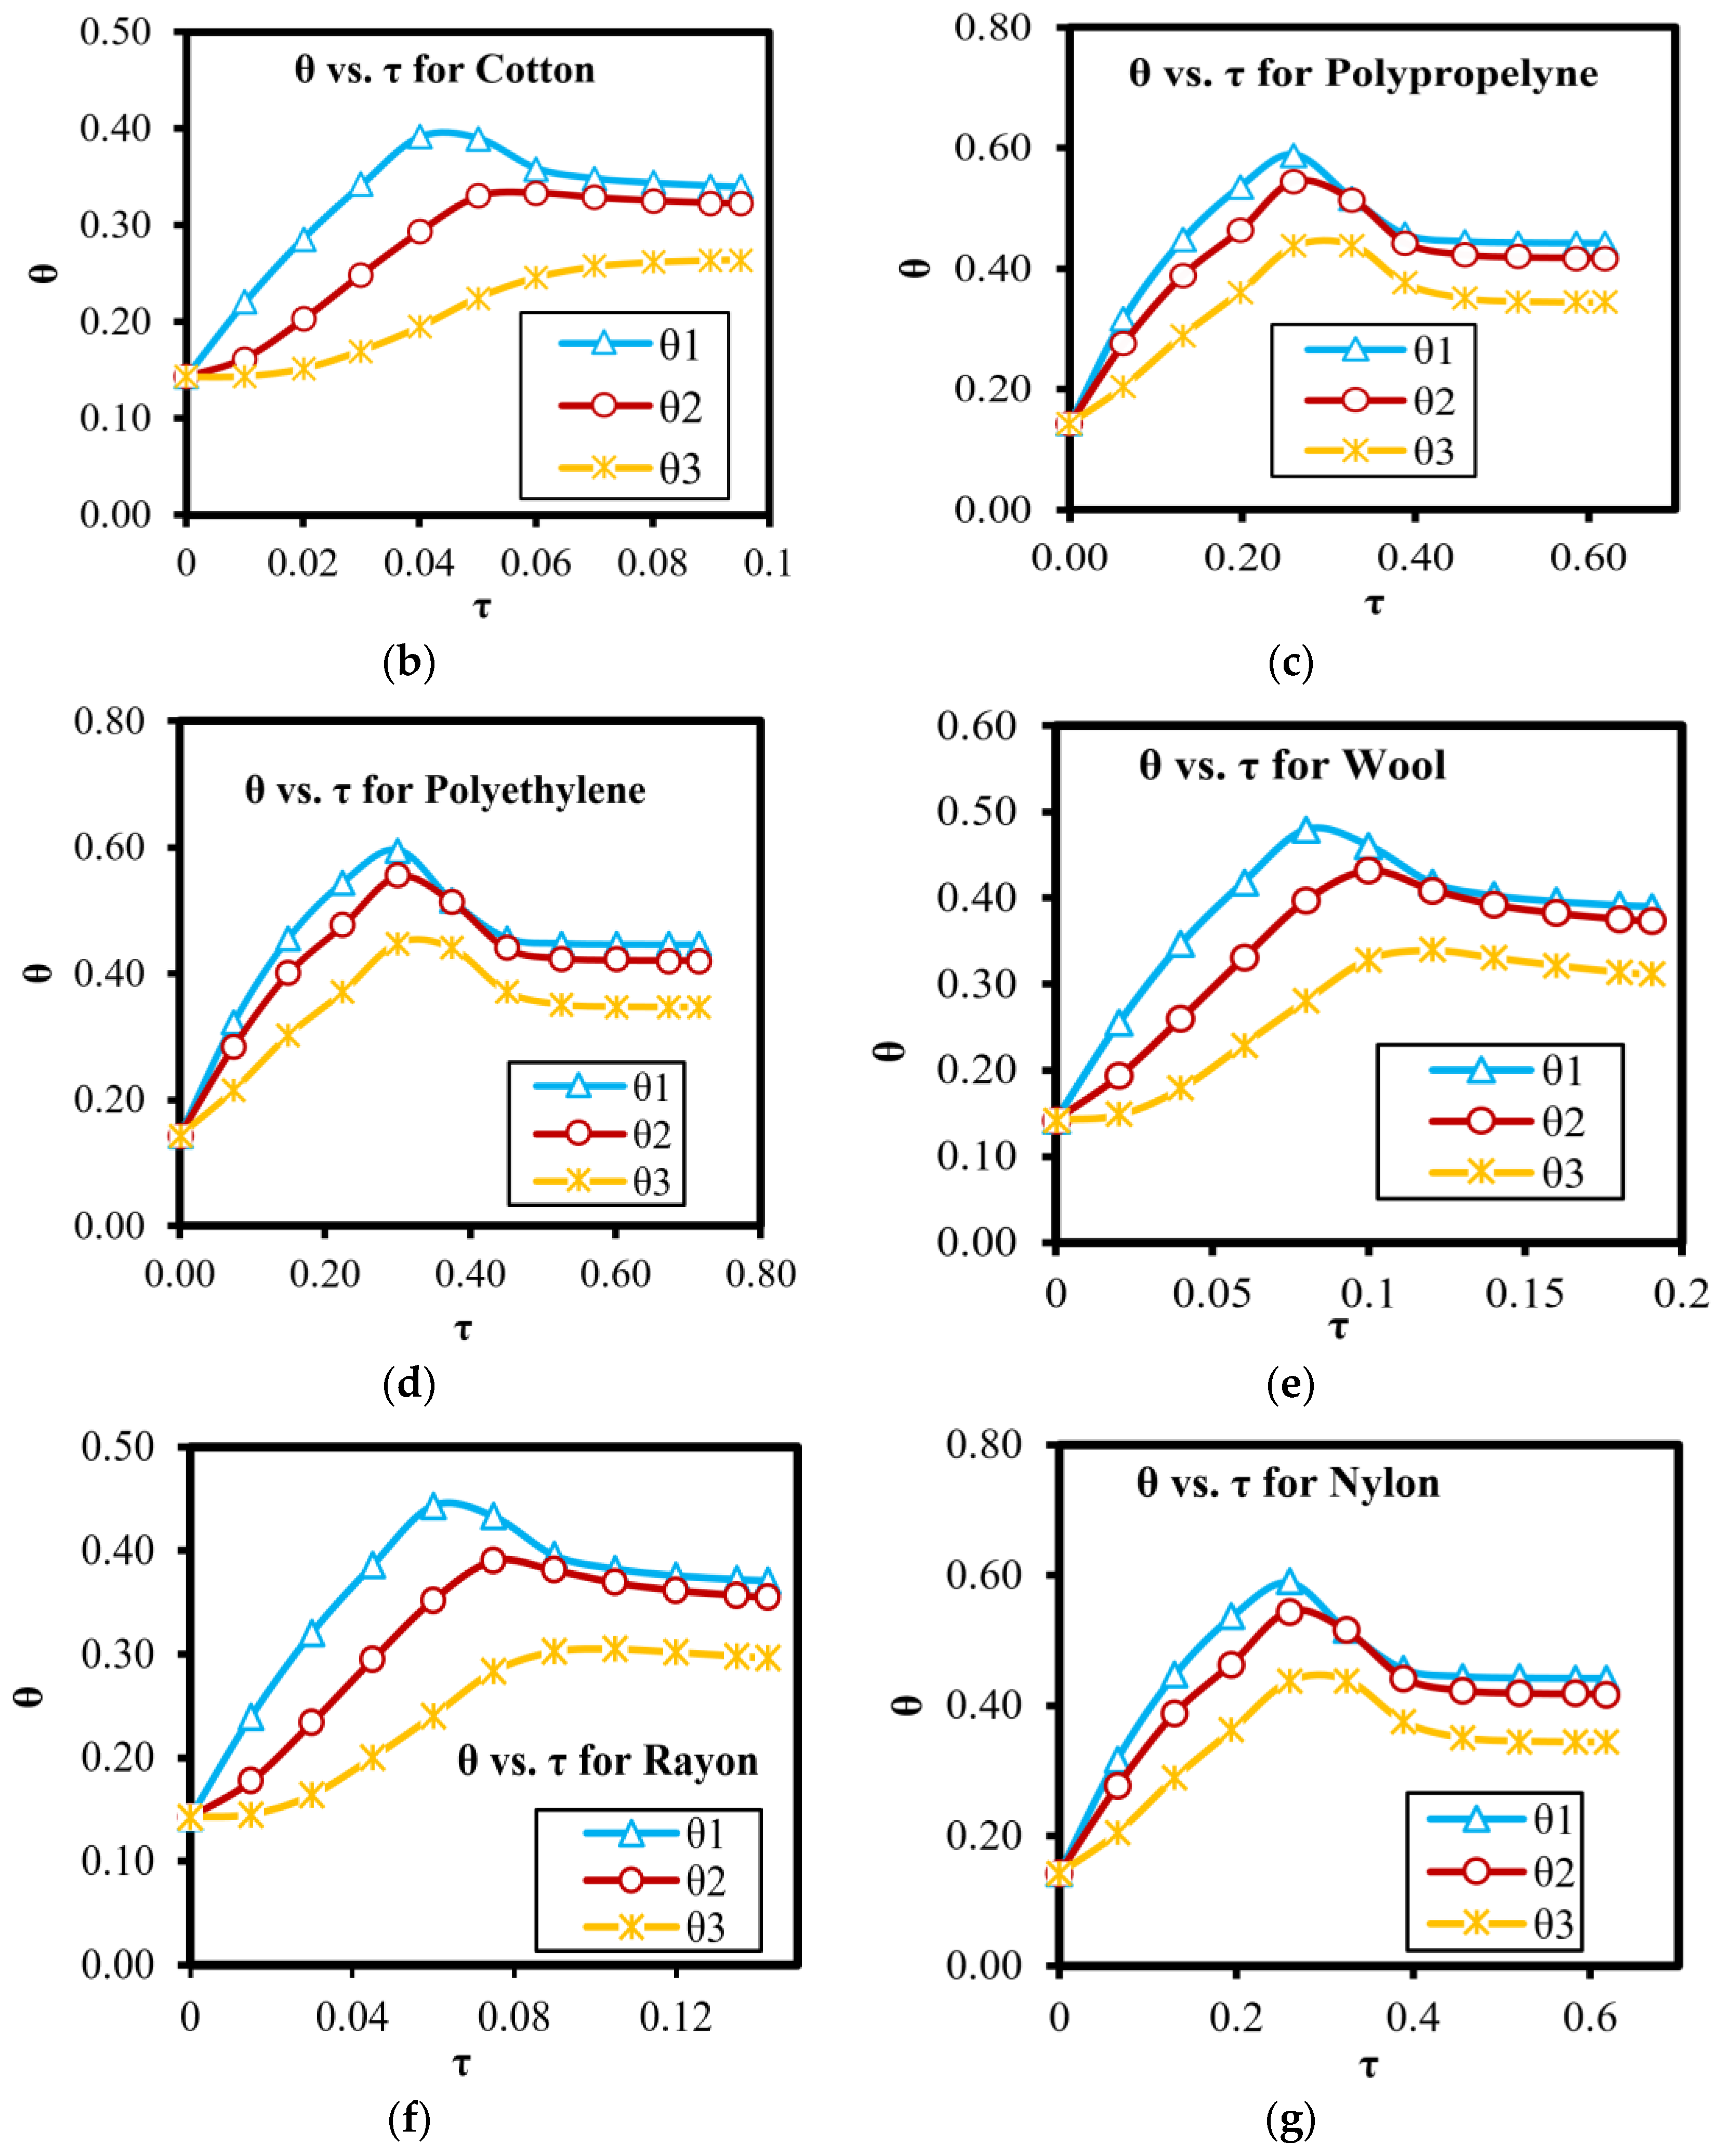
where θ is the dimensionless temperature, Tx is the temperature at the specified thickness of the drying materials, Tambient is the temperature of the ambient environment and Tc is the surface temperature of the cylinder. Figure 8a–g present the dimensionless temperature versus dimensionless time of three different dimensionless temperatures of θ1, θ2, and θ3 for seven different drying materials of PET, Cotton, Polypropylene, Polyethylene, Wool, Rayon, and Nylon, respectively. θ1, θ2, and θ3 stand for the layer thicknesses of 25%, 50%, and 75%, respectively.
Figure 8 shows that the dimensionless temperature increases with the increase in dimensionless time in phases I, II, and III, and it decreases with the increase in dimensionless time in phase IV. For all cases presented in Figure 8, it is found that the thermal diffusivity of the materials significantly affects the dimensionless temperature. Specifically, the dimensionless temperatures of materials with lower thermal diffusivities are not only lower than those of the higher thermal diffusivities but θ3 also decreased faster compared to those of the higher thermal diffusivities. The dominance of the convective heat transfer at the topmost layer and the limitations of the thermal diffusivity within the drying materials as discussed in Section 3.4 explain these phenomena.
4. Conclusions
In this work, various parametric influences on the drying process of a single-cylinder dryer are numerically investigated in detail. The examined parameters include seven drying materials of PET, Polyethylene, Polypropylene, Cotton, Wool, Rayon, and Nylon; five different contacting percentages between transport material and the cylinder of 50%, 60%, 70%, 80%, and 90%; six different feeding velocities consisting of 1.27 m/s, 2 m/s, 4 m/s, 6 m/s, 8 m/s, and 10 m/s; cylinder temperatures in the range from 100 °C to 150 °C; five different cylinder diameters consisting of 0.2 m, 0.4 m, 0.6 m, 0.8 m, and 1 m; three different drying material thicknesses of 1 mm, 2 mm, and 3 mm. Based on the aforementioned discussions, a summary can be drawn as follows:
- The drying process of a drying material with higher thermal diffusivity is faster than that with lower thermal diffusivity.
- The peak temperature of the drying material in a cylinder dryer with a larger contact percentage is higher than that of a smaller one. At the same contacting percentage, the peak temperature of the drying material decreases with the rise in drying material thickness.
- At the same examining layer and the same drying material thickness, the temperature of the examining layer with higher feeding velocity is increased faster than those of the lower feeding velocities; however, the peak temperature of a transport material with lower velocity is higher than those of the higher velocities.
- The decrease in temperature of the drying material at the examining layer of 50% of phase IV seems to be independent of the cylinder temperature, and the heat transfer between the central layer of the drying material to the ambient environment is limited by the thermal diffusivity of the drying material.
- The peak temperature of the drying material increases with the increase in cylinder diameter; however, when the cylinder diameter reaches a certain value, the peak temperature of the drying material is constant. Specifically, the maximum temperature is almost unchanged with the increase in the diameter from 0.4 m to 1 m.
Author Contributions
Conceptualization, J.-S.L. and C.-C.W.; methodology, A.S. and N.T.; software (coding), A.S.; software (simulation), Tran; validation, A.S., N.T., J.-S.L., and C.-C.W.; investigation, A.S.; data curation, A.S.; writing—original draft preparation, N.T.; writing—review and editing, C.-C.W.; supervision, C.-C.W. All authors have read and agreed to the published version of the manuscript.
Funding
Grant No.: 110-2622-E-A49-021 was funded by the National Science and Technology Council, Taiwan, and by the Bureau of Energy, Ministry of Economic Affairs, Taiwan.
Institutional Review Board Statement
The study was conducted in accordance with the Declaration of Helsinki, and approved by the Institutional Review Board.
Informed Consent Statement
Not applicable.
Data Availability Statement
Not applicable.
Acknowledgments
This work has been sponsored by the National Science and Technology Council, Taiwan, under contract number 110-2622-E-A49-021 and by the Bureau of Energy, Ministry of Economic Affairs, Taiwan. The supports are deeply appreciated.
Conflicts of Interest
The authors declare no conflict of interest.
References
- Dinçer, I.; Zamfirescu, C. Drying Phenomena: Theory and Applications; Wiley: Hoboken, NJ, USA, 2016. [Google Scholar]
- Haghi, A.K. Transport phenomena in porous media: A review. Theor. Found. Chem. Eng. 2006, 40, 14–26. [Google Scholar] [CrossRef]
- Fourt, L.; Sookne, A.M.; Frishman, D.; Harris, M. The Rate of Drying of Fabrics. Text. Res. J. 1951, 21, 26–33. [Google Scholar] [CrossRef]
- Majumder, A.S. (Ed.) Handbook of Industrial Drying, 4th ed.; CRC Press: Boca Raton, FL, USA, 2015. [Google Scholar]
- Bejan, A.; Dincer, I.; Lorente, S.; Miguel, A.F.; Reis, A.H. Porous and Complex Flow Structures in Modern Technologies; Springer: New York, NY, USA, 2004. [Google Scholar]
- Chen, B.X.; Man, Y.; Zheng, Q.F.; Hu, Y.S.; Li, J.G.; Hong, M.N. Industrial verification of energy saving for the single-tier cylinder based paper drying process. Energy 2019, 170, 261–272. [Google Scholar] [CrossRef]
- Roonprasang, K. Thermal Analysis of Multi-Cylinder Drying Section with Variant Geometry. Ph.D. Thesis, Technischen Universität Dresden, Dresden, Germany, 2008. [Google Scholar]
- Ghosh, A.K. Fundamentals of Paper Drying—Theory and Application from Industrial Perspective. In Evaporation, Condensation and Heat transfer, 1st ed.; IntechOpen: London, UK, 2011. [Google Scholar]
- Kong, L.; Liu, H. A Static Energy Model of Conventional Paper Drying for Multicylinder Paper Machines. Dry. Technol. 2012, 30, 276–296. [Google Scholar] [CrossRef]
- Nissan, A.H.; Hansen, D. Heat and mass transfer transients in cylinder drying: Part, I. Unfelted cyclinders. AIChE J. 1960, 6, 606–611. [Google Scholar] [CrossRef]
- Hii, C.L.; Ong, S.P.; Yap, J.Y.; Putranto, A.; Mangindaan, D. Hybrid drying of food and bioproducts: A review. Dry. Technol. 2021, 39, 1554–1576. [Google Scholar] [CrossRef]
- Putranto, A.; Chen, X.D. A new model to predict diffusive self-heating during composting incorporating the reaction engineering approach (REA) framework. Bioresour. Technol. 2017, 232, 211–221. [Google Scholar] [CrossRef] [PubMed] [Green Version]
- Putranto, A.; Chen, X.D. Reaction engineering approach modeling of intensified drying of fruits and vegetables using microwave, ultrasonic and infrared-heating. Dry. Technol. 2020, 38, 747–757. [Google Scholar] [CrossRef]
- Putranto, A.; Chen, X.D. Vacuum drying of food materials modeled and explored using the reaction engineering approach (REA) framework. Dry. Technol. 2021, 40, 2519–2527. [Google Scholar] [CrossRef]
- Compaore, A.; Dissa, A.O.; Rogaume, Y.; Putranto, A.; Chen, X.D.; Mangindaan, D.; Zoulalian, A.; Rémond, R.; Tiendrebeogo, E. Application of the reaction engineering approach (REA) for modeling of the convective drying of onion. Dry. Technol. 2016, 35, 500–508. [Google Scholar] [CrossRef]
- Yang, S.; Liu, T.; Fu, N.; Xiao, J.; Putranto, A.; Chen, X.D. Convective drying of highly shrinkable vegetables: New method on obtaining the parameters of the reaction engineering approach (REA) framework. J. Food Eng. 2021, 305, 110613. [Google Scholar] [CrossRef]
- Heo, C.H.; Cho, H.; Yeo, Y.K. Dynamic modeling of paper drying processes. Korean J. Chem. Eng. 2011, 28, 1651–1657. [Google Scholar] [CrossRef]
- Keränen, J. Increasing the Drying Efficiency of Cylinder Drying. PhD. Thesis, University of Jyväskylä, Jyväskylä, Finland, 2011. [Google Scholar]
- Wilhelmsson, B.; Nilsson, L.; Stenstram, S.; Wimmerstedt, R. Simulation Models of Multi-Cylinder Paper Drying. Dry. Technol. 2007, 11, 1177–1203. [Google Scholar] [CrossRef]
- Ramaswamy, S.; Holm, R.A. Analysis of heat and mass transfer during drying of paper/board. Dry. Technol. 1999, 17, 49–72. [Google Scholar] [CrossRef]
- The Institute of Paper Chemsitry. A Review of the State of the Art in Paper Drying; Progress Report; The Institute of Paper Chemsitry: Appleton, WI, USA, 29 February 1980; pp. 1–29. [Google Scholar]
- Ghodbanan, S.; Alizadeh, R.; Shafiei, S. Steady-State Modeling of Multi-Cylinder Dryers in a Corrugating Paper Machine AU—Ghodbanan, Shaaban. Dry. Technol. 2015, 33, 1474–1490. [Google Scholar] [CrossRef]
- Helena, L.; Sousa, C.D.; Lima, O.C.M.; Pereira, N.C. Analysis of drying kinetics and moisture distribution in convective textile fabric drying. Dry. Technol. 2006, 24, 485–497. [Google Scholar]
- Ryan, M.; Modak, A.; Zuo, H.; Ramaswamy, S.; Worry, G. Through air drying. Dry. Technol. 2003, 21, 719–734. [Google Scholar] [CrossRef]
- Hsieh, Y.-L. Chemical structure and properties of cotton. In Cotton: Science and Technology; Woodhead Publishing: Cambridge, UK, 2007; pp. 3–34. [Google Scholar]
- Bradbury, J. The Morphology And Chemical Structure Of Wool. Pure Appl. Chem. 1976, 46, 247–253. [Google Scholar] [CrossRef]
- Ward, I.M. The Molecular Structure and Mechanical Properties of Polyethylene Terephthalate Fibers. Text. Res. J. 1961, 31, 650–664. [Google Scholar] [CrossRef]
- Du, X.; Li, Z.; Tong, T.; Li, B.; Liu, H. Isothermal Drying Process and its Effect on Compressive Strength of Concrete in Multiscale. Appl. Sci. 2019, 9, 4015. [Google Scholar] [CrossRef] [Green Version]
- Rzig, R.; Khedher, N.B.; Nasrallah, S.B. Three-Dimensional Simulation of Mass and Heat Transfer in Drying Unsaturated Porous Medium. Heat Transf. Res. 2017, 48, 985–1005. [Google Scholar] [CrossRef]
- Momen, A.M.; Patel, V.K.; Gluesenkamp, K.R.; Erdman, D., III; Kiggans, J., Jr.; Ormston, G. Fabric properties and electric efficiency limits of mechanical moisture extraction from fabrics. Dry. Technol. 2021, 1–17. [Google Scholar] [CrossRef]
Figure 1.
Phases in a computational model [10]. (a) A 3D drum dryer [10]; (b) A schematic diagram of the drum dryer [10]; (c) A schematically phased map of the drying drum; (d) A computational model.
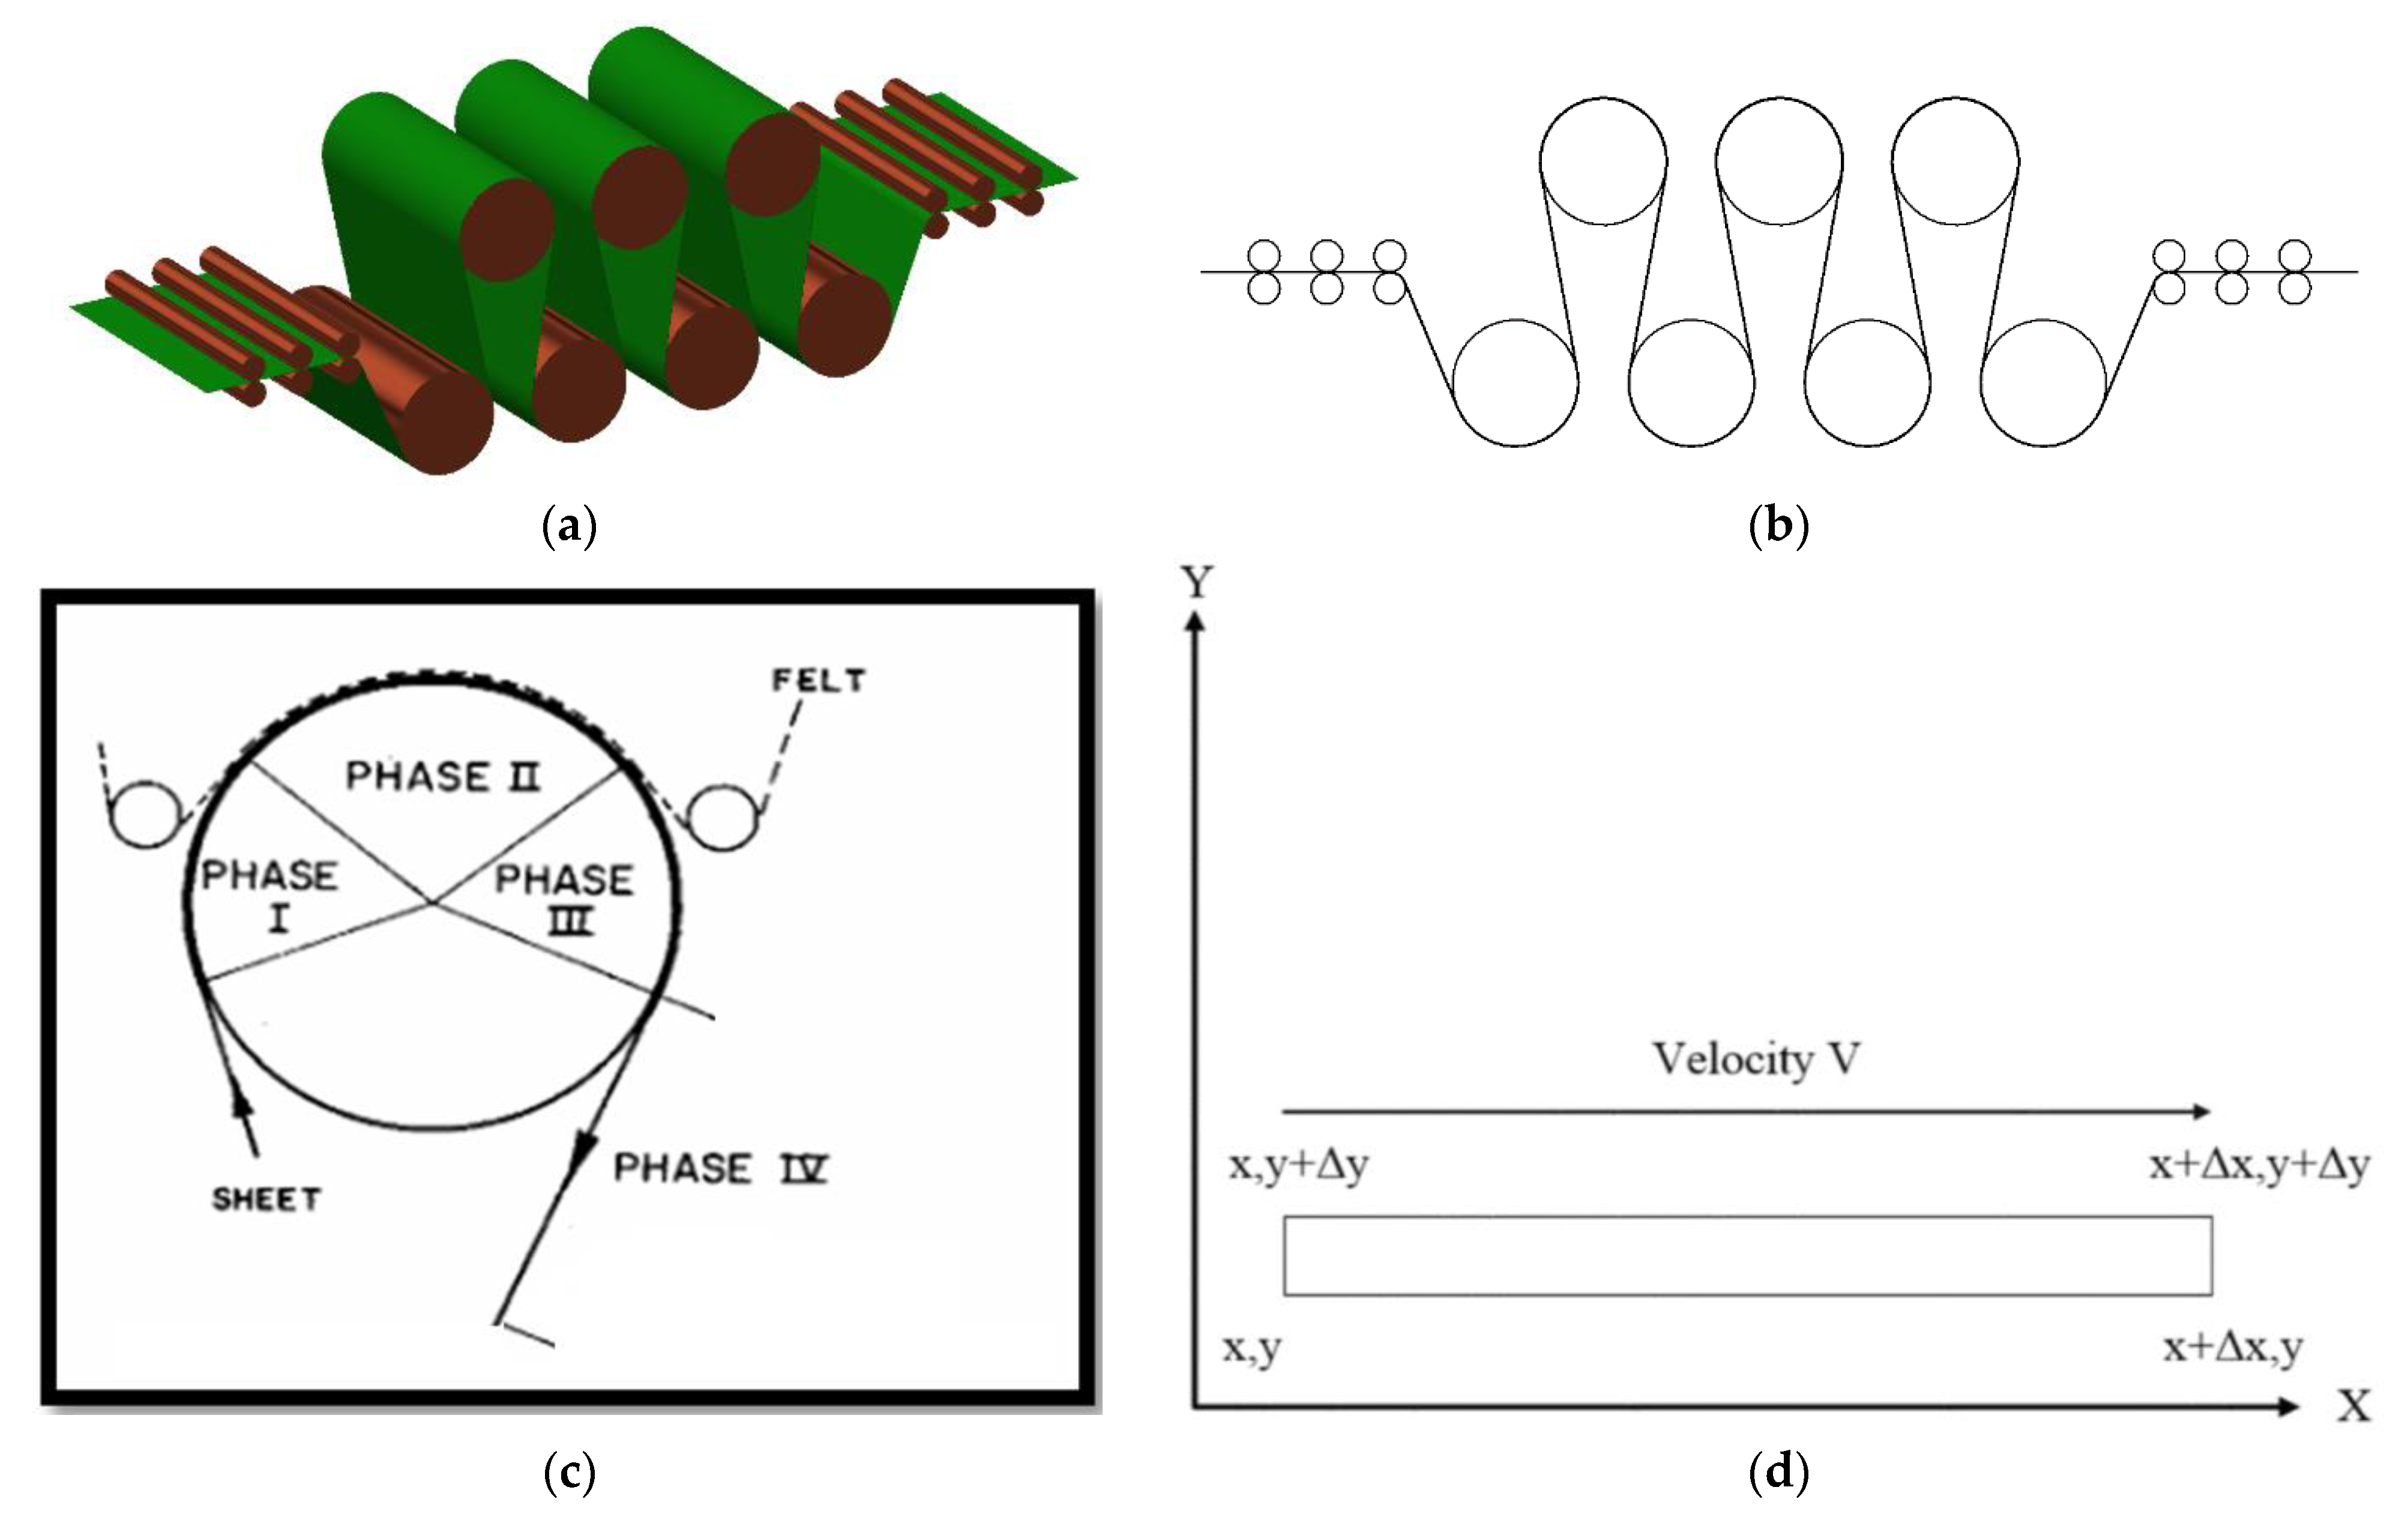
Figure 2.
A comparison between present numerical data and test results reported by Nissan [10].
Figure 2.
A comparison between present numerical data and test results reported by Nissan [10].
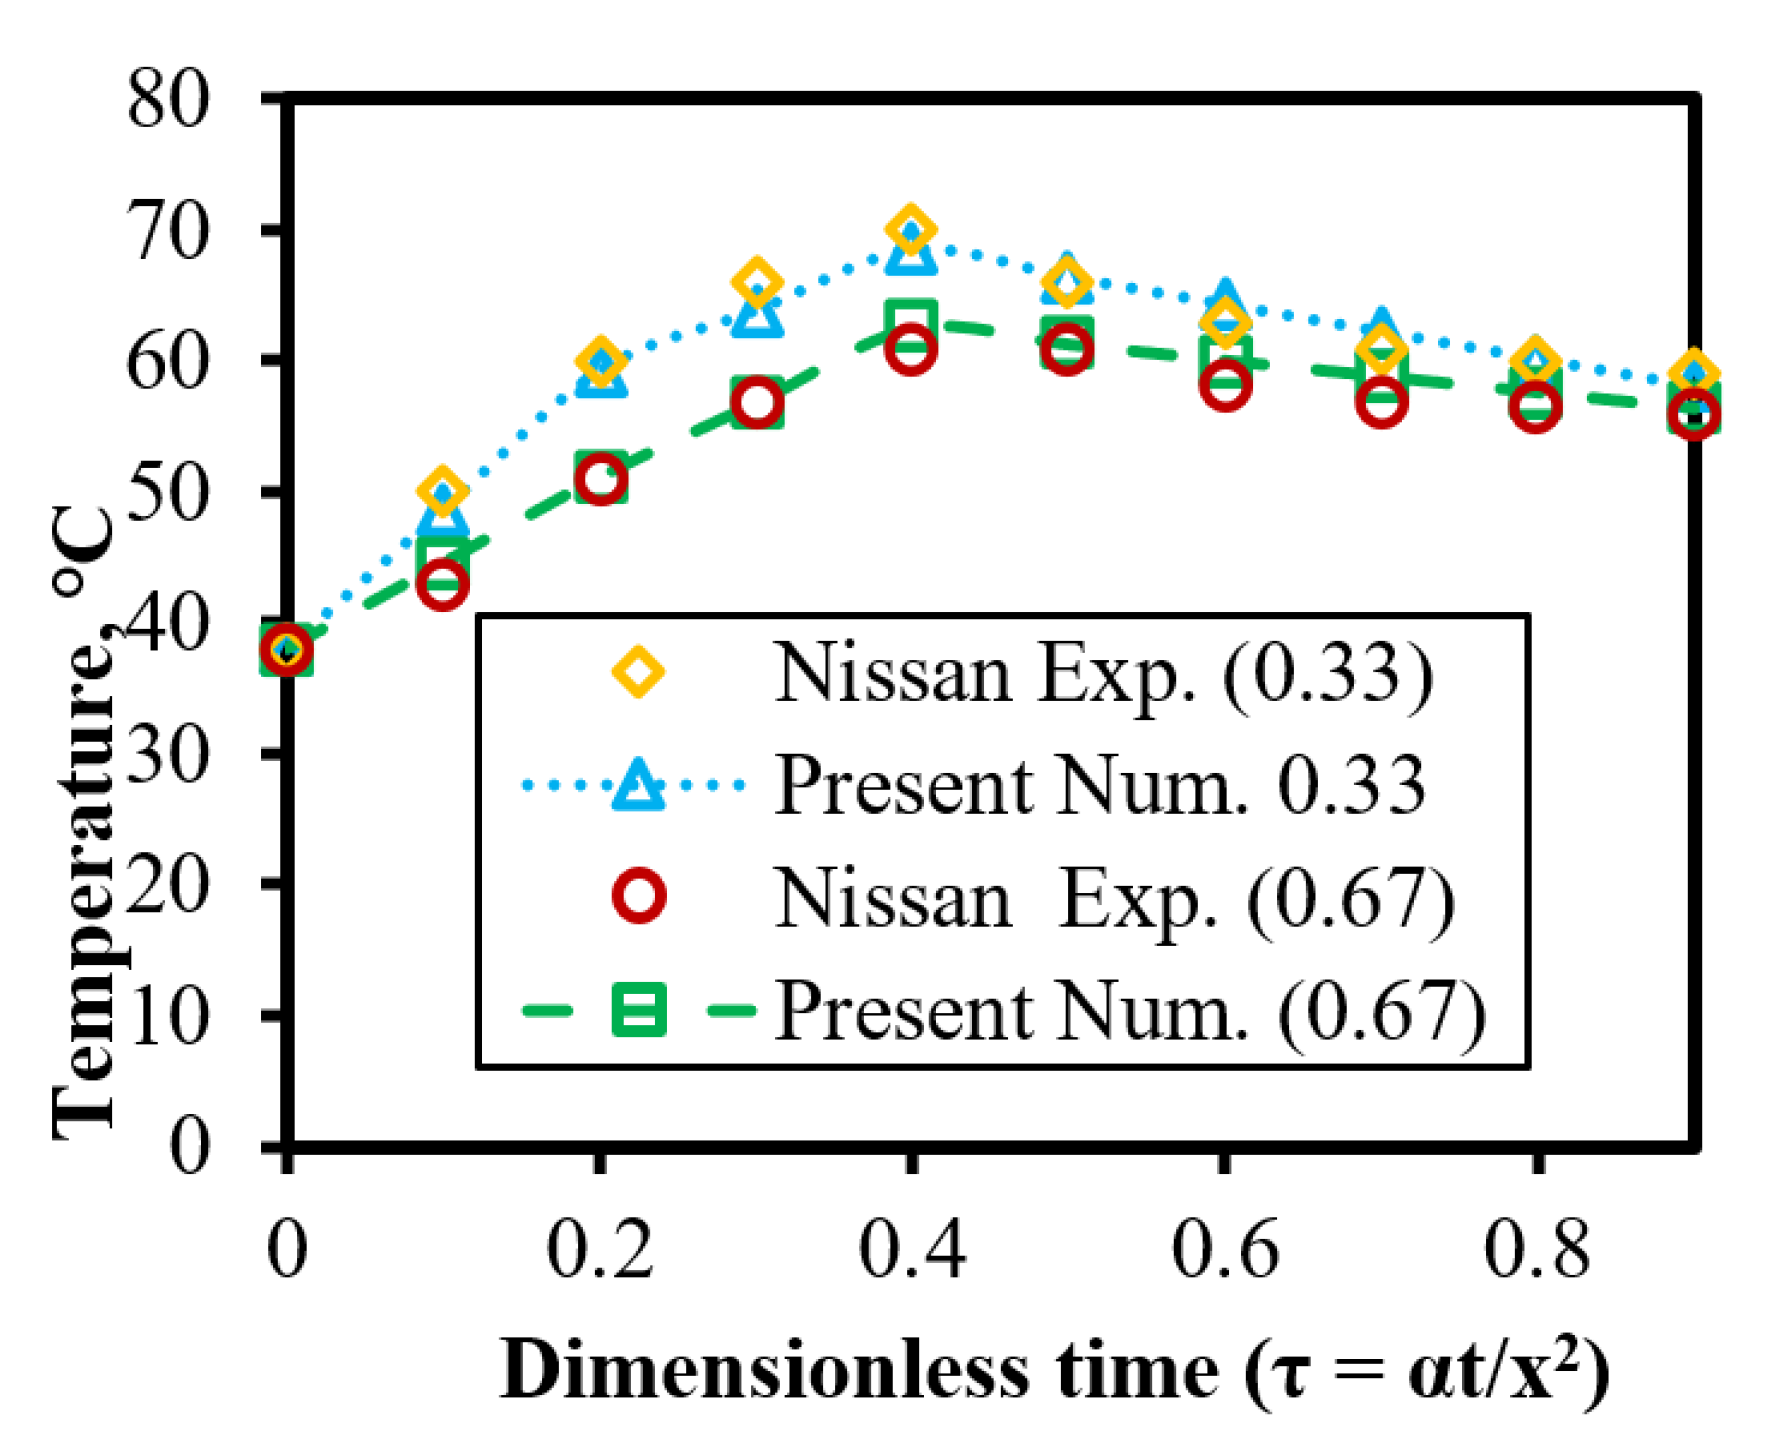
Figure 3.
Temperature vs. time subject to different drying materials. (a) Temperature vs. time for different drying materials at a layer of 12.5%. (b) Temperature vs. time for different drying materials at a layer of 50%. (c) Temperature vs. time for different drying materials at a layer of 87.5%. (d) Temperature profiles of three different materials. (e) Temperature profiles of three different materials.
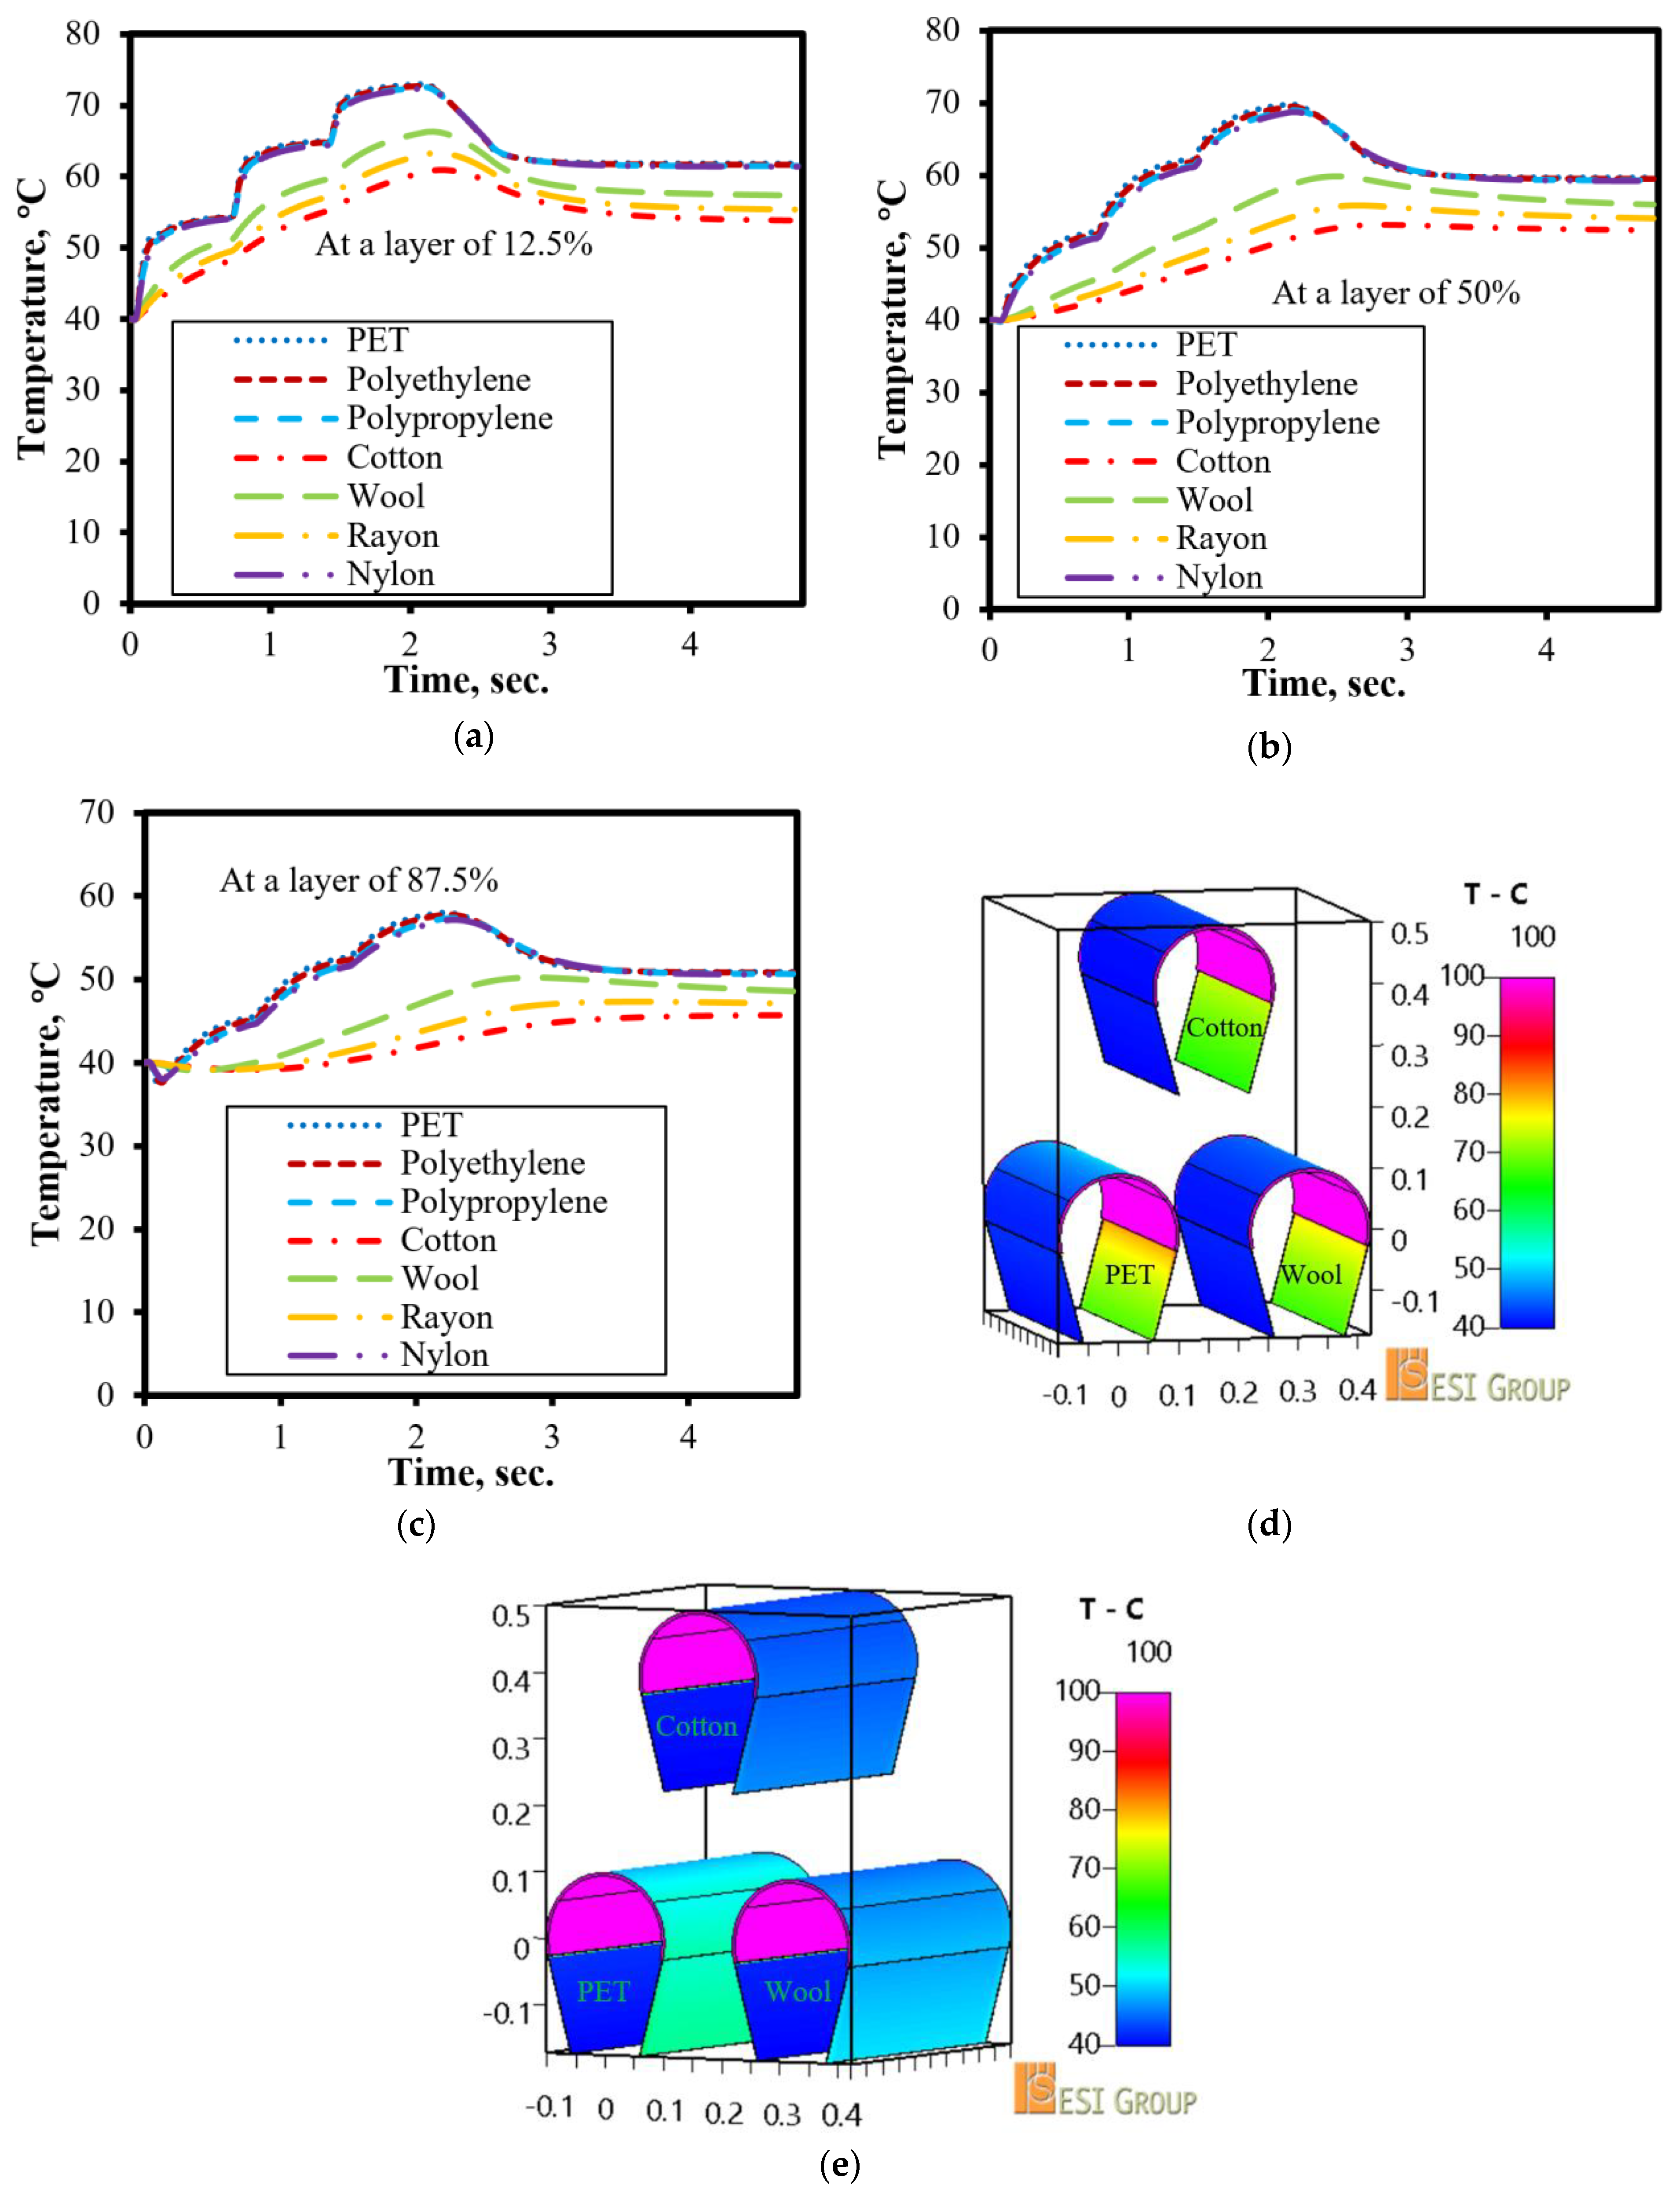
Figure 4.
Temperature vs. time subject to the different contacting percentage. (a) Temperature vs. time at a layer of 50% of different contacting percentages. (b) Temperature vs. time at a layer of 50% of different contacting percentages. (c) Temperature vs. time of a contacting layer of 70% at different layers and thicknesses of material. (d) Temperature profiles of different contacting percentages. (e) Temperature profiles of different contacting percentages.


Figure 5.
Temperature vs. time subject to different feeding velocities. (a) Temperature vs. time at a layer of 50% subject to different feeding velocities of 1 mm material. (b) Temperature vs. time at a layer of 50% subject to different feeding velocities of 2 mm material. (c) Temperature vs. time at a layer of 50% subject to different feeding velocities of 3 mm material. (d) Temperature vs. time at a feeding velocity of 4 m/s of different layers and thicknesses of materials. (e) Velocity profiles of different feeding velocities. (f) Temperature profiles of different feeding velocities.
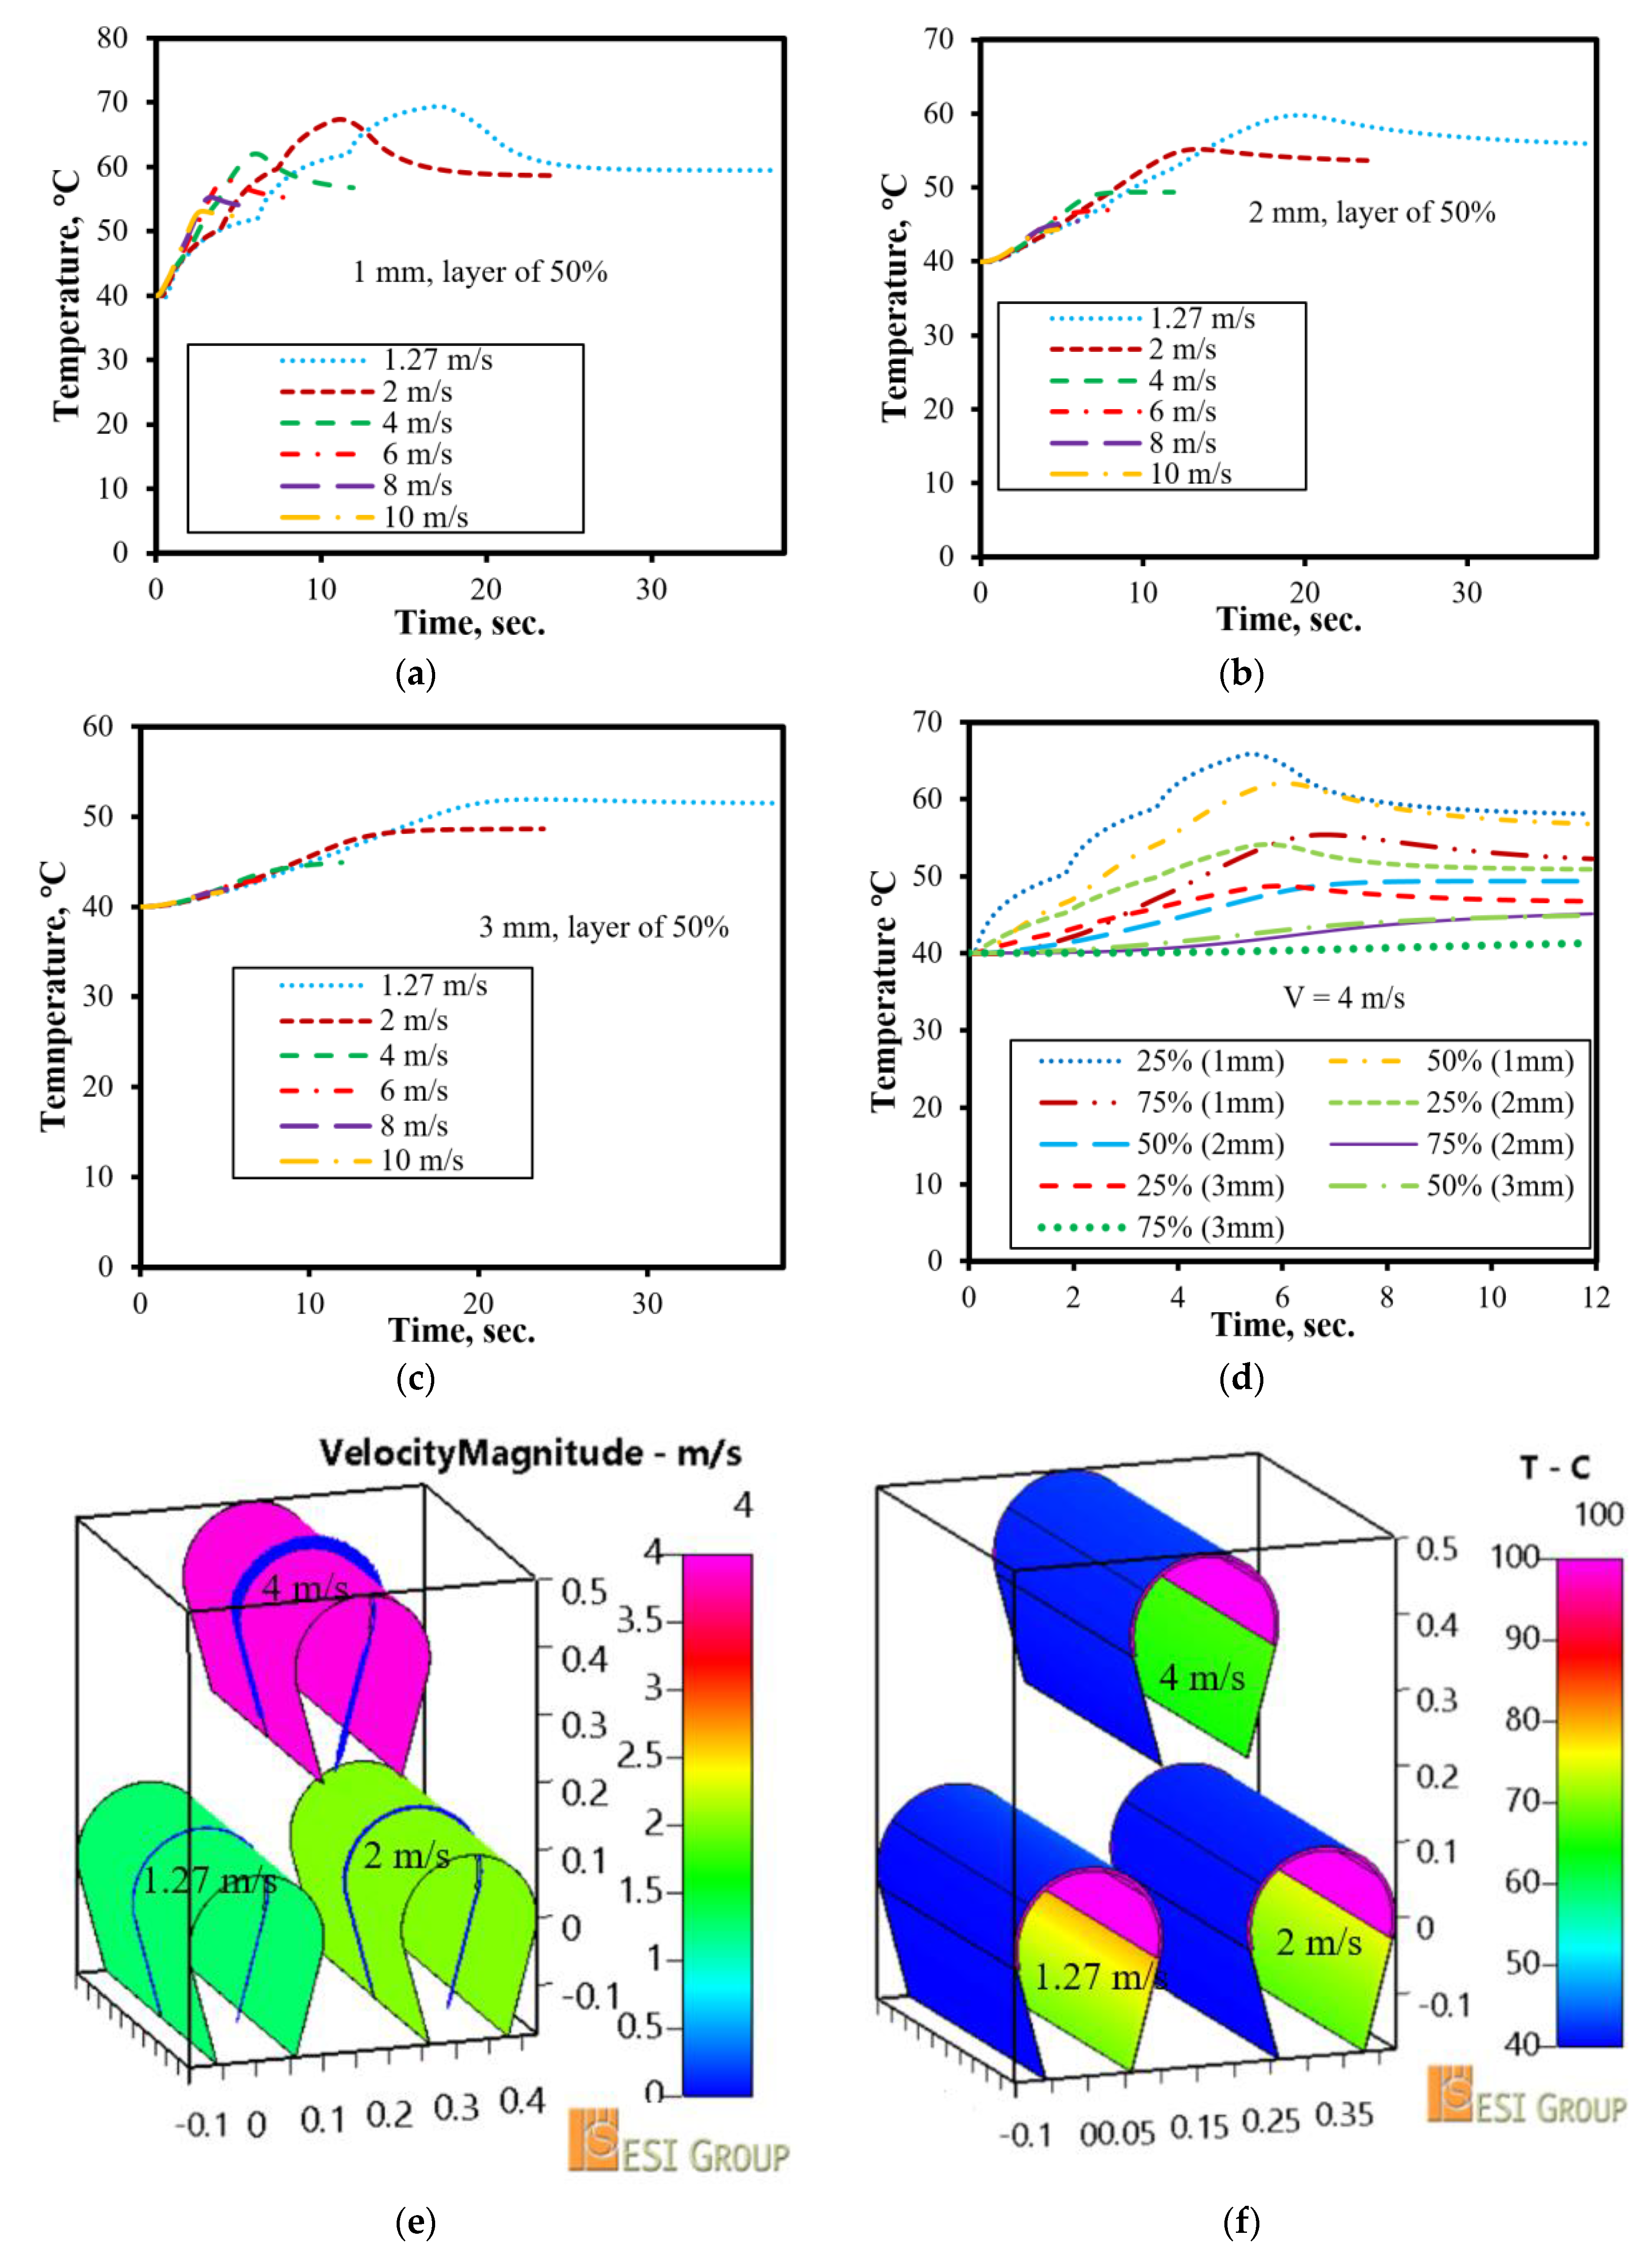
Figure 6.
Temperature vs. time subject to cylinder temperatures, layers, and thicknesses. (a) Temperature vs. time at a layer of 50%, 1 mm thickness, and velocity of 2 m/s for different cylinder temperatures. (b) Temperature vs. time of 2 mm thickness, and velocity of 2 m/s at different layers and cylinder temperatures. (c) Temperature profiles of different cylinder temperature. (d) Temperature profiles of different cylinder temperature.
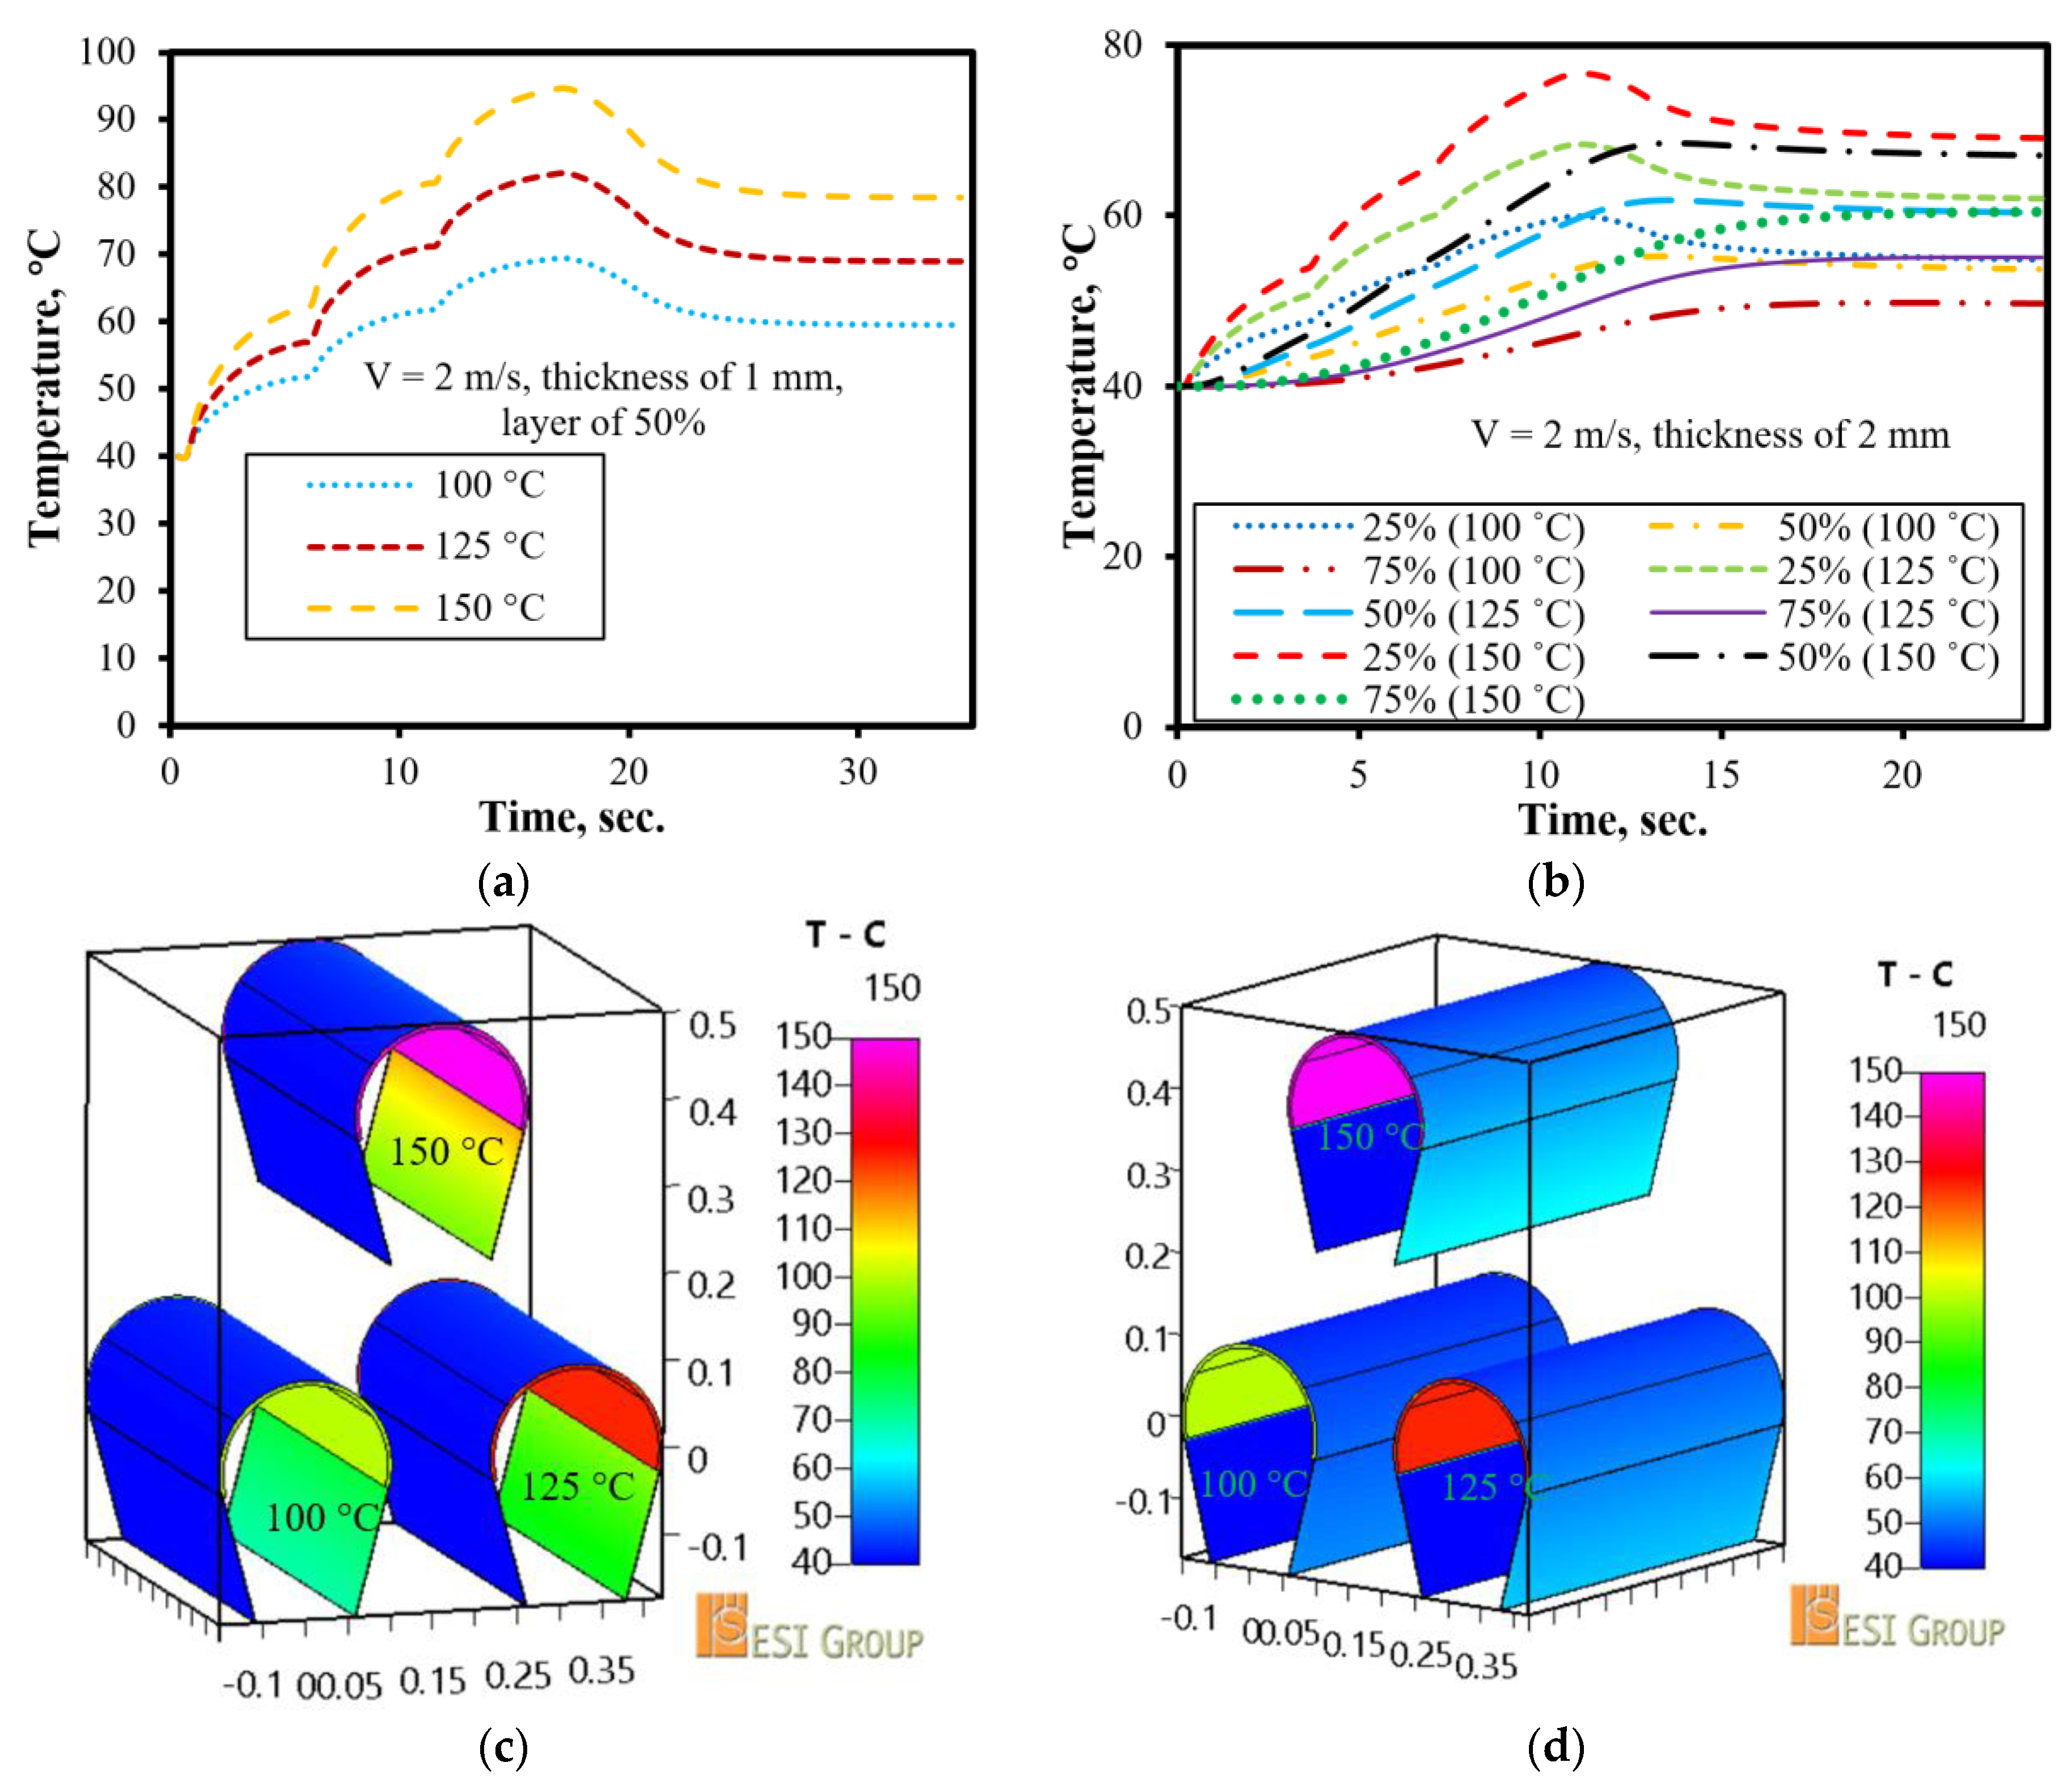
Figure 7.
Temperature vs. time subjected to diameter length and layer thickness. (a) Temperature vs. time at a layer of 50%, 1 mm thickness, and velocity of 1.27 m/s for different cylinder diameters. (b) Temperature vs. time of 1 mm thickness, and velocity of 1.27 m/s for different layers. (c) Velocity profiles of different cylinder diameters. (d) Temperature profiles of different cylinder diameters.
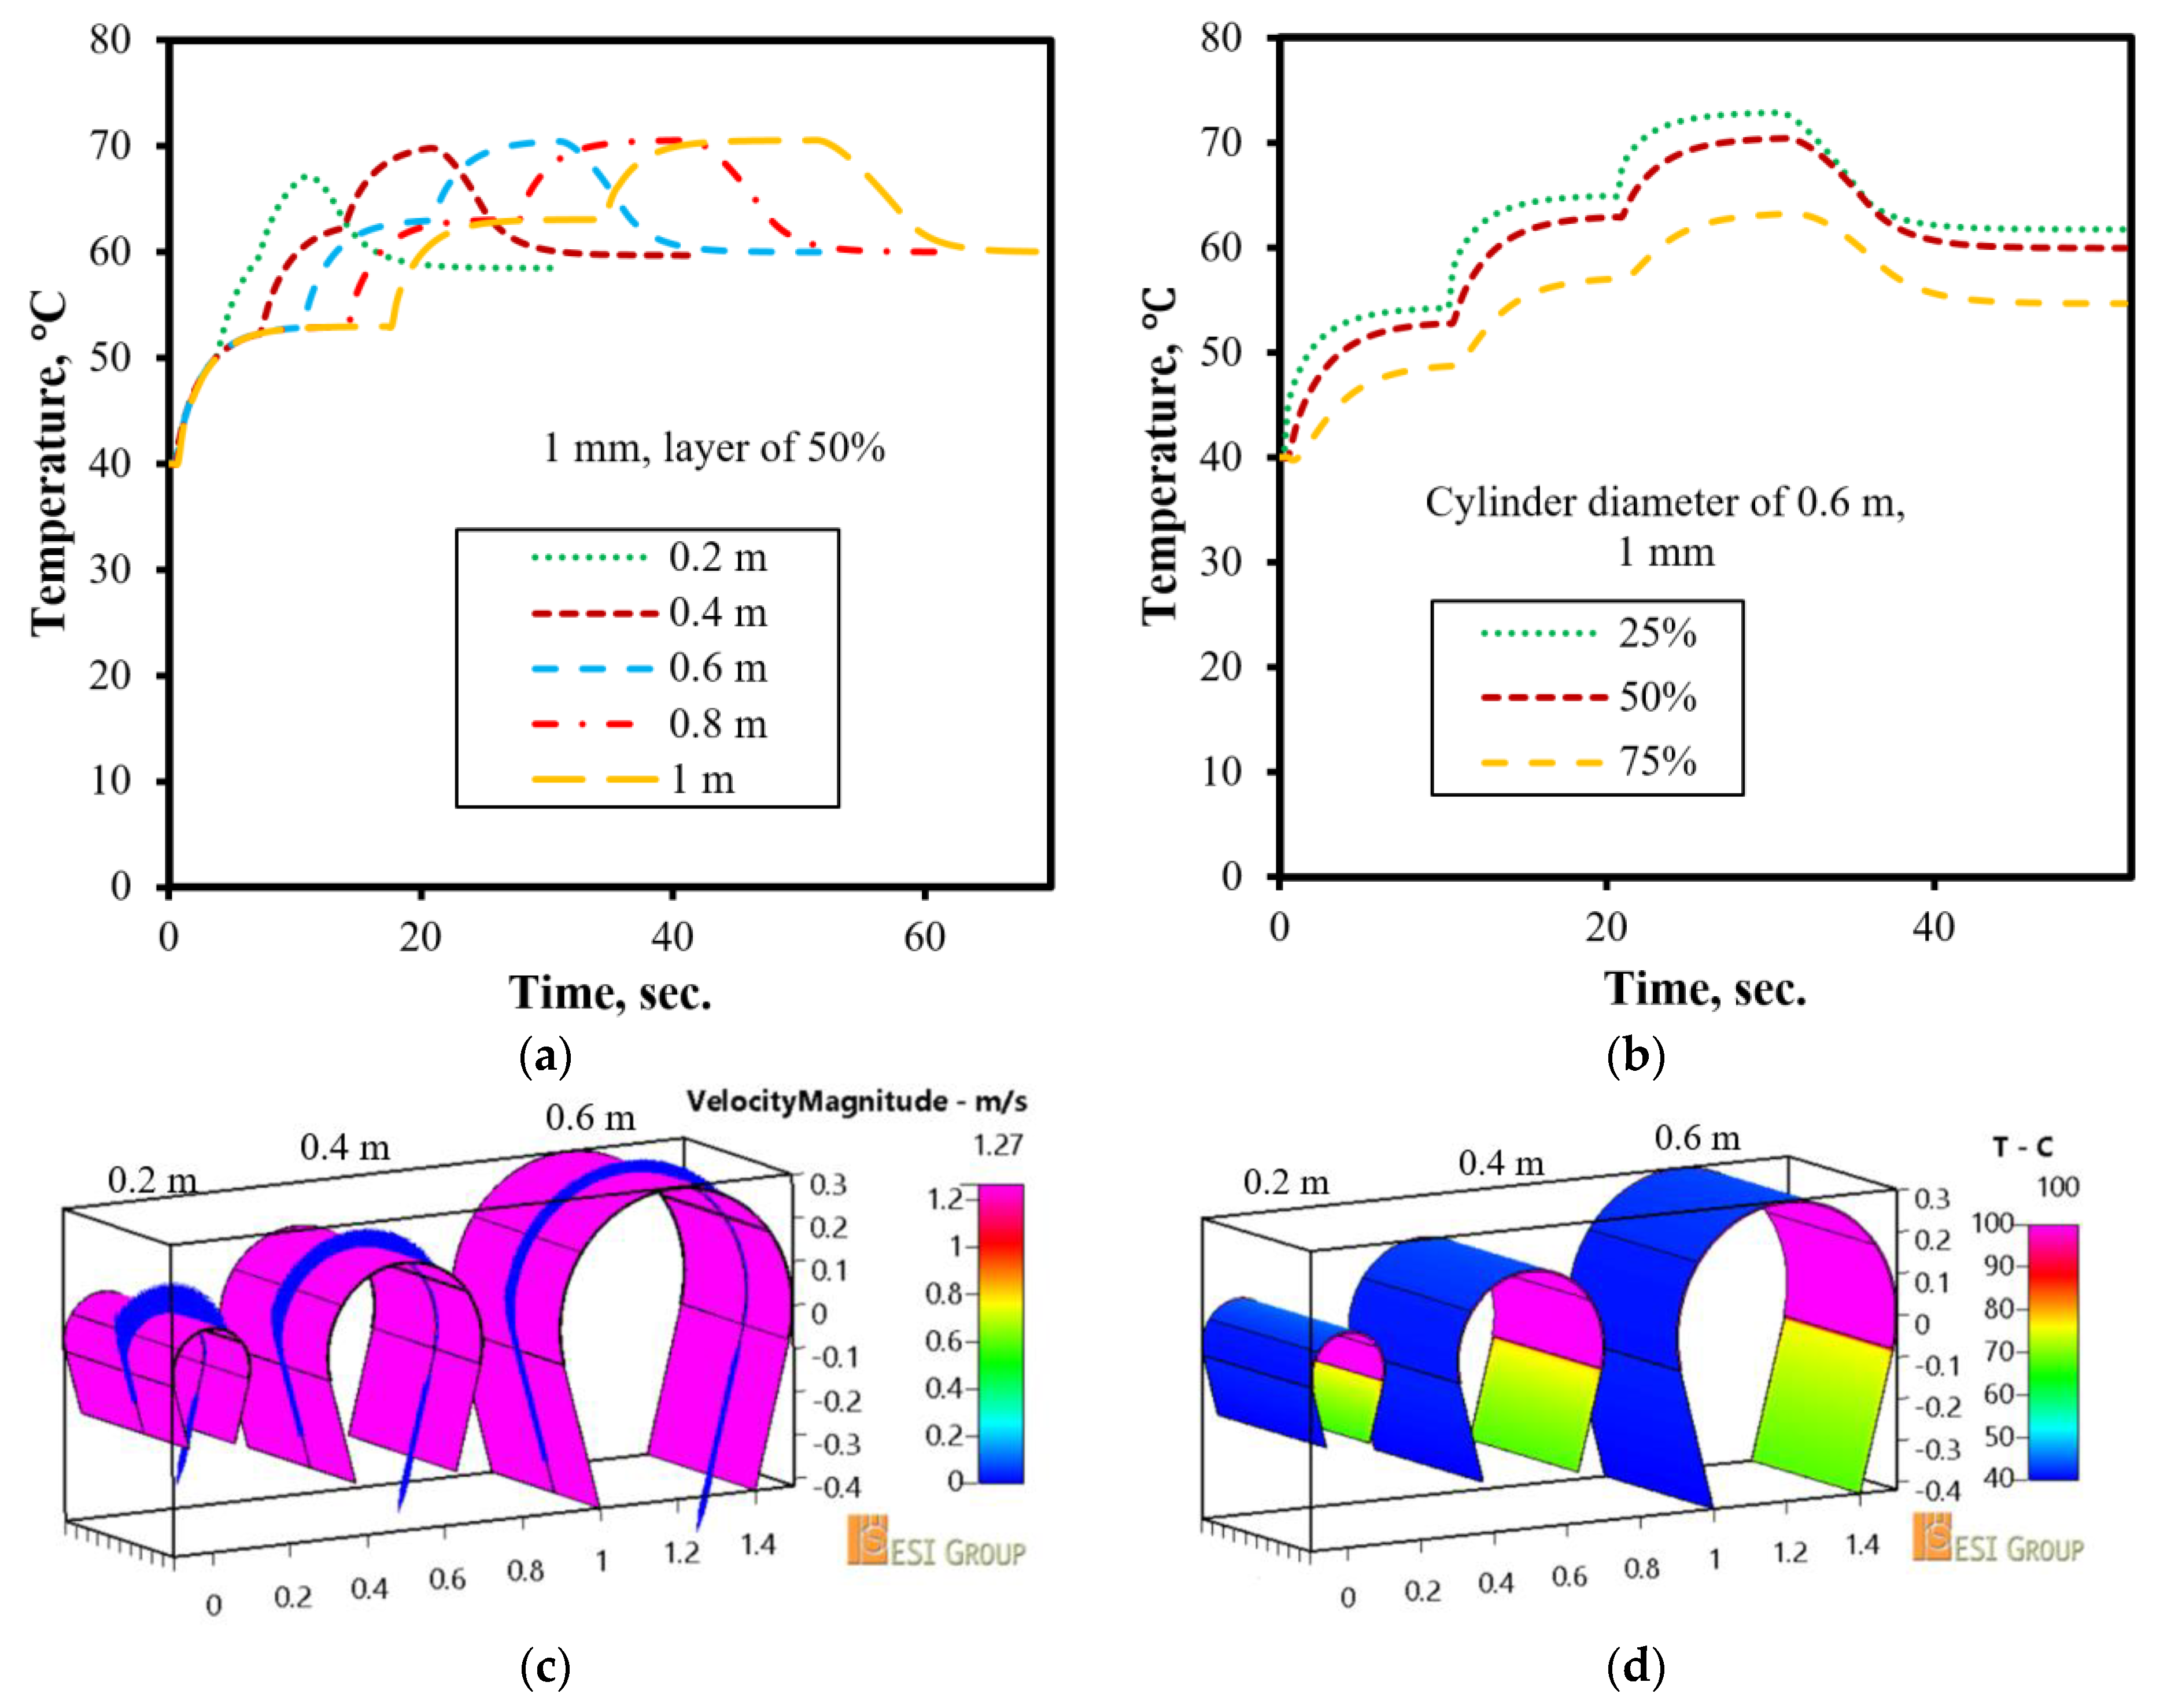
Figure 8.
θ vs. τ for various drying materials. (a) θ vs. τ for PET at three different layers. (b) θ vs. τ for Cotton at three different layers. (c) θ vs. τ for Polypropylene at three different layers. (d) θ vs. τ for Polyethylene at three different layers. (e) θ vs. τ for Wool at three different layers. (f) θ vs. τ for Rayon at three different layers. (g) θ vs. τ for Nylon at three different layers.
Publisher’s Note: MDPI stays neutral with regard to jurisdictional claims in published maps and institutional affiliations. |
© 2022 by the authors. Licensee MDPI, Basel, Switzerland. This article is an open access article distributed under the terms and conditions of the Creative Commons Attribution (CC BY) license (https://creativecommons.org/licenses/by/4.0/).
Share and Cite
MDPI and ACS Style
Tran, N.; Sengupta, A.; Liaw, J.-S.; Wang, C.-C. Parametric Analysis of Cylinder Drying Process in Association with Various Materials. Appl. Sci. 2022, 12, 10489. https://doi.org/10.3390/app122010489
AMA Style
Tran N, Sengupta A, Liaw J-S, Wang C-C. Parametric Analysis of Cylinder Drying Process in Association with Various Materials. Applied Sciences. 2022; 12(20):10489. https://doi.org/10.3390/app122010489
Chicago/Turabian StyleTran, Ngoctan, Akash Sengupta, Jane-Sunn Liaw, and Chi-Chuan Wang. 2022. "Parametric Analysis of Cylinder Drying Process in Association with Various Materials" Applied Sciences 12, no. 20: 10489. https://doi.org/10.3390/app122010489
Note that from the first issue of 2016, this journal uses article numbers instead of page numbers. See further details here.