
A Fingerprint-Based Verification Framework Using Harris and SURF Feature Detection Algorithms


1
Faculty of Computers and Artificial Intelligence, Sohag University, Sohag 82524, Egypt
2
Institute for Information Technology and Communications (IIKT), Otto-von-Guericke-University Magdeburg, 39106 Magdeburg, Germany
*
Authors to whom correspondence should be addressed.
Appl. Sci. 2022, 12(4), 2028; https://doi.org/10.3390/app12042028
Submission received: 29 December 2021
/
Revised: 31 January 2022
/
Accepted: 4 February 2022
/
Published: 15 February 2022
(This article belongs to the Topic Artificial Intelligence in Sensors)
Abstract
:Amongst all biometric-based personal authentication systems, a fingerprint that gives each person a unique identity is the most commonly used parameter for personal identification. In this paper, we present an automatic fingerprint-based authentication framework by means of fingerprint enhancement, feature extraction, and matching techniques. Initially, a variant of adaptive histogram equalization called CLAHE (contrast limited adaptive histogram equalization) along with a combination of FFT (fast Fourier transform), and Gabor filters are applied to enhance the contrast of fingerprint images. The fingerprint is then authenticated by picking a small amount of information from some local interest points called minutiae point features. These features are extracted from the thinned binary fingerprint image with a hybrid combination of Harris and SURF feature detectors to render significantly improved detection results. For fingerprint matching, the Euclidean distance between the corresponding Harris-SURF feature vectors of two feature points is used as a feature matching similarity measure of two fingerprint images. Moreover, an iterative algorithm called RANSAC (RANdom SAmple Consensus) is applied for fine matching and to automatically eliminate false matches and incorrect match points. Quantitative experimental results achieved on FVC2002 DB1 and FVC2000 DB1 public domain fingerprint databases demonstrate the good performance and feasibility of the proposed framework in terms of achieving average recognition rates of 95% and 92.5% for FVC2002 DB1 and FVC2000 DB1 databases, respectively.
1. Introduction
Today, in the world of advanced digital technology, there is an increasing need for security measures that lead to the development of many biometric-based personal authentication systems. Biometrics is a unique identification science for humans based on essential behavioral or physical features. Among all biometrics, the fingerprint is the most commonly utilized biometric on personal identification systems. Additionally, fingerprint-based authentication is now considered one of the most secure and reliable biometric recognition techniques. The reason why fingerprint recognition is the most popular and attractive among biometric-based security systems is due to the unchanged ability and uniqueness of an individual’s fingerprints throughout their life [1]. The fingerprint can be described as a unique pattern of interleaved valleys and ridges on the finger surface, where a ridge is expressed as a single curved segment, whereas a valley is defined as the region between two nearby ridges.
Automated fingerprint recognition systems can be broadly categorized as verification or identification systems [2]. Fingerprint verification is the validation of one person through his fingerprint. The user presents his/her fingerprint together with his/her identity information like his/her ID number. The system of verification reclaims the template of fingerprint according to the number ID and matches the fingerprint obtained in real-time from the user with the template. Fingerprint identification is to define the person’s identity via fingerprint(s). Without knowing the person’s identity, the fingerprint identification system attempts to match his fingerprint with those in the entire fingerprint database [3], as depicted in the block diagram shown in Figure 1.
Furthermore, the purpose of fingerprint matching is to find out if two sets of fingerprints are similar or not; one fingerprint is stored in the database and the other is the current fingerprint [4]. Fingerprint matching approaches can be roughly categorized into three families:
- Correlation-based matching: In this approach, two fingerprints are placed on top of each other and the correlation among the corresponding pixels is matched for various alignments (different displacement and rotations). The principal disadvantage of correlation-based matching is its computational complexity. Moreover, it requires an accurate position of the recording point and is affected by non-linear distortion.
- Minutiae-based matching: This approach is the most common and used method, where the fundamental fingerprint comparison is conducted by fingerprint analysts. Minutiae are extracted from two fingerprint images and stored as point sets in the 2-dimensional plane. Minutiae-based matching mainly consists of gaining alignment between template and input minutiae sets which lead to the greatest number of minutiae pairs [5].
- Pattern-based (image-based) matching: This approach compares the basic fingerprint patterns (whorl, arch, and loop) between a candidate’s fingerprint and the pre-stored template, which needs the fingerprint images to be aligned in the same direction. The employed algorithm detects a central point in the image for this reason. The template in the pattern-based matching algorithm contains the size, type, and orientation of the patterns in the alignment fingerprint image. The template image is compared graphically with the candidate to define the similarity degree.
Most fingerprint patterns include arches, loops, and whorls. In the arch pattern, the ridges come in from one side, rise to form an arc in the middle, then out from the other side. In the loop pattern, the ridge comes in from one side, making a curve, and it enters from the same side. In the whorl pattern, the ridges are circularly rendered around a central point on the finger [6]. It should be noted that the minutiae-based matching approach encounters several issues, particularly when fingerprint samples are degraded or rotated, resulting in poor performance results. On the other hand, the image-based matching approach is shown to be very robust against these degradation issues. Therefore, this research adopts the image-based matching approach.
This work has several key contributions involving fingerprint enhancement, feature extraction, and matching. Initially, a variant of adaptive histogram equalization called CLAHE (contrast limited adaptive histogram equalization) along with a combination of FFT (fast Fourier transform), and Gabor filters are applied to enhance the contrast of fingerprint images. The fingerprint is then authenticated by picking a small amount of information from some local interest points called minutiae point features. These features are extracted from the thinned binary fingerprint image with a hybrid combination of Harris and SURF feature detectors to render significantly improved detection results. For fingerprint matching, the Euclidean distance between the corresponding Harris-SURF feature vectors of two feature points is utilized as a feature matching similarity measure of two fingerprint images. Moreover, an iterative algorithm called RANSAC (RANdom SAmple Consensus) is applied for fine matching and to automatically eliminate false matches and incorrect match points.
2. Related Work
The past two decades or so have witnessed the development of many biometric technologies based on fingerprint matching. N.F. Muhsain [7] investigated the problem of reducing the fingerprint features fed into the neural network, where the input samples of the back-propagation method are coded and normalized using an algorithm worked with a prepared codebook. The key advantages of preparing a codebook lie in the simplicity of its idea and its high-speed processing. The method was tested on the FCV2002 fingerprint database, achieving a recognition accuracy of 94% with an equal error rate (EER) of 2.1. In [8], the authors proposed a fingerprint recognition system composed of several stages, i.e., pre-processing for image enhancement, binarization and thinning of fingerprint images, feature extraction from the thinned image ridge, and finally the matching stage in which similarity and distance measurements are used to match two minutiae points. The recognition method was evaluated accurately and reliably by using fingerprint images from FVC2000 and FVC2002 databases, achieving an accuracy of 98.55% with a false acceptance rate (FAR) and a false rejection rate (FRR) of 0.0154 and 0.0137, respectively.
Furthermore, in [9], Kuban and Jwaid introduced an innovative modification to one of the most powerful algorithms developed to extract the points of interest (POIs), called SURF. These key points, also called features of interest, are later used in the matching process after the outlier sets are eliminated. The presented system was experimentally evaluated on FVC2002 DB1 and FVC2004 DB2 fingerprint databases, using a set of performance evaluation metrics such as accuracy, FRR, FAR, EER, and SMR. The obtained results showed that the system was capable of successfully finding a (1:1) match between one fingerprint and another, as well as a (1:M) match when more than one fingerprint image is compared with the query image. Additionally, in [10], Ahmad et al. developed a fingerprint recognition system where a piece of security system for identity verification is presented based on unique features extracted from each fingerprint to differentiate one from others. In their work, the detection of minutia coordinates and ridge orientation are utilized to determine uniqueness and do matching. Through MATLAB simulations, it was verified that the developed algorithm could effectively achieve a high recognition rate with an accuracy up to 96.11%.
In [11], an algorithm was presented to identify the valid minutiae and increase the accuracy level and acceptance rate. The developed algorithm is split into two major steps: pre-processing and post-processing. Initially, the algorithm performs appropriate pre-processing steps to remove noise and obtain a noise-free fingerprint image for feature extraction. Then, among the extracted minutiae, false minutiae are eliminated in later post-processing stages to extract exact core point detection and matching valid minutiae. The algorithm performance was evaluated on FVC2000 and FingerDOS databases, achieving an average FMR of 1%, FNMR of 1.43%, and accuracy of 98.7%. Moreover, R. Kumar [12] introduced a new fingerprint matching method based on fingerprint orientation analysis utilizing local binary patterns (LBP) obtained from the ridge orientation field. The maximization of mutual information between orientation features extracted from fingerprint images is used to align the images. The fingerprint image is cropped around the detected reference point to locate the region of interest (ROI). The Chi-square test, Euclidean distance, and least square support vector machine (LSSVM) were used to evaluate the matching performance of the orientation local binary pattern (OLBP) descriptor on the public FVC2002, FVC2004, and FVC2006 fingerprint datasets. The results obtained in this study indicated that the performance of LBP features extracted from the orientation image is comparable to those previously reported in the literature.
In [13], a fingerprint recognition technique based on artificial neural networks (ANNs) is proposed, where ridge termination and ridge bifurcation as minutiae are used for fingerprint recognition. The most crucial step in automatic fingerprint matching is to securely extract the minutiae from the fingerprint binary images. With the help of the developed technique, the recognition rate rises, and the error rate decreases. The experimental results showed that the average recognition rate of the proposed technique is 91.10%. In [14], Appati et al. performed a study focused on fingerprint recognition for in-person identification, where a proposal of the fusion of two transform and minutiae models is presented to improve the issue recognition accuracy. More specifically, this study intended to suggest a transform-minutiae fusion-based model for fingerprint recognition. The first wave atom transform (WAT) is employed for data smoothing, while the discrete wavelet transform (DWT) is employed for feature extraction. These features were later combined with the minutiae features for person recognition. The presented recognition approach was evaluated on the FVC 2002 database, achieving a relatively better performance in comparison to existing methods, with an accuracy measure of 100% compared to 96.67% and 98.55% for the existing methods.
3. Proposed Methodology
An automatic fingerprint recognition system typically constitutes of three main stages: fingerprint acquisition, fingerprint pre-processing, and feature extraction and matching. For fingerprint acquisition, optical or capacitive sensors are extensively utilized. They have high performance and acceptable precision, except in some situations where the user’s finger is dirty or dry. However, the training and testing datasets used in this work are obtained from publicly available fingerprint resources (i.e., FVC2000 and FVC2002 designed by Fingerprint Verification Competition (FVC)). Therefore, the acquisition stage is not currently considered to be within the scope of the present work. The image pre-processing, feature extraction, and matching steps are described in detail in the following subsections.
3.1. System Model Block Diagram
A functional block diagram of the automatic fingerprint recognition system (AFRS) model that shows the main components of the system in series is depicted in Figure 2. As illustrated in the figure below, firstly, the scanned fingerprint image is greatly improved in contrast and clarity using a contrast limited adaptive histogram equalization (CLAHE) technique, and then the enhanced image is normalized and segmented. The segmented fingerprint image is further improved by using an adaptive enhancement algorithm based on short time Fourier transform (STFT) analysis and contextual filtering. Thus, the orientation field can be estimated from a set of filtered images generated by applying a bank of Gabor filters; whereas the enhanced image is carefully binarized by applying a simple local–global binarization algorithm.
For feature extraction, the binarized fingerprint image is thinned to form a skeletonized image where ridges are only one pixel wide, and all the redundant pixel information is removed [15]. Based on the robust technical characteristics of Harris and SURF algorithms, a Harris-SURF feature extraction algorithm is then applied to effectively detect and extract features from the skeletonized fingerprint image obtained by the above-mentioned pre-processing steps. In the next step, a matching algorithm is applied for matching these features. The fingerprint matching process also involves calculating a pairwise distance (i.e., Euclidean distance) between the corresponding feature vectors to make a final decision on fingerprint match, as shown in Figure 3.
3.2. Fingerprint Image Preprocessing
In practice, fingerprint images acquired from sensors or other media may not always be well defined (i.e., are not assured with perfect quality), due to elements of noise that corrupt the clarity of the ridge structures. Consequently, fingerprint enhancement methods are usually applied to reduce the noise present in the image and enlighten the clarity and continuity of ridge and valley structures. This greatly helps in better extraction of potentially relevant features and finding stable and robust feature matches. In this work, as an initial pre-processing step, an adaptive local–global technique for contrast image enhancement based on local histogram equalization is carried out to increase the contrast between ridges and valleys and to connect the false broken ridges due to an excessive or inadequate amount of ink.
3.2.1. Histogram Equalization
Histogram equalization is a process that aims to distribute the gray levels in the image so that they are equally distributed across their range. This process efficiently resets the brightness value of every pixel based on the image histogram and intends to extend the pixel value distribution to increase the perceptional information. In this work, contrast limited adaptive histogram equalization (CLAHE) is employed. While traditional histogram equalization works on the entire image, the CLAHE operates locally on the image in small regions called tiles. CLAHE increases the contrast of small tiles and incorporates the neighboring tiles in the image using bilinear interpolation which removes the boundaries that are artificially caused. Additionally, the ’clip limit’ factor is applied to avoid excessively saturating the image specifically the inhomogeneous areas that have high peaks in the histogram of certain image tiles due to many pixels that fall within the same range of gray level [16]. Figure 4 shows the histogram-equalized results of a fingerprint image where improvements in average intensity and contrast are apparent. Furthermore, the histogram distributed over the entire intensity increases the contrast and the average intensity level in the equalized image histogram is higher (lighter) than the original intensity level [17].
3.2.2. Normalization
Normalization is a process of adjusting the pixel intensity values range; it is also called contrast stretching. This process is an easy and significant pre-processing step to enhance the quality of the image by eliminating noise from the image. The image normalization consists of changing the intensity of each pixel, hence which means changing the entire image to some of the pre-defined values. Normalization maintains the clarity and contrast of the ridges and valley structure and it is a pixel-wise operation [18]. The normalized image is defined as follows:
where and are the desired (pre-defined) mean and variance values, respectively, which are defined as follows,
In this work, we have set and , so that new intensities of the pixel for the normalized image would mostly be between −1 and 1, making the subsequent calculations easier.
3.2.3. Image Segmentation
Segmentation is used to distinguish the image’s fingerprint region (foreground) from the image’s background area. When feature extraction is carried out on the background areas of an image, it often generates noisy and false features. Segmentation aims to ignore these background areas that facilitate efficient and accurate feature extraction [19]. A variance-based thresholding method is a very effective means for optimal threshold segmentation. In our work, any part of the image where the pixel intensity is less than 10% is considered as the region of no interest.
3.2.4. Fourier Transform
Fourier transform (FT) transforms an image from the spatial domain into the frequency domain, which offers better processing of images. The application of the fast Fourier transform (FFT) on a set of pixels of a small area in the image allows reconnection of broken ridges following the same FFT orientation. The image is initially divided into small processing blocks (e.g., of size 32 by 32 pixels). Blocks are generally constructed using overlapped windows to avoid the effect of borders of Fourier transform. For each block, the FFT is applied and the bandpass Butterworth filter is used to remove a Gaussian noise. The Fourier transform of the block is then multiplied by its power spectrum to raise the image quality. Finally, the inverse fast Fourier transform (IFFT) is applied to the resulting image. The Fourier transform is defined as follows,
for and .
3.2.5. Ridge Orientation Estimation
The orientation image is the local direction of the ridge-valley at each pixel location in the image. Orientation estimation is a critical step in the pre-processing as the subsequent Gabor filter phase relies on local orientation to effectively optimize the fingerprint image. To determine the orientation, the gradient-based approach is applied, utilizing the assumption that the orientation vector is perpendicular to the gradient. Figure 5 shows the results of orientation field estimation for a low-quality fingerprint image, where the arrows point to the direction of the ridge flow.
3.2.6. Ridge Frequency Estimation
The frequency of the local ridge is described as the frequency of the ridge and valley structures found in a local neighborhood in a direction perpendicular to the orientation of the local ridge, and this is a major parameter used in the Gabor filter construction. For every non-overlapping square block of the fingerprint image, the frequency of the ridge is measured only once. The local ridge frequency is then defined by counting the average number of pixels in the direction normal to the ridge orientation among two consecutive peaks of gray levels.
3.2.7. Gabor Filtering
Once the ridge frequency and orientation information are determined, the even-symmetric Gabor filter is generated utilizing these parameters. The two-dimensional Gabor filter consists of a sinusoidal plane wave, modified by a Gaussian envelope of a particular orientation and frequency. Gabor filters have selective frequency and selective orientation properties. These properties allow these filters to be set to provide maximum response to ridges at a particular frequency and orientation in the image. Thus, a correctly adjusted Gabor filter can be utilized to maintain the ridge structures efficiently, while reducing noise. The Gabor even-symmetric filter is the real part of the Gabor function, produced by a cosine wave modified by a Gaussian envelope. Gabor’s even-symmetric filter in the special domain has the following general form:
The coordinates (, ) are defined by
where is the Gabor filter orientation, f is the cosine (sinusoidal plane) wave frequency, and are the Gaussian envelope space constants (standard deviations) along the x and y axes, respectively, and and are the x and y axes of the filter coordinate frame, respectively. Gabor filter is applied to the image by convolving it with the filter. The pixel convolution in the image needs the corresponding orientation value and ridge frequency of that pixel. Thus, the application of the Gabor filter G to obtain an enhanced image E is carried out as follows [19],
where O, F, and N denote the orientation, frequency, and normalized images, respectively. The width and height of the Gabor filter mask are and , respectively.
3.2.8. Binarization and Thinning
The binarization process of a fingerprint image converts an 8-bit grayscale image into a 1-bit image with a value of 0 for ridges and a value of 1 for valleys. This process increases the contrast between the fingerprint ridges and valleys, making it easier to extract features from the fingerprint image later on. This method involves examining the gray value of every pixel in the enhanced image, and the pixel value is set to a binary value of one if the value is greater than the global threshold; otherwise, it is set to zero. The result is a binary image that comprises two data levels, the ridges in the foreground and the valleys in the background. The Gabor filter’s useful feature is that it has a DC component with a zero value, meaning that the mean pixel value of the resulting filter image is zero. Thus, straightforward binarization of the image can be carried out by using a global threshold of zero. The resultant binary image of the Gabor enhanced fingerprint grayscale image, is given by
Fingerprint ridge thinning attempts to minimize the redundant pixels until the ridges are just one pixel thick. To achieve desirable thinning results, an iterative parallel thinning algorithm that can be accessed in MATLAB via the ‘thin’ operation under the “bwmorph” function is applied to the binary image. The thinned image is then filtered to eliminate any H-breaks, spikes, and isolated points using the h-break, clean, and spur MATLAB functions. The algorithm marks redundant pixels in every small image window in each full fingerprint image scan (). Eventually, all those marked pixels are excluded after multiple scans. The basic steps of the whole fingerprint image pre-processing process are shown in Figure 6.
3.3. Fingerprint Feature Extraction
It is worth mentioning that effective and reliable feature extraction is the most crucial and substantial issue to the final accuracy of the feature matching process, which heavily depends on the perfection of the previous pre-processing steps [20]. The minutiae-based feature extraction and matching approach suffers from critical issues, such as its computational complexity being usually very high. In addition, this approach requires high-quality fingerprint samples, so that when the samples are seriously degraded, this usually results in significant degradation in matching accuracy. On the other hand, the image-based approach can effectively tackle these problems, where the feature detection algorithms are applied to extract features locally from candidate fingerprint images. In this work, an optimized combination of the Harris algorithm and SURF algorithm is presented, which is potentially expected to generate a set of most represented features with high repeatability and excellent matching properties [21].
3.4. Harris Corner Detection
The characteristics of the Harris corner point are used to segregate the background and foreground. Around a corner point, turning the window to any direction should make a high difference in intensity [22]. The Harris’s point strength in the fingerprint foreground regions is extremely higher than that in the background regions [23]. The Harris algorithm first introduced by Harris et al. [24] has appeared as a modification or development of the Moravec corner detection function, which utilizes the gray contrast among pixels to extract corner points. Given a grayscale image I and a window is going to be swept (with displacements u in the x-direction and v in the y-direction). Thus, the variation of intensity can be computed as follows,
where and are the intensities at the position and at the moving window, , respectively. Since windows with corners are being looked for, windows with a large variation in intensity are being searched [25]. Consequently, the above equation should be maximized, particularly the following term:
Using Taylor expansion, we get
Expanding the equation and canceling properly yield:
Equation (11) can be expressed in a matrix form as follows:
Let us denote,
Thus, Equation (12) can now be rewritten as follows:
Let , be the eigenvalues of matrix M which form a rotationally invariant description. Here, there are three cases to be considered:
- Once an eigenvalue ( or ) is large and considerably greater than the other, then an edge exists.
- If and the values are small (near zero), then this pixel point is a flat region.
- If and they have large positive values, then this pixel point is a corner.
For each window, a score can be computed to determine whether it can probably contain a corner:
where , and k is a constant experimentally set between 0.04 and 0.06. A window with a score R larger than a certain threshold value is considered to have a “corner”.
3.5. Speeded Up Robust Feature (SURF) Algorithm
The key idea of the SURF detection algorithm is to detect points of interest (i.e., keypoints) such as corners or blob-like structures from an image in the places where the determinant of the Hessian matrix has a maximum value [26]. While the detector locates the keypoints, the descriptor describes the features of these keypoints and constructs the feature vectors of the detected keypoints [27]. The steps of the SURF algorithm contain three tasks, namely, keypoint detecting, keypoint describing, and keypoint matching. In the first step, given a fingerprint image, the keypoints can be detected based on the determinant of the Hessian matrix. Formally speaking, in a given image I, the Hessian matrix can be defined at a point x and scale , as follows:
where,
where is the convolution of the image with the second derivative of the Gaussian, at scale . Figure 7 shows the weighted box filter approximations of discretized second order Gaussian derivatives in the y and xy-directions.
Using integral images in the calculation of Hessian approximation can greatly reduce the computation time of key points detection. The SURF algorithm can effectively use scale-space analysis of an image to identify the scale-invariant keypoints by using box filters in pyramid mode instead of measuring the approximations for second-order Gaussian derivatives of integral images at different scale values (). The box filter begins as an initial scale layer with a () size filter and the scale value is s = 1.2, which corresponds to the estimated Gaussian derivative with scale value = 1.2, and so forth for the remaining filter sizes. When the determinant of Hessian approximation is obtained at each layer, in a neighborhood, the non-maxima suppression (NMS) technique can be used to locate the keypoints over an image scale. For achieving a good approximation, the determinant is weighted to exclude keypoints having low contrast or points lying on edges or being near to edges:
where and are the approximated and discrete kernels for and , respectively. The term is theoretically sensitive to scale, but it can be assumed almost constant at 0.9.
The extraction stage, also called the feature descriptor, aims to build a descriptor for every detected pixel in the image from the neighborhood information using vector space representation. In feature description, for generating SURF descriptors, two steps are typically required. The first is to determine the orientation for every detected feature by convolving the feature pixel into its neighborhood with the vertical and horizontal Haar wavelet filters. To make the detected points invariant to rotation, Haar wavelet responses are measured in both x and y orientation in the circular neighborhood of radius 6 around the interesting point, where is the scale at which the point is detected. The orientation of the dominant is then determined by measuring all responses summation in the sliding orientation window and the longest vector is chosen as the dominant orientation. The second step involves constructing a keypoint descriptor. For extracting a descriptor for every selected point, a square region of size centered around the keypoint and oriented along with the orientation selected in the previous step. Then, the region is divided into smaller sub-regions and the Haar wavelet responses in x and y direction at regularly spaced sample points are computed and summed up in every region. This value results in a 4-dimensional feature vector per regions that yields a final vector of 64 dimensions. When the sign of entries is considered, a final vector representation of 128 dimensions would be produced for each feature. The final step in the SURF algorithm is the feature matching, which involves calculating a pairwise distance (i.e., Euclidean distance) between the feature vectors of the query image and database images [27].
3.6. Fingerprint Feature Matching
The feature matching process mainly aims to determine the reference point in one image and to detect a matching point in another image. After extracting the SURF features and calculating the descriptors (feature vectors), our goal in the matching phase is to find geometrically consistent feature matches across all fingerprint images. Therefore, if a feature from a fingerprint image is matched with the corresponding feature in another database image, their descriptor should be matched to find the closest matching feature. This can be carried out in various ways, but the most common and popularly accepted method to define similarity is the use of the pairwise Euclidean distance between these descriptors. Hence, two fingerprint feature vectors match, if and only if the distance between them is less than a specified distance threshold.
Due to not all the feature points being matched properly, there are points that do not fit the plan. To effectively tackle this problem, we use the RANdom SAmple Consensus (RANSAC) algorithm to detect and remove points that fall outside the threshold as outliers (i.e., error feature points) to finally determine the matching area exactly. The basic idea behind the RANSAC algorithm is to find a model where the data points are suited to the model (inlier features) and the non-suited points are eliminated. Feature points extracted from fingerprint images are compared together using proximity metric using normalized Euclidean distance to construct an index-pair matching matrix. Then, a multi-feature fusion of local SURF and Harris features is performed and outliers in the matched features are removed by applying the RANSAC algorithm. In Figure 8, a sample of correctly matched points for a pair of fingerprint images is shown.
Finally, the similarity or matching percentage (P) can readily be computed by the following formula:
where is correct matching features after applying the RANSAC algorithm (inliers) and is the total matching feature number in the index matching pair matrix.
4. Experimental Results
In this section, the experimental results obtained are shown and discussed in order to demonstrate the performance of the proposed fingerprint verification system. All testing and evaluation experiments are performed on two public domain databases, widely used in the related works, namely the Fingerprint Verification Competition’s FVC2000 DB1 [28] and FVC2002 DB1 [29] databases where each of them consists of a total number of 80 fingerprint images with a resolution of pixels for FVC2000 DB1 and pixels for FVC2002 DB1. Both datasets are publicly downloadable for free [30], in which the fingerprint images were acquired from ten persons; eight acquisitions for each person of the same finger [31]. For realistic fingerprint verification, a user initially needs his or her fingerprint to be fed into the fingerprint verification system which is saved in some format with the user’s identity. The system begins with the fingerprint enhancement process, and then extracts the local feature points (both Harris and SURF keypoints) from fingerprint images. These feature points are then compared with the feature points of the fingerprints in a database and the outlier’s features are eliminated by applying the RANSAC algorithm.
Final fingerprint matching is done by calculating the weighted average of the matching (or similarity) score between the fingerprint to be identified and each fingerprint in the database in order to decide whether they are a matching pair (i.e., belonging to the same finger), based on whether the similarity score is above or below a predefined matching threshold (0.3,0.4). Figure 9 presents an example of matching similarity of two different fingerprints and another example of matching results between two impressions of the same finger.
Discussion of Results
In this work, the recognition rate (or accuracy) is used as an assessment parameter to evaluate the performance of the proposed fingerprint verification system. Recognition accuracy (ACC) is usually expressed as a ratio that can be easily calculated by dividing the number of fingerprints recognized by the total number of fingerprints presented:
As stated earlier, extensive tests and experiments were carried out based on two public fingerprint databases of FVC2000 DB1 FVC2002 DB1 to demonstrate the effectiveness and robustness of the proposed verification system. The average recognition accuracy is computed as a measure of the overall performance of the presented system. The testing results for both datasets are presented in detail in Table 1 and Table 2.
In light of these results, it can be observed that the verification system performs consistently well on both datasets, having relatively better performance on the FVC2000 dataset (with an overall recognition rate of 95.5%) due to its relatively high-quality fingerprint images. Additionally, it should be interesting to perform a comparative performance analysis between the effectiveness of the proposed verification method and other related work in terms of average recognition accuracy. The outcomes of this comparison are reported for FVC2000 DB1 and FVC2002 DB1 in Table 3 and Table 4, respectively.
From the figures presented in the tables above, it can be clearly seen that the proposed method performs notably better than other related state-of-the-art methods. All experiments and computations in this study were carried out using MATLAB (R2016a) software (on an Intel Core i5-4570 3.20 GHz, RAM 8 GB PC running Windows 10 Professional 64 bit). The total computation time required for the whole fingerprint recognition process comprises three parts: the time spent for pre-processing contrast enhancement plus the time spent for feature extraction plus the time for feature matching, as shown in Table 5.
5. Conclusions
This paper has presented a new fingerprint-based authentication framework by means of fingerprint enhancement, feature extraction, and matching techniques, where an innovative technique was proposed for contrast enhancement of fingerprint images, based on a variant of adaptive histogram equalization called CLAHE along with a combination of iterative FFT and Gabor filters. The minutiae features are then extracted from the thinned binary fingerprint image by the use of a hybrid combination of Harris and SURF feature detectors to render significantly improved detection results. For fingerprint matching, the Euclidean distance between the corresponding Harris-SURF feature descriptors of two feature points was used as a feature matching similarity metric of two fingerprint images. In addition, an iterative RANSAC algorithm was employed to refine the matched points. Experiments and evaluations on two benchmarking fingerprint databases showed that the proposed framework has achieved state-of-the-art performance in terms of accuracy and robustness while maintaining real-time performance. Future work will include larger experiments on publicly available low-quality fingerprint databases along with a quantitative comparison of the framework to additional state-of-the-art baselines.
Author Contributions
Conceptualization, S.B.; methodology, S.B.; software, R.Y. and S.B.; validation, S.B. and A.A.-H.; formal analysis, S.B. and A.A.-H.; project administration, A.A.-H.; funding acquisition, A.A.-H. All authors have read and agreed to the published version of the manuscript.
Funding
This work is funded by the Federal Ministry of Education and Research of Germany (BMBF) (Robo-Lab no 03zz04x02b, HuBa no. 03ZZ0470 367, RoboAssist no. 03ZZ0448L) within the Zwanzig20 Alliance 3Dsensation.
Institutional Review Board Statement
Not applicable.
Informed Consent Statement
Not applicable.
Data Availability Statement
The data presented in this study are available on request from the corresponding authors.
Acknowledgments
We are extremely grateful to the anonymous referees for their insightful comments and valuable suggestions which helped us to considerably improve the content of the paper.
Conflicts of Interest
The authors declare no conflict of interest.
References
- Maltoni, D.; Maio, D.; Jain, A.K.; Prabhakar, S. Handbook of Fingerprint Recognition; Springer Science & Business Media: Berlin/Heidelberg, Germany, 2009. [Google Scholar]
- Sahu, D.; Shrivas, R. Fingerprint reorganization using minutiae based matching for identification and verification. Int. J. Sci. Res. 2013, 5, NOV163751. [Google Scholar]
- Tripathi, M.; Shrivastava, D. Designing of Fingerprint Recognition System Using Minutia Extraction and Matching. Int. J. Sci. Eng. Comput. Technol. 2015, 5, 120–126. [Google Scholar]
- Patel, H.; Asrodia, P. Fingerprint matching using two methods. Int. J. Eng. Res. Appl. 2012, 2, 857–860. [Google Scholar]
- Shukla, P.; Abhishek, R. Fingerprint Recognition System. Int. J. Eng. Dev. Res. 2014, 2, 3140–3150. [Google Scholar]
- Lourde, M.; Khosla, D. Fingerprint Identification in Biometric SecuritySystems. Int. J. Comput. Electr. Eng. 2010, 2, 852–855. [Google Scholar] [CrossRef] [Green Version]
- Muhsain, N.F. Fingerprint Recognition using Prepared Codebook and Back-propagation. AL-Mansour J. 2011, 15, 31–45. [Google Scholar]
- Ali, M.M.; Mahale, V.H.; Yannawar, P.; Gaikwad, A. Fingerprint recognition for person identification and verification based on minutiae matching. In Proceedings of the IEEE 6th International Conference on Advanced Computing (IACC), Bhimavaram, India, 27–28 February 2016; pp. 332–339. [Google Scholar]
- Kuban, K.H.; Jwaid, W.M. A novel modification of surf algorithm for fingerprint matching. J. Theor. Appl. Inf. Technol. 2018, 96, 1–12. [Google Scholar]
- Ahmad, A.; Ismail, S.; Jawad, M.A. Human identity verification via automated analysis of fingerprint system features. Int. J. Innov. Comput. Inf. Control. IJICIC 2019, 15, 2183–2196. [Google Scholar]
- Patel, M.B.; Parikh, S.M.; Patel, A.R. An improved approach in fingerprint recognition algorithm. In Smart Computational Strategies: Theoretical and Practical Aspects; Springer: Berlin/Heidelberg, Germany, 2019; pp. 135–151. [Google Scholar]
- Kumar, R. Orientation Local Binary Pattern Based Fingerprint Matching. SN Comput. Sci. 2020, 1, 1–12. [Google Scholar] [CrossRef] [Green Version]
- Awasthi, G.; Fadewar, D.; Siddiqui, A.; Gaikwad, B.P. Analysis of Fingerprint Recognition System Using Neural Network. In Proceedings of the 2nd International Conference on Communication & Information Processing (ICCIP), Singapore, 26–29 November 2020. [Google Scholar]
- Appati, J.K.; Nartey, P.K.; Owusu, E.; Denwar, I.W. Implementation of a Transform-Minutiae Fusion-Based Model for Fingerprint Recognition. Int. J. Math. Math. Sci. 2021, 2021, 5545488. [Google Scholar] [CrossRef]
- Haftu, T. Performance Analysis and Evaluation of Image Enhancement Techniques for Automatic Fingerprint Recognition System using Minutiae Extraction. Ph.D. Thesis, Addis Ababa University, Addis Ababa, Aithiops, 2018. [Google Scholar]
- Kumar, N.; Verma, P. Fingerprint image enhancement and minutia matching. Int. J. Eng. Sci. Emerg. Technol. (IJESET) 2012, 2, 37–42. [Google Scholar]
- Sepasian, M.; Balachandran, W.; Mares, C. Image enhancement for fingerprint minutiae-based algorithms using CLAHE, standard deviation analysis and sliding neighborhood. In Proceedings of the World congress on Engineering and Computer Science, San Francisco, CA, USA, 22–24 October 2008; pp. 22–24. [Google Scholar]
- Bhargava, N.; Kumawat, A.; Bhargava, R. Fingerprint Matching of Normalized Image based on Euclidean Distance. Int. J. Comput. Appl. 2015, 120, 20–23. [Google Scholar] [CrossRef]
- Chaudhari, A.S.; Lade, S.; Pande, D.S. Improved Technique for Fingerprint Segmentation. Int. J. Adv. Res. Comput. Sci. Manag. Stud. 2014, 2, 402–411. [Google Scholar]
- Geteneh, A. Designing Fingerprint Based Verification System Using Image Processing: The Case of National Examination. Ph.D. Thesis, Bahir Dar University, Bahir Dar, Ethiopia, 2019. [Google Scholar]
- Azad, P.; Asfour, T.; Dillmann, R. Combining Harris interest points and the SIFT descriptor for fast scale-invariant object recognition. In Proceedings of the 2009 IEEE/RSJ International Conference on Intelligent Robots and Systems, St. Louis, MO, USA, 10–15 October 2009; pp. 4275–4280. [Google Scholar]
- Bakheet, S.; Al-Hamadi, A. Automatic detection of COVID-19 using pruned GLCM-Based texture features and LDCRF classification. Comput. Biol. Med. 2021, 137, 104781–104791. [Google Scholar] [CrossRef] [PubMed]
- Wu, C. Advanced Feature Extraction Algorithms for Automatic Fingerprint Recognition Systems; Citeseer: Princeton, NJ, USA, 2007; Volume 68. [Google Scholar]
- Harris, C.; Stephens, M. A Combined Corner and Edge Detector. In Proceedings of the 4th Alvey Vision Conference, Manchester, UK, 31 August–2 September 1988; pp. 147–151. [Google Scholar]
- Bakheet, S.; Al-Hamadi, A. Robust hand gesture recognition using multiple shape-oriented visual cues. EURASIP J. Image Video Process. 2021, 2021, 1–18. [Google Scholar] [CrossRef]
- Bakheet, S.; Al-Hamadi, A. A Framework for Instantaneous Driver Drowsiness Detection Based on Improved HOG Features and Naïve Bayesian Classification. Brain Sci. 2021, 11, 240–254. [Google Scholar] [CrossRef] [PubMed]
- Du, G.; Su, F.; Cai, A. Face recognition using SURF features. In Proceedings of the MIPPR 2009: Pattern Recognition and Computer Vision, Yichang, China, 30 October–1 November 2009; International Society for Optics and Photonics: Bellingham, WA, USA, 2009; Volume 7496. [Google Scholar]
- Fingerprint Verification Competition FVC2000. Available online: http://bias.csr.unibo.it/fvc2000/ (accessed on 22 September 2021).
- Fingerprint Verification Competition FVC2002. Available online: http://bias.csr.unibo.it/fvc2002/ (accessed on 22 September 2021).
- Maio, D.; Maltoni, D.; Cappelli, R.; Wayman, J.L.; Jain, A.K. FVC2002: Second fingerprint verification competition. In Proceedings of the Object Recognition Supported by User Interaction for Service Robots, Quebec City, QC, Canada, 11–15 August 2002; Volume 3, pp. 811–814. [Google Scholar]
- Vitello, G.; Conti, V.; Vitabile, S.; Sorbello, F. Fingerprint quality evaluation in a novel embedded authentication system for mobile users. Mob. Inf. Syst. 2015, 2015, 401975. [Google Scholar] [CrossRef]
- Chavan, S.; Mundada, P.; Pal, D. Fingerprint authentication using gabor filter based matching algorithm. In Proceedings of the International Conference on Technologies for Sustainable Development (ICTSD), Mumbai, India, 4–6 February 2015; pp. 1–6. [Google Scholar]
- Francis-Lothai, F.; Bong, D.B. A fingerprint matching algorithm using bit-plane extraction method with phase-only correlation. Int. J. Biom. 2017, 9, 44–66. [Google Scholar]
Figure 1.
Fingerprint verification vs. fingerprint identification.

Figure 2.
Functional block diagram of automatic fingerprint recognition system.

Figure 3.
Working flow diagram of fingerprint feature extraction and matching.

Figure 4.
Histogram-equalized results: (a) Histogram of original fingerprint image, (b) after the conventional histogram equalization, and (c) after CLAHE with clip Llmit.
Figure 4.
Histogram-equalized results: (a) Histogram of original fingerprint image, (b) after the conventional histogram equalization, and (c) after CLAHE with clip Llmit.

Figure 5.
Orientation field estimation: original image (left) and its directional field image (right).
Figure 5.
Orientation field estimation: original image (left) and its directional field image (right).

Figure 6.
Fingerprint image pre-processing: (a) original, (b) enhanced, (c) binarized, and (d) thinned images.
Figure 6.
Fingerprint image pre-processing: (a) original, (b) enhanced, (c) binarized, and (d) thinned images.
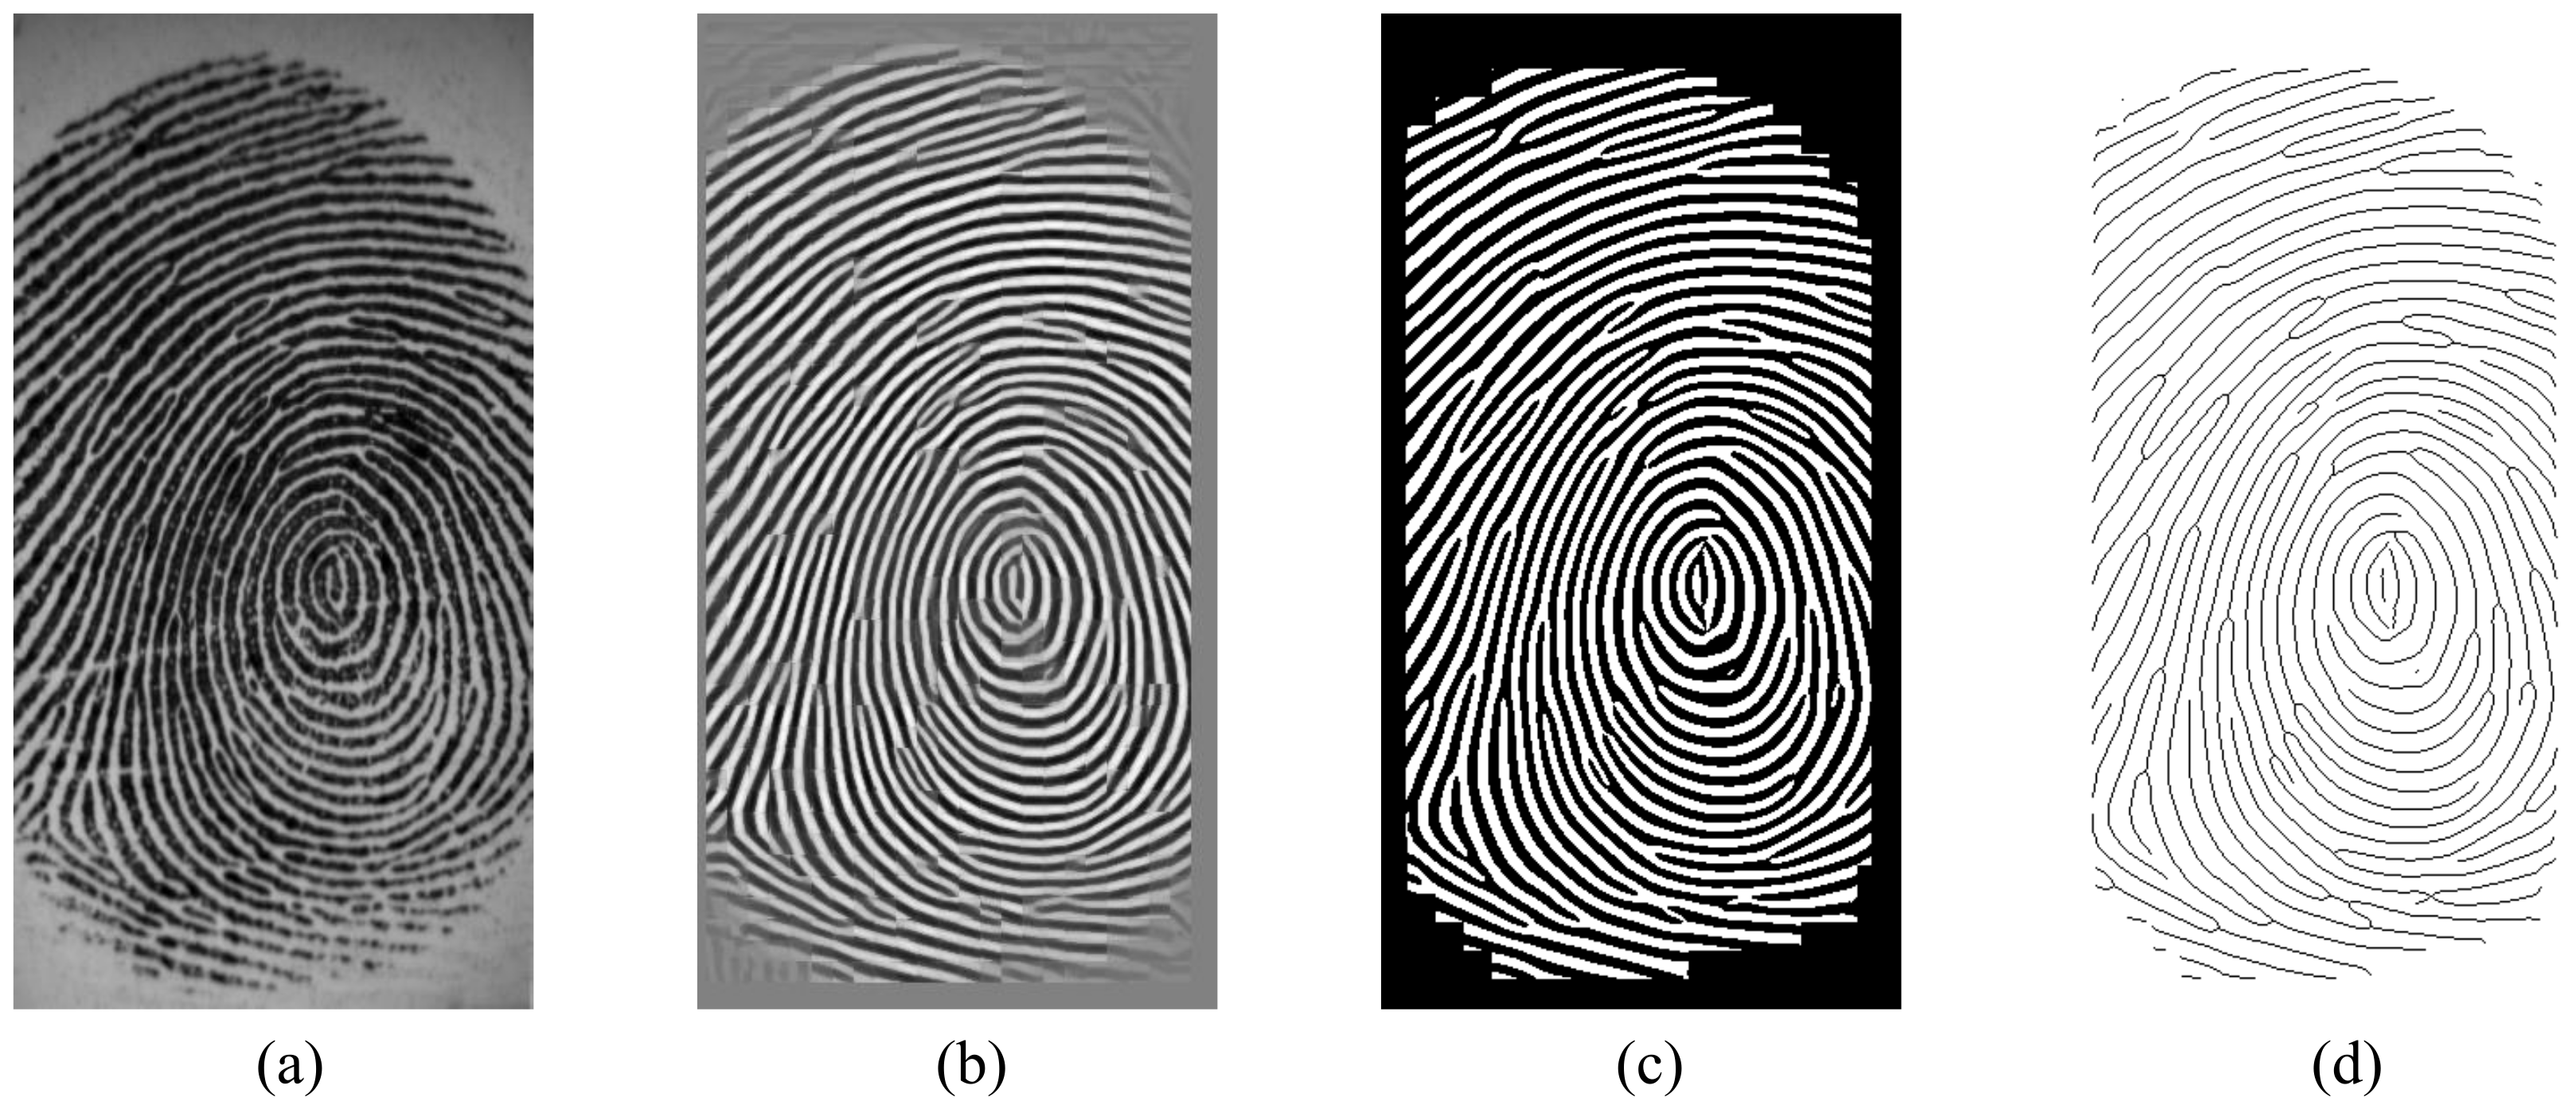
Figure 7.
Box filter approximation of second order Gaussian partial derivatives, where , , , and are shown from left to right, respectively.
Figure 7.
Box filter approximation of second order Gaussian partial derivatives, where , , , and are shown from left to right, respectively.

Figure 8.
A sample of correctly matched points for a pair of fingerprint images.

Figure 9.
Matching results between two fingerprint pairs, where similarity (a) =0.0588 (b) =0.75.


Table 1.
Recognition results on FVC2000 DB1.
| User | Recognized Samples | ACC (%) |
|---|---|---|
| 1 | 8 | 100 |
| 2 | 8 | 100 |
| 3 | 8 | 100 |
| 4 | 6 | 75 |
| 5 | 7 | 87.5 |
| 6 | 8 | 100 |
| 7 | 6 | 75 |
| 8 | 7 | 87.5 |
| 9 | 8 | 100 |
| 10 | 8 | 100 |
| Total | 74 | 92.5% |
Table 2.
Recognition results on FVC2002 DB1.
| User | Recognized Samples | ACC (%) |
|---|---|---|
| 1 | 8 | 100 |
| 2 | 7 | 87.5 |
| 3 | 8 | 100 |
| 4 | 7 | 87.5 |
| 5 | 8 | 100 |
| 6 | 8 | 100 |
| 7 | 7 | 87.5 |
| 8 | 8 | 100 |
| 9 | 8 | 100 |
| 10 | 7 | 87.5 |
| Total | 76 | 95% |
Table 3.
Recognition accuracy comparison on FVC2000 DB1.
| Dataset | Recognition Accuracy | |||
|---|---|---|---|---|
| Our Method | Chavan et al. [32] | Ahmad et al. [10] | Ali et al. [8] | |
| DB1-FVC2000 | 92.5% | 82.95% | 82.43% | 80.03% |
Table 4.
Recognition accuracy comparison on FVC2002 DB1.
| Dataset | Recognition Accuracy | |||
|---|---|---|---|---|
| Our Method | Muhsain [7] | Awasthi et al. [13] | Francis-Lothai et al. [33] | |
| DB1-FVC2002 | 95% | 94% | 91.10% | 81.16% |
Table 5.
Time spent for each stage of the recognition process.
| Stage | Elapsed Time (s) |
|---|---|
| Enhancement | 3.786178 |
| Feature extraction | 0.139466 |
| Recognition | 0.106853 |
| Total | 4.032497 |
Publisher’s Note: MDPI stays neutral with regard to jurisdictional claims in published maps and institutional affiliations. |
© 2022 by the authors. Licensee MDPI, Basel, Switzerland. This article is an open access article distributed under the terms and conditions of the Creative Commons Attribution (CC BY) license (https://creativecommons.org/licenses/by/4.0/).
Share and Cite
MDPI and ACS Style
Bakheet, S.; Al-Hamadi, A.; Youssef, R. A Fingerprint-Based Verification Framework Using Harris and SURF Feature Detection Algorithms. Appl. Sci. 2022, 12, 2028. https://doi.org/10.3390/app12042028
AMA Style
Bakheet S, Al-Hamadi A, Youssef R. A Fingerprint-Based Verification Framework Using Harris and SURF Feature Detection Algorithms. Applied Sciences. 2022; 12(4):2028. https://doi.org/10.3390/app12042028
Chicago/Turabian StyleBakheet, Samy, Ayoub Al-Hamadi, and Rehab Youssef. 2022. "A Fingerprint-Based Verification Framework Using Harris and SURF Feature Detection Algorithms" Applied Sciences 12, no. 4: 2028. https://doi.org/10.3390/app12042028
Note that from the first issue of 2016, this journal uses article numbers instead of page numbers. See further details here.