
Research on a Real-Time Driver Fatigue Detection Algorithm Based on Facial Video Sequences
by
Tianjun Zhu
1,2,*, 
Chuang Zhang
2, 
Tunglung Wu
1,
Zhuang Ouyang
3,*, 
Houzhi Li
3,*,
Xiaoxiang Na
4,
Jianguo Liang
1 and
Weihao Li
1 1
Department of Mechanical and Automotive Engineering, Zhaoqing University, Zhaoqing 526021, China
2
College of Mechanical and Equipment Engineering, Hebei University of Engineering, Handan 056021, China
3
Guangdong Zhaoqing Institute of Quality Inspection & Metrology, Zhaoqing 526000, China
4
Department of Engineering, University of Cambridge, Cambridge CB2 1PZ, UK
*
Authors to whom correspondence should be addressed.
Appl. Sci. 2022, 12(4), 2224; https://doi.org/10.3390/app12042224
Submission received: 11 January 2022
/
Revised: 15 February 2022
/
Accepted: 17 February 2022
/
Published: 21 February 2022
(This article belongs to the Special Issue Human-Computer Interactions)
Abstract
:The research on driver fatigue detection is of great significance to improve driving safety. This paper proposes a real-time comprehensive driver fatigue detection algorithm based on facial landmarks to improve the detection accuracy, which detects the driver’s fatigue status by using facial video sequences without equipping their bodies with other intelligent devices. A tasks-constrained deep convolutional network is constructed to detect the face region based on 68 key points, which can solve the optimization problem caused by the different convergence speeds of each task. According to the real-time facial video images, the eye feature of the eye aspect ratio (EAR), mouth aspect ratio (MAR) and percentage of eye closure time (PERCLOS) are calculated based on facial landmarks. A comprehensive driver fatigue assessment model is established to assess the fatigue status of drivers through eye/mouth feature selection. After a series of comparative experiments, the results show that this proposed algorithm achieves good performance in both accuracy and speed for driver fatigue detection.
1. Introduction
Driver fatigue, or drowsiness, contributes to many thousands of deaths and injuries on the roads every year. It has a role in up to 30% of fatal crashes and up to 15% of serious injuries [1]. Driver fatigue occurs when a driver does not get enough sleep or after long-distance driving. The influence of fatigue on driving safety is similar to that of alcohol impairment. A survey of the U.S population found that 37% of workers got less than the recommended minimum of 7 h of sleep [2]. Driver fatigue is responsible for 22.7% of fatal accidents and 20.5% of accidents with injuries on Canadian roads. In 40% of fatigue-related accidents, the driver was awake for over 17 h [3]. The main problem with fatigue is that it is very difficult to be aware of the tiredness of drivers before they become too tired to drive safely. Driver fatigue is a major cause of car accidents, since sleepy drivers are unable to make rapid decisions, and they may have slower reaction times [4]. Therefore, recent research also suggests that driver fatigue detection methodologies can be used to prevent such accidents [5]. The research on driver fatigue detection can be classified into two categories: passive driver monitoring system and active driver fatigue control system. Among them, the first is the use of preventive measures, by which a driver is monitored, and an alarm is displayed to advise the driver to stop the vehicle during the fatigue stage [5,6,7]. The second is the abnormal fatigue detection in which a driver is deemed to be asleep and the system can actively control the vehicle to avoid accidents [8,9,10].
In recent years, researchers have developed methodologies to detect or indicate the driver fatigue state prior to a collision [11,12,13]. Generally, data from three different sources have been used to classify driver fatigue or drowsiness. Firstly, vehicle-based measures are used to detect a drowsy or unsafe state. For example, vehicle-based measuring may be obtained by steering wheel angle, acceleration pedal data, and lane departure information by an external sensor [14,15]. Secondly, observation of the driver behavior method may be determined by continuous recording through a camera installed in the vehicle to monitor eye-closure time, eye blinking frequency, movement and pose of the head, and yawing, etc. [16,17,18]. The most recognized measure of these models is the percentage of eye closure time (PERCLOS) [19], although others have used measures such as eye aspect ratio (EAR) [20]. Thirdly, driver-based measures include physiological measurements such as electroencephalography (ECG), as well as heart rate, respiration rate, pulse pattern, and popular cortical signals, etc. [21,22,23].
In summary, owing to easy installation and low cost, observation of the driver behavior method has been widely used for fatigue detection. For example, attention technologies and smart eye technology employ the movement of the driver’s eyes and position of the driver’s head to determine the level of their fatigue [24,25].
In this study, we propose a real-time observation of the driver behavior method to detect driver fatigue. Our method only uses the inside vehicle camera, which is handy for the driver to carry on, or convenient to install in the vehicle. The novelty of this study is to develop a novel real-time driver fatigue detection system that has two major advantages. First, we introduce a new face-tracking algorithm based on facial landmarks to improve detection accuracy. A tasks-constrained deep convolutional network is constructed to detect the face region based on 68 key points, which solve the optimization problem caused by different convergence speeds of each task. Second, we use K-nearest neighbor (KNN) to classify the state of the driver’s eye. According to the real-time facial video images, the eye feature of eye aspect ratio (EAR), mouth aspect ratio (MAR), and percentage of eye closure time (PERCLOS) are calculated based on specific facial landmarks. Besides, the system proposes a comprehensive driver fatigue assessment model to assess the fatigue of drivers with eye/mouth feature selection to evaluate the level of driver fatigue.
2. Approach
The overall structure of our research is shown in Figure 1. The methodology consists of the following two parts:
Offline Training: In order to realize driver fatigue recognition accurately, off-line training is carried out. Driver fatigue state is generally recognized by facial features, such as the opening and closing of eyes and the degree of opening the of mouth when yawning [26,27,28,29]. Thus, we firstly collected the driver’s facial feature images of the driver wearing glasses or sunglasses, such as the opening and closing of eyes and the opening degree of the mouth. Then, a tasks-constrained deep convolutional network (TCDCN) algorithm is applied to the driver’s facial feature recognition for each image collected. The advantage of this algorithm is to conduct multiple-task learning (including gender, whether wearing glasses or sunglasses or not, and face posture) at the same time. These auxiliary attributes can help to locate facial feature points better. Furthermore, two types of percentage of eye closure time (PERCLOS) methods were used, as shown in Figure 1. The PERCLOS1 is the value calculated when the eyes open with or without glasses and PERCLOS2 is the value calculated when the state of the driver’s eyes, with or without glasses are closed, and the ratio of the mouth’s height and width can be calculated in real time. Finally, we take the above three types of data (i.e., PERCLOS1 when the eyes are open, PERCLOS2 when the eyes are closed, and the ratio of the mouth’s height and width) as samples, and train them with AdaBoost classifier to determine whether the eyes are open or closed, and whether the mouth is open or closed. AdaBoost is the abbreviation of adaptive boosting. It is a machine learning meta algorithm produced by Yoav Freund and Robert Schapire. Its core idea is to train different classifiers (weak classifiers) for the same training set, and then combine these weak classifiers to form a stronger final classifier [30].
Online Testing: Is a real-time module to detect driver’s fatigue from live video sequences. All the video images are imported into TCDCN to recognize the driver’s face, and then the eye and mouth feature landmarks are obtained in real time [31]. Then, the off-line trained AdaBoost classifier is used to determine whether the driver’s eyes and mouth are open or closed in the current frame [32]. At last, we classify whether the driver is sleepy or not according to the condition that the mean duration of closure time (or open mouth time) exceeds the selected threshold in a period of time. Besides, in order to identify driver fatigue more accurately, TCDCN can eliminate the influence of wearing glasses, head posture, and other factors.
2.1. Tasks-Constrained Deep Convolution Network
The framework of TCDCN algorithm is shown as Figure 2. The input is a 40 × 40 gray image. The feature extraction stage includes four convolution layers, three pooling layers, and one full connection layer. The weight of the filter is not shared in space, which means that different filter sets are used in the input map. The hyperbolic tangent of the absolute value rectification is selected as the activation function; the maximum pooling is carried out in the area without overlap, and an eigenvector is generated with the full connection layer after four convolutions. This eigenvector is shared by multiple tasks in the estimation stage, among which linear regression is used to obtain the location of the landmark points and multiple logistic regression is used to handle multiple other personal tasks, for example, gender, face position, wearing glasses, etc.
Generally speaking, when people look at the face in the picture, they will detect where the face is, and then identify the gender, face position, if the driver is wearing glasses, and so on. When machines perform these tasks, they usually need to design independent algorithms to solve different tasks. However, TCDCN can design a sophisticated network to complete all these tasks at the same time, and make use of the relationship between tasks.
The difficulty of multi-task learning is that different tasks have different characteristics and convergence speed. The method proposed in this study is superior to the existing method, especially in dealing with the situation of serious occlusion and position change, and reduces the complexity of the model.
In order to make use of all the information on multi-task data sets, such as face frame, face landmark points, face position, gender, and wearing glasses information, multiple sub networks can train the task-related data sets, and then share the parameters, because no single data set contains all the annotation information required by the face detection task. Through this method, TCDCN can use and adapt parameter sharing to the whole domain, rather than to fit the specific task domain.
In the training phase of TCDCN, the multi-task facial landmark (MTFL) dataset [24] is used as the training data. This dataset contains 12,995 face images collected from the Internet. The images are annotated with (1) five facial landmarks and (2) attributes of gender, wearing glasses, and head pose.
The procedure of the training of the TCDCN aims to obtain the optimal model by adjusting the parameters dynamically. To express the influence of different parameters on the performance of the TCDCN, a loss function is introduced during training. In this paper, the least square method is used as the loss function for the main task and the cross-entropy loss function for the auxiliary task. The loss function of the main task is shown as the following:
where, L is the loss function, i represents the ith sample, N represents the total number of samples, y is the predicted value, and is the true value.
The cross entropy loss function of auxiliary task (gender, face position, and wearing glasses) is shown as the following:
where, the loss function L, means that the probability of sample X reaches the maximum value under the condition of classification Y.
Through the training of the TCDCN, the face of the driver can be obtained accurately, which provides a stable face image for the following algorithms.
2.2. Facial Landmarks and Auxiliary Task
In this paper, the fatigue is monitored by the eyes and mouth states of the driver. It is key to obtain the landmarks and shape of the eyes and mouth. Dlib is an open-source toolkit for machine learning algorithms and facial landmarks detection. In this study, using the Dlib’s training model, 68 landmarks are calibrated and imaged with OpenCV, and 68 landmarks are drawn on the face. As mentioned above, TCDCN uses face-related attributes to learn the location of facial feature points. Through this multi-task learning, it can improve the robustness of facial feature point detection. Specifically, it is to conduct multiple tasks learning (including gender, whether wearing glasses, and face posture) at the same time when detecting facial feature points. These auxiliary attributes can help to locate feature points better. The pose of faces with related attributes are represented by 68 landmarks, as shown in Figure 3 and Figure 4.
2.3. Driver Fatigue Recognition Features
After a review of the relevant literature, there are two general types of fatigue in human facial expressions: yawning (the mouth is wide-open and remains in this state for a relatively long time) and winking (or slightly closed eyes, with increased or slower blinking). This research focusses on the data of eye-opening and closing states (eye aspect ratio: EAR), percentage of eye closure time (PERCLOS), and mouth aspect ratio (MAR). Based on these data, the attention concentration of drivers can be calculated in real time, and whether drivers are drowsy can be analyzed in time.
2.3.1. EAR/MAR: An Outstanding Feature for Eyes/Mouth State Recognition
In [33], a conceptual model is proposed for real-time eye blink detection using facial landmarks. However, the detection performance might be limited by the following facts: (1) it is evident that EAR (eye aspect ratio) fluctuates greatly when wearing glasses and (2) it is challenging to deal with photo pixels. The lower the number of pixels, the faster the processing, but also a certain resolution is required to improve the recognition.
As mentioned above, the proposed method in this paper is different from the traditional method of calculating blink image processing. Using the EAR/MAR by TCDCN is a more concise solution regardless of whether the driver wears glasses or not. No matter whether the driver wears glasses or not, the scheme can accurately identify the eye feature points and it is a very simple calculation based on the distance ratio between eye feature points to identify driver fatigue.
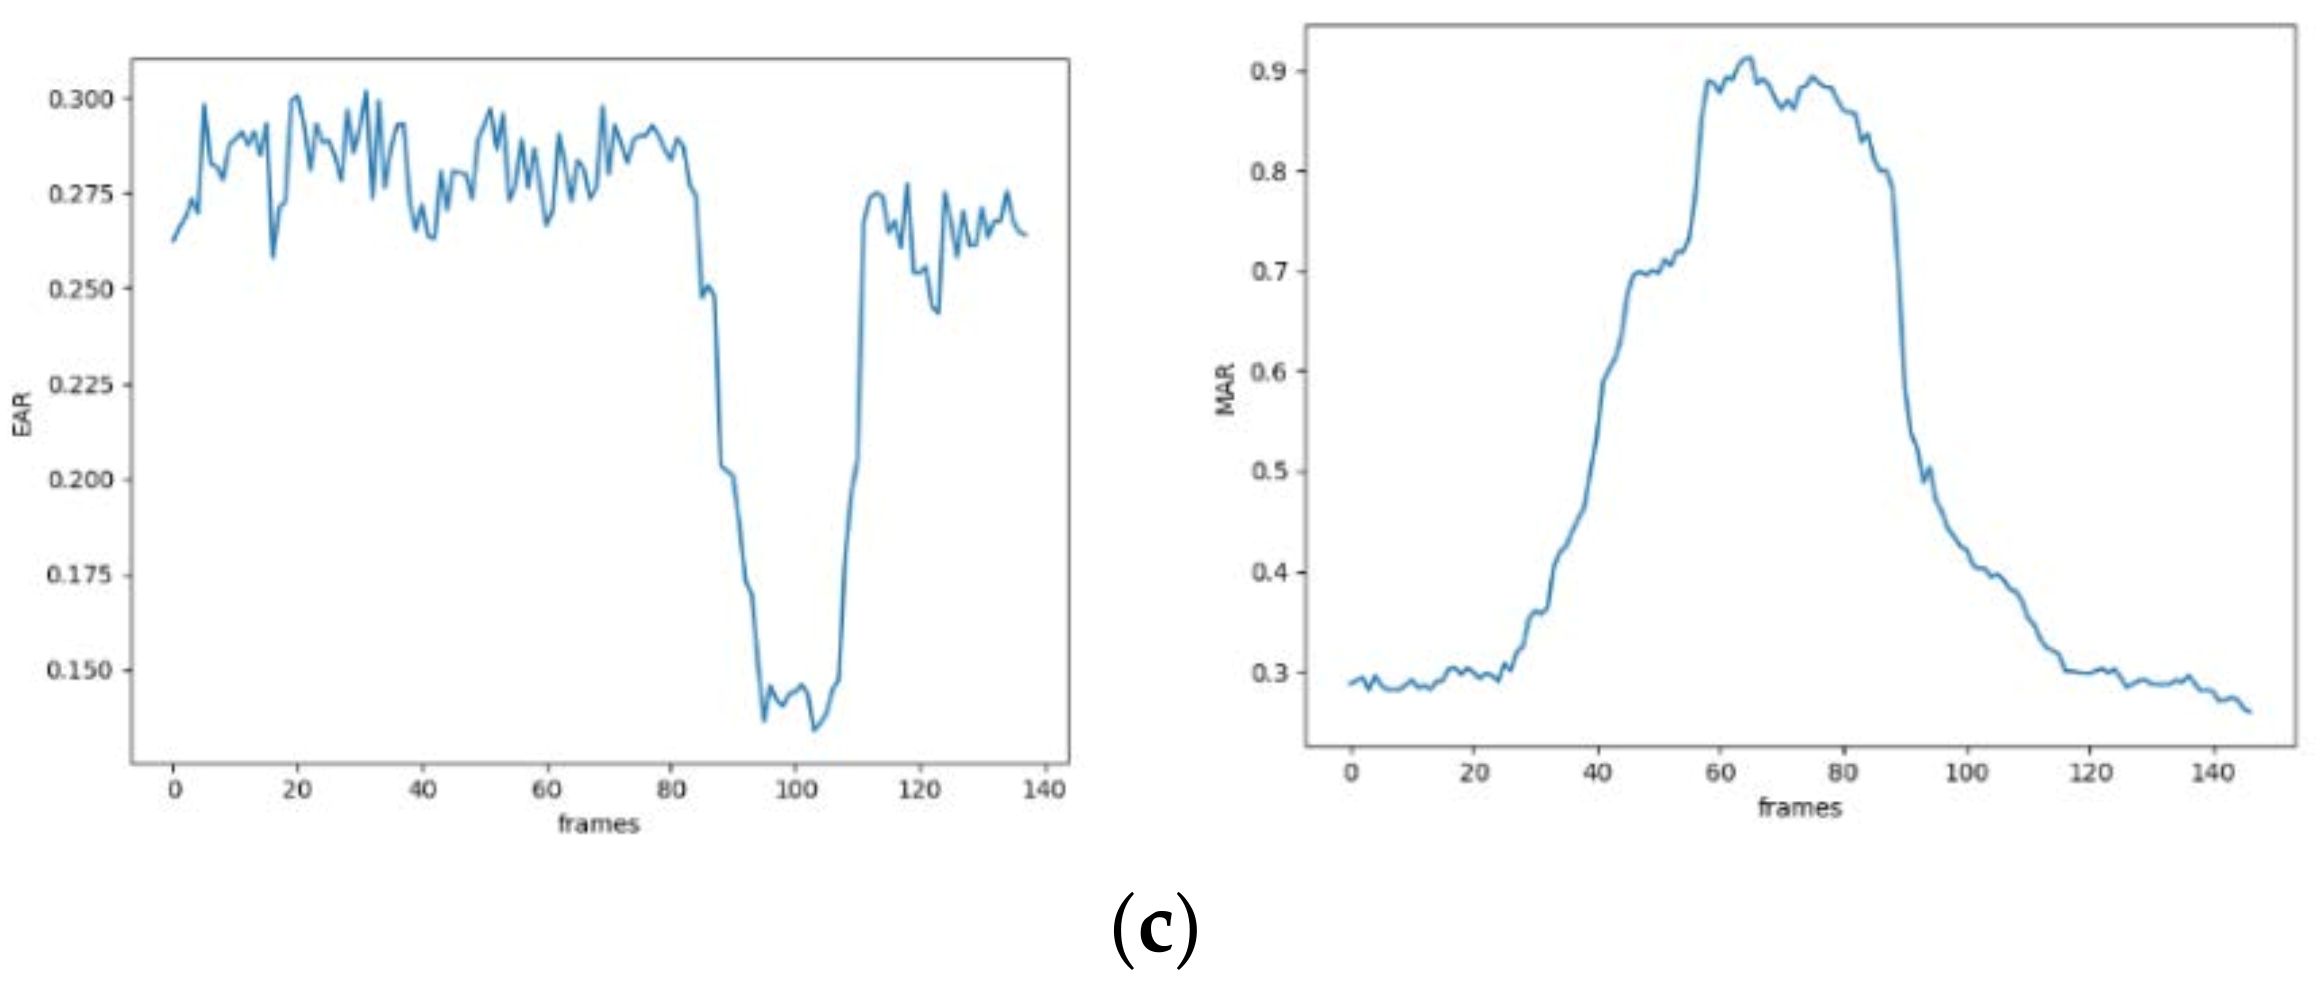
In Figure 5a,b, P2, P3, P5, and P6 key points are the value of longitudinal coordinate; P1, P4 key points are the value of horizontal coordinate. The value of EAR/MAR can be calculated according to key points.
As shown in Figure 5c, the two diagrams correspond to the change of the MAR curve in yawning state and the change of the ear curve in the one eye closing process, respectively. The ordinate values on the figure are MAR and EAR values corresponding to different times. The EAR value drops rapidly to close to zero, and then rises rapidly, representing that the driver blinks once. When the eyes of the driver are open, the EAR is over 0.2, or when the EAR is less than 0.2, it means that the eyes of the driver closed due to dozing [34]. When the driver yawns, the wider the mouth opens, the greater the MAR value, which determines that the driver yawns. According to the experimental curve, when the driver’s mouth yawns, the MAR value is more than 0.60. Therefore, the values of EAR/MAR can be adopted to detect whether the driver is fatigue driving.
2.3.2. PERCLOS: An Effective Cue for Driver Fatigue Detection
Percentage of eyelid closure over the pupil over time (PERCLOS) is defined as the degree of eye closure within a certain time. It is an effective method to measure the fatigue state. PERCLOS judges fatigue driving by the time proportion of eye closure. Because the size of eyes varies from person to person, the area of eyes changes dynamically due to the influence of the scene and head movement, and the opening degree of eyes is relative to its maximum opening state. The time can be converted into the number of video frames for calculation, and the degree of drowsiness of the driver can be judged according to the PERCLOS threshold [35]. When the proportion of eye closure in a certain time interval exceeds the threshold, it is considered as the fatigue state. PERCLOS can be computed by:
where is the number of drowsy video frames and is the total number of video frames in a specific time.
In the online identification module, is 300 frames. If PERCLOS is greater than the threshold, where the threshold is 0.8 in this paper, the driver is assessed as driving drowsily.
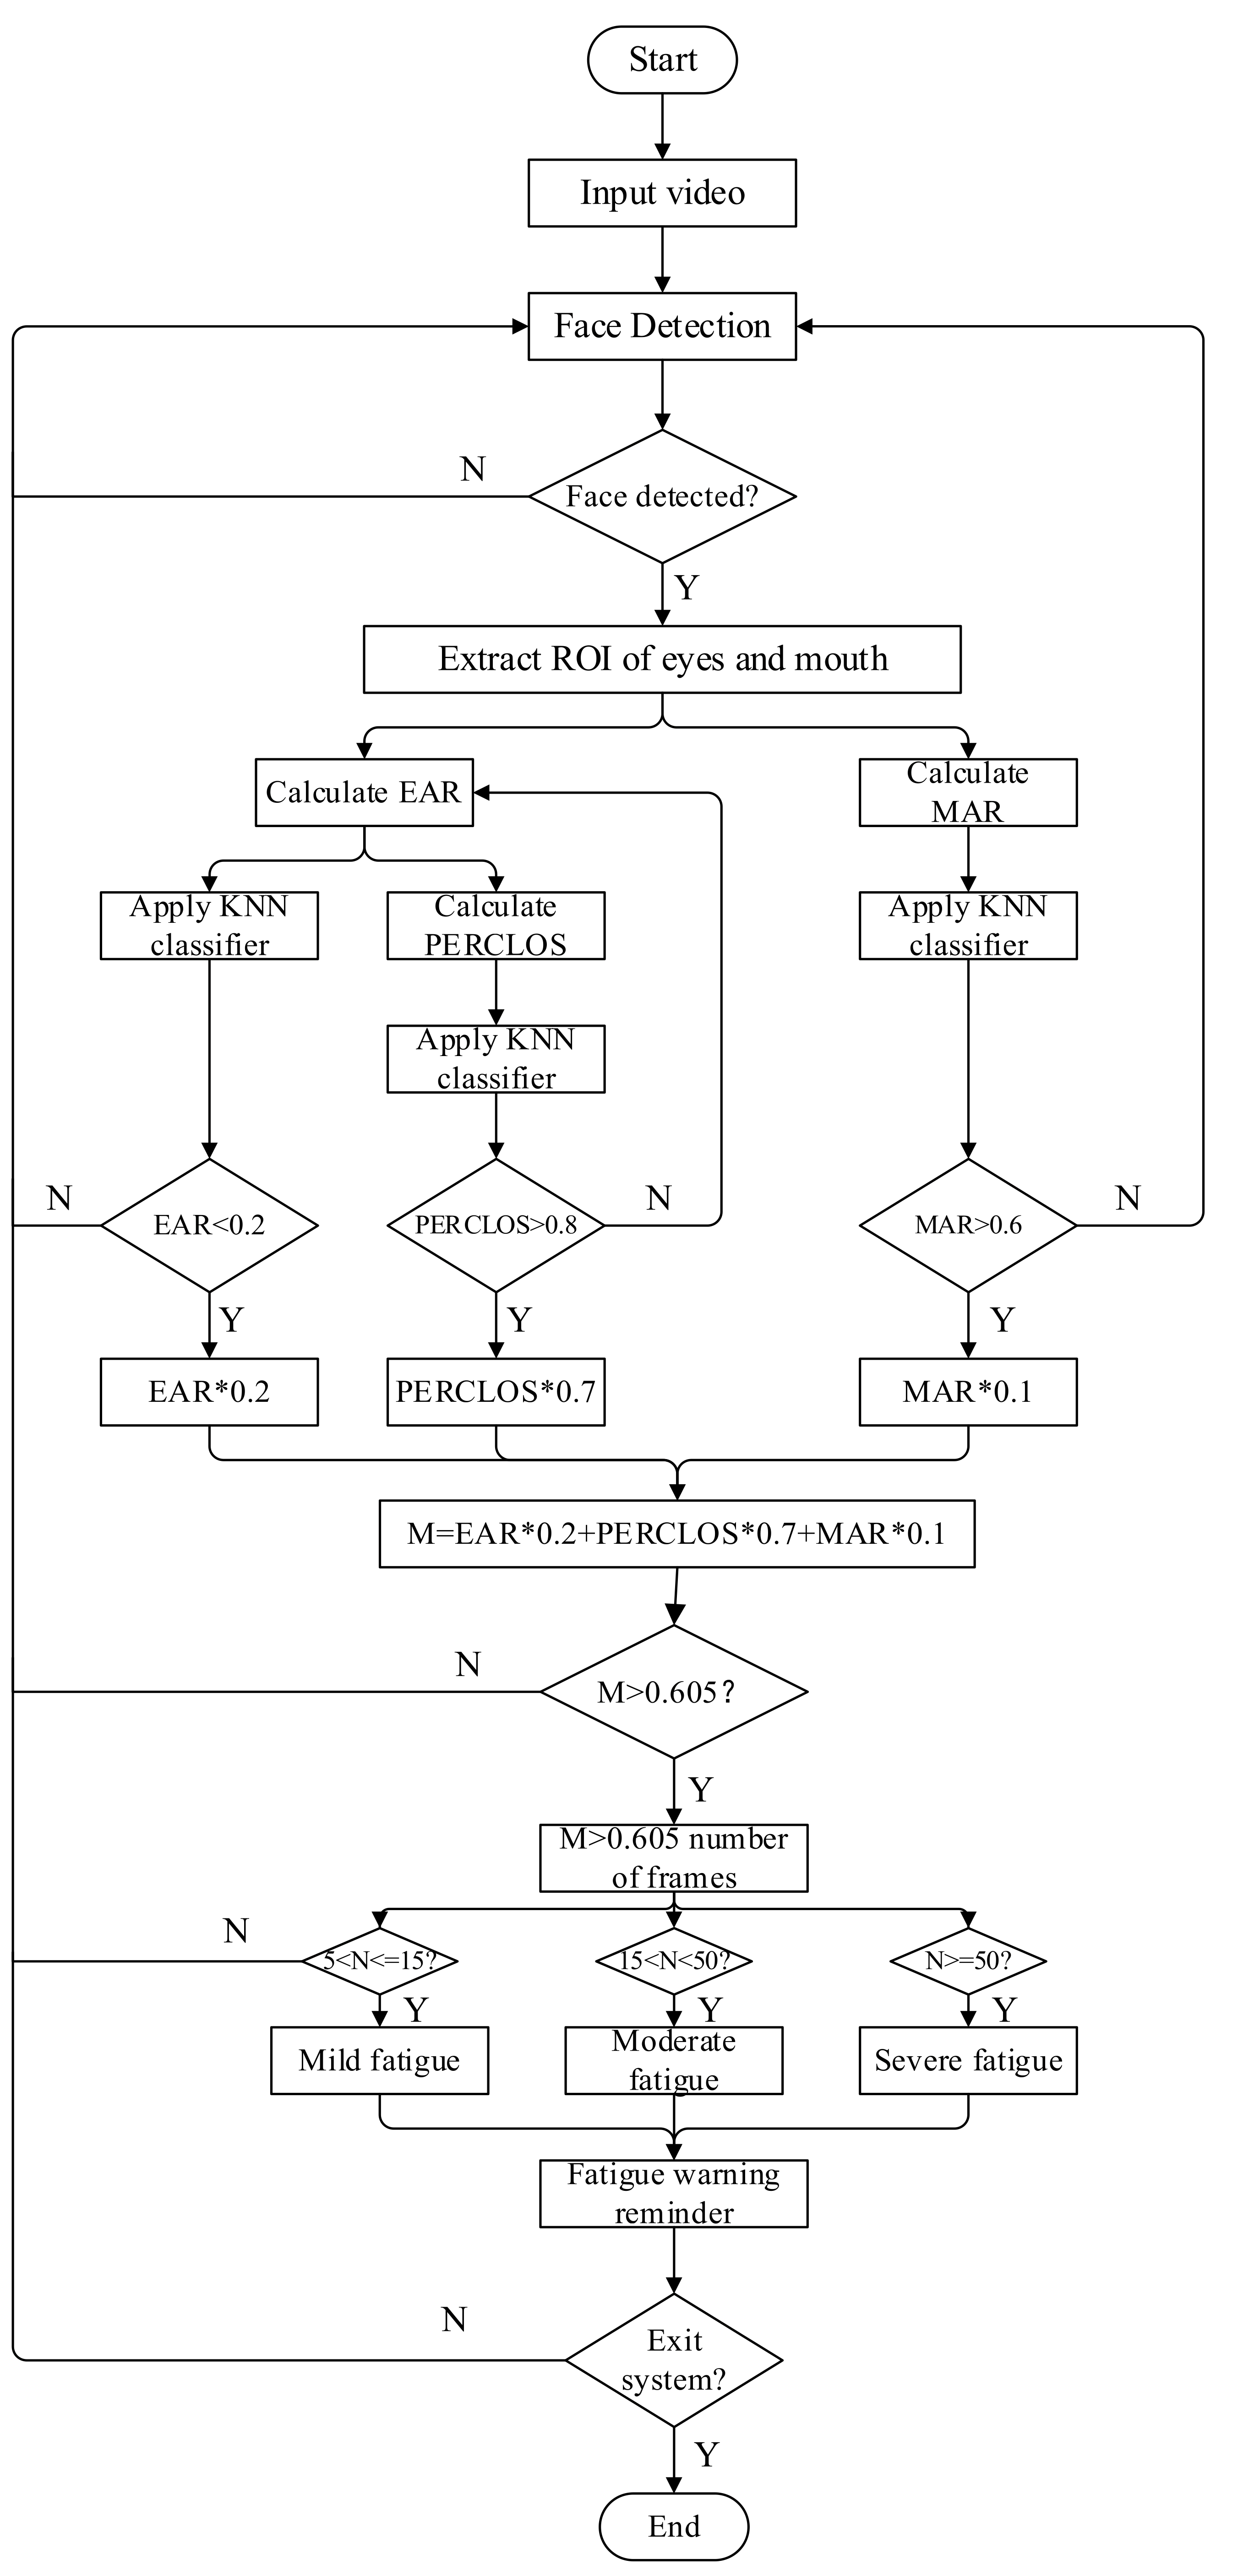
2.3.3. The Flow Chart of Online Monitoring
As mentioned previously, driver fatigue is a process of dynamic change. In this paper, we have proposed a comprehensive identifier to judge the driver fatigue state. Compared with the traditional single fatigue index, the identifier has the characteristics of high identification accuracy and good reliability in driver fatigue identification.
The flow chart of the on-line monitoring system for driver fatigue status is as follows:
- (1)
- The camera collects video input, detects each frame of image, and filters out the image containing face.
- (2)
- ROI (region of interest) of eyes and mouth of face image are extracted.
- (3)
- Based on the extracted ROI, EAR and MAR are calculated for the eye and mouth regions, respectively, to obtain the values of EAR and MAR. According to the obtained EAR value, PERCLOS is calculated, and the obtained EAR, PERCLOS, and MAR values are applied to K-nearest neighbor (KNN), respectively.
- (4)
- Through experiments, the threshold of EAR is set to 0.2 and the threshold of PERCLOS is set to 0.8 according to the p80 criterion.
- (5)
- When the Mar value is greater than 0.6, the driver is considered to start yawning, and the Mar threshold is set to 0.6.
- (6)
- Set the weight values of EAR and PERCLOS to 0.2 and 0.8, respectively, and the Mar value is the auxiliary value, and its weight value is 0.1.
- (7)
- Through experimental calculation, it is reasonable that the M threshold is 0.605. In this part, N is recorded as the number of times M > 0.605 (i.e., the cumulative length of driver’s eyes closed within a certain period of time).
- (8)
- According to the experimental results, when 10 < N < = 20, mild fatigue; 20 < N < 50, moderate fatigue; N ≥ 50, severe fatigue.
In Figure 6, M is a newly proposed comprehensive index to judge the driver’s fatigue degree. The specific acquisition method is to add the calculated EAR, PERCLOS, and MAR values according to their respective weight proportion to obtain M. The number of frames when M > 0.605 in a certain time is recorded as N. In the detection algorithm, the detection cycle is set to 90 frames, that is, the fatigue degree is determined according to the number of frames N with M greater than 0.605 in the detection cycle. When 10 < N ≤ 20, it is marked as mild fatigue; when 20 < N < 50, moderate fatigue; and when N ≥ 50, severe fatigue.
A KNN classifier is trained with the input data. KNN algorithm is a widely used and practical classifier model in the field of data classification and processing [28]. For the existing sample data set, the distance between the measured sample data reference point and other arbitrary data points is calculated in the form of the K classification threshold, so as to realize the classification and recognition of any given sample data points.
Firstly, in the KNN classifier model, the calculated distance between data set and the sample reference point with the set threshold K is often used as the reference index of the tested data, which can effectively solve the matching optimization problem between the sample points . Then, the Euclidean distance is selected as the measurement criterion of the sample data tested.
Then there is the selection of the K value. In the KNN algorithm, the accuracy of calculation results largely depends on the selection of the K value. Therefore, if the selection of the K value in the dataset classifier is too large or too small, it will produce a deviation in the data classification results, which is not conducive to the final fitting effect of the classification model. However, for different data sets, there is no fixed empirical value (usually set to 5 by default). Generally, a smaller value can be selected according to the distribution of sample data parameter sets. At the same time, an appropriate K value can also be obtained through multiple cross iteration verification.
The choice of K will have a significant impact on the results of the algorithm. If the K value is small, it is equivalent to using the training example in a small neighborhood for prediction. In extreme cases, k = 1, the test example is only related to the closest sample, and the training error is very small. However, if the sample happens to be noise, the prediction will be wrong, and the test error is very large. That is, when the value of K is small, over fitting will occur. If the K value is large, it is equivalent to using the training examples in a large neighborhood for prediction. In the extreme case, k = n. The result of the test example is the class with the most instances in the training data set, which will produce underfitting. In the paper, the smaller K is generally selected and K = 7.
3. Experimental Data and Results
In this section, we first evaluate the effectiveness of the proposed TCDCN in the face detection dataset and benchmark (FDDB) [36], and then discuss the correlation between Ear/MAR, PERCLOS values, and eye/mouth opening and closing. Finally, we conduct a large number of experiments to evaluate the speed and accuracy of the performance of our proposed algorithm.
3.1. Environment and Data Set
The experimental platform consists of an Intel Core i7-10750 (main frequency: 2.60 GHz) with x86 architecture, NVIDIA GeForce GTX1650, 16 GB DDR4, opencv3.4.11 image library, Dlib 19.17.0 tool kit, and the deep learning computing framework is Tensorflow2.5.
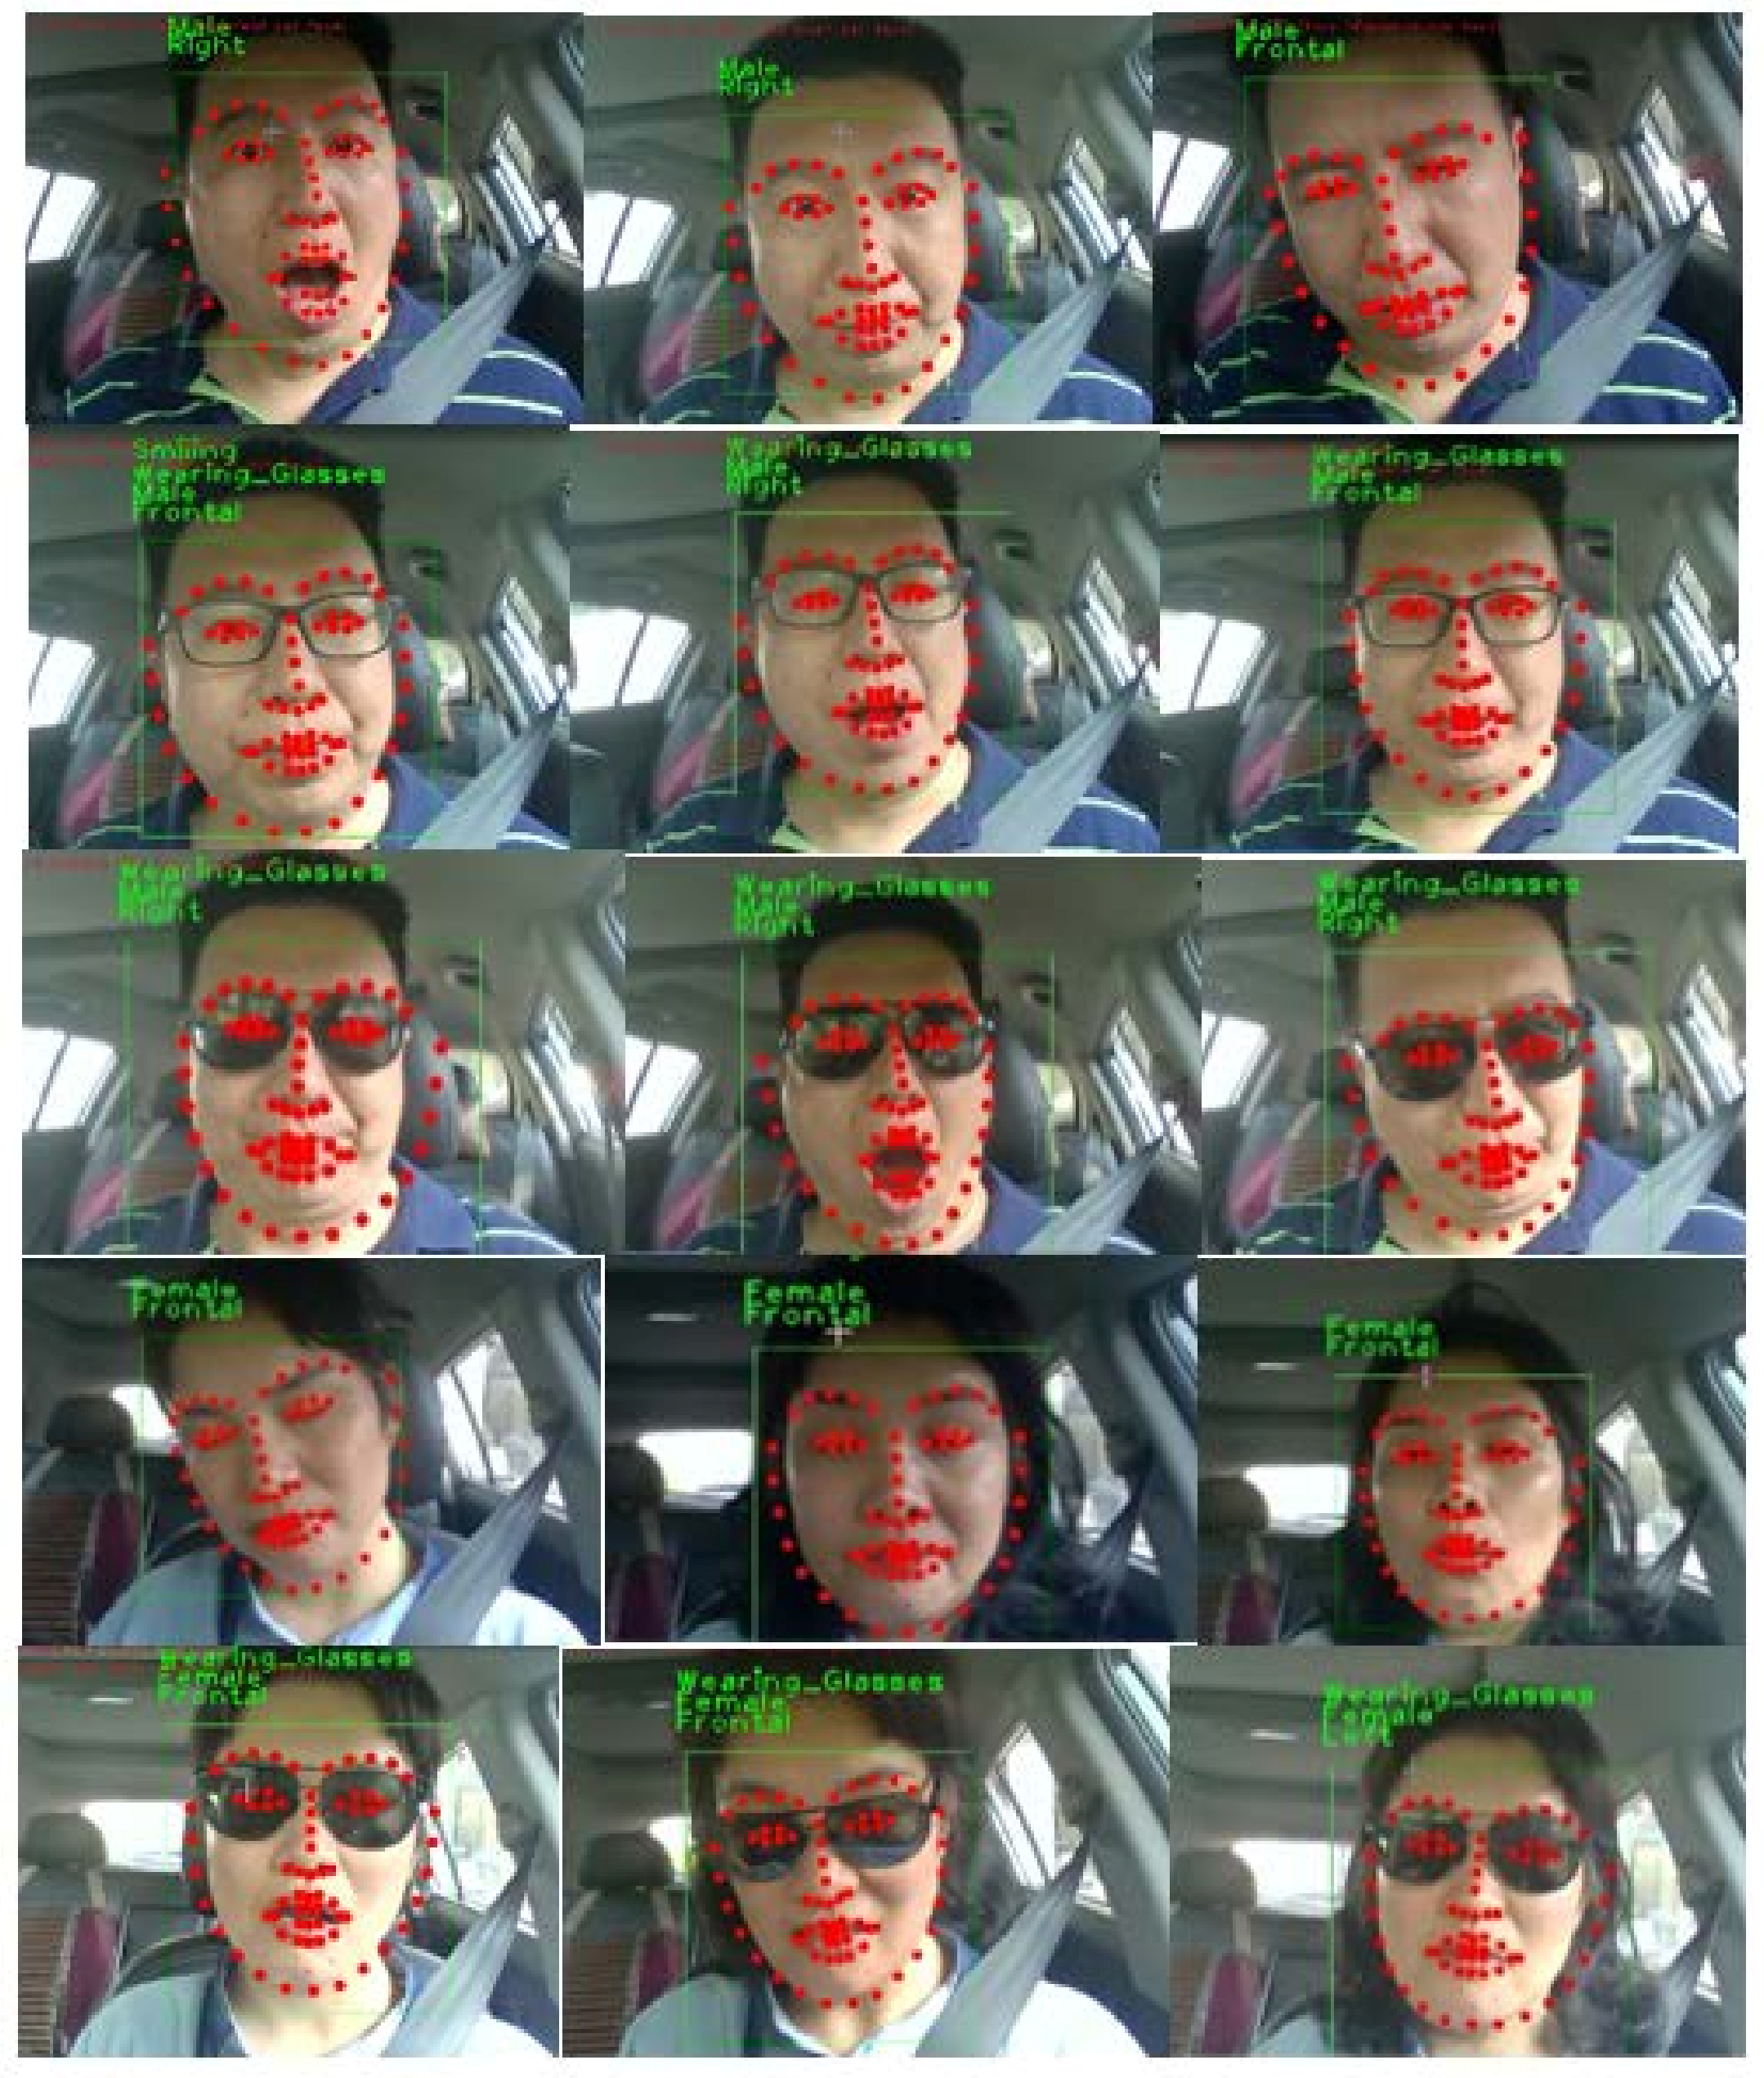
In this paper, we mainly use two types of data sets for experiments. The first type is FDDB, which is a face area data set used to study unconstrained face detection. This data set contains 5171 faces taken from the faces in the wild data set, as shown in Figure 7. The second type is our own video dataset. We collect video datasets of drivers driving vehicles, including awake drivers and sleepy drivers, as shown in Figure 8. Our video data were collected from 10 drivers (20 to 45 years old, 5 female drivers) and 30 driving tests. All of the participants were required to have a driving license, drive more than 2000 km per year, and have no reported related sicknesses. We asked to avoid drinking alcohol or caffeine-content drinks before the tests. Participants had a familiarization drive before the main tests. Each driving test was 30 min in duration. The driven track is a closed path simulating a two lane motorway that has some smooth turns and participants were required to drive about 40 km during the tests.
In order to verify the correctness of the above driver fatigue detection algorithm, we conducted a short-term test and a long-term test verification. The purpose of the short-term test verification is mainly to identify typical signs of drowsy driving. The long-term test verification is mainly to verify whether the proposed algorithm can accurately determine whether the driver is dozing during long-term driving, and classify it according to the degree of dozing, such as mild fatigue, moderate fatigue, and severe fatigue.
3.2. Short-Term Test
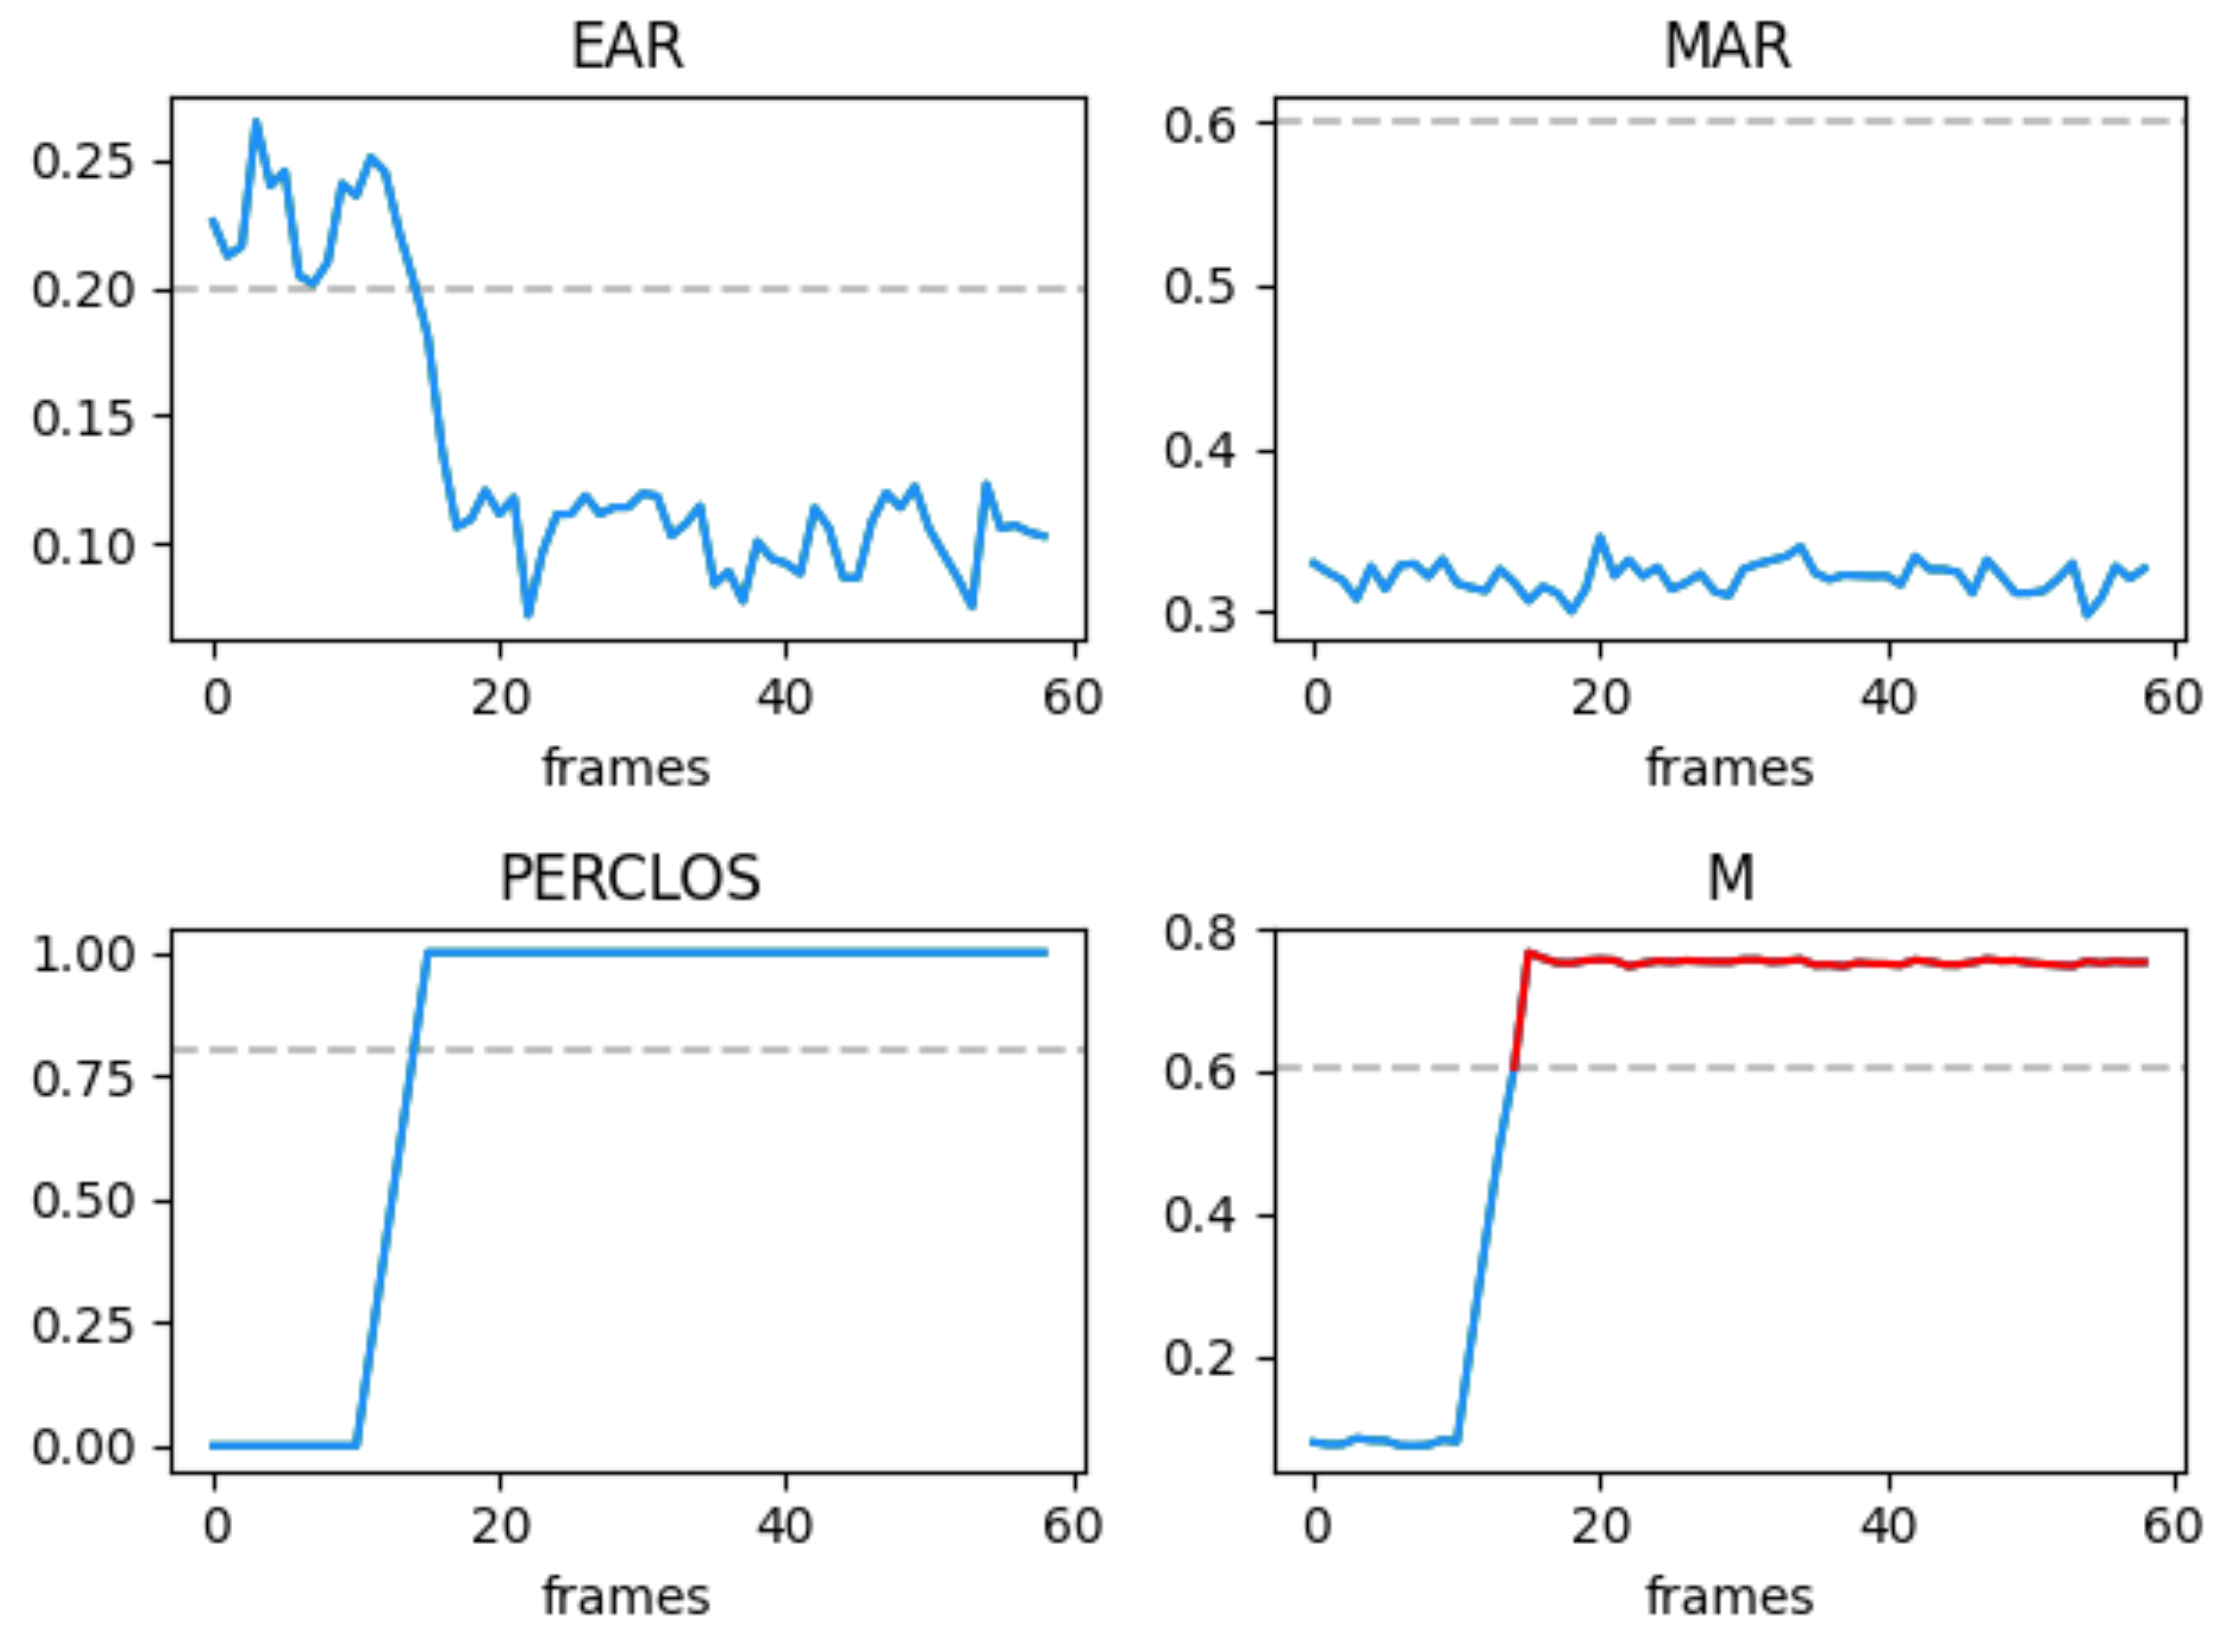
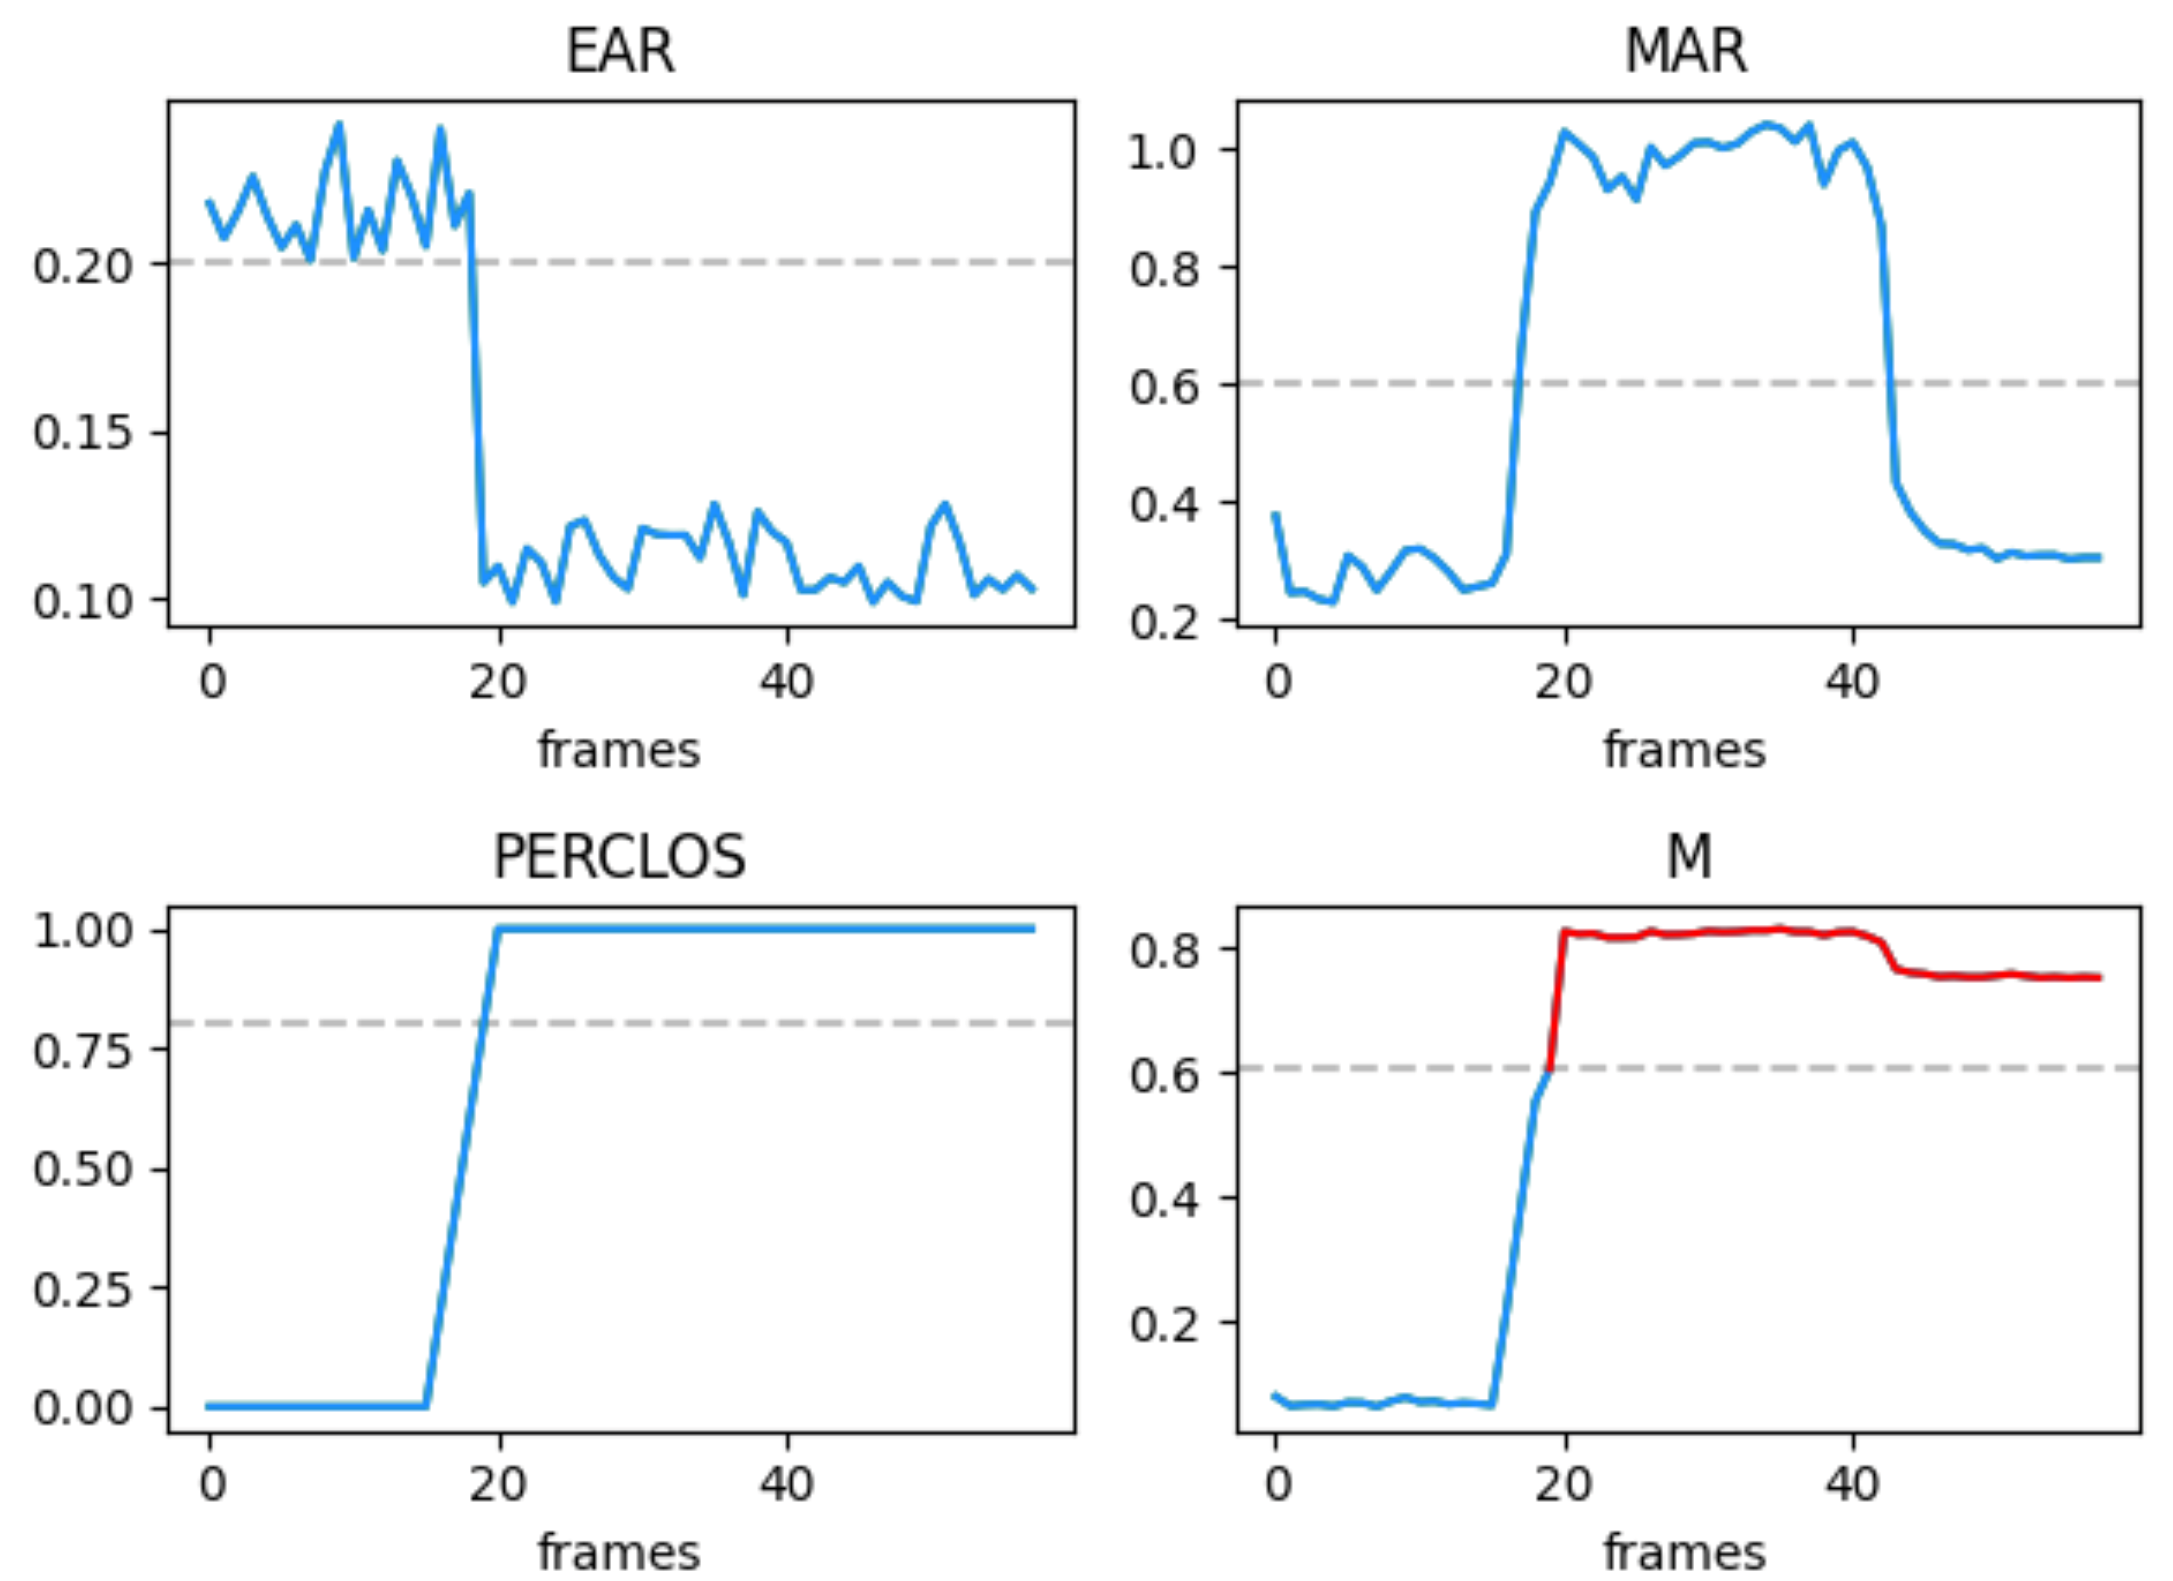
In order to verify the effectiveness of the proposed fatigue detection algorithm with individual differences, a series of experiments is conducted. Firstly, we compared the accuracy of fatigue detection using the fatigue threshold (0.605), EAR threshold (0.2), PERCLOS threshold (0.8), and MAR threshold (0.6). Then, we ask the different drivers to carry on the drowsy driving without yawning and drowsy driving with yawning to determine whether the core thresholds in the fatigue identification algorithm are effective. Figure 9 and Figure 10 show the recognition results of the states of the eye, mouth, and fatigue threshold value (M) during drowsiness time.
It can be seen from Figure 9 and Figure 10 that the algorithm can effectively identify the real-time changes of eye and mouth states with the individual driver, whether the driver yawns or not, and warn the driver of fatigue when the fatigue warning threshold is exceeded (red line in Figure 9 and Figure 10).
3.3. Long-Term Test in Different Driving Conditions
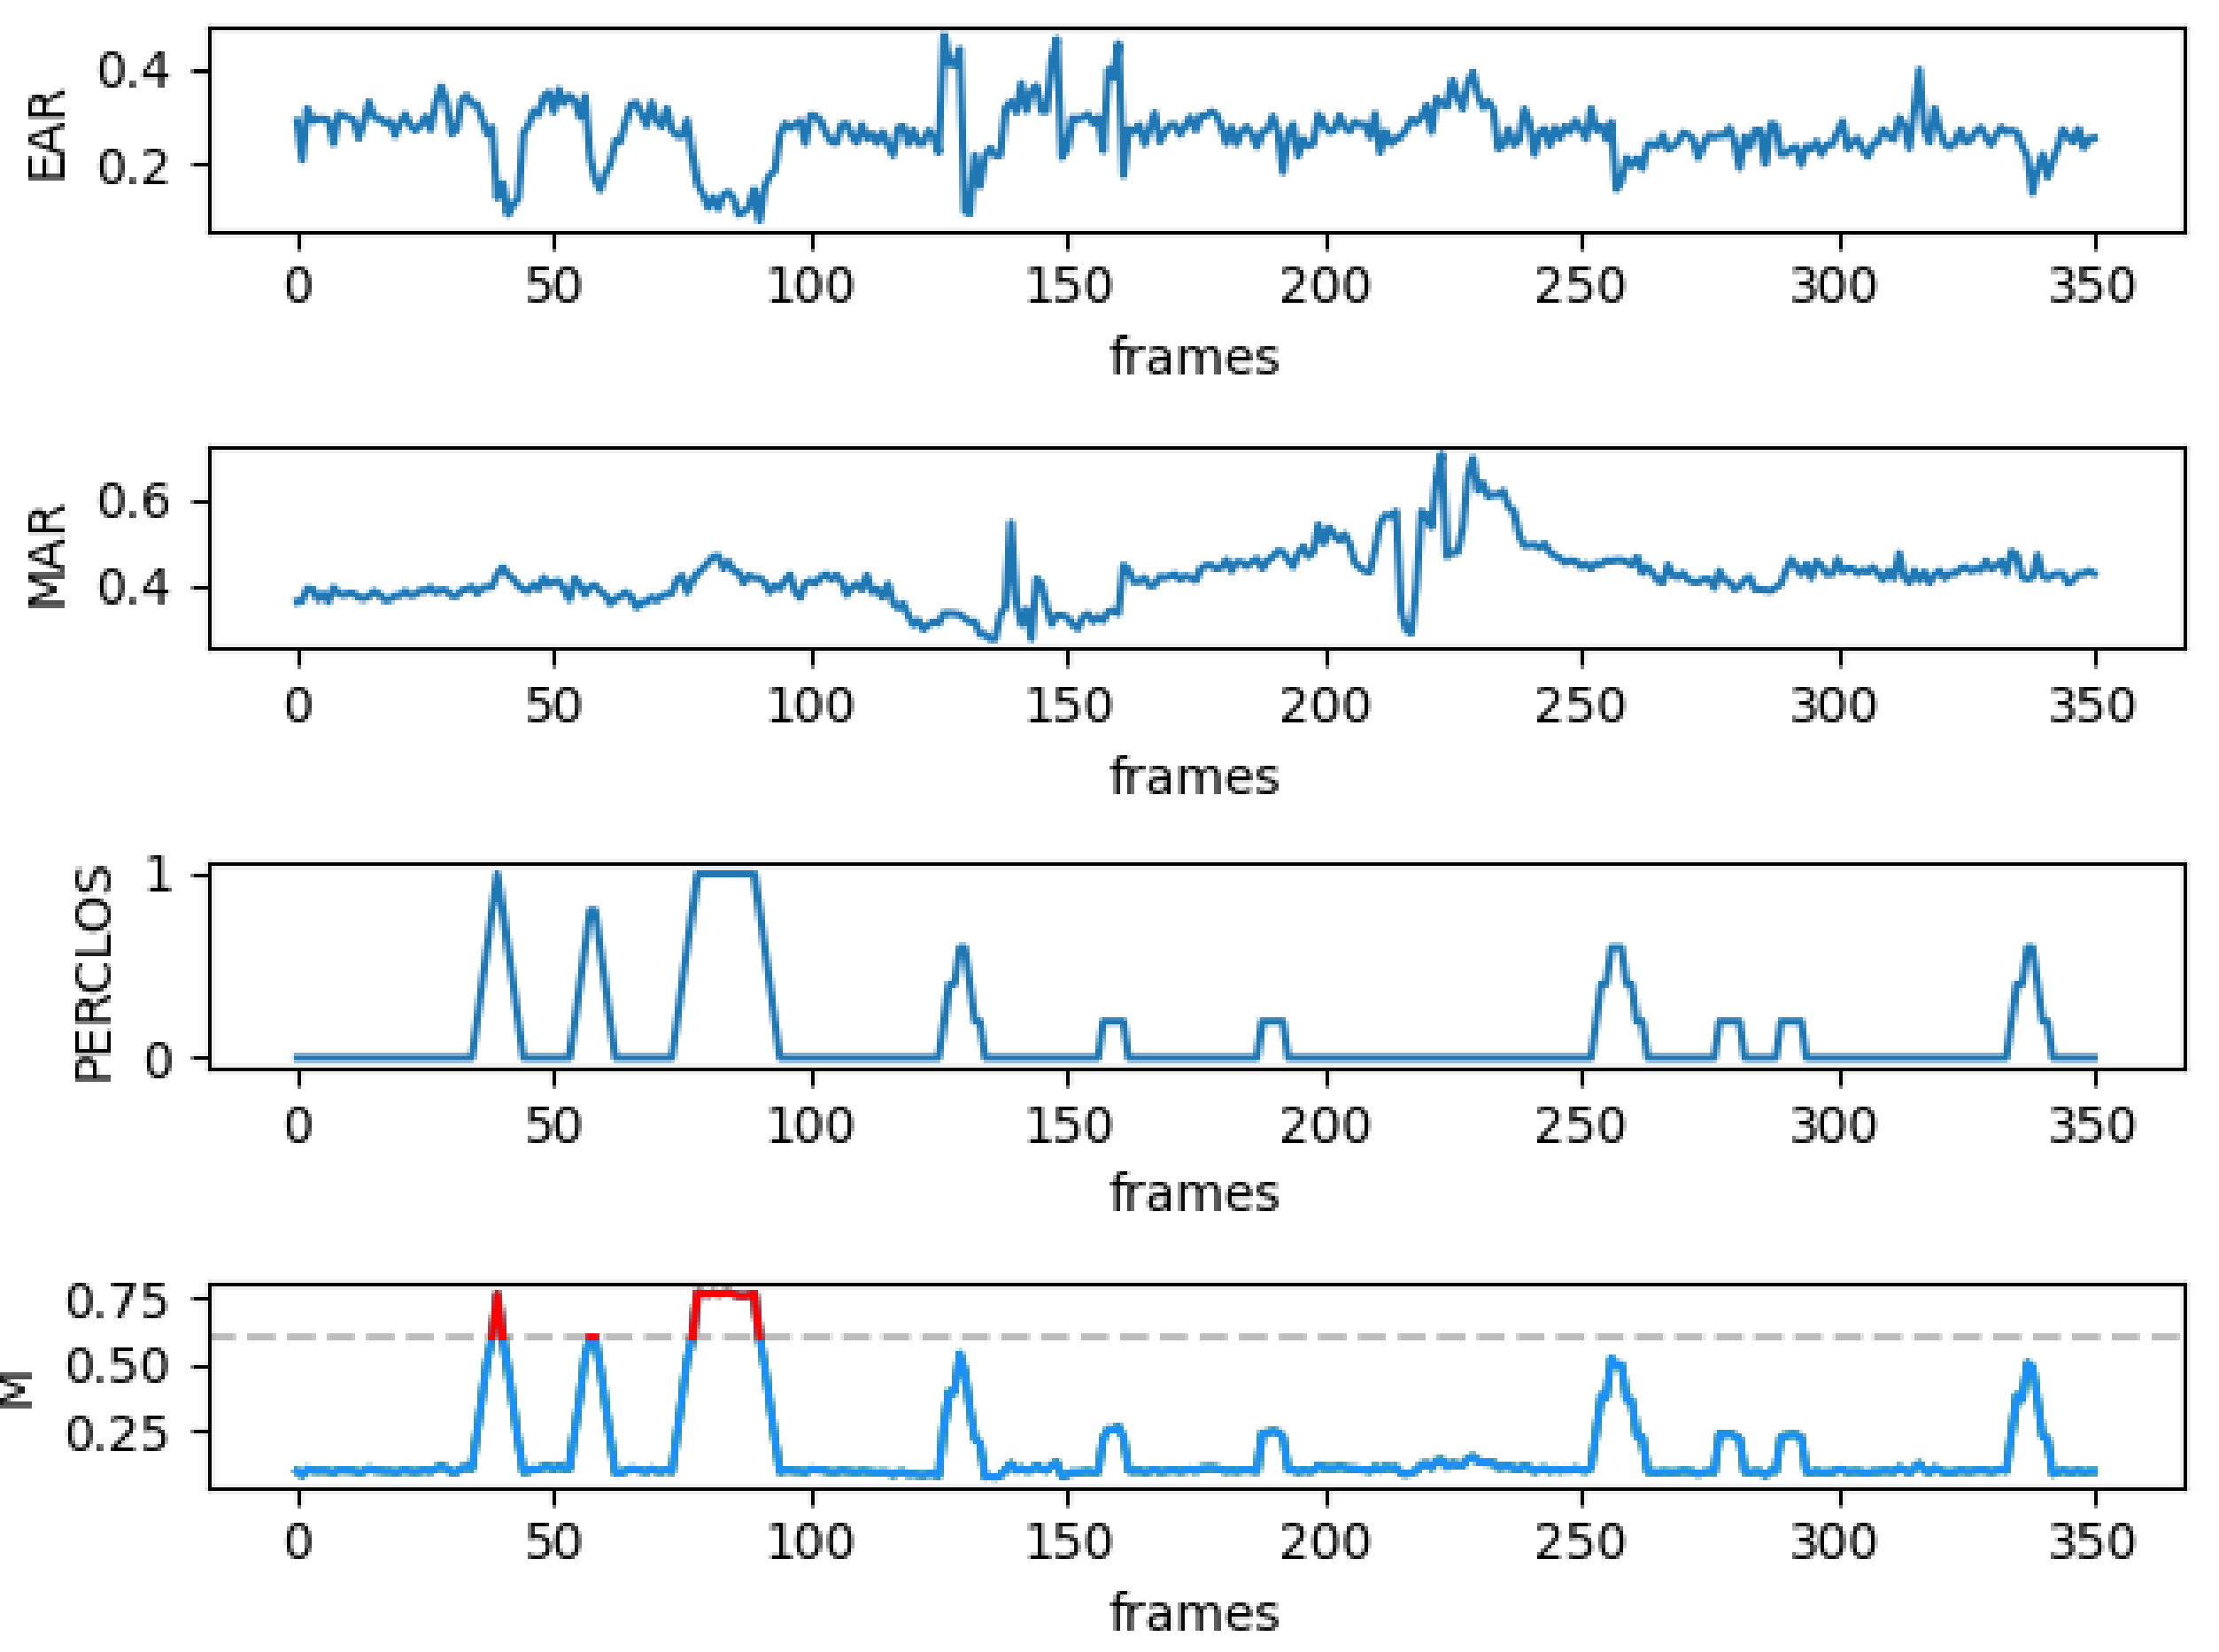
In the short-term test, we found a relationship between EAR, PERCLOS, MAR, fatigue warning threshold M, and the driver fatigue state. In order to visually evaluate the changes of eye and mouth states under various driving conditions, we require the drivers to carry on two driving conditions, one is drowsy driving, as shown in Figure 11, and the other is normal driving, as shown in Figure 12.
Figure 11 demonstrates one typical condition that when the driver is in drowsy driving state, throughout the driving period, the values of EAR, MAR, PERCLOS, and M are greater than their threshold values. According to the proposed algorithm, this research can accurately identify the drowsiness and yawning caused by fatigue (red line part), and automatically determines the state of drowsiness: mild fatigue, moderate fatigue, or severe fatigue at this time.
Figure 12 shows one typical condition that when the driver is in normal driving state, the values of EAR, MAR, PERCLOS, and M are much less than their threshold most of the driving time. Fatigue warning (red line part) occurs in some places due to the occasional blinking at that moment, rather than dozing and yawning out of fatigue, which means during the long period of driving, the driver is sober.
In Figure 11 and Figure 12, M is the judgment index of facial multi feature fusion which is used to judge the driver’s fatigue. Each parameter is fused and calculated according to different weights, that is, it ensures the accuracy of detection and avoids missing detection or false detection. Moreover, the driver’s fatigue state is judged according to the size of the N value.
In this study, when the driver finished the driving, they were asked to finish the questionnaire about each segment (when the M line in Figure 11 and Figure 12 is red) according to the video. Finally, the value of scoring from the drivers can be used as the ground truth of driver fatigue levels. The self-report assessment questionnaire is shown in Table 1.
The test results show that the accuracy of the whole detection system reaches 95.1%, which meets the requirements of the fatigue detection system in the actual situation.
In summary, the algorithm proposed in this paper can accurately identify different driver fatigue states online, and lays a theoretical and practical foundation for driver fatigue online detection based on deep learning and facial multi-feature fusion.
4. Conclusions
Research on fatigue driving detection technology is the top priority for research in reducing traffic accidents caused by fatigue, which is of great significance to traffic safety. As far as we know, the current driving fatigue detection generally makes a single detection based on the state of the eyes or mouth, and there is little research on the comprehensive detection based on facial multi-feature fusion. However, the accuracy of single feature fatigue detection is inadequate, and it is prone to false recognition. In order to solve the above problems, this paper mainly carries out the following research:
- (1)
- A comprehensive driving fatigue detection method based on multi-facet feature fusion based on TCDCN deep learning is proposed, which makes comprehensive use of facial features (such as eyes and mouth) to fuse visual information and effectively improve the accuracy of driving fatigue detection. The experimental results show that the proposed algorithm can greatly improve the detection accuracy of driving fatigue under various driving conditions.
- (2)
- The EAR/MAR/PERCLOS calculated through TCDCN is a more concise solution regardless of whether the driver wears glasses or not. No matter whether the driver wears glasses or not, the TCDCN method can accurately identify the eye feature points. This feature is very important for subsequent driving fatigue detection.
- (3)
- The fatigue detection algorithm proposed in this paper can not only effectively identify the driver’s fatigue state such as dozing and yawning in real time, but also automatically determine the level of fatigue for a driver: mild, moderate, or severe fatigue.
- (4)
- In the future research work, we will focus on the following aspects: (1) the above research will be installed on a real vehicle to further verify the recognition effect of similar driving conditions at night; and (2) we will add other visual features to fuse information, such as the driver’s head posture.
Author Contributions
Conceptualization, T.Z. and C.Z.; methodology, T.W.; software, J.L.; validation, Z.O. and W.L.; analysis, T.Z. and X.N.; investigation, H.L. and C.Z.; resources, T.Z.; data curation, C.Z.; writing—original draft preparation, T.Z.; writing—review and editing, T.Z. All authors have read and agreed to the published version of the manuscript.
Funding
This work was supported in part by the Teaching Quality and Reform of Higher Vocational Education Project of Guangdong Province (GDJG2019463), the Characteristic innovation project of Guangdong Provincial Department of Education (2019KTSCX201), the Hebei Province Key R & D Project (17394501D), the Zhaoqing Research and Development Technology and Application of Energy Conservation and Environmental Protection Ecological Governance (2020SN004), and the Quality Engineering Project of Zhaoqing University (zlgc202034), Special Projects in Key Fields of Colleges and Universities of Guangdong Province (New Generation Information Technology: 2021ZDZX1061).
Informed Consent Statement
Informed consent was obtained from all subjects involved in the study.
Acknowledgments
All individuals included in this section have consented to the acknowledgement.
Conflicts of Interest
The authors declare no conflict of interest.
References
- Amodio, A.; Ermidoro, M.; Maggi, D.; Formentin, S.; Savaresi, S.M. Automatic detection of driver impairment based on pupillary light relex. IEEE Trans. Intell. Transp. Syst. 2019, 20, 3038–3048. [Google Scholar] [CrossRef]
- Li, X.; Lian, X.; Liu, F. Rear-End Road Crash Characteristics Analysis Based on Chinese In-Depth Crash Study Data. CICTP 2016, 2016, 1536–1545. [Google Scholar] [CrossRef]
- Williamson, A.; Lombardi, D.A.; Folkard, S.; Stutts, J.; Courtney, T.; Connor, J. The link between fatigue and safety. Accid. Anal. Prev. 2011, 43, 498–515. [Google Scholar] [CrossRef] [PubMed]
- Zhang, G.; Yau, K.K.; Zhang, X.; Li, Y. Traffic accidents involving fatigue driving and their extent of casualties. Accid. Anal. Prev. 2016, 87, 34–42. [Google Scholar] [CrossRef]
- Borghini, G.; Astolfi, L.; Vecchiato, G.; Mattia, D.; Babiloni, F. Measuring neurophysiological signals in aircraft pilots and car drivers for the assessment of mental workload, fatigue and drowsiness. Neurosci. Biobehav. Rev. 2014, 44, 58–75. [Google Scholar] [CrossRef]
- Davidovi, J.; Pei, D.; Lipovac, K.; Anti, B. The significance of the development of road safety performance indicators related to driver fatigue. Transp. Res. Procedia 2020, 45, 333–342. [Google Scholar] [CrossRef]
- Cui, Z.; Sun, H.M.; Yin, R.N. Real-time detection method of driver fatigue state based on deep learning of face video. Multimed. Tools Appl. 2021, 80, 25495–25515. [Google Scholar] [CrossRef]
- Hu, X.; Lodewijks, G. Exploration of the effects of task-related fatigue on eye-motion features and its value in improving driver fatigue-related technology. Transp. Res. Part F Traffic Psychol. Behav. 2021, 80, 150–171. [Google Scholar] [CrossRef]
- You, F.; Li, Y.-H.; Huang, L.; Chen, K.; Zhang, R.-H.; Xu, J.-M. Monitoring drivers’ sleepy status at night based on machine vision. Multimed. Tools Appl. 2017, 76, 14869–14886. [Google Scholar] [CrossRef]
- Ren, S.; Cao, X.; Wei, Y.; Sun, J. Face Alignment at 3000 FPS via Regressing Local Binary Features. In Proceedings of the 2014 IEEE Conference on Computer Vision and Pattern Recognition, Columbus, OH, USA, 23–28 June 2014; pp. 1685–1692. [Google Scholar]
- Zhang, K.; Zhang, Z.; Li, Z.; Qiao, Y. Joint Face Detection and Alignment Using Multitask Cascaded Convolutional Networks. IEEE Signal Process. Lett. 2016, 23, 1499–1503. [Google Scholar] [CrossRef] [Green Version]
- Chaudhuri, A.; Routray, A. Driver Fatigue Detection through Chaotic Entropy Analysis of Cortical Sources Obtained From Scalp EEG Signals. IEEE Trans. Intell. Transp. Syst. 2019, 21, 185–198. [Google Scholar] [CrossRef]
- Zhang, C.; Ma, J.; Zhao, J.; Liu, P.; Cong, F.; Liu, T.; Li, Y.; Sun, L.; Chang, R. Decoding Analysis of Alpha Oscillation Networks on Maintaining Driver Alertness. Entropy 2020, 22, 787. [Google Scholar] [CrossRef] [PubMed]
- He, K.; Zhu, Y.; He, Y.; Liu, L.; Lu, B.; Lin, W. Detection of Malicious PDF Files Using a Two-Stage Machine Learning Algorithm. Chin. J. Electron. 2020, 29, 1165–1177. [Google Scholar] [CrossRef]
- Hao, Z.; Wan, G.; Tian, Y.; Tang, Y.; Dai, T.; Liu, M.; Wei, R. Research on Driver Fatigue Detection Method Based on Parallel Convolution Neural Network. In Proceedings of the 2019 IEEE International Conference on Power, Intelligent Computing and Systems (ICPICS), Shenyang, China, 30–31 May 2019; pp. 164–168. [Google Scholar]
- Liu, W.; Sun, H.; Shen, W. Driver fatigue detection through pupil detection and yawing analysis. In Proceedings of the 2010 International Conference on Bioinformatics and Biomedical Technology, Chengdu, China, 16–18 April 2010; pp. 404–407. [Google Scholar]
- Wadhwa, A.; Roy, S.S. Driver drowsiness detection using heart rate and behavior methods: A study. Data Anal. Biomed. Eng. Healthc. 2021, 55, 163–177. [Google Scholar]
- Villanueva, A.; Benemerito, R.L.L.; Cabug-Os, M.J.M.; Chua, R.B.; Rebeca, C.K.D.C.; Miranda, M. Somnolence Detection System Utilizing Deep Neural Network. In Proceedings of the 2019 International Conference on Information and Communications Technology (ICOIACT), Yogyakarta, Indonesia, 24–25 July 2019; pp. 602–607. [Google Scholar]
- Savas, B.K.; Becerikli, Y. Real Time Driver Fatigue Detection System Based on Multi-Task ConNN. IEEE Access 2020, 8, 1–17. [Google Scholar] [CrossRef]
- Zhang, Y.; Han, X.; Gao, W.; Hu, Y. Driver Fatigue Detection Based On Facial Feature Analysis. Int. J. Pattern Recognit. Artif. Intell. 2021, 35, 345–356. [Google Scholar] [CrossRef]
- Tuncer, T.; Dogan, S.; Ertam, F.; Subasi, A. A dynamic center and multi threshold point based stable feature extraction network for driver fatigue detection utilizing EEG signals. Cogn. Neurodyn. 2021, 15, 2533–2543. [Google Scholar] [CrossRef] [PubMed]
- Wang, F.; Xu, Q.; Fu, R. Study on the Effect of Man-Machine Response Mode to Relieve Driving Fatigue Based on EEG and EOG. Sensors 2019, 19, 4883. [Google Scholar] [CrossRef] [PubMed] [Green Version]
- Yang, Y.; Gao, Z.; Li, Y.; Cai, Q.; Marwan, N.; Kurths, J. A Complex Network-Based Broad Learning System for Detecting Driver Fatigue From EEG Signals. IEEE Trans. Syst. Man Cybern. Syst. 2019, 99, 1–9. [Google Scholar] [CrossRef]
- Min, J.; Xiong, C.; Zhang, Y.; Cai, M. Driver fatigue detection based on prefrontal EEG using multi-entropy measures and hybrid model. Biomed. Signal Process. Control 2021, 69, 102857–102865. [Google Scholar] [CrossRef]
- He, J.; Chen, J.; Liu, J.; Li, H. A Lightweight Architecture for Driver Status Monitoring via Convolutional Neural Networks. In Proceedings of the 2019 IEEE International Conference on Robotics and Biomimetics (ROBIO), Dali, China, 6–8 December 2019; pp. 388–394. [Google Scholar]
- Carlotta Olivetti, E.; Violante, M.G.; Vezzetti, E.; Marcolin, F.; Eynard, B. Engagement evaluation in a virtual learning environment via facial expression recognition and self-reports: A Preliminary Approach. Appl. Sci. 2020, 10, 314. [Google Scholar] [CrossRef] [Green Version]
- Useche, O.; El-Sheikh, E. An Intelligent System Framework for Measuring Attention Levels of Students in Online Course Environments. In Proceedings of the International Conference on Artificial Intelligence (ICAI), The Steering Committee of The World Congress in Computer Science, Computer Engineering and Applied Computing (WorldComp), Las Vegas, NV, USA, 27–30 July 2015; p. 452. [Google Scholar]
- Nonis, F.; Dagnes, N.; Marcolin, F.; Vezzetti, E. 3D Approaches and Challenges in Facial Expression Recognition Algorithms—A Literature Review. Appl. Sci. 2019, 9, 3904. [Google Scholar] [CrossRef] [Green Version]
- Teng, T.; Yang, X. Facial expressions recognition based on convolutional neural networks for mobile virtual reality. ACM Siggraph Conf. 2016, 1, 475–478. [Google Scholar]
- Freund, Y.; Schapire, R.E. A Decision-Theoretic Generalization of On-Line Learning and an Application to Boosting. J. Comput. Syst. Sci. 1997, 55, 119–139. [Google Scholar] [CrossRef] [Green Version]
- Zhang, Z.; Luo, P.; Loy, C.C.; Tang, X. Facial Landmark Detection by Deep Multi-task Learning. In European Conference on Computer Vision; Springer: Cham, Switzerland, 2014. [Google Scholar]
- Cheng, R.; Zhao, Y.; DAI, Y. An On-Board Embedded Driver Fatigue Warning System Based on Adaboost Method; Acta Scientiarum Naturalium Universitatis Pekinensis: Beijing, China, 2012; Volume 48, pp. 719–726. [Google Scholar]
- Shi-Ru, Q.U.; Peng, J.C. Design of multi-feature fusion driver fatigue state detection system based on FPGA. Transducer Microsyst. Technol. 2013, 32, 86–105. [Google Scholar]
- Dinges, D.F.; Grace, R. PERCLOS: A Valid Psychophysiological Measure of Alertness as Assessed by Psychomotor Vigilance; Technical Briefs; Federal Highway Administration, Office of Motor Carriers: Washington, DC, USA, 1998.
- Cheng, Q.; Wang, W.; Jiang, X.; Hou, S.; Qin, Y. Assessment of Driver Mental Fatigue Using Facial Landmarks. IEEE Access 2019, 7, 150423–150434. [Google Scholar] [CrossRef]
- Fddb Dataset Official. Available online: http://vis-www.cs.umass.edu/fddb/index.html (accessed on 7 October 2021).
Figure 1.
Schematic diagram of our approach.

Figure 2.
The architecture of TCDCN.

Figure 3.
Facial landmarks with gender.

Figure 4.
Facial landmarks with glasses.

Figure 5.
Eyes or mouth landmarks and the values of EAR/MAR; (a) eyes landmarks have significant differences (open or closed); (b) mouth landmarks have significant differences (open or closed); and (c) the values of EAR or MAR at open and closed states.
Figure 5.
Eyes or mouth landmarks and the values of EAR/MAR; (a) eyes landmarks have significant differences (open or closed); (b) mouth landmarks have significant differences (open or closed); and (c) the values of EAR or MAR at open and closed states.


Figure 6.
Online detection of driver fatigue.

Figure 7.
FDDB dataset.

Figure 8.
Face detection in different scenarios.

Figure 9.
Fatigue test results of the driver without yawning.

Figure 10.
Fatigue test results of the driver with yawning.

Figure 11.
EAR/MAR/PERCLOS and M under drowsy driving.

Figure 12.
EAR/MAR/PERCLOS and M under normal driving.


Table 1.
The self-report assessment of fatigue.
| Item | Description | Scale |
|---|---|---|
| 1 | Do you feel drowsy? | 1–4 |
| 2 | Do you have difficulty with thinking clearly? | 1–4 |
| 3 | Do you have difficulty with making an immediate response to a question? | 1–4 |
| 4 | Do you have difficulty with control over your muscles? | 1–4 |
| 5 | Do you have difficulty with focusing? | 1–4 |
Note: 1 indicates not at all; 2 a little; 3 moderate; and 4 severe.
Publisher’s Note: MDPI stays neutral with regard to jurisdictional claims in published maps and institutional affiliations. |
© 2022 by the authors. Licensee MDPI, Basel, Switzerland. This article is an open access article distributed under the terms and conditions of the Creative Commons Attribution (CC BY) license (https://creativecommons.org/licenses/by/4.0/).
Share and Cite
MDPI and ACS Style
Zhu, T.; Zhang, C.; Wu, T.; Ouyang, Z.; Li, H.; Na, X.; Liang, J.; Li, W. Research on a Real-Time Driver Fatigue Detection Algorithm Based on Facial Video Sequences. Appl. Sci. 2022, 12, 2224. https://doi.org/10.3390/app12042224
AMA Style
Zhu T, Zhang C, Wu T, Ouyang Z, Li H, Na X, Liang J, Li W. Research on a Real-Time Driver Fatigue Detection Algorithm Based on Facial Video Sequences. Applied Sciences. 2022; 12(4):2224. https://doi.org/10.3390/app12042224
Chicago/Turabian StyleZhu, Tianjun, Chuang Zhang, Tunglung Wu, Zhuang Ouyang, Houzhi Li, Xiaoxiang Na, Jianguo Liang, and Weihao Li. 2022. "Research on a Real-Time Driver Fatigue Detection Algorithm Based on Facial Video Sequences" Applied Sciences 12, no. 4: 2224. https://doi.org/10.3390/app12042224
Note that from the first issue of 2016, this journal uses article numbers instead of page numbers. See further details here.