
Mask R-CNN with New Data Augmentation Features for Smart Detection of Retail Products


1
Department of Computer Science and Information Engineering, National Ilan University, Yilan City 260, Yilan County, Taiwan
2
Department of Physics, University of California Santa Barbara, Santa Barbara, CA 93106, USA
*
Author to whom correspondence should be addressed.
Appl. Sci. 2022, 12(6), 2902; https://doi.org/10.3390/app12062902
Submission received: 31 December 2021
/
Revised: 1 March 2022
/
Accepted: 2 March 2022
/
Published: 11 March 2022
(This article belongs to the Special Issue Human-Computer Interactions)
Abstract
:Human–computer interactions (HCIs) use computer technology to manage the interfaces between users and computers. Object detection systems that use convolutional neural networks (CNNs) have been repeatedly improved. Computer vision is also widely applied to multiple specialties. However, self-checkouts operating with a faster region-based convolutional neural network (faster R-CNN) image detection system still feature overlapping and cannot distinguish between the color of objects, so detection is inhibited. This study uses a mask R-CNN with data augmentation (DA) and a discrete wavelet transform (DWT) in lieu of a faster R-CNN to prevent trivial details in images from hindering feature extraction and detection for deep learning (DL). The experiment results show that the proposed algorithm allows more accurate and efficient detection of overlapping and similarly colored objects than a faster R-CNN with ResNet 101, but allows excellent resolution and real-time processing for smart retail stores.
1. Introduction
Supermarket employees fulfill many tasks and lines of customers at the checkout area can increase because of staff shortages. This creates mental stress for employees and reduces customer satisfaction [1]. Therefore, there is increased demand for object-detection-powered self-checkouts, which allow a more efficient check-out; alleviate the workload for employees; and increase interaction between employees and customers, which creates a better shopping experience [2].
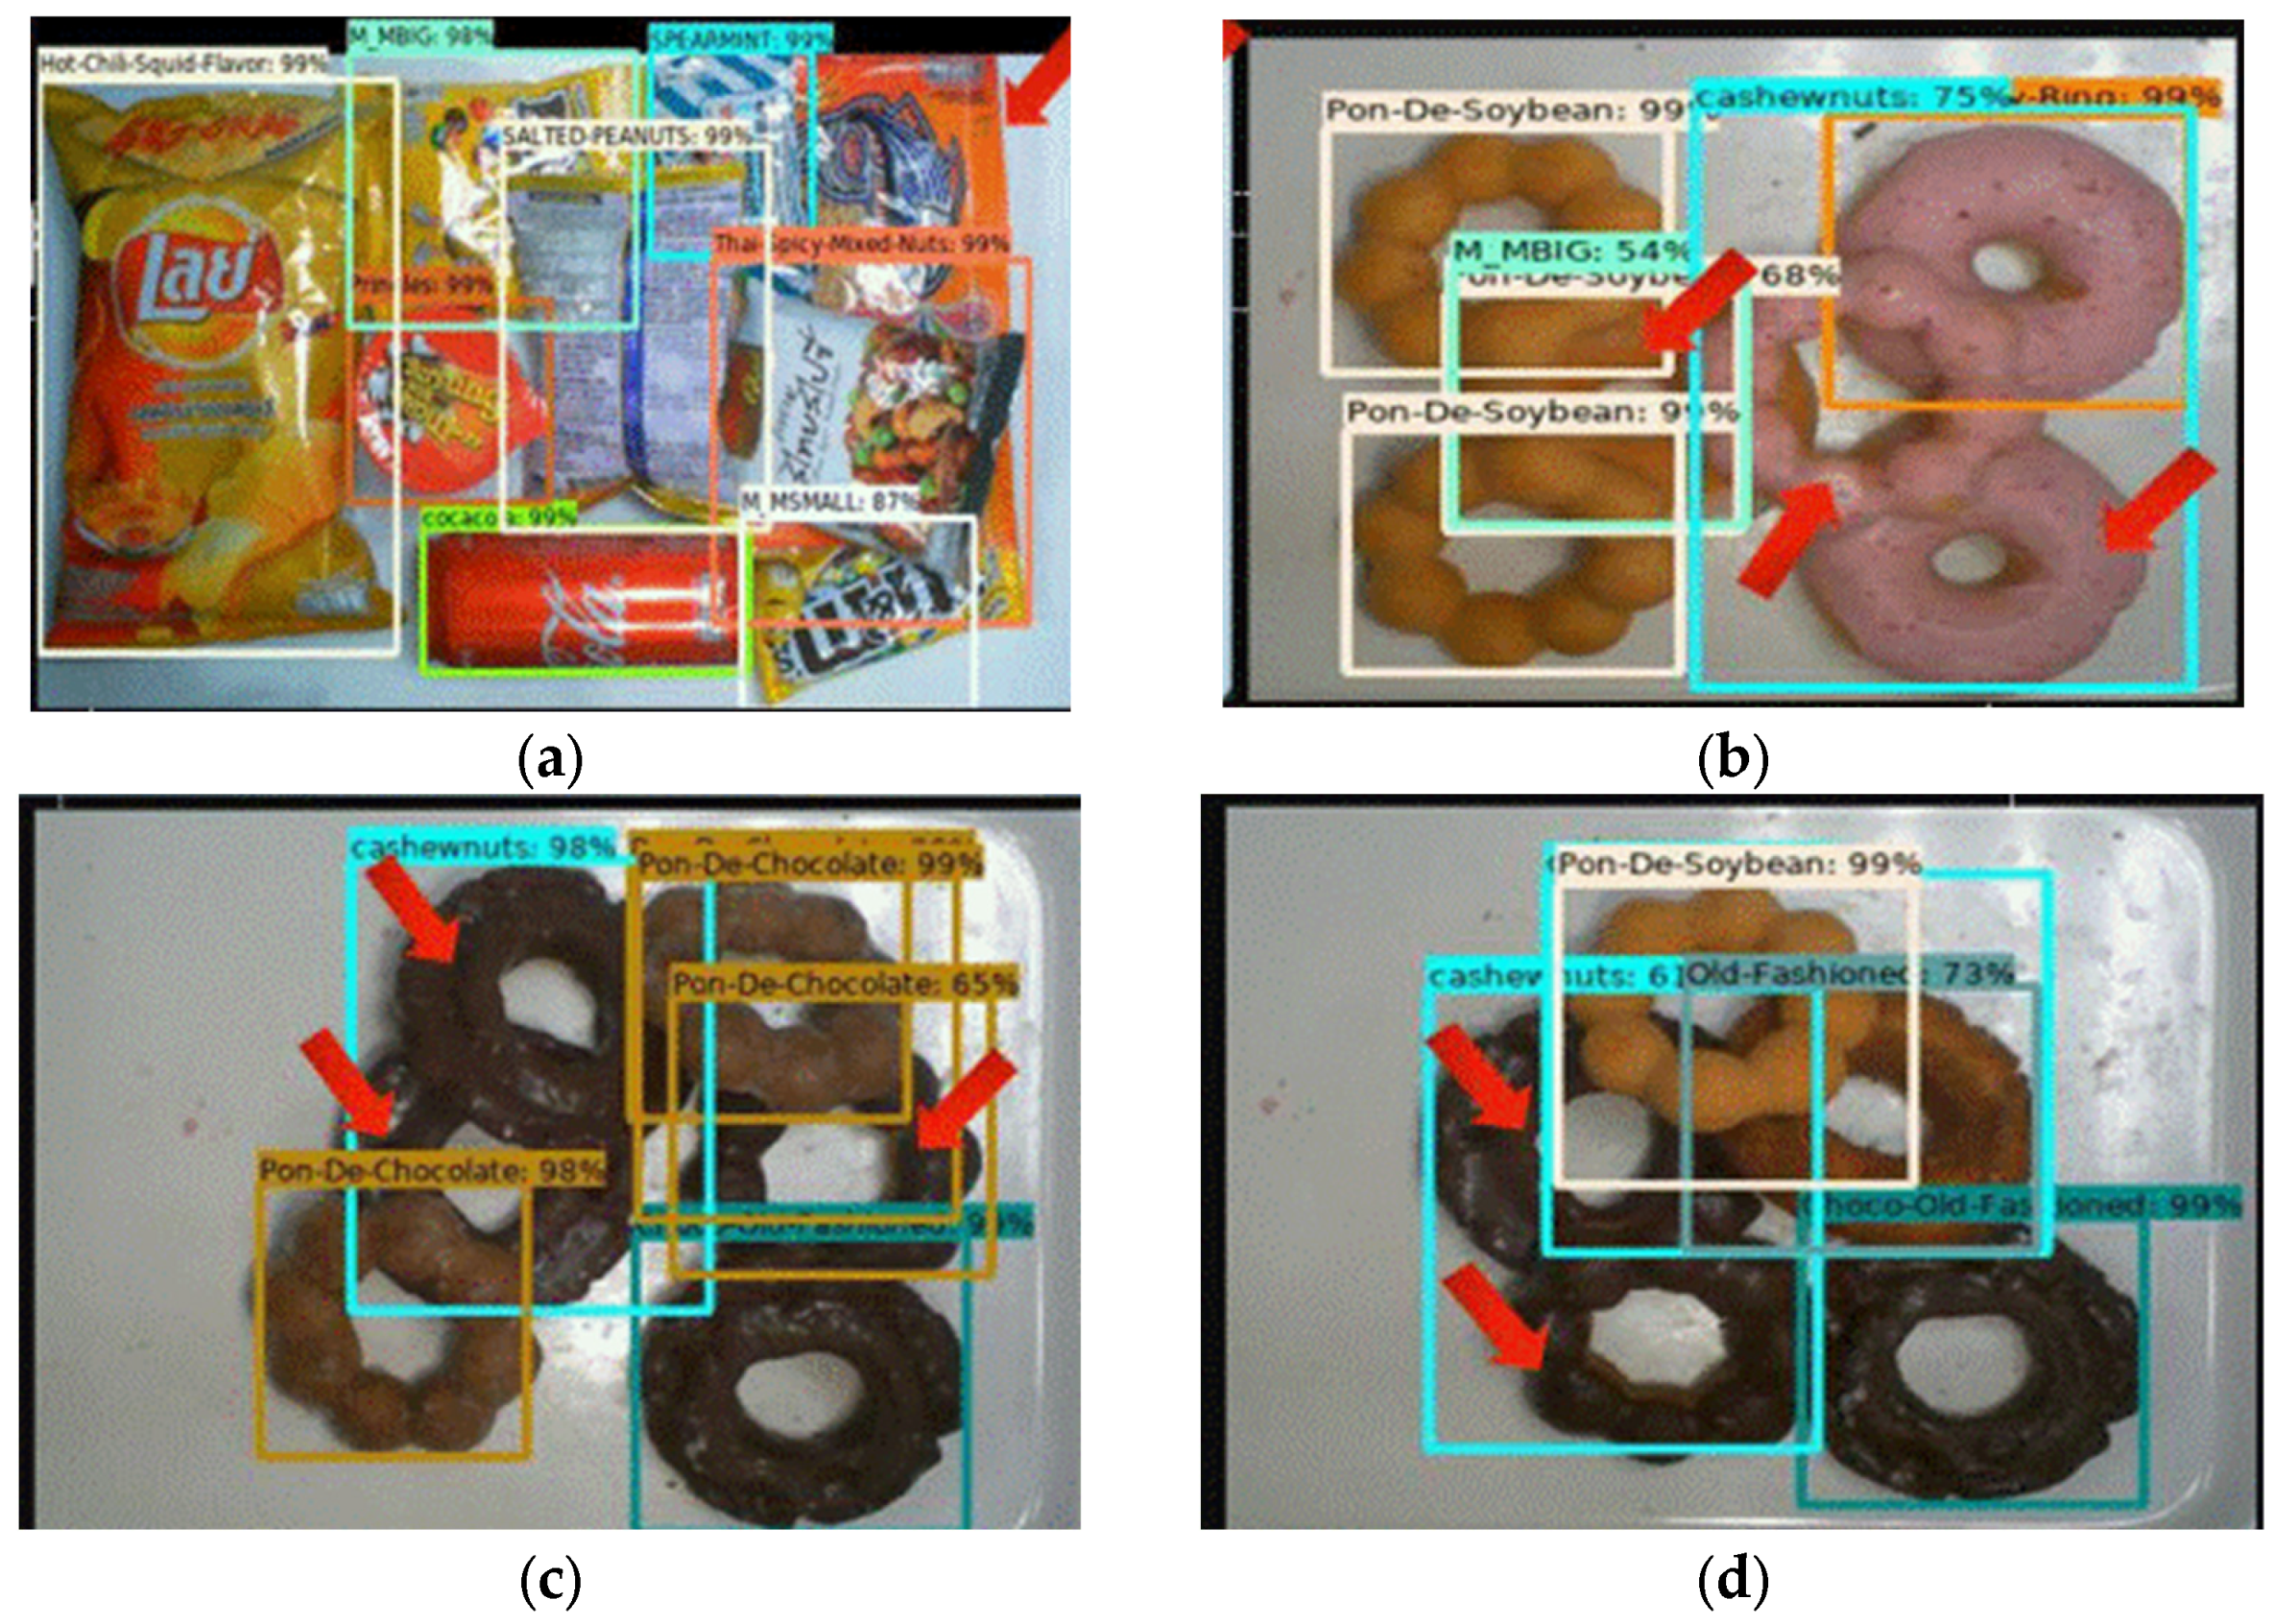
Figure 1 shows a self-checkout platform, which is a proof of concept (POC) developed for smart retail stores. Customers place goods on the base plate and operate the checkout using a touchscreen. The system captures an image of the products using a camera, detects and matches products, and calculates the bill. The effect of different lightings is the challenge most encountered by computer-vision-related tasks. To deal with such a problem, all images used in this research are captured by the self-checkouts, in order to ensure that all images are taken in an environment with stable, defined lightings, as shown in Figure 1. However, this method requires products to be leveled to prevent overlapping [2,3]. Current systems that utilize a faster region-based convolutional neural network (faster R-CNN) [4] and ResNet101 [5] and a pre-trained model that uses the COCO dataset have a mean average precision (mAP) of 95.71%. However, overlapping and failure to distinguish similarly colored objects lead to inadequate detection, so current systems require approximately 2 s to complete a detection, as shown in Figure 2 [2]. This study determines a faster method with a higher mAP detection.
A region-based convolutional neural network (R-CNN) [6] filters region proposals using a selective search (SS) [7]. A faster R-CNN defines proposals that are generated by passing feature maps through convolution as regional proposal networks (RPNs), so a fast R-CNN is faster than an R-CNN because 2000 region proposals are not fed to the convolutional neural network (CNN) for each detection event. Region of interest (ROI) pooling processes these proposals using max pooling and links them to fully connected networks.
ROI pooling can result in misalignment from the use of nearest neighbor interpolation, so this study uses ROI align. ROI align retains the floating points during quantization and uses bilinear interpolation during computation. This allows more accurate detection, but does not allow pixel-level masks, as shown in Table 1. The feature extraction of mask for an R-CNN [8] uses feature pyramid networks (FPNs) for object detection [9]. An FPN has a simple, yet effective top-to-bottom framework for solving multiscale modeling problems.
A mask R-CNN [8] performs better than a faster R-CNN. A mask R-CNN correctly detects cucumbers, for which the body and leaves are similarly colored [10]. It also distinguishes between 6different types of kitchen utensils [3] and discerns the borderlines of photovoltaic plants [11]. A mask R-CNN features greater average precision (AP), so it can detect the degree of vehicle damage to swiftly determine accident indemnities [12]. For sorting differently sized wooden planks, it has an AP of 98% [13], so it is used to classify the planks for manufacturers [14].
2. Proposed Methods
Before using a mask R-CNN, to obtain the detection results, the input images are rescaled and processed as shown in Figure 3.
2.1. A. Preprocessing
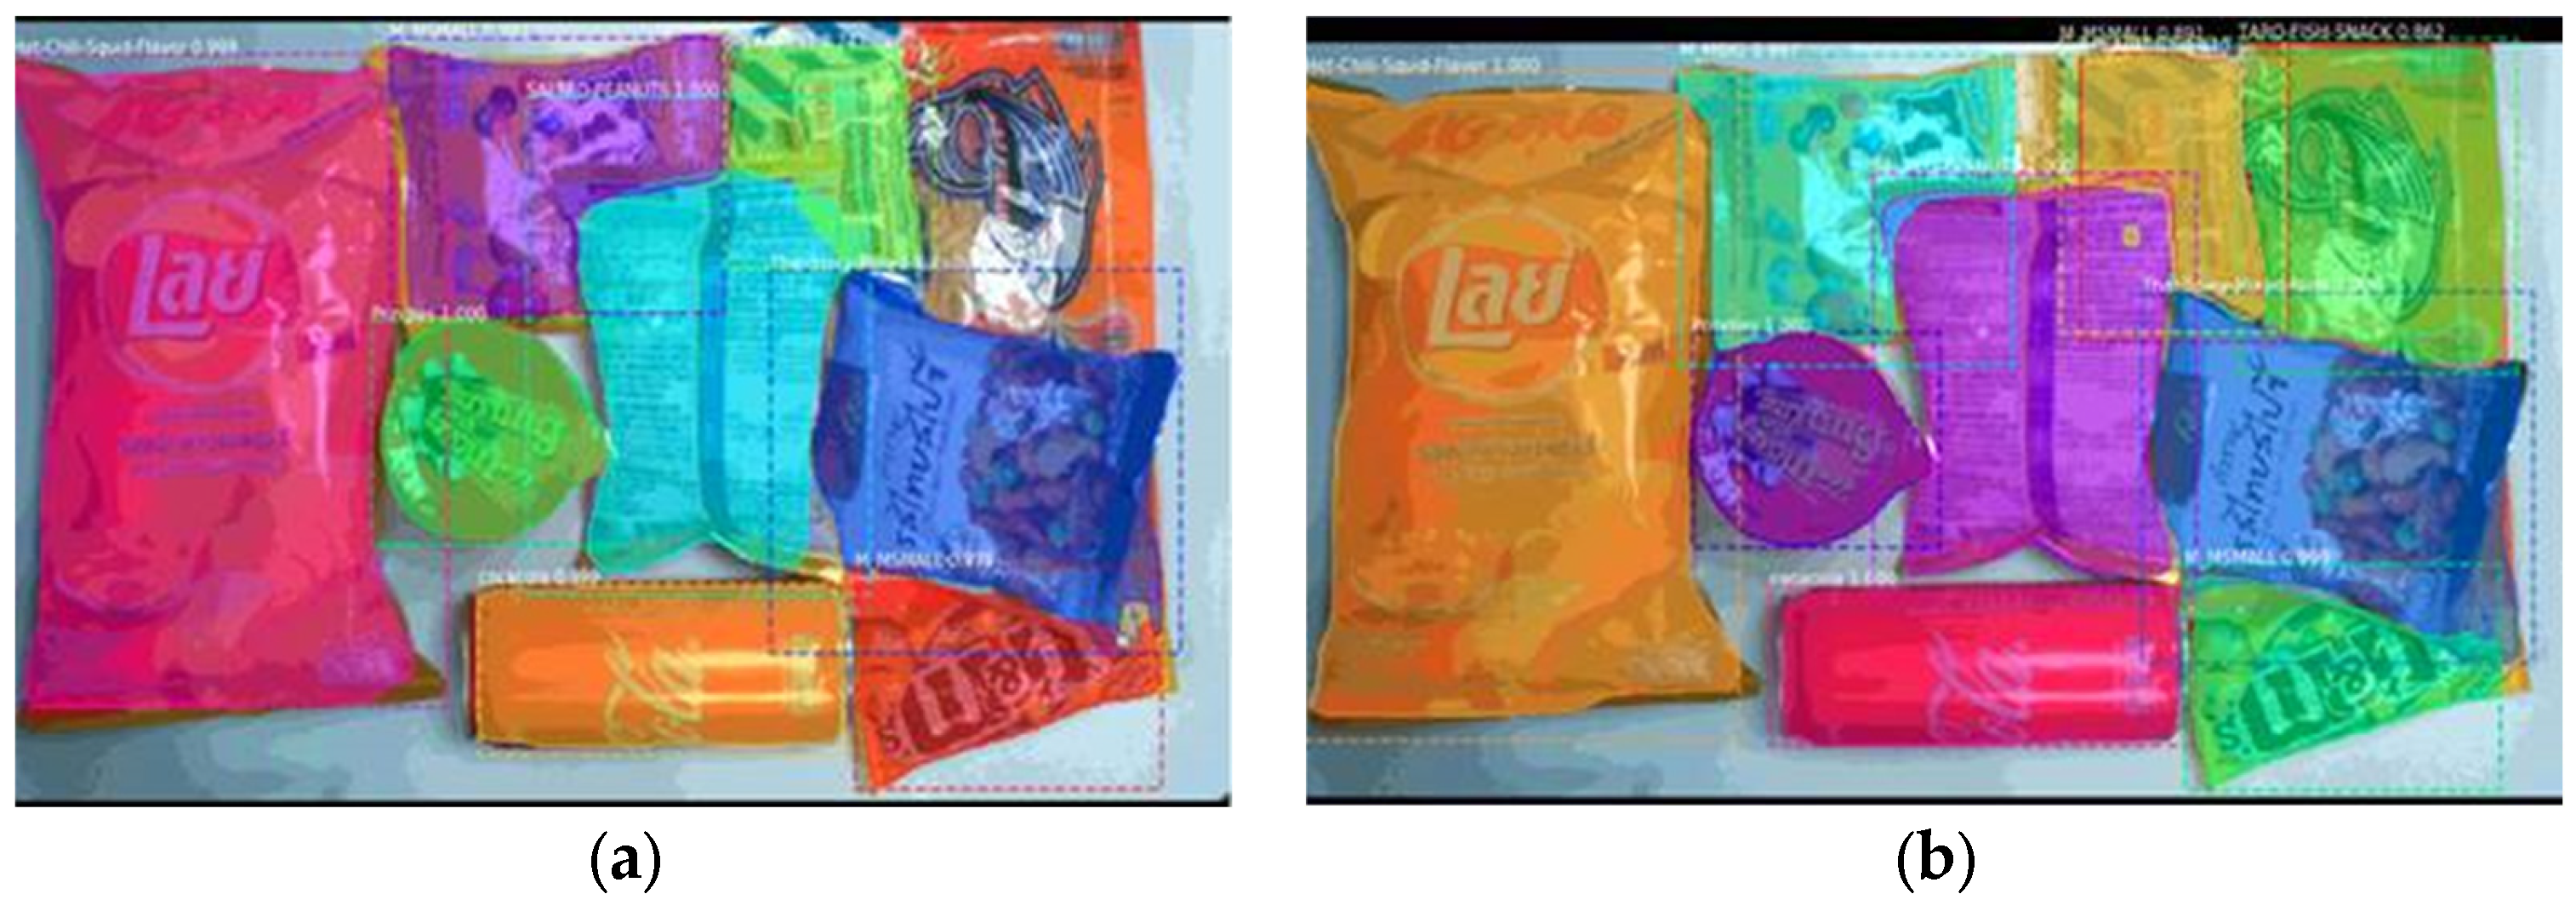
The image size was standardized to 640 × 640 before using data augmentation (DA) algorithms and filtering noise using a discrete wavelet transform (DWT), in order to retain important details of the images. To allow better feature extraction and enhance the edges using DA algorithms, the following seven following were used: sharpen, Gaussian blur, add or multiply, contrast normalization, cutout, and coarse dropout. DA algorithms significantly improve the partitioning of objects by detecting objects that are overlooked based on [2], as shown in Figure 4.
A Daubechies wavelet [15] is used instead of a Haar-based wavelet for DWT. This study uses a Daubechies wavelet that characterizes the vanishing moment at N = 4: the Daubechies 4-tap wavelet. This has a length of 8. The low-low (LL) and high-high (HH) sub-bands are used. The scaling function and the wavelet function for a Daubechies wavelet both require orthogonality and homogeneity, as defined by Equations (1) and (2):
where (a0, …, aN−1) and (b0, …, bM−1) are finite series of real numbers named an adjustment coefficient and a wavelet coefficient, respectively.
A Daubechies wavelet is classified in terms of the value of the vanishing moment (N). If N = 1, it is a Haar-based wavelet for which the scaling function and wavelet function are both discontinuous. If the value of N increases, both functions become continuous and differentiable with increasing smoothness. When the image is transformed using both wavelets and is restored to its original size by orthogonal transformation, the Daubechies wavelet is very similar to the original image, with only minor variations, as shown in Figure 5.
2.2. B. Mask R-CNN
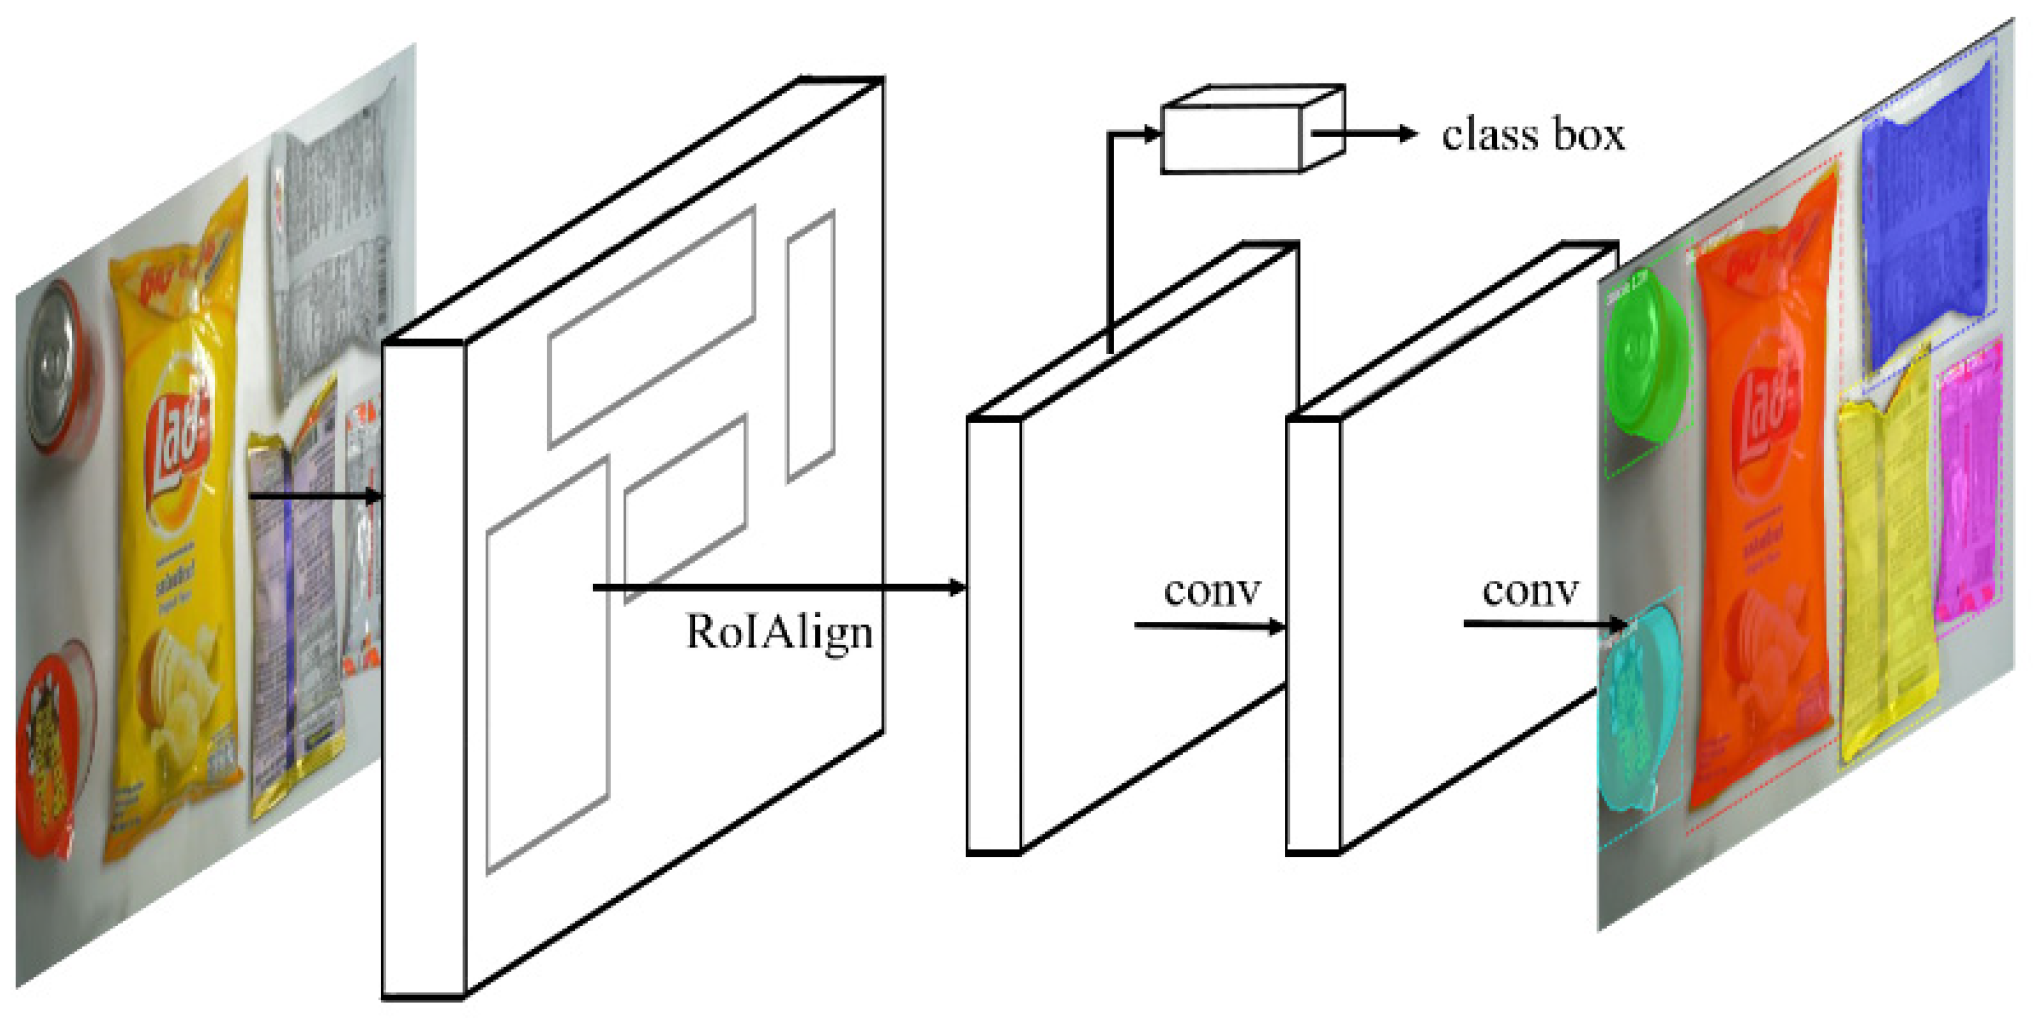
The framework for a mask R-CNN uses a faster R-CNN framework. ROI align increases the number of anchors and mask branches to achieve instance segmentation, as shown in Figure 6. Previous studies show that mask R-CNN also features a faster detection speed and greater accuracy [8].
A faster R-CNN allows better classification and regression and includes a segment and mask branch, so the loss function L is written as Equation (3):
L = Lcls + Lbox + Lmask
For Lcls, feature maps were passed through a fully connected layer and Softmax was used to determine the class to which each proposal belongs before outputting a classification probability vector. Similarly, for Lbox, feature maps were passed through a fully connected layer and Softmax was used to predict the bounding box for each proposal by bounding box regression. For Lmask, K numbers of m × m matrices are defined, and each matrix represents a class. Per-pixel sigmoid and average binary cross-entropy are used for the computation, so there is no competition between masks and instance segmentation is refined.
3. Experimental Results
3.1. A. Database
To verify these algorithms for use in smart stores, this study uses the Snacks database, as shown in Table 2, and the open-source annotation tool Lableme as a data marker, as shown in Figure 7. This dataset consists of 23 items: 13 of which are snacks and 10 of which are donuts. After DA, this dataset contains 28,068 images: 22,421 of which are used as training data, 5647 of which form the test data, and 873 of which are used as inference data. The training-data-to-test-data ratio is 8 to 2. DA involves rotation, translation, and cropping, whereby single objects are cropped and background images that contain no object are translated horizontally and vertically. This procedure is performed five times in each direction, so the image of a single object becomes 25 images after translation.
Figure 8 shows the data distribution for the dataset. The amount of each item is not evenly distributed, but the algorithms for this study use this dataset. The experimental environments are identical, so a common basis is established for different algorithms. To achieve the data format for a mask R-CNN, the data are divided into four subfolders: cv2_mask, json, pic, and labelme_json. These contain the masking for each image, the marker coordinates for each image, the primary data file for the training data and all images that comprise the masking, the name of the class, and the primary data file for the format of the dataset, respectively, as shown in Figure 9.
3.2. B. Analysis Criteria
For machine learning (ML) [2], a confusion matrix classifies the outcome of object detection as one of four possibilities: true positive (TP), false positive (FP), true negative (TN), or false negative (FN). TP defines the prediction for Class A as Class A and FP defines the prediction for Class A, but this is not Class A; TN defines the prediction for not-Class B as not-Class B and FN defines the prediction for not-Class B as Class B. Three analytical criteria are derived from these four possibilities, as defined by (4)–(6): accuracy, precision, and recall, respectively. The correlation between precision and recall denotes the validity of the prediction algorithm: a high degree of proportionality often signifies a valid prediction algorithm.
This averages the sum of the average precision, as defined by Equation (7), for each class:
where n is the number of a class and r (k) is the recall. The mAP for this study is the average of the sum of all APs, which is calculated using Equation (8):
where k denotes the number of classes and APall is the sum of all APs.
Accuracy = (TP + TN)/N
Precision = TP/(TP + FP)
Recall = TP/(TP + FN)
3.3. C. Experimental Tools
In terms of preprocessing, the image is adjusted to 640 × 640 before DA algorithms and DWT are used to filter noise. DA uses Imgaug, which is a Python library for image augmentation in ML from the Python package index (PyPI). DWT uses PyWavelets, which is a wavelet transform software for Python using PyPI.
For the mask R-CNN, a ResNet-101 is used with a FPN. The results of previous studies [5], as shown in Table 3, show that ImageNet and ResNet-152 have the smallest error rate for the nine models. The mask R-CNN for this study only supports ResNet-50 and ResNet-101, so ResNet-101 is used because it has the second lowest error rate.
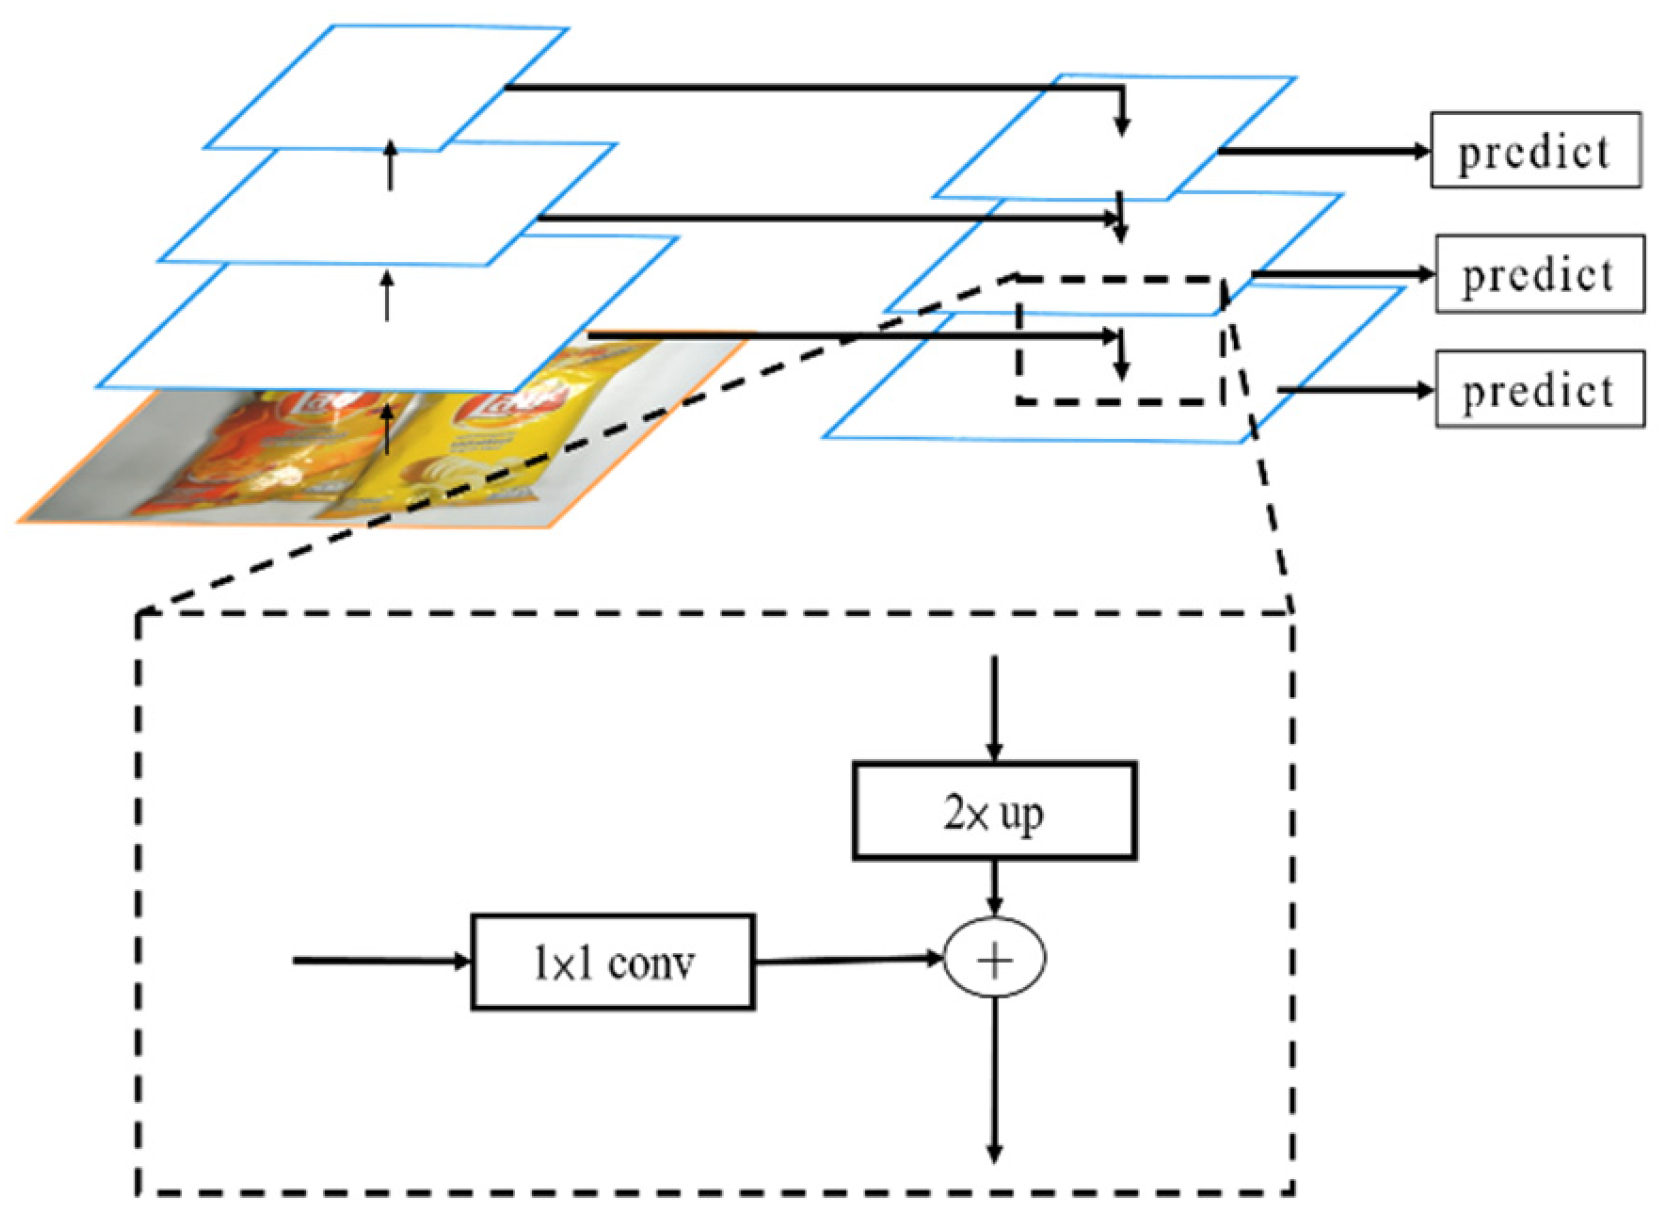
In contrast to previous image pyramids, FPN uses a bottom-up pathway and a top-down pathway. This method of feature extraction retains more detailed features, as shown in Figure 10. A previous study [9] determined the effectiveness of an FPN using a faster R-CNN as the understructure and RetNet50 as the backbone with the COCO minival dataset and showed that models with an FPN give high AP values, as shown in Table 4, so this study uses an FPN.
Computations for this study use an NVIDIA RTX2060 GPU with 6 GB VRAM. The DL frameworks are TensorFlow1.15 and Keras2.2.5. The training process in Table 5 involves three stages: stage 1 trains the RPN and mask heads for 100 epochs using a learning rate (LR) of 0.001; stage 2 trains ResNet101 and the FPN for 200 epochs; and stage 3 trains all layers for 300 epochs using a LR of 0.0001. Dividing the process into three stages allows the use of greater LR, so the loss rate rapidly converges to the bottom of the gradient. Stage 3 uses a y smaller LR so the entire loss rate converges more precisely.
3.4. D. Results and Comparison
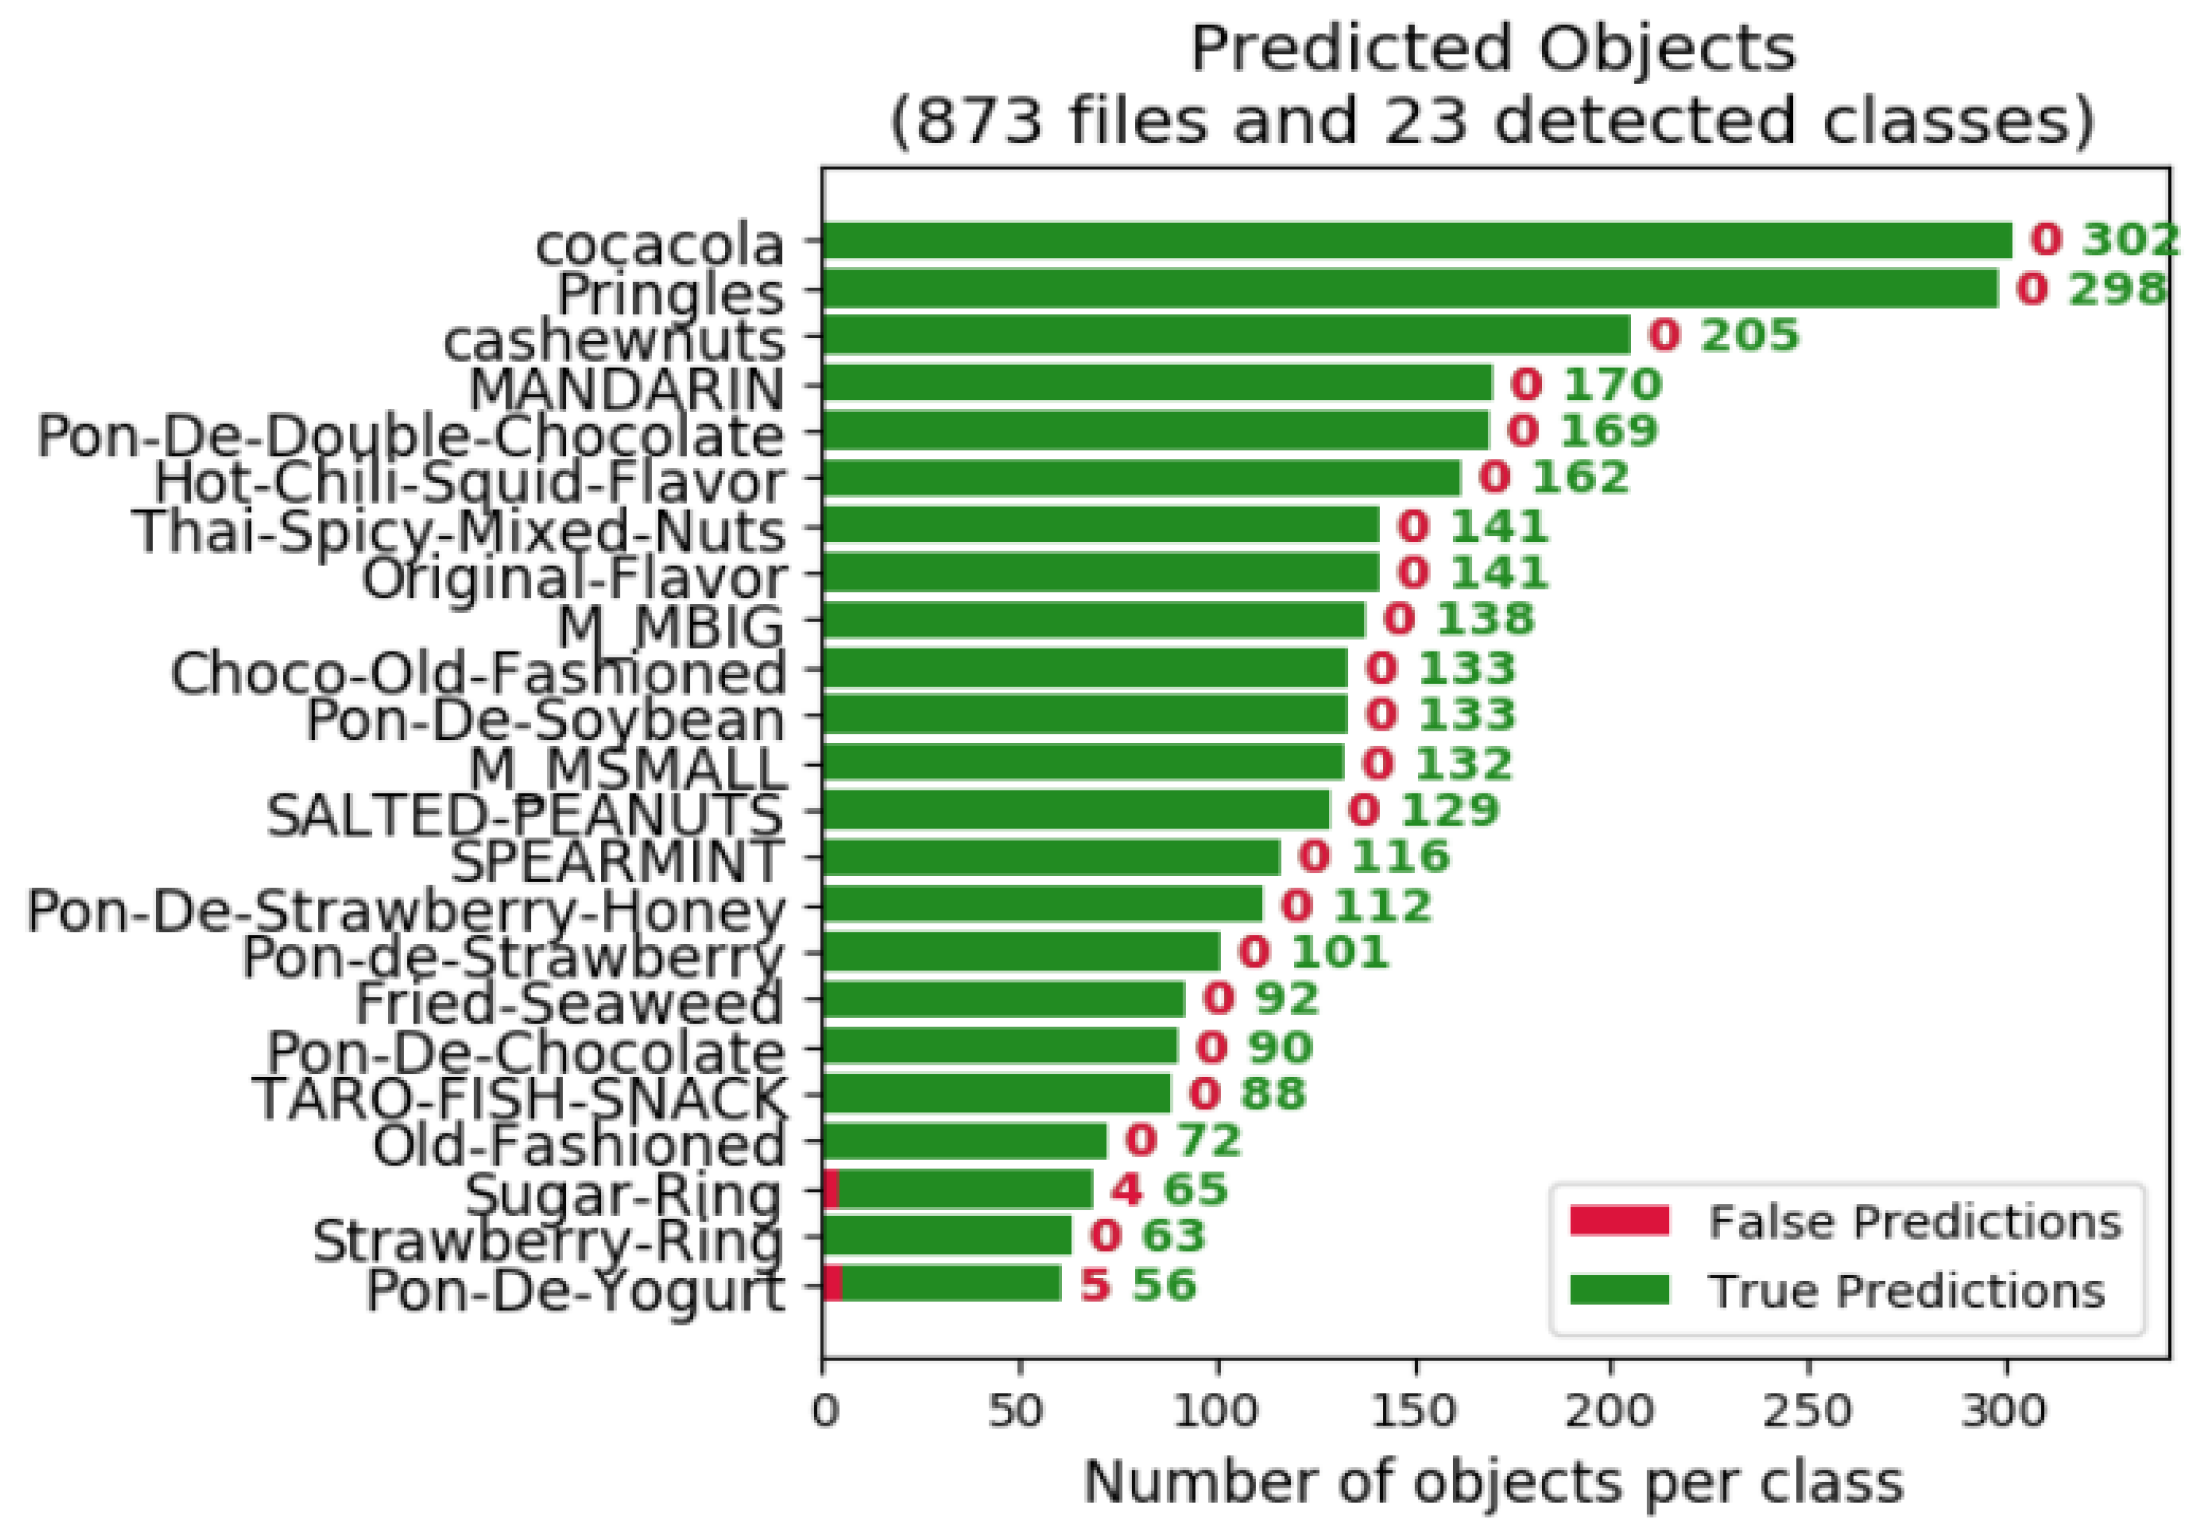
The algorithm for this study allows effective object detection using the Snacks data, as shown by the results for two relatively complex images from the dataset in Figure 11. This algorithm also allows a mAP of 99.27%, as shown in Figure 12.
The results show that the algorithm for this study is more accurate than the original one and requires less computing time, as shown in Table 6. These results are for 873 images: the mAP for the inference of each algorithm and the average computing time (ACT) for one image. DWT (LL) denotes the preservation of the LL sub-band and DWT (HH + LL) denotes the preservation of the HH and LL sub-bands in the wavelet domain [16].
The proposed method of mask R-CNN + Augmentation + DWT (LL) algorithm requires 220.072 ms on average, which is 25.6 ms slower than the time for the mask R-CNN + Augmentation + DWT (HH + LL) algorithm, because the weight functions for the model that are created during training are different. In terms of ACT, h YOLO v3 performs best, but the difference of 100 ms is not perceptible to customers at self-checkouts, so YOLO v3 is not used because it gives a lower mAP. The APs for each item for different algorithms are shown in Table 7 and Figure 12, which shows that the proposed algorithm gives a higher AP.
The results for the original algorithm are compared to those for the proposed algorithm using images that contain objects that the original algorithm fails to detect. In Table 8, the left column shows the detection result for a faster R-CNN [4] and the right column shows the detection result for the proposed algorithm: Mask R-CNN with DA and DWT. In sets 1 through 6, the red cross signifies the original algorithm’s failure to recognize objects and the red arrow signifies its X failure to detect objects. The proposed algorithm recognizes and detects all objects. The experimental results show that the proposed technique could be effectively utilized to perform smart stores; using the Snacks database, this study achieved a high detection rate. In the Snacks database, there are a total of 3108 objects, and this work can detect 3099 objects correctly, thus only 9 objects have false detections.
4. Conclusions
This study uses a mask R-CNN with a DA method instead of a faster R-CNN to prevent trivial information in an image from affecting the feature extraction and accuracy of the DL. The experimental results show that the proposed algorithms address issues due to overlapping and objects of similar colors. The proposed DA method increases accuracy and processing speed and reduces the ACT for object detection to less than 200 ms, which is 10 times faster than a previous faster R-CNN framework. The mAP is also 4% greater, at 99.27%. Moreover, the top-1 error rate of only 2 object classes in 23 falls below 90%. These results above show that the proposed algorithm is eminently suited for use in a smart retail product detection system.
Author Contributions
C.-H.H. and T.-H.W.C. carried out the studies and drafted the manuscript. C.-Y.C. participated in its design and helped to draft the manuscript. H.-T.C. conducted the experiments and performed the statistical analysis. All authors have read and agreed to the published version of the manuscript.
Funding
This work was partially supported by the Ministry of Science and Technology, Taiwan, R.O.C. under Grant No. MOST 110-2221-E-197-027.
Institutional Review Board Statement
Not applicable. This study did not involve humans or animals.
Informed Consent Statement
Not applicable. This study did not involve humans.
Data Availability Statement
This study did not report any data.
Conflicts of Interest
The authors declare no conflict of interest.
References
- Bridges, T.; Jacobs, K.; Rietra, M.; Cherian, S. Smart Stores—Rebooting the Retail Store through in-Store Automation; Capgemini Research Institute: Paris, France, 2019. [Google Scholar]
- Hsia, C.-H.; Chang, T.-H.W.; Chiang, C.-Y.; Chan, H.-T. Real-time retail product detection with new augmentation features. In Proceedings of the IEEE International Conference on Electronic Communications, Internet of Things and Big Data, Yilan County, Taiwan, 10–12 December 2021. [Google Scholar]
- Sagues-Tanco, R.; Benages-Pardo, L.; López-Nicolás, G.; Llorente, S. Fast synthetic dataset for kitchen object segmentation in deep learning. IEEE Access 2020, 8, 220496–220506. [Google Scholar] [CrossRef]
- Ren, H.; He, K.; Girshick, R.; Sun, J. Faster R-CNN: Towards real-ime object detection with region proposal networks. IEEE Trans. Pattern Anal. Mach. Intell. 2016, 39, 1137–1149. [Google Scholar] [CrossRef] [PubMed] [Green Version]
- He, K.; Zhang, X.; Ren, S.; Sun, J. Deep residual learning for image recognition. In Proceedings of the IEEE Computer Vision and Pattern Recognition, Las Vegas, NV, USA, 27–30 June 2016; pp. 770–778. [Google Scholar]
- Girshick, R.; Donahue, J.; Darrell, T.; Malik, J. Rich feature hierarchies for accurate object detection and semantic segmentation. In Proceedings of the IEEE Computer Vision and Pattern Recognition, Columbus, OH, USA, 23–28 June 2014; pp. 580–587. [Google Scholar]
- Uijlings, J.R.R.; Sande, K.E.A.; Gevers, T.; Smeulders, A.W.M. Selective search for object recognition. Int. J. Comput. Vis. 2013, 104, 154–171. [Google Scholar] [CrossRef] [Green Version]
- He, K.; Gkioxari, G.; Dollár, P.; Grishick, R. Mask R-CNN. In Proceedings of the IEEE Transactions on Pattern Analysis and Ma-chine Intelligence, Venice, Italy, 22–29 October 2017; pp. 386–397. [Google Scholar]
- Lin, T.-Y.; Dollár, P.; Girshick, R.; He, K.; Hariharan, B.; Belongie, S. Feature pyramid network for object detection. In Proceedings of the IEEE Computer Vision and Pattern Recognition, Las Vegas, NV, USA, 27–30 June 2016; pp. 936–944. [Google Scholar]
- Liu, X.; Zhao, D.; Jia, W.; Ji, W.; Ruan, C.; Sun, Y. Cucumber fruits detection in greenhouses based on instance segmentation. IEEE Access 2019, 7, 139635–139642. [Google Scholar] [CrossRef]
- Sizkouhi, A.M.M.; Aghaei, M.; Esmailifar, S.M.; Mohammadi, M.R.; Grimaccia, F. Automatic boundary extraction of large-scale photovoltaic plants using a fully convolutional network on aerial imagery. IEEE J. Photovolt. 2020, 10, 1061–1067. [Google Scholar] [CrossRef]
- Zhang, Q.; Chang, X.; Bian, S.B. Vehicle-damage-detection segmentation algorithm based on improved mask RCNN. IEEE Access 2020, 8, 6997–7004. [Google Scholar] [CrossRef]
- DeVries, T.; Taylor, G.W. Improved regularization of convolution neural networks with cutout. arXiv 2017, arXiv:1708.04552. [Google Scholar]
- Song, F.; Wu, L.; Zheng, G.; He, X.; Wu, G.; Zhong, Y. Multisize plate detection algorithm based on improved Mask RCNN. In Proceedings of the IEEE International Conference on Smart Internet of Things, Beijing, China, 14–16 August 2020; pp. 277–281. [Google Scholar]
- Hsia, C.-H.; Chiang, J.-S.; Guo, J.-M. Memory-Efficient hardware architecture of 2-D dual-Mode lifting-Based discrete wavelet transform. IEEE Trans. Circuits Syst. Video Technol. 2013, 23, 671–683. [Google Scholar] [CrossRef]
- Hsia, C.-H.; Guo, J.-M.; Chiang, J.-S. Improved low-Complexity algorithm for 2-D integer lifting-Based discrete wavelet transform using symmetric mask-based scheme. IEEE Trans. Circuits Syst. Video Technol. 2009, 19, 1201–1208. [Google Scholar]
- Liu, W.; Anguelov, D.; Erhan, D.; Szegedy, C.; Reed, S.; Fu, C.-Y.; Berg, A.C. SSD: Single shot multibox detector. In Proceedings of the European Conference on Computer Vision, Amsterdam, The Netherlands, 8–16 October 2016; pp. 21–37. [Google Scholar]
Figure 1.
Self-checkout platform.

Figure 2.
Issues for current object detection systems: (a) overlapping, (b) indistinguishable color, (c) inaccurate detection, and (d) indistinguishable color.
Figure 2.
Issues for current object detection systems: (a) overlapping, (b) indistinguishable color, (c) inaccurate detection, and (d) indistinguishable color.

Figure 3.
Flowchart for the proposed architecture. (a) Flowchart of inference model and (b) flowchart of the training and inference model.
Figure 3.
Flowchart for the proposed architecture. (a) Flowchart of inference model and (b) flowchart of the training and inference model.

Figure 4.
The utilization of DA algorithms: (a) results without the Das and (b) with the DAs.

Figure 5.
Images transformed using Haar and Daubechies wavelets: (a) using a Haar-based wavelet and (b) using a Daubechies wavelet.
Figure 5.
Images transformed using Haar and Daubechies wavelets: (a) using a Haar-based wavelet and (b) using a Daubechies wavelet.

Figure 6.
Framework for the mask R-CNN [6].
Figure 6.
Framework for the mask R-CNN [6].

Figure 7.
Marking objects with Labelme.

Figure 8.
Data distribution for the Snacks dataset.

Figure 9.
Format for the Snacks dataset.

Figure 10.
Framework for the FPN [9].
Figure 10.
Framework for the FPN [9].

Figure 11.
Experimental results: (a) snacks and (b) donuts.

Figure 12.
The top-1 error rate of only 2 object classes in 23 falls below 90%.


Table 1.
Comparison of ROI pooling and ROI align [8].
Table 1.
Comparison of ROI pooling and ROI align [8].
| Item | APkp | APkp50 | APkp75 | APkpM | APkpL |
|---|---|---|---|---|---|
| ROI pool | 59.8 | 86.2 | 66.7 | 55.1 | 67.4 |
| ROI align | 64.2 | 86.6 | 69.7 | 58.7 | 73.0 |
| +4.4 | +0.4 | +3.0 | +3.6 | +5.6 |
Table 2.
Items in the Snacks database.
 |  |  |  |
| CocaCola | Cashewnuts | M & M large | M & M small |
 |  |  |  |
| Hot chili squid flavor | Original flavor | Thai spicy mixed nuts | Pringles |
 |  |  |  |
| Taro fish snack | Salted peanuts | Mandarin | Spearmint |
 |  |  |  |
| Fried seaweed | Pon de strawberry honey | Pon de strawberry | Pon de double chocolate |
 |  |  |  |
| Pon de chocolate | Pon de soybean | Pon de yogurt | Chocolate old fashioned |
 |  |  | |
| Old fashioned | Strawberry ring | Sugar ring |
Table 3.
Comparison of error rates for nine models.
| Models | Top-1 Err. | Top-5 Err. |
|---|---|---|
| VGG-16 | 28.07 | 9.33 |
| GoogLeNet | - | 9.15 |
| PReLU-net | 24.27 | 7.38 |
| ResNet-34A | 25.03 | 7.76 |
| ResNet-34B | 24.52 | 7.46 |
| ResNet-34C | 24.19 | 7.40 |
| ResNet-50 | 22.85 | 6.71 |
| ResNet-101 | 21.75 | 6.05 |
| ResNet-152 | 21.43 | 5.71 |
Table 4.
Differences using the FPN.
| Faster R-CNN | AP | APs | APm | APt |
|---|---|---|---|---|
| Baseline on conv4 | 31.9 | 13.9 | 36.5 | 45.5 |
| Baseline on conv5 | 28.8 | 11.9 | 32.4 | 43.4 |
| FPN | 33.9 | 17.8 | 37.7 | 45.8 |
Table 5.
Detail of the training process.
| Stage | 5Layer | Epochs | LR |
|---|---|---|---|
| 1 | RPN, mask heads | 100 | 0.001 |
| 2 | ResNet stage 4 and up | 200 | 0.001 |
| 3 | All | 300 | 0.0001 |
Table 6.
Comparison of ACT and mAP for each algorithm.
| Architectures | ACT (ms) | mAP (%) |
|---|---|---|
| SSD [17] | 581 | 83.91 |
| YOLO v3 | <100 | 92.89 |
| Faster R-CNN [4] | 1900 | 95.71 |
| Mask R-CNN [8] | 194.099 | 97.09 |
| Mask R-CNN + Aug. | 192.285 | 98.26 |
| Mask R-CNN + Aug.+ DWT (LL) | 220.072 | 98.95 |
| Mask R-CNN + Aug.+ DWT (HH + LL) | 194.470 | 99.27 |
Aug. denotes the DA.
Table 7.
Comparison of APs using different algorithms for each item.
| Items | YOLO v3 | Faster R-CNN [4] | Mask R-CNN [8] | Mask R-CNN + Aug. | Mask R-CNN + Aug. + DWT (LL) | Mask R-CNN + Aug. + DWT (LL + HH) |
|---|---|---|---|---|---|---|
| CocoCola | 0.99 | 0.98 | 0.99 | 0.99 | 0.99 | 0.99 |
| Cashewnuts | 1.00 | 1.00 | 1.00 | 1.00 | 1.00 | 1.00 |
| M&M large | 0.94 | 1.00 | 1.00 | 1.00 | 1.00 | 1.00 |
| M&M small | 0.97 | 0.99 | 0.98 | 0.99 | 0.99 | 0.99 |
| Hot chili squid flavor | 0.97 | 0.96 | 1.00 | 1.00 | 1.00 | 1.00 |
| Original flavor | 1.00 | 1.00 | 1.00 | 1.00 | 1.00 | 1.00 |
| Thai spicy mixed nuts | 0.94 | 0.99 | 0.99 | 1.00 | 1.00 | 1.00 |
| Pringles | 1.00 | 1.00 | 1.00 | 0.99 | 0.99 | 1.00 |
| Taro fish snack | 0.82 | 0.89 | 0.94 | 0.91 | 0.95 | 0.95 |
| Salted peanuts | 0.94 | 1.00 | 1.00 | 1.00 | 1.00 | 1.00 |
| Mandarin | 1.00 | 1.00 | 1.00 | 0.99 | 0.99 | 1.00 |
| Spearmint | 0.93 | 0.88 | 0.94 | 0.97 | 0.96 | 0.98 |
| Fried seaweed | 1.00 | 0.98 | 1.00 | 1.00 | 1.00 | 1.00 |
| Pon de strawberry honey | 0.96 | 1.00 | 1.00 | 0.96 | 1.00 | 1.00 |
| Pon de strawberry | 0.96 | 0.95 | 0.95 | 1.00 | 1.00 | 1.00 |
| Pon de double chocolate | 0.90 | 0.91 | 1.00 | 1.00 | 1.00 | 1.00 |
| Pon de chocolate | 0.80 | 0.98 | 1.00 | 1.00 | 1.00 | 1.00 |
| Pon de soybean | 0.77 | 1.00 | 1.00 | 1.00 | 1.00 | 1.00 |
| Pon de yogurt | 1.00 | 1.00 | 1.00 | 1.00 | 1.00 | 1.00 |
| Chocolate old fashioned | 0.80 | 0.74 | 0.85 | 0.92 | 0.96 | 1.00 |
| Old fashioned | 0.81 | 0.92 | 1.00 | 1.00 | 1.00 | 1.00 |
| Strawberry ring | 1.00 | 0.92 | 0.84 | 1.00 | 1.00 | 1.00 |
| Sugar ring | 0.87 | 0.93 | 0.86 | 0.86 | 0.92 | 0.92 |
| ACT (ms) | <100 | 1900 | 194.10 | 192.29 | 220.07 | 194.47 |
| mAP (%) | 92.89 | 95.71 | 97.09 | 98.26 | 98.95 | 99.27 |
Table 8.
Comparison of results.
| Faster R-CNN | Set | This Work |
|---|---|---|
 | 1 |  |
 | 2 |  |
 | 3 |  |
 | 4 |  |
 | 5 |  |
 | 6 |  |
Publisher’s Note: MDPI stays neutral with regard to jurisdictional claims in published maps and institutional affiliations. |
© 2022 by the authors. Licensee MDPI, Basel, Switzerland. This article is an open access article distributed under the terms and conditions of the Creative Commons Attribution (CC BY) license (https://creativecommons.org/licenses/by/4.0/).
Share and Cite
MDPI and ACS Style
Hsia, C.-H.; Chang, T.-H.W.; Chiang, C.-Y.; Chan, H.-T. Mask R-CNN with New Data Augmentation Features for Smart Detection of Retail Products. Appl. Sci. 2022, 12, 2902. https://doi.org/10.3390/app12062902
AMA Style
Hsia C-H, Chang T-HW, Chiang C-Y, Chan H-T. Mask R-CNN with New Data Augmentation Features for Smart Detection of Retail Products. Applied Sciences. 2022; 12(6):2902. https://doi.org/10.3390/app12062902
Chicago/Turabian StyleHsia, Chih-Hsien, Tsung-Hsien William Chang, Chun-Yen Chiang, and Hung-Tse Chan. 2022. "Mask R-CNN with New Data Augmentation Features for Smart Detection of Retail Products" Applied Sciences 12, no. 6: 2902. https://doi.org/10.3390/app12062902
Note that from the first issue of 2016, this journal uses article numbers instead of page numbers. See further details here.