
Phase Reversal Method for Damage Imaging in Composite Laminates Based on Data Fusion


Faculty of Civil Engineering and Mechanics, Jiangsu University, Zhenjiang 212013, China
*
Author to whom correspondence should be addressed.
Appl. Sci. 2022, 12(6), 2894; https://doi.org/10.3390/app12062894
Submission received: 19 January 2022
/
Revised: 9 March 2022
/
Accepted: 10 March 2022
/
Published: 11 March 2022
(This article belongs to the Collection Nondestructive Testing (NDT))
Abstract
:This paper proposes a phase-reversal method (PRM) for damage imaging in plate structures. The PRM is a novel Lamb-wave-based method that mainly focuses on phase spectrum information of scattering waves reflected from a defect. The PRM reverses the phase angle along the propagation path by using the inverse Fourier transform first, and then the reversal reconstruction of the wave field in the frequency domain is performed for damage imaging. The proposed method analyzes the scattered wave field without using the baseline data and structural parameters. Moreover, dispersion characteristics and anisotropy are not involved in the process of damage positioning, thus making the PRM suitable for damage monitoring of composite laminates. To improve the PRM accuracy further, a combined addition and multiplication method of the correlation coefficient (CAMM) is proposed, which can reduce the effects of phase and noise artifacts and distortion. The results of the finite element simulations and experiments show that the combination of the PRM and CAMM methods can accurately locate damage in composite structures. Therefore, the PRM and CAMM methods have great application potential in damage imaging in composite laminates.
1. Introduction
Composite materials have been widely used in the fields of aerospace, defense industry, and civil industry because of their excellent properties, such as low density and high specific strength and modulus. However, due to the complex manufacturing technology of composite materials and harsh service environment, damage is inevitable. This damage can reduce the strength of a structure and endanger its safety. Although most composite structures are designed according to the damage-tolerance criteria [1], it is still important to detect and evaluate damage before it occurs and spreads out.
Structural health monitoring (SHM) technology has attracted great attention in the field of damage assessment of composite materials [2]. Many damage-detection methods have been proposed and improved in recent years [3,4,5]. Among them, the damage-detection method based on the ultrasonic Lamb wave has been particularly efficient for large plate structures [6,7,8]. Xu et al. [9] developed a theoretical model for the analysis of PWAS-related Lamb-wave time reversal. The theoretical model is first used to predict the existence of single-mode Lamb waves. Both numerical and experimental results show that the use of PWAS-tuned single-mode Lamb waves can greatly improve the effectiveness of the time-reversal damage-detection procedure. Ryan et al. [10] proposed a modified time-reversal method (MTRM) which requires only one transducer to actuate signals, while the other transducer acts as a sensor for any signal path. The development of MTRM paves the way for implementing time reversal of signals by using a single actuator and multiple sensors, including non-contact sensors, such as a laser vibrometer. Kapuria et al. [11] combined the refined time-reversal method (RTRM) and the reconstruction algorithm for probabilistic inspection of defects (RAPID) to predict the damage location on an aluminum plate. The Lamb-wave time-reversal method is an effective baseline-free damage-detection technique for structural health monitoring. However, the parameters of the composite laminates, including dispersion characteristics and anisotropy, reduce the accuracy of the PRM in locating damage to composite laminates.
Lamb waves have dispersion and multimode characteristics [12,13,14,15], and composite laminates have features of anisotropy and heterogeneity, which makes the signal analysis using the damage-detection methods based on Lamb waves challenging. Therefore, to improve the accuracy of damage detection, dispersion removal [16,17,18] and direction-dependent damage-detection methods [19,20] have been proposed. These methods generally require users to obtain prior information on the structural parameters of composite materials, and this information is often difficult to obtain in practical applications.
In damage imaging, phase and noise artifacts, as well as distortion, may occur due to changes in external environmental parameters, such as temperature and uneven material surface, the dependence of the wave velocity and wavelength on the frequency, and different interactions between defects and material geometrical structure. Liu et al. [21] proposed an image-data-fusion method suitable for elliptic positioning where the amplitude was used as a damage index. The accuracy of the damage location was improved by using the combined amplitude addition and multiplication method.
This paper presents a new damage-detection method, the phase-reversal method (PRM), for composite laminates. The proposed method uses a linear sensor array to receive a Lamb-wave signal and analyzes damage according to the scattering signal phase change. Then it applies the inverse Fourier transform to the damage scattering wave and uses its similarity as a damage index to obtain the damage location. Finally, it calculates the correlation coefficient and uses the data-fusion method to improve the damage-imaging accuracy. In this study, the commercial software COMSOL(Version 5.3) was used to perform numerical simulation and verify the experimental research. In the proposed method, localization of damage in composite laminated structures was realized without using the information on material parameters, dispersion relation, and anisotropy. The results show that the proposed method has great application potential in damage imaging and structural health monitoring of composite laminates.
2. Materials and Methods
2.1. Phase-Reversal Method
Due to the dispersion and multimodal characteristics of guided waves and anisotropy of composite materials, the propagation of Lamb waves in composite materials is very complex, which restricts the application of damage-detection methods based on Lamb waves in composite materials and limits their accuracy of damage imaging. To overcome these limitations, this paper proposes a phase-reversal imaging method. Compared to the existing damage-detection methods, the proposed method can realize the damage detection of composite materials without prior information on material parameters, dispersion relationship, and influence of anisotropic characteristics of composite materials.
The schematic diagram of the phase-reversal method process is presented in Figure 1. In the process of damage imaging based on an ultrasonic guided wave, the guided wave propagates through the structure and interacts with the damage, where the damage can be regarded as a secondary wave source. Therefore, damage localization can be realized by analyzing the scattering wave from the defect. As shown in Figure 1, in phase-reversal imaging theory, sensor arrays with narrow spacing are used for detecting the scattering waves. For each pair of the sensors, the wave velocity of the damage-scattering wave propagating from the damage source to each receiving array element is considered the same within the margin of error, so the anisotropy of composite materials does not affect the phase-reversal method. By using the Fourier transform, the phase spectrum of the damage scattering signal at a pair of sensors can be obtained as follows:
where are the wave signals detected by two sensors; are the positions of the sensors; and and denote the imaginary and real parts of a complex value after the Fourier transform, respectively. After the Fourier transform, the harmonic component corresponding to the damaged scattered wave is given by the following:
where is the amplitude corresponding to the angular frequency, ; represents the direction vector from the damage point to sensors; and is the wave number of along the direction of the scattering wave propagation path. The relationship between the phase difference corresponding to each frequency of the damage scattering signal and the difference in propagation path distance, , is given by the following:
where is the norm of the wave number, as shown in Figure 1; is the difference in the propagation distance of the damage scattering wave from the source to a pair of sensors, and its value is calculated by ; and the phase difference is calculated by .
By reversing the phase corresponding to each frequency along the reverse path from the sensors to the damage scattering source, the phase spectrum, , of the damage scattering signal at the source can be obtained by the following:
where denotes the mean value of the phase angle, and its value is calculated by ; and is the average propagation distance, and its value is obtained by . It is important to note that this phase-reversal process can only be achieved when the distance between the sensors is small enough. In that case, the wave propagation along each path can be considered to be the same within the margin of error; otherwise, the anisotropy of the wave’s velocity difference will influence the accuracy of the damage imaging.
Assuming that the amplitude of the guided wave is constant during the propagation process, we can construct a Fourier signals, , using the phase spectrum, , derived by PRM.
Then the inverse Fourier transform can be used to reconstruct the initial damage scattering signal at the scattering source.
Three adjacent sensors constitute a group. Theoretically, at the damage scattering source, the initial damage-scattering signals reconstructed by each group of sensors should have similar waveforms. Therefore, the damage imaging index, , is defined as a similarity index of the signals, and it is calculated by the following:
where represents the signal correlation coefficient of the reconstructed damage scattering signal at position ; represents the sequence number of a group of sensors, and the maximum value of is the number of linear sensors in the same direction, i.e., . The signal correlation coefficient is defined by the following:
where is defined as the cross-correlation coefficient at location between the and ; and and are the reconstructed scattering signal at point .
2.2. Data Fusion
Image data fusion [22] refers to the synthesis of multiple images by using mathematical methods so as to obtain improved images. In this study, a combined addition and multiplication method of the correlation coefficient (CAMM) based on data fusion is proposed. In the theory of phase-reversal imaging, according to Equation (4), the imaging geometry characteristic denotes a hyperbola passing through damage, whose semi-real axis value is . By fusing imaging hyperbolas obtained from several groups of measurement points, the damage location is determined as an intersection point of the hyperbola curves. At the same time, due to the change in external environmental parameters, such as temperature and uneven material surface, the dependence of the wave velocity and wavelength on the frequency, and interaction between defects and material geometry structure, phase and noise artifacts and distortion will appear in damage imaging results. Therefore, according to the geometric characteristics of phase-reversal imaging, the combined addition and multiplication method of the correlation coefficient is proposed. This method can effectively eliminate artifacts and improve the accuracy of damage imaging by adding and multiplying the imaging results.
According to the theory of phase-reversal imaging, the plate-like structure of a composite material can be divided into discrete element points. In general, the distance between adjacent discrete element points should be less than the damage size to meet the requirements for positioning accuracy. In this study, it is assumed that the damage is located at discrete element points, and all the unit points are regarded as possible locations of damage. The signal of each discrete element point is reconstructed by the phase-reversal method, and the correlation coefficient of the signal is calculated. The signal correlation coefficient of the unit point is a pixel point of the damage-imaging matrix. If the unit point represents damage, the signal similarity will be high, and the damage imaging results will be displayed as a hot spot with a high pixel value.
According to Equation (7), the imaging matrices of each group on the x-axis and y-axis can be obtained by the following:
As mentioned before, three adjacent sensors in the same direction are regarded as a group. In Equation (9), represent the sequence number of groups in the same direction, and its maximum value is the number of sensors in the same direction, i.e., .
The imaging matrices along the x-axis and y-axis are fused by the combined addition and multiplication method of the correlation coefficient (CAMM) to obtain the final imaging result, as follows:
By using the combined correlation coefficient addition and multiplication data fusion–based method, the effects of phase, artifacts, and distortion can be effectively reduced so that the pixel value in the final imaging result is focused on the damage scattering source. Thus, the damage imaging accuracy of the phase-reversal method is improved.
3. Results
3.1. Numerical Analysis Results
In the numerical analysis, an orthogonal anisotropic composite plate was used as a research object. The structural model is shown in Figure 2; the plate size was 200 mm × 200 mm × 1 mm. The excitation source was located in the center of the plate, and the sensors were set up as four orthogonal linear arrays. The through hole with a diameter of 10 mm was used as damage, and its positional coordinates were (50 mm, 70 mm). To improve the calculation efficiency, since the damage type was through-hole damage, the composite material was assumed to be a whole structure. The composite material plate adopted the integral-modeling method, and the specific parameters are given in Table 1.
The commercial finite element software COMSOL was used to calculate the damage scattering model of composite plates. The grid was structured; the unit type was a uniform hexahedral grid with a size of 1 mm; the excitation source was a circular equipotent line model with a diameter of 7 mm; and a linear array measuring point denoted the sensors on the composite plate’s surface. Due to the high sensitivity of the mode guided wave to damage and the low complexity of signal analysis, this study used the anti-symmetric mode guided wave excited in the center of the plate to realize phase-reversal damage imaging. The excitation signal was a five-peak wave modulated by the Hanning window, and its expression was as follows:
where is the amplitude of excitation signal, is the center frequency which was chosen 100 kHz, is the time duration, and is the wave period which was chosen 5 in this study. The time domain and frequency domain of the excitation signal are shown in Figure 3.
The wave field diagram of the orthotropic composite material plate obtained by the finite element calculation is displayed in Figure 4. As the orthotropic characteristics of the composite material led to the directional dependence of the guided wave’s propagation velocity, the wave front has an approximately diamond shape.
Four orthogonal linear sensors located on the coordinate axis were used to receive the damage scattering signals. The position and number of sensors are shown in Table 2. According to the theory of PRM, the spacing of sensors should meet the error requirements, and in this study, the sensors’ spacing was set to 1 mm. Off-plane displacement signals of each measuring point were extracted, and signals of four typical measuring points are shown in Figure 5, where direct wave signals and damage-scattered wave signals can be clearly identified.
The arrival-time comparison of the damage scattering signals received by the sensors at the symmetrical positions at four linear measurement points is shown in Figure 5. The damage scattering signals first arrived at the positive direction of the x-axis and y-axis, so it could be concluded that the damage was located in the first quadrant of the coordinate system with the center of the plate as an origin.
Since the damage was located in the first quadrant, the signals of forward points on the x-axis and y-axis were selected for phase reversal damage detection. The phase corresponding to the frequencies in the frequency band near the center frequency of the damage scattering signal on the x-axis is shown in Figure 6. The phase was obtained by the Fourier transform, and the frequency interval was 5 kHz. As shown in Figure 6, the phase difference between the scattered signals obtained by different sensors was different.
According to the PRM, the scattered damage signals can be reconstructed, and the similarity of the reconstructed signals can be used as a damage-imaging index. As shown in Figure 7, the imaging matrices of measurement points on the x-axis and y-axis can be obtained respectively by Equations (7) and (8).
The imaging results in Figure 7 show the geometric characteristics of the phase-reversal method. Specifically, the imaging result obtained by the linear receiving arrays in the same direction formed a hyperbola, which passed through the damage. By applying the proposed data-fusion method, the imaging matrices were obtained by Equation (9), and they were overlapping, but the corresponding curves met at the damage position. According to Equation (9), the imaging matrices shown in Figure 7 were superimposed and fused, and the imaging curves obtained from measuring points in different directions will intersect at the damage area. At this time, multiplying the superimposed imaging matrices can eliminate the phase artifacts, noise artifacts, and distortion caused by the change of the external environment and the dependence of wave velocity and wavelength on frequency.
As shown in Figure 8, the imaging results were obtained by the combined addition and multiplication method of the correlation coefficient based on data fusion. The actual damage location coordinates were (50 mm, 70 mm), and the damage location coordinates by PRM and CAMM were (51 mm, 70 mm).
3.2. Experimental Results
To verify the numerical-simulation results, an experimental platform for damage detection of composite materials based on the phase-reversal method was constructed, as shown in Figure 9. The experimental platform included the orthogonal anisotropic carbon fiber composite laminated plate, which was used as a research object; the signal generator, which was used to generate the signal with a center frequency of 100 kHz; the signal amplifier, which was employed to improve the signal energy; and the Doppler laser vibrometer, which was used to measure the vibration signal of structure.
The size of the experimental plate was 800 mm × 800 mm, and its thickness was 1 mm. The information on material parameters was unknown, which confirmed the advantage of the proposed method, i.e., that it does not require prior information on material parameters. The damage forms of a composite plate structure usually include cracks, fiber fracture, debonding, and delamination. To facilitate the extraction of scattered signals and reduce the difficulty of subsequent signal processing, the damage was replaced by a circular magnet with a diameter of 10 mm, whose positional coordinates were 50 mm and 70 mm, and which was pasted on the front and back of the plate. The measurement points were two linear arrays on the x-axis and y-axis; the quantities and positions are given in Table 3.
The signal containing the damage scattered wave measured by the Doppler laser vibrometer is shown in Figure 10, where the red circle indicates the scattered damage signal.
According to the theory of the PRM, the correlation coefficient of the reconstructed damage scattering signal is taken as the imaging index. The accuracy of imaging matrices by PRM is improved through the combined addition and multiplication method of the correlation coefficient (CAMM). As displayed in Figure 11, the actual damage coordinates were 50 mm and 70 mm, and the damage location coordinates obtained by the PRM were 51 mm and 73 mm.
The experimental results showed that the phase-reversal method could successfully realize damage imaging under the condition of unknown material parameters of the composite plate, and the damage-imaging process did not involve the dispersion relationship and was not affected by the anisotropy. Thus, the phase-reversal method is suitable for damage detection in composite materials.
4. Conclusions
The results of the numerical simulation and experimental verification demonstrate that the proposed phase-reversal method can realize damage detection in composite materials without prior information on material parameters, dispersion relationship, and influence of anisotropic characteristics of composite materials. At the same time, the combined addition and multiplication method of the correlation coefficient, which is based on the proposed damage-imaging method, can effectively eliminate the effects of phase and noise artifacts and distortion on the damage-positioning result and improve the damage-imaging accuracy of the phase-reversal method. The damage-positioning accuracy error obtained in the numerical simulation and experiment is less than 3 mm. Therefore, the proposed phase-reversal method can be applied to damage detection in composite materials, and this use has a certain guiding significance for practical engineering applications.
Author Contributions
Methodology, K.F.; numerical analysis, W.H.; experiment, W.H. and H.Y.; writing—original draft preparation, W.H.; writing—review and editing, K.F., W.H. and H.Y.; supervision, K.F.; funding acquisition, K.F. All authors have read and agreed to the published version of the manuscript.
Funding
The project was supported by the National Natural Science Foundation of China (Grant nos. 11520101001 and 11702118), the Natural Science Foundation of Jiangsu Province (Grant no. BK20170520), and the Basic Research Program of Jiangsu Education Department (Grant no. 17KJB130005).
Institutional Review Board Statement
Not applicable.
Informed Consent Statement
Not applicable.
Data Availability Statement
Data are contained within the article.
Acknowledgments
We acknowledge the National Natural Science Foundation of China and the Natural Science Foundation of Jiangsu Province for their support.
Conflicts of Interest
The authors declare no conflict of interest.
References
- Dávila, C.G.; Bisagni, C. Fatigue life and damage tolerance of postbuckled composite stiffened structures with initial delamination. Compos. Struct. 2017, 161, 73–84. [Google Scholar] [CrossRef]
- Farrar, C.R.; Worden, K. An introduction to structural health monitoring. Philos. Trans. Math. Phys. Eng. Sci. 2007, 365, 303–315. [Google Scholar] [CrossRef]
- Tian, Z.; Yu, L.; Leckey, C. Delamination detection and quantification on laminated composite structures with lamb waves and wavenumber analysis. J. Intell. Mater. Syst. Struct. 2015, 26, 1723–1738. [Google Scholar] [CrossRef]
- Feng, K.; Li, Z. Damage Imaging in Composite Laminates Using. AIP Conf. Proc. 2019, 2102, 15–19. [Google Scholar]
- Loutas, T.H.; Charlaftis, P.; Airoldi, A.; Bettini, P.; Koimtzoglou, C.; Kostopoulos, V. Reliability of strain monitoring of composite structures via the use of optical fiber ribbon tapes for structural health monitoring purposes. Compos. Struct. 2015, 134, 762–771. [Google Scholar] [CrossRef]
- Cho, Y. Estimation of ultrasonic guided wave mode conversion in a plate with thickness variation. IEEE Trans. Ultrason. Ferroelectr. Freq. CControl 2000, 47, 591–603. [Google Scholar]
- Schaal, C.; Mal, A. Lamb wave propagation in a plate with step discontinuities. Wave Motion 2016, 66, 177–189. [Google Scholar] [CrossRef]
- Raghavan, C.; Cesnik, C.E.S. Review of guided-wave structural health monitoring. Shock. Vib. Digest. 2007, 39, 91–114. [Google Scholar] [CrossRef]
- Takiuti, B. Wave Scattering From Discontinuities Related to Corrosion-Like Damage in One-Dimensional Waveguides. J. Soc. Mech. Sci. Eng. 2020, 42, 521. [Google Scholar] [CrossRef]
- Xu, B.; Giurgiutiu, V. Single mode tuning effects on Lamb wave time reversal with piezoelectric wafer active sensors for structural health monitoring. J. Nondestruct. Eval. 2007, 26, 123–134. [Google Scholar] [CrossRef] [Green Version]
- Watkins, R.; Jha, R. A modified time reversal method for Lamb wave based diagnostics of composite structures. Mech. Syst. Signal Processing 2012, 31, 345–354. [Google Scholar] [CrossRef]
- Kannusamy, M.; Kapuria, S.; Sasmal, S. Accurate baseline-free damage localization in plates using refined Lamb wave time-reversal method. Smart Mater. Struct. 2020, R1, 109608. [Google Scholar] [CrossRef]
- Hua, J.; Gao, F.; Zeng, L.; Lin, J. Modified sparse reconstruction imaging of lamb waves for damage quantittative evaluation. NDT E Int. 2019, 107, 102143. [Google Scholar] [CrossRef]
- Qiu, L.; Liu, B.; Yuan, S.; Su, Z.; Ren, Y. A scanning spatial-wavenumber filter and pzt 2-d cruciform array based on-line damage imaging method of composite structure. Sens. Actuators A Phys. 2016, 248, 62–72. [Google Scholar] [CrossRef]
- Cawley, P.; Alleyne, D. The use of lamb waves for the long range inspection of large structures. Ultrasonics 1996, 34, 287–290. [Google Scholar] [CrossRef]
- Ruzzene, M. Frequency-wavenumber domain filtering for improved damage visualization. Smart Mater. Struct. 2007, 16, 1556–1563. [Google Scholar] [CrossRef] [Green Version]
- Liu, L.; Yuan, F.G. A linear mapping technique for dispersion removal of lamb waves. Struct. Health Monit. 2010, 9, 75–86. [Google Scholar] [CrossRef]
- Luo, Z.; Zeng, L.; Lin, J.; Hua, J. A reshaped excitation regenerating and mapping method for waveform correction in lamb waves dispersion compensation. Smart Mater. Struct. 2016, 26, 025016. [Google Scholar] [CrossRef] [Green Version]
- Xu, B.; Yu, L.; Giurgiutiu, V. Lamb wave dispersion compensation in piezoelectric wafer active sensor phased-array applications. Int. Soc. Opt. Eng. 2009, 7295, 729516. [Google Scholar]
- Kessler, S.S.; Spearing, S.M.; Soutis, C. Damage detection in composite materials using lamb wave methods. Smart Mater. Struct. 2002, 11, 269–278. [Google Scholar] [CrossRef] [Green Version]
- Liu, Y.; Li, Z.; Gong, K.Z.; Su, X.Y. A quantitative damage identification method for cf/ep composite laminates based on lamb waves. Appl. Mech. Mater. 2011, 83, 13–18. [Google Scholar] [CrossRef]
- Liu, Z.H.; Xu, Y.Z.; He, C.F.; Wu, B. Experimental study on defect imaging based on single Lamb wave mode in plate-like structures. Eng. Mech. 2014, 31, 232–238. (In Chinese) [Google Scholar]
Figure 1.
Schematic diagram of the PRM.

Figure 2.
Schematic diagram of the composite laminate and sensor array.

Figure 3.
(a) Time-domain diagram of the excitation signal. (b) Frequency-domain diagram of the excitation signal.
Figure 3.
(a) Time-domain diagram of the excitation signal. (b) Frequency-domain diagram of the excitation signal.
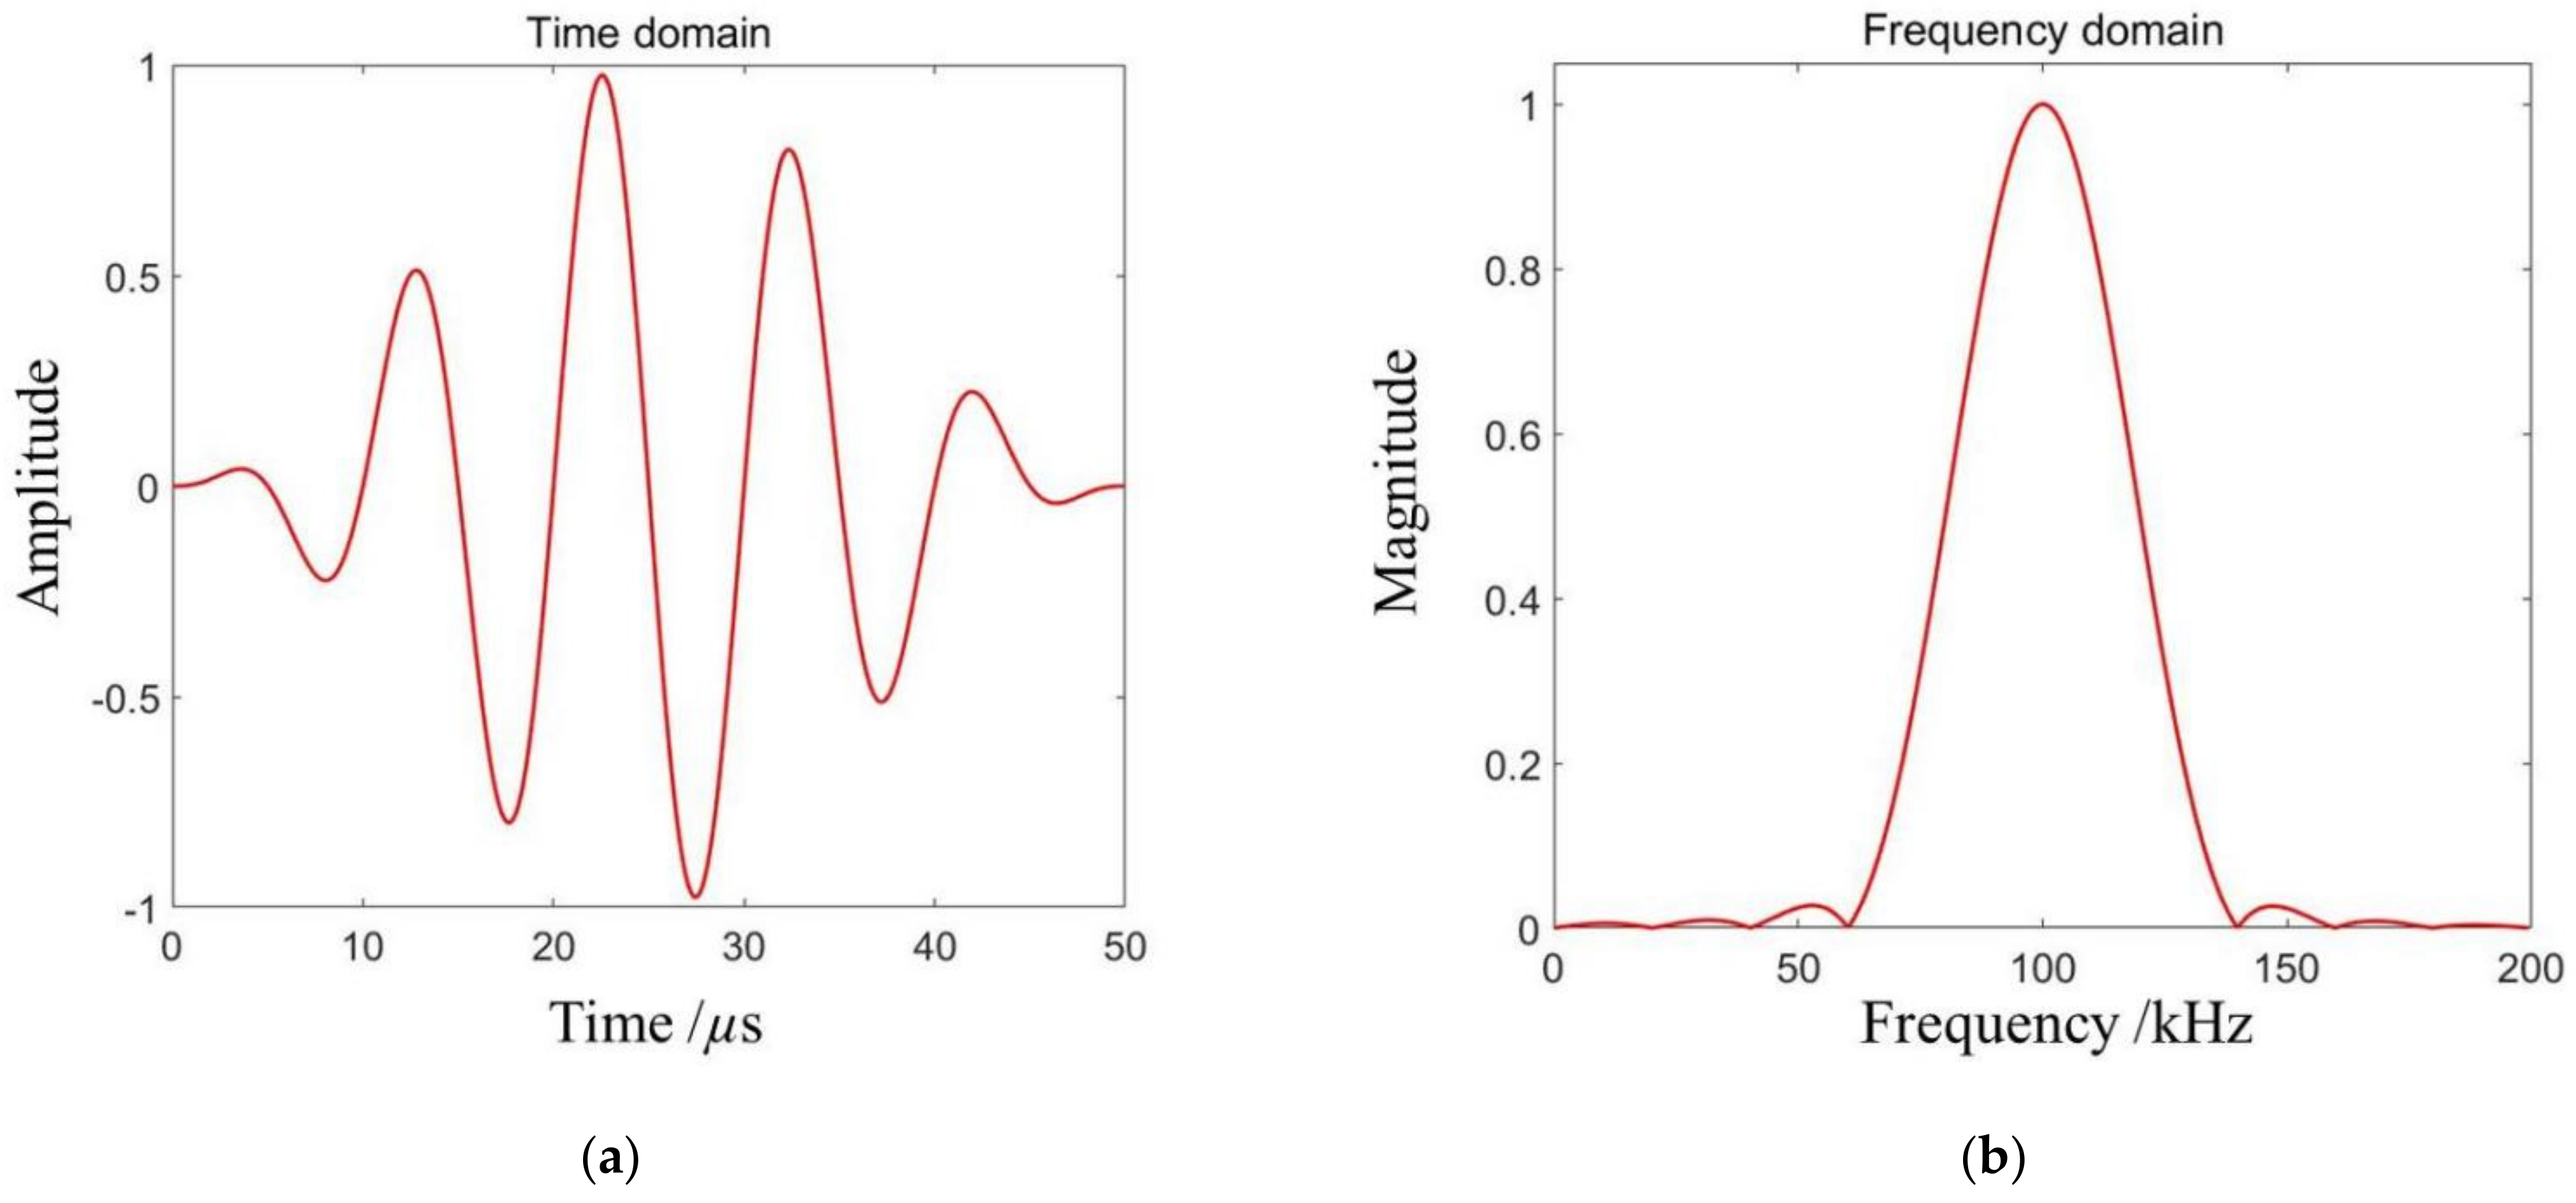
Figure 4.
Wave-field diagram of the orthotropic composite.

Figure 5.
Typical received signals, including the incident and reflected waves.
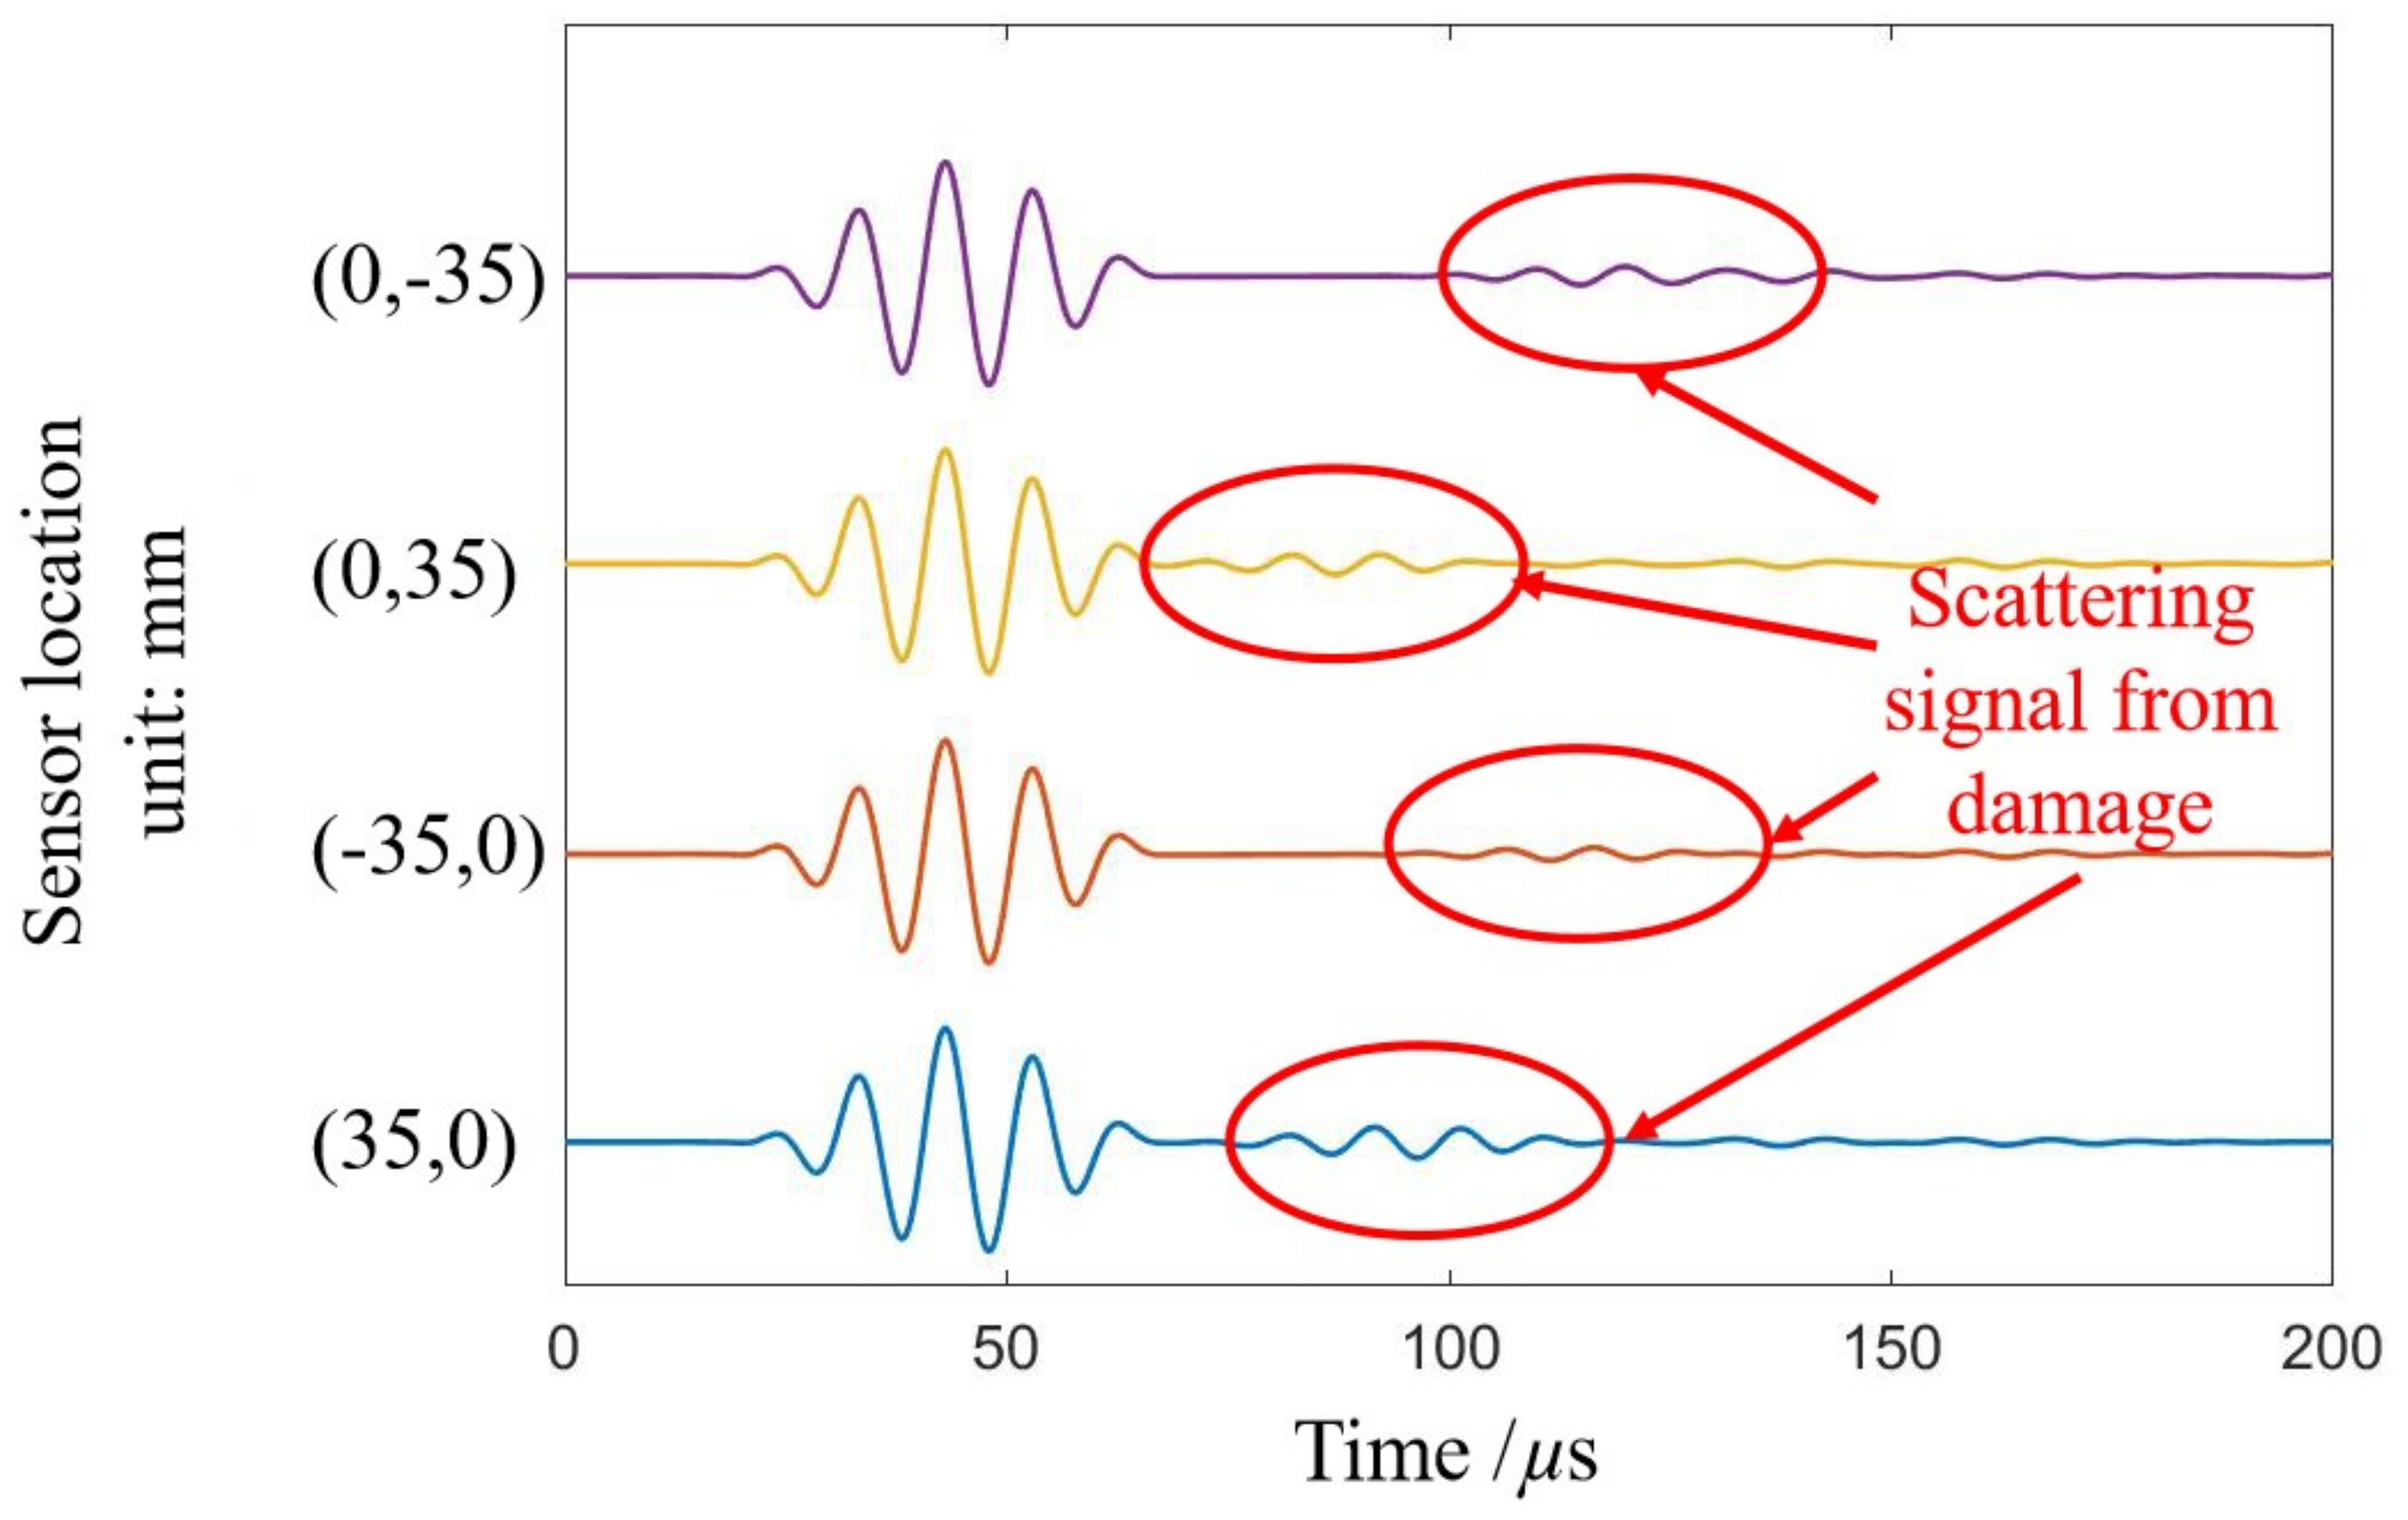
Figure 6.
Phase spectrum of the damage scattering signal on the x-axis.

Figure 7.
(a) Imaging result on the x-axis. (b) Imaging result on the y-axis.
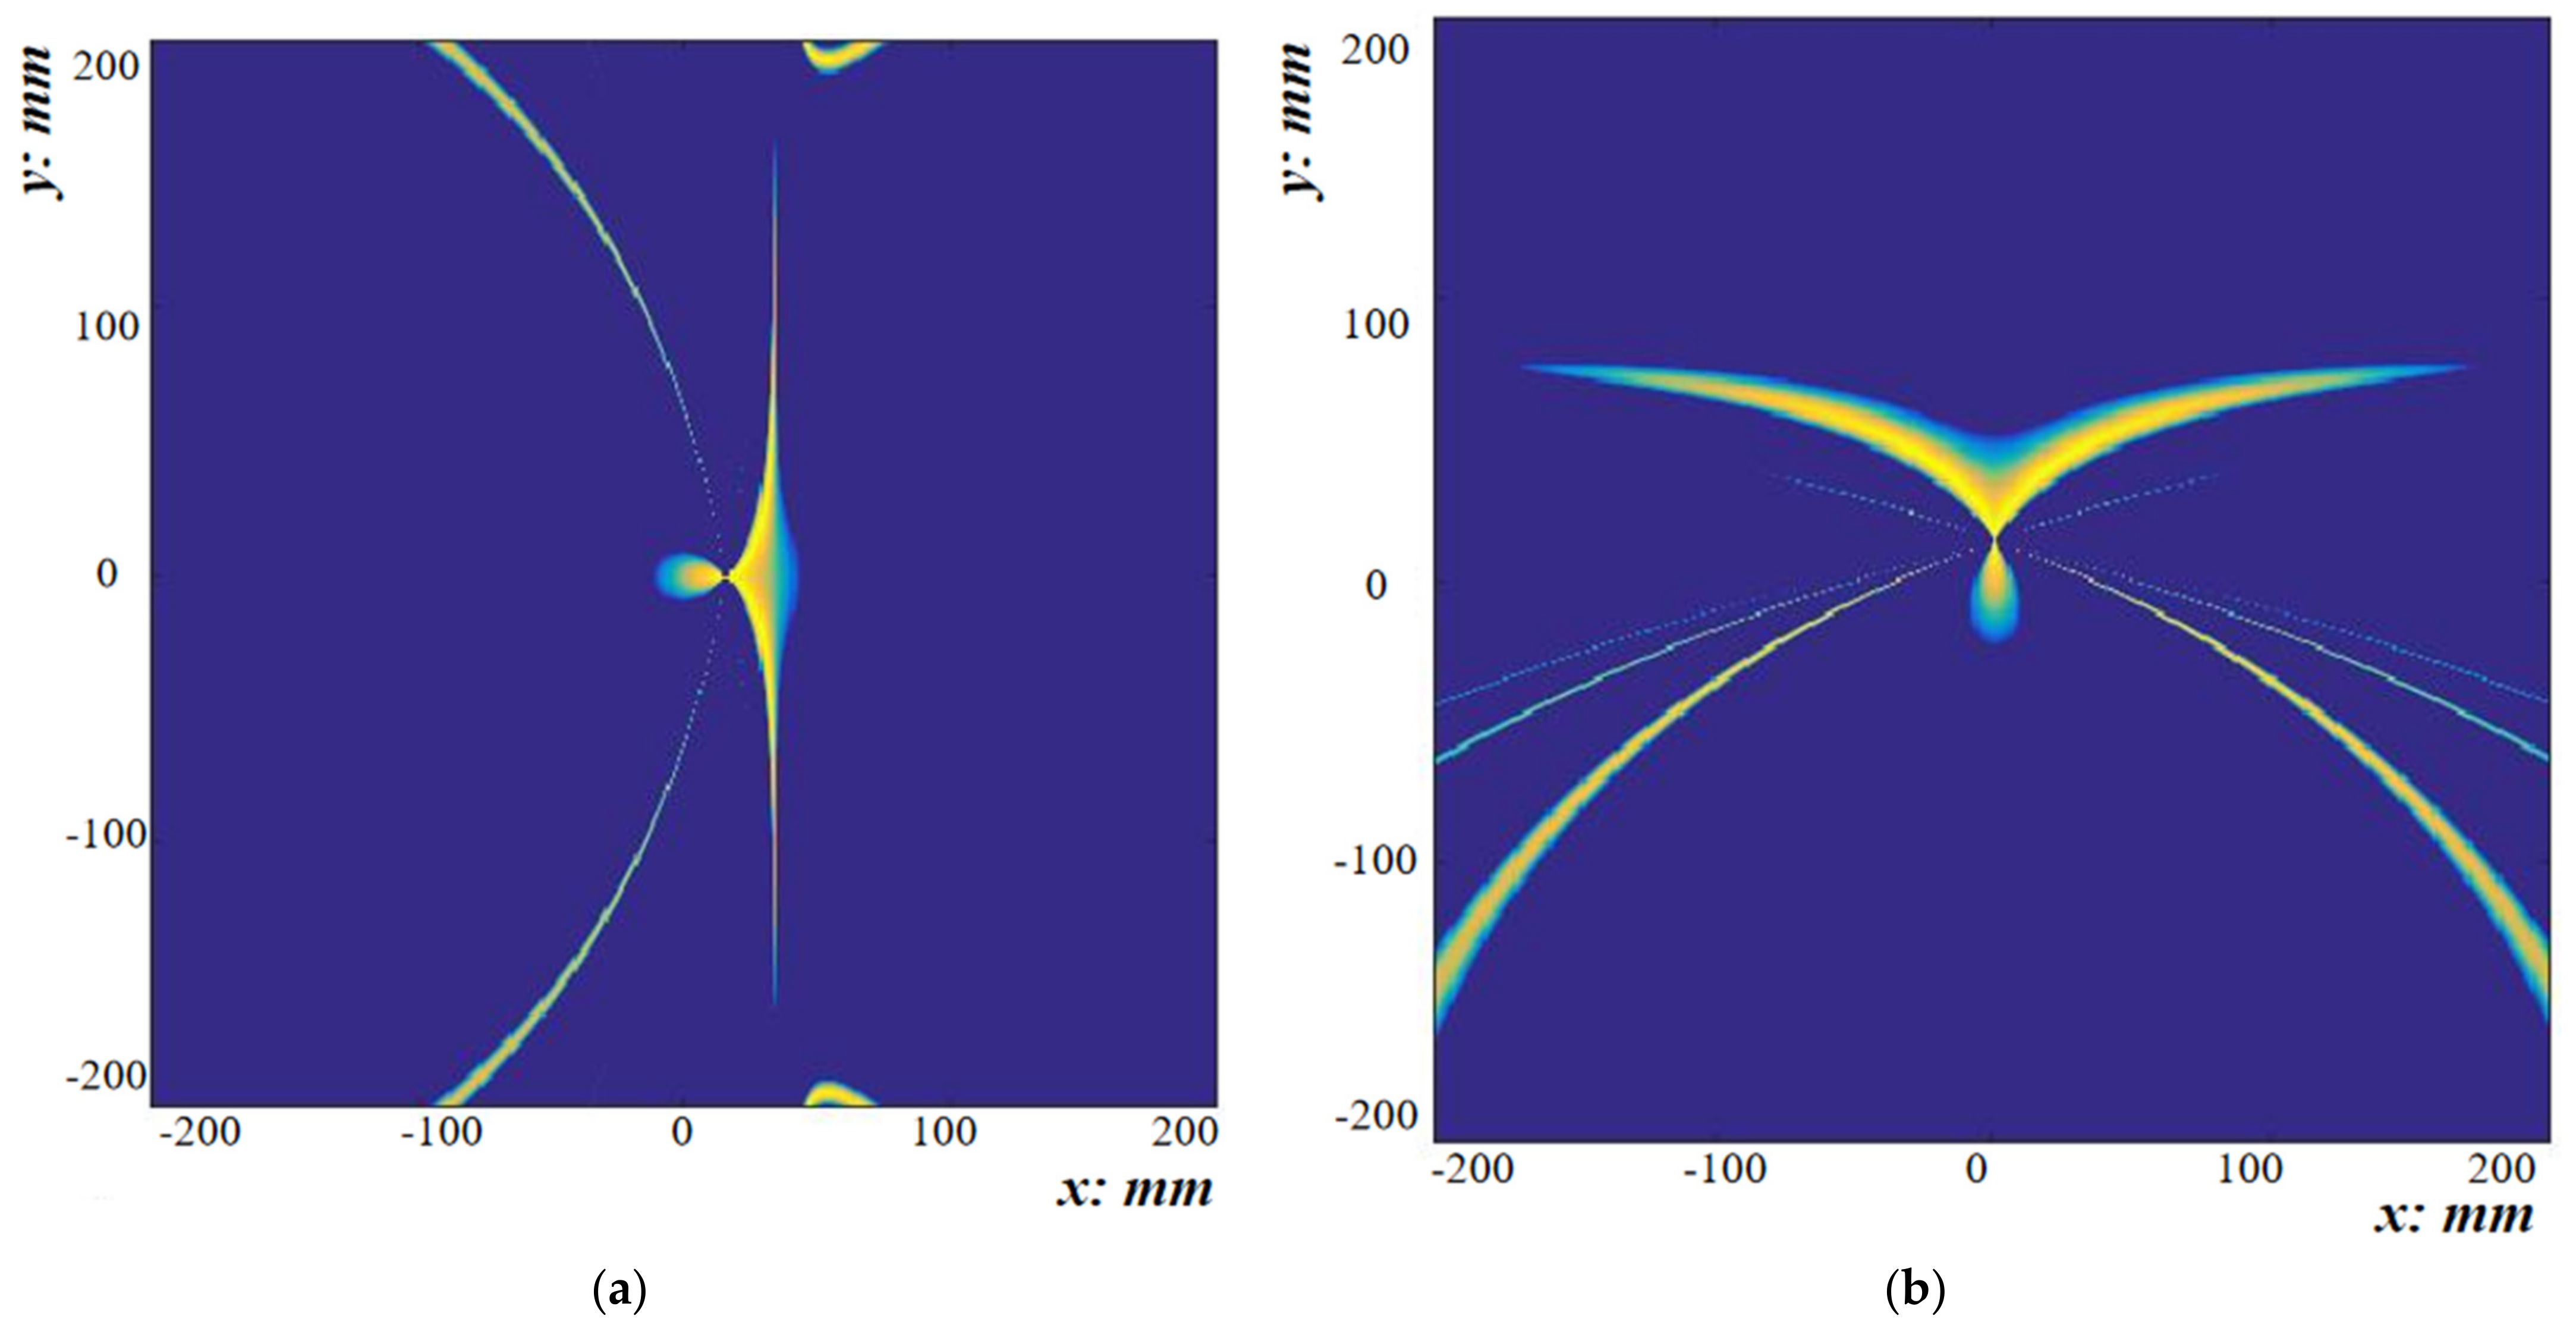
Figure 8.
Damage-imaging result obtained by numerical analysis.
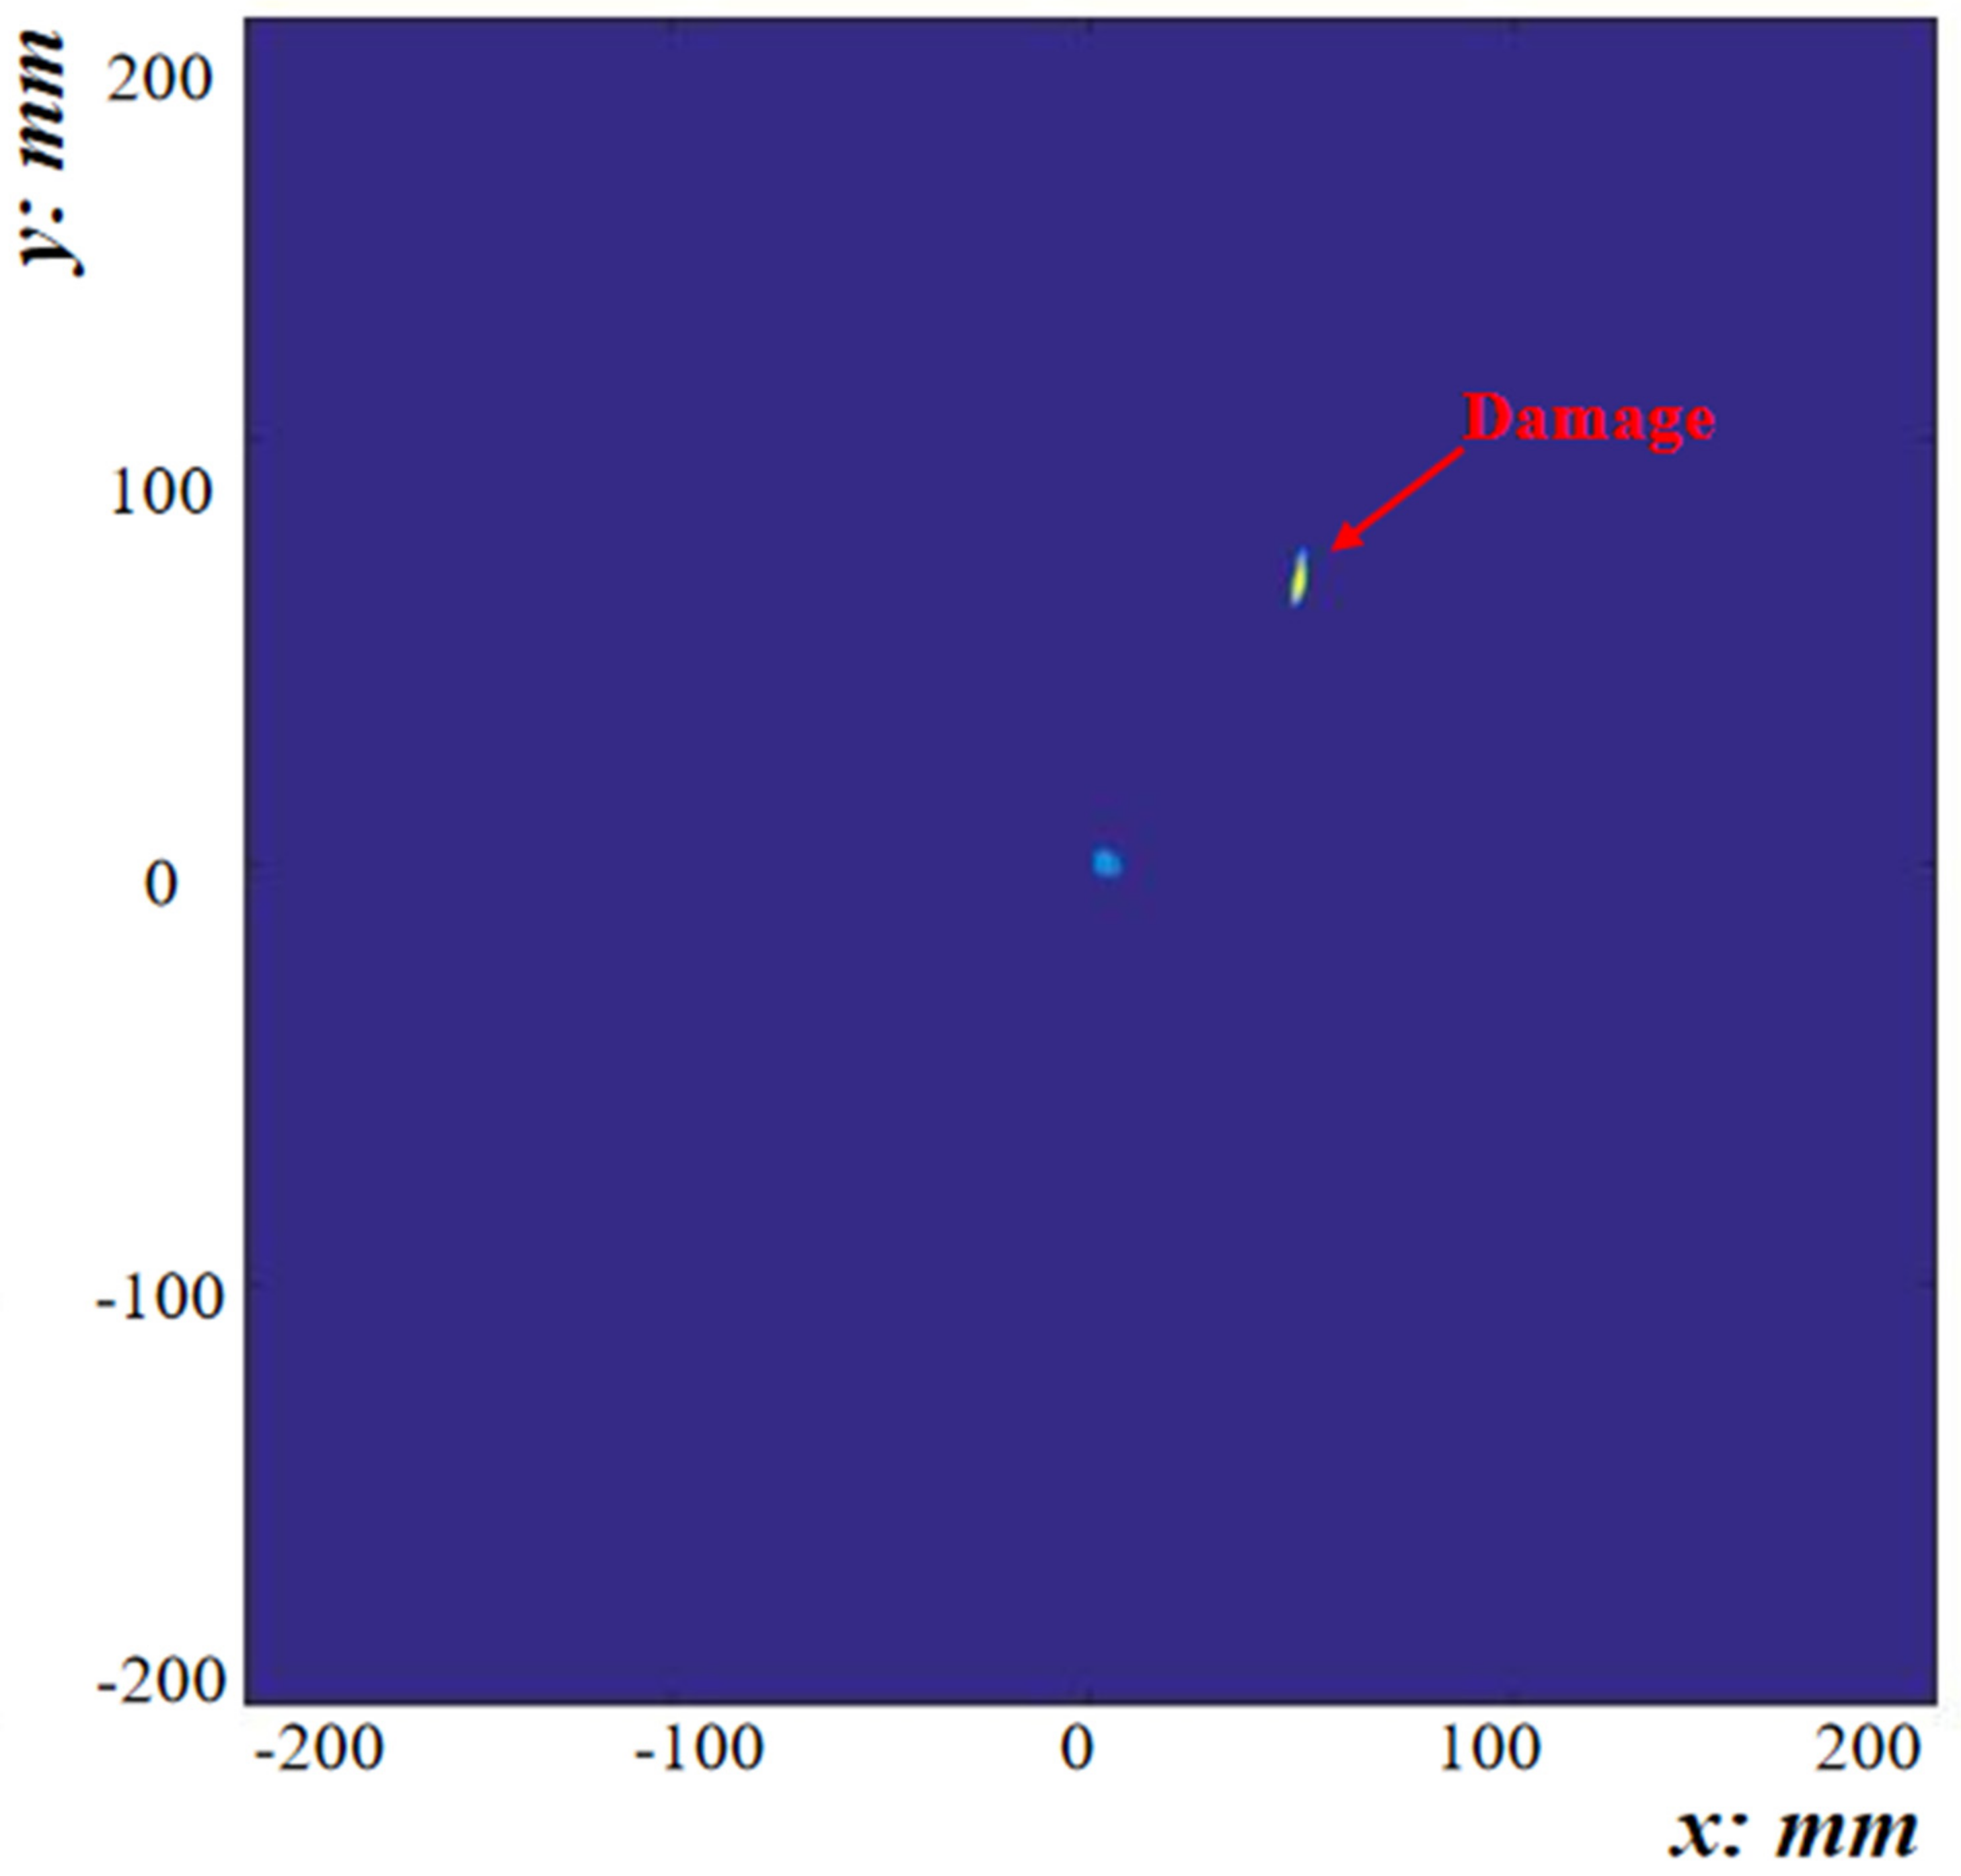
Figure 9.
Schematic diagram of the experimental setup.
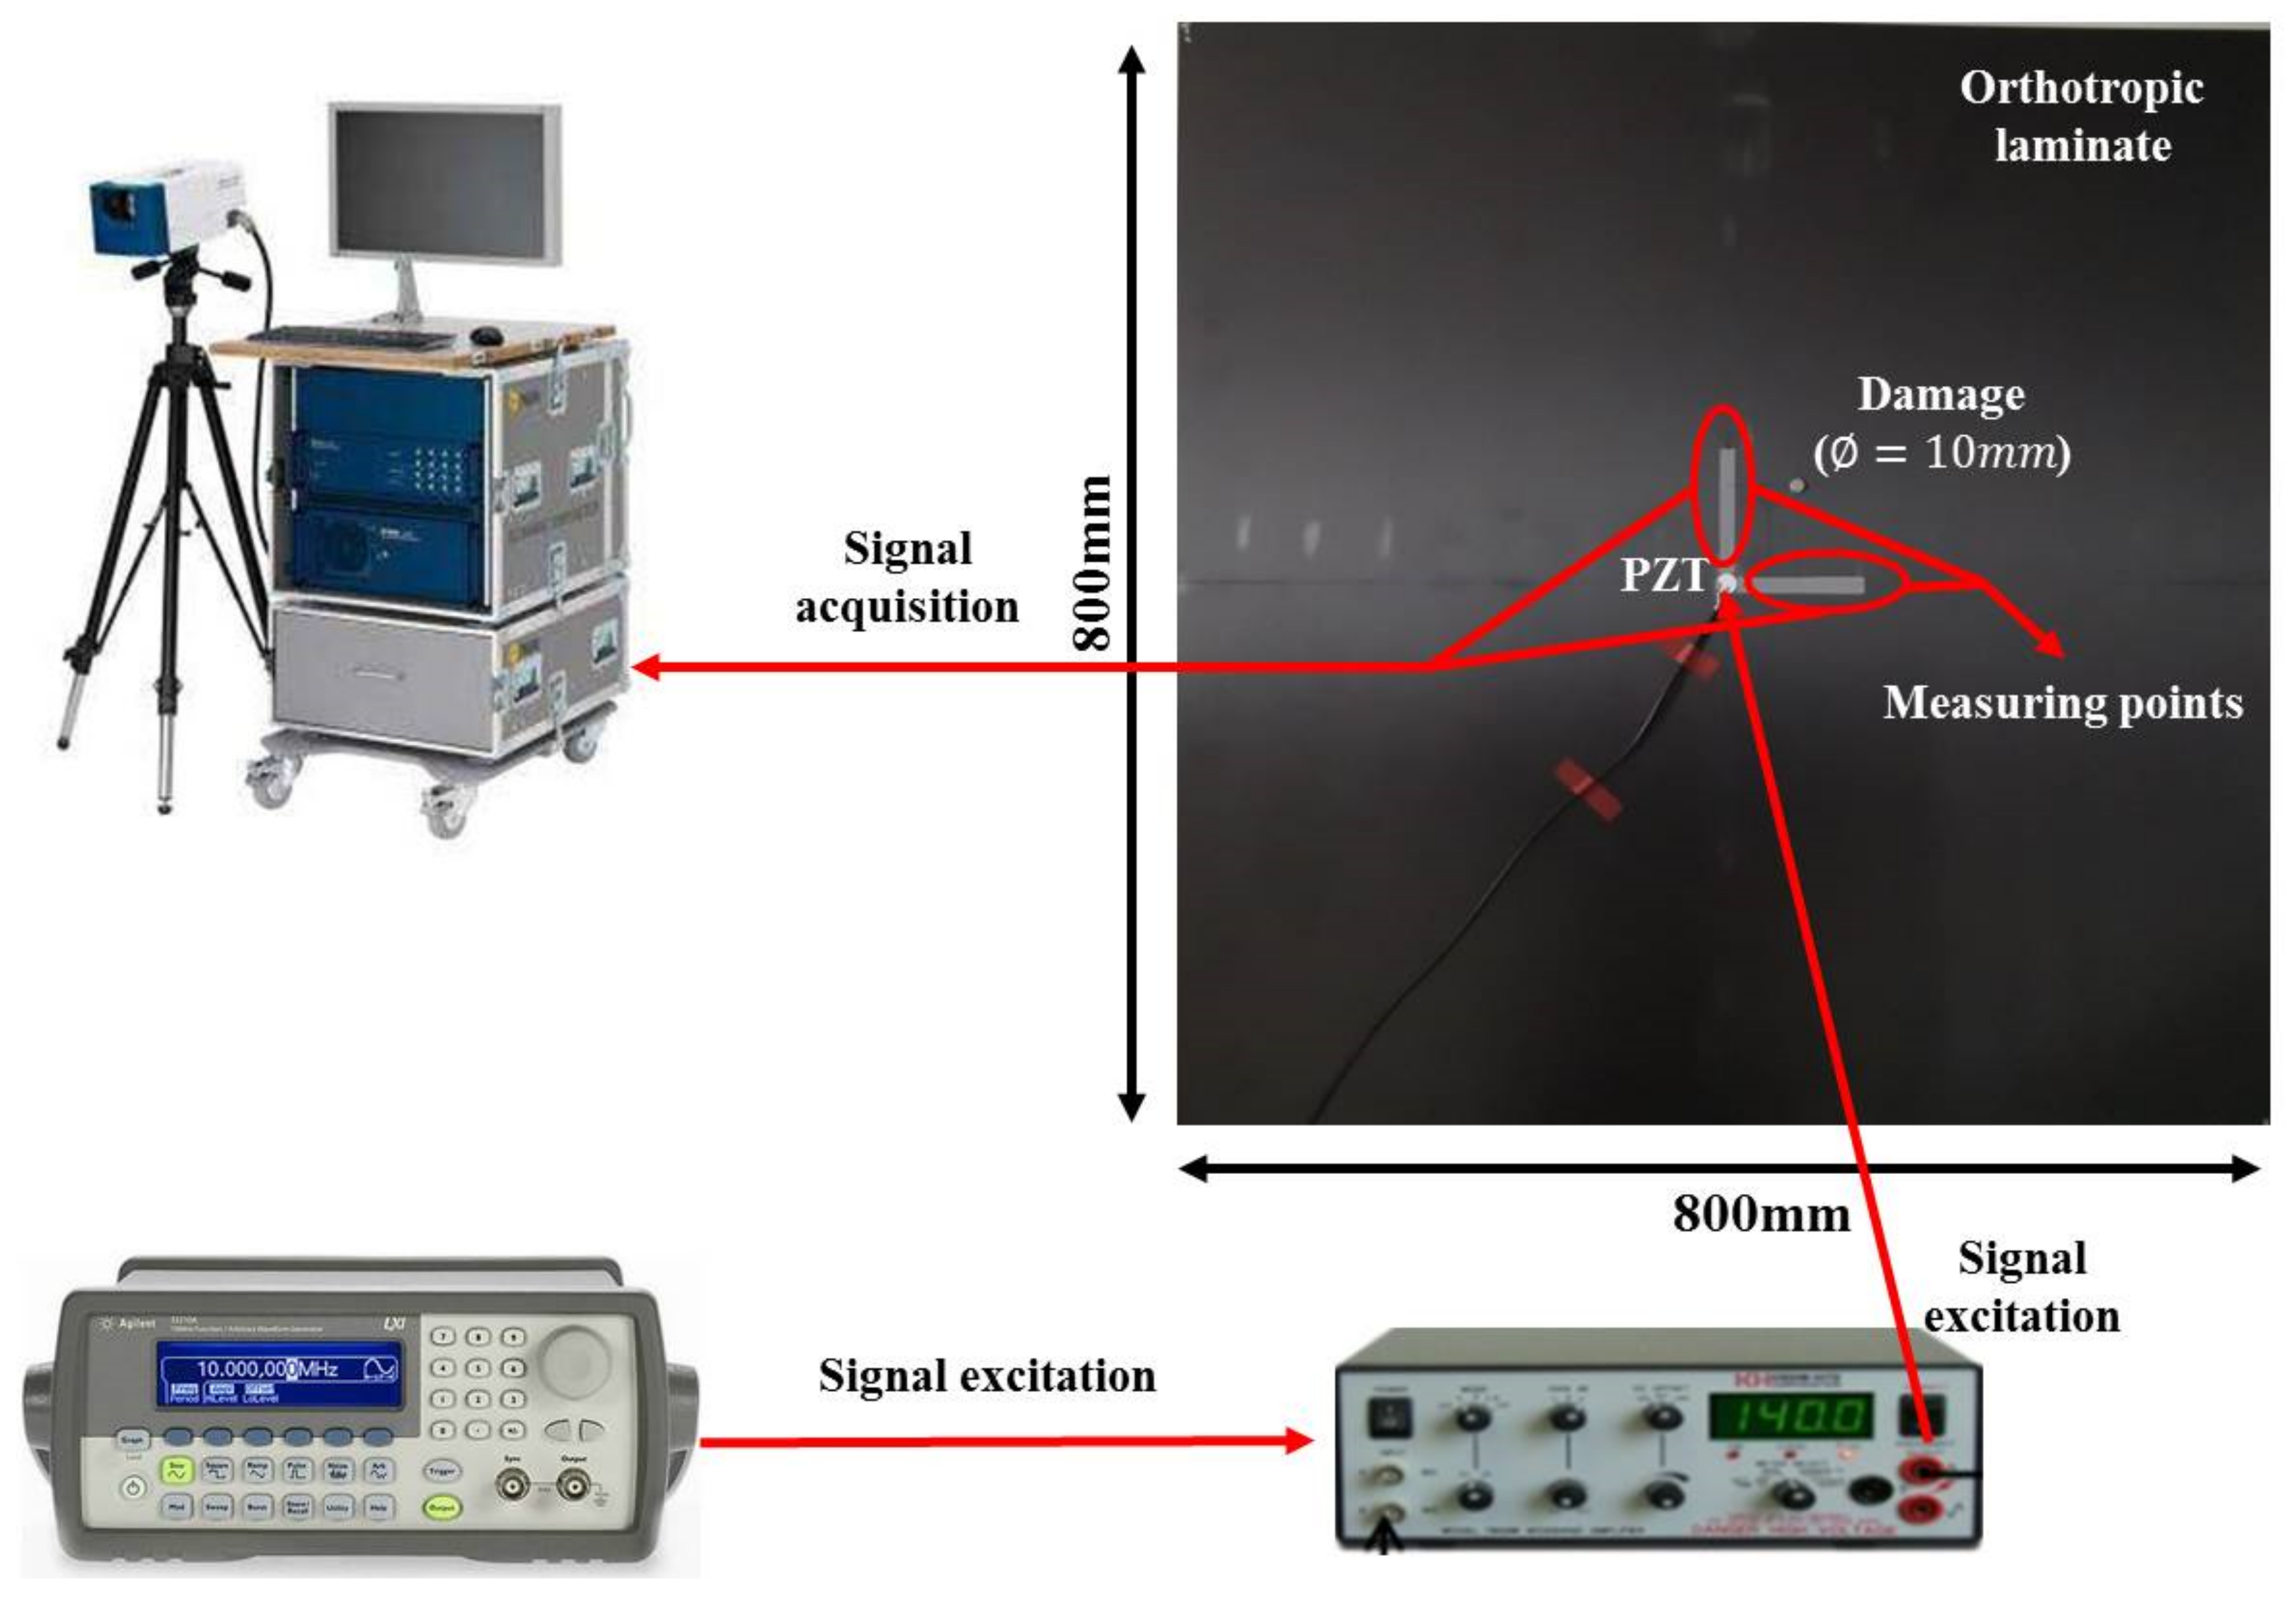
Figure 10.
(a) Received signals, including the incident and reflected waves on the x-axis. (b) Received signals, including the incident and reflected waves on the y-axis.
Figure 10.
(a) Received signals, including the incident and reflected waves on the x-axis. (b) Received signals, including the incident and reflected waves on the y-axis.
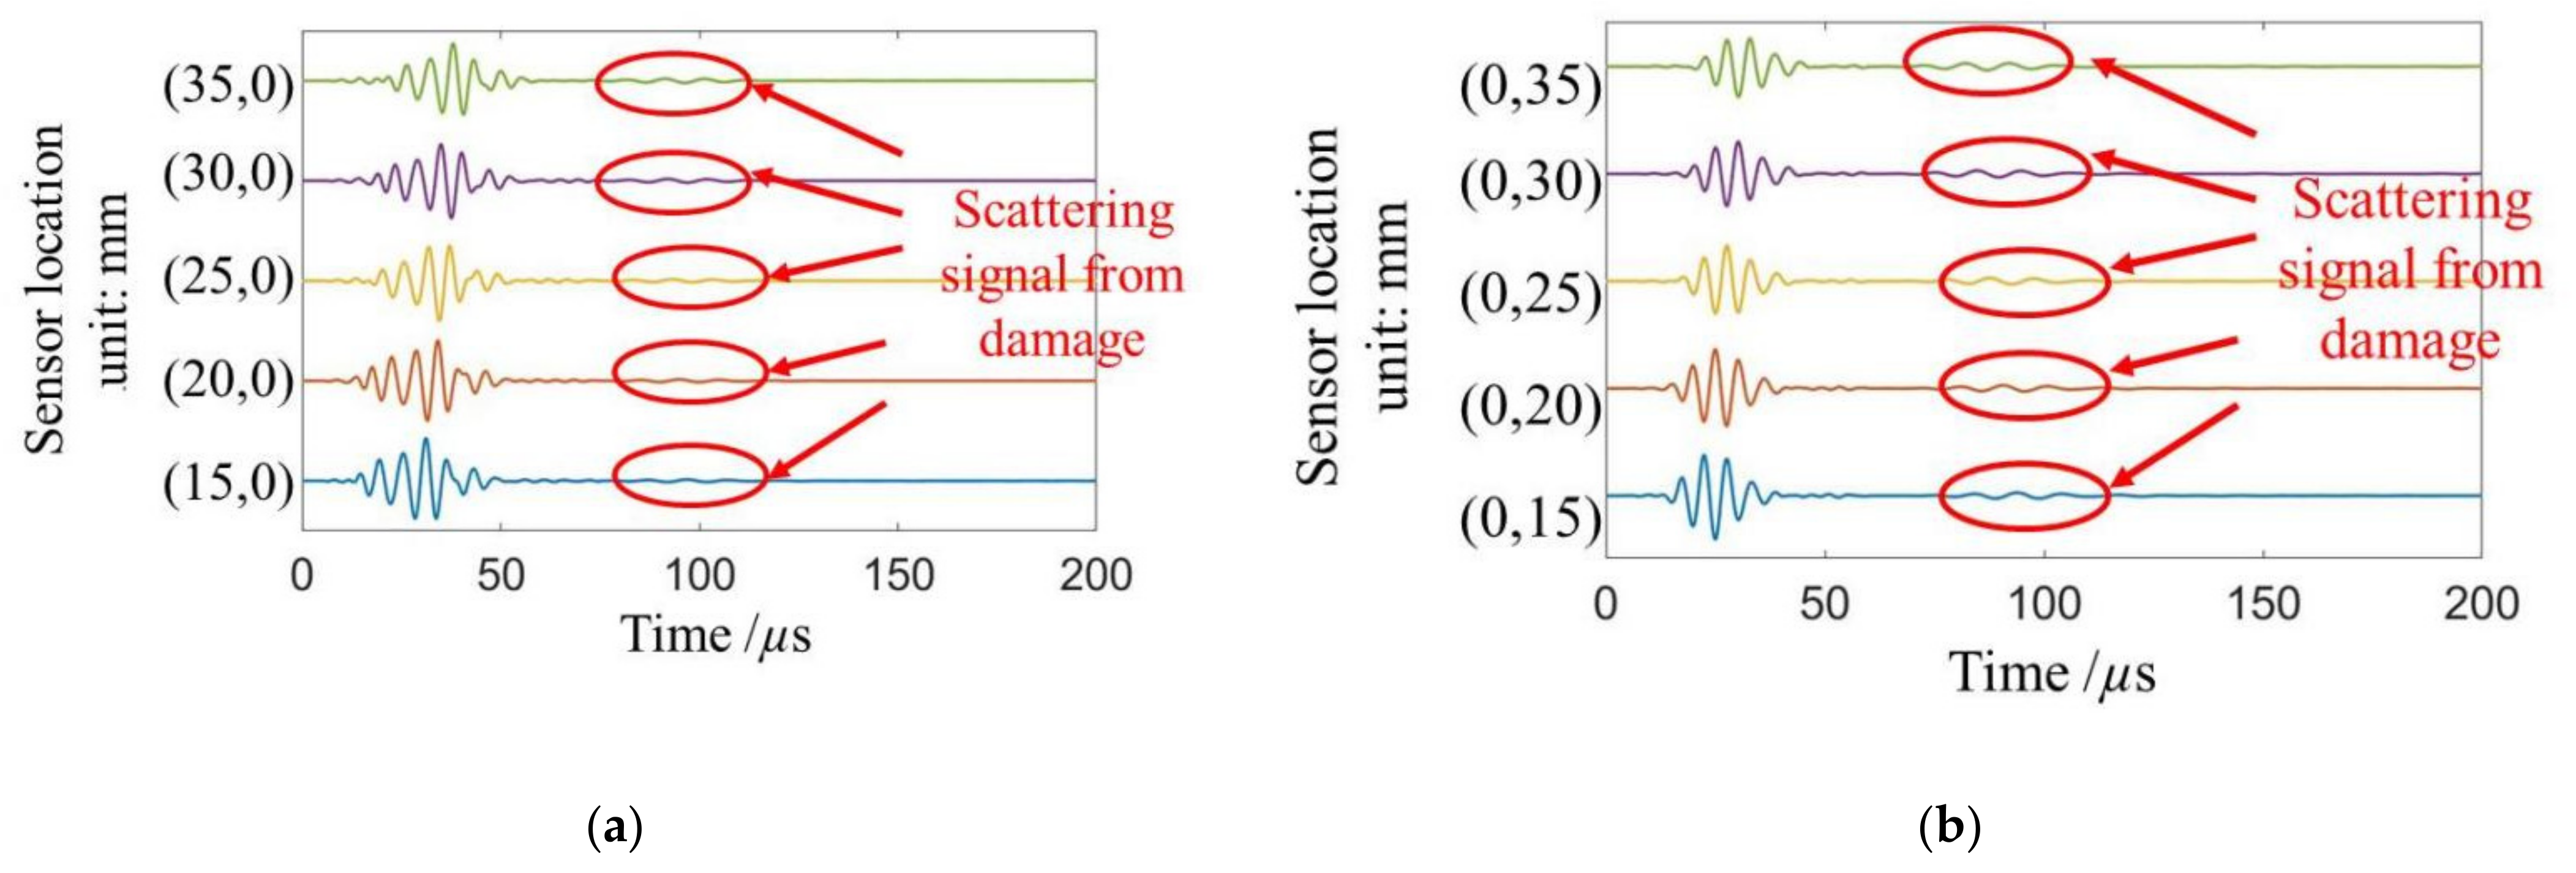
Figure 11.
Damage-imaging result obtained by the PRM.


Table 1.
Parameters of the orthotropic composite.
| Thickness | E11 | E22 | G12 | G23 | v12 | v23 |
|---|---|---|---|---|---|---|
| 1 mm | 178 GPa | 178 GPa | 5.2 GPa | 5.2 GPa | 0.34 | 0.34 |
Table 2.
Location and number of sensors of the four sensor arrays.
| x-Axis (Positive) | x-Axis (Negative) | y-Axis (Positive) | y-Axis (Negative) | |
|---|---|---|---|---|
| Sensor location | 15–35 mm | (−15)–(−35) mm | 15–35 mm | (−15)–(−35) mm |
| Number of sensors | 21 | 21 | 21 | 21 |
Table 3.
Location and number of the four measuring points.
| x-Axis (Positive) | y-Axis (Positive) | |
|---|---|---|
| Sensor location | 15–35 mm | 15–35 mm |
| Number of sensors | 21 | 21 |
Publisher’s Note: MDPI stays neutral with regard to jurisdictional claims in published maps and institutional affiliations. |
© 2022 by the authors. Licensee MDPI, Basel, Switzerland. This article is an open access article distributed under the terms and conditions of the Creative Commons Attribution (CC BY) license (https://creativecommons.org/licenses/by/4.0/).
Share and Cite
MDPI and ACS Style
Han, W.; Feng, K.; Yang, H. Phase Reversal Method for Damage Imaging in Composite Laminates Based on Data Fusion. Appl. Sci. 2022, 12, 2894. https://doi.org/10.3390/app12062894
AMA Style
Han W, Feng K, Yang H. Phase Reversal Method for Damage Imaging in Composite Laminates Based on Data Fusion. Applied Sciences. 2022; 12(6):2894. https://doi.org/10.3390/app12062894
Chicago/Turabian StyleHan, Wei, Kan Feng, and Huagen Yang. 2022. "Phase Reversal Method for Damage Imaging in Composite Laminates Based on Data Fusion" Applied Sciences 12, no. 6: 2894. https://doi.org/10.3390/app12062894
Note that from the first issue of 2016, this journal uses article numbers instead of page numbers. See further details here.