
A Novel Method for the Mechanical Testing of Sports Mouthguards


Department of Engineering Science, University of Oxford, Oxford OX1 3PJ, UK
*
Author to whom correspondence should be addressed.
Appl. Sci. 2022, 12(7), 3449; https://doi.org/10.3390/app12073449
Submission received: 27 January 2022
/
Revised: 25 March 2022
/
Accepted: 26 March 2022
/
Published: 29 March 2022
(This article belongs to the Collection Sports Equipment and Materials)
Abstract
:Current mouthguard test methods require improvement, as the impact energies during traditional testing do not reflect the higher energy that can be observed in actual use during sport. A new data set of ball speeds experienced during the sport of field hockey was obtained. These ball speeds have then been used to estimate impact energies. This information was used to subsequently develop a new test method consisting of a high-speed camera and drop tower. Observations show an increase in energy experienced by the mouthguard for higher-impact energies. The work carried out showed that current testing methods for sports mouthguards use lower-energy impacts than experienced during the sport of field hockey. The new method that is proposed allows for a more realistic representation of real-world impacts.
1. Introduction
Field hockey is one of the most popular sports worldwide; an estimated three million people play in 137 national associations across five continents. Orodental injuries are particularly prevalent in field hockey, with up to 68% of players reporting at least one orodental injury during their career [1]. A study carried out in 2013 showed that the mean number of injuries per match is 0.7 in women’s and 1.2 in men’s tournaments. Of these recorded injuries, 40% affected the head/face for women against 27% for men [2]. As a result, mouthguards are used to protect participants against these injuries. Research shows that mouthguards offer substantial protection against orodental injuries, reducing the risk of injury by 1.6–1.9 times compared to not wearing a mouthguard. Furthermore, it is suggested that mouthguards should be used in sports with a high risk of orofacial injuries [3].
To provide the necessary protection, mouthguards should be tested within the environments of the desired application; therefore, data sets of impact scenarios experienced during field hockey are important when testing mouthguards as protection systems. Data were collected on the kinematics of field hockey shots during the 2014 World Cup [4]. To collect these data, radar technology was used to measure the speed of shots on the goal during the tournament. The technology recorded and published the fastest shot, which was at a speed of 38.9 ms and equates to an impact energy exceeding 100 J using the typical mass of a field hockey ball. Unfortunately, this was not set up as a scientific experiment and the full data set was not published. In addition, the technology only recorded shots on goals during matches, which resulted in a small sample size. Nevertheless, the results offer an indication of ball speeds expected during a shot in field hockey. In another study, in 2010, Willmott noted that despite the importance of the hit technique (contact between ball and stick) in field hockey, there are limited data to help understand the hit in field hockey [5]. Willmott conducted an experiment that looked in depth at the motion of the hit, focusing on the stick rather than the ball. A study which analysed six male and six female field hockey players, found that the maximum ball speed during a hit was 38.6 ms (equating to over 100 J) [6].
However, several studies on testing the safety of sports mouthguards do not consider real-world data as a basis for the impact energies used. For example, in Warnet’s investigation into the behaviour of different mouthguards during an impact, Warnet utilises a drop tower and compares three mouthguard materials at impact speeds of 3.9 ms, 4.8 ms and 5.7 ms [7], which corresponded to impact energies of about 10 J, 15 J and 20 J [8]. Another study, by Greasley et al., which compared the effectiveness of different mouthguard designs, used an impact energy of 10 J [9]. Furthermore, a paper on the design and testing of a novel mouthguard in 2013 tested the mouthguard models using an impact energy of only 1.37 J [10]. Most of the impact tests performed use either a pendulum technique or a drop tower test setup [11,12]. Generally, a force transducer or load cell is used to measure the mechanical response to impact. These studies, along with other previous mouthguard testing, show that the mouthguards are tested at much lower impact energies than field hockey players may be exposed to, which is likely to compromise the safety of the players.
The previous studies provide useful information on the kinematics of a field hockey ball; however, there is a gap in the literature for a large sample of real-world data. To test the safety of a mouthguard in this setting, this gap needs to be filled to ensure the mouthguard is safe in all situations; therefore, this work aimed to construct a more comprehensive impact testing process of mouthguards on the basis of real-world data. To achieve this, firstly, a representative data set of ball velocities was analysed. Secondly, a novel method for mouthguard testing was developed to contribute to the creation of representative impact energies and to differentiate between hockey ball and mouthguard performance. Thirdly, mouthguards were tested at impact energies observed during the field study. Finally, the novel method was verified and conclusions were drawn.
2. Field Study for Real-World Data Collection
The data used were sourced from eight high-level hockey players playing in the England Hockey National League. This data set provided the opportunity to obtain a reliable distribution of ball speeds. No details of the participants were recorded.
2.1. Methods
The kinematics of the field hockey ball were measured as a part of a technical assessment using a high-speed camera. There are four known and calculated parameters needed to determine the speed of a shot: the distance moved by the ball between two frames; the frame number of the initial position; the frame number of the final position; the number of frames per second captured by the camera. The frame numbers are found by analysing the video, and the frames per second of the camera used in this work is 240 with a resolution of 1920 × 1080 pixels. The difficult parameter to determine is the distance travelled by the ball.
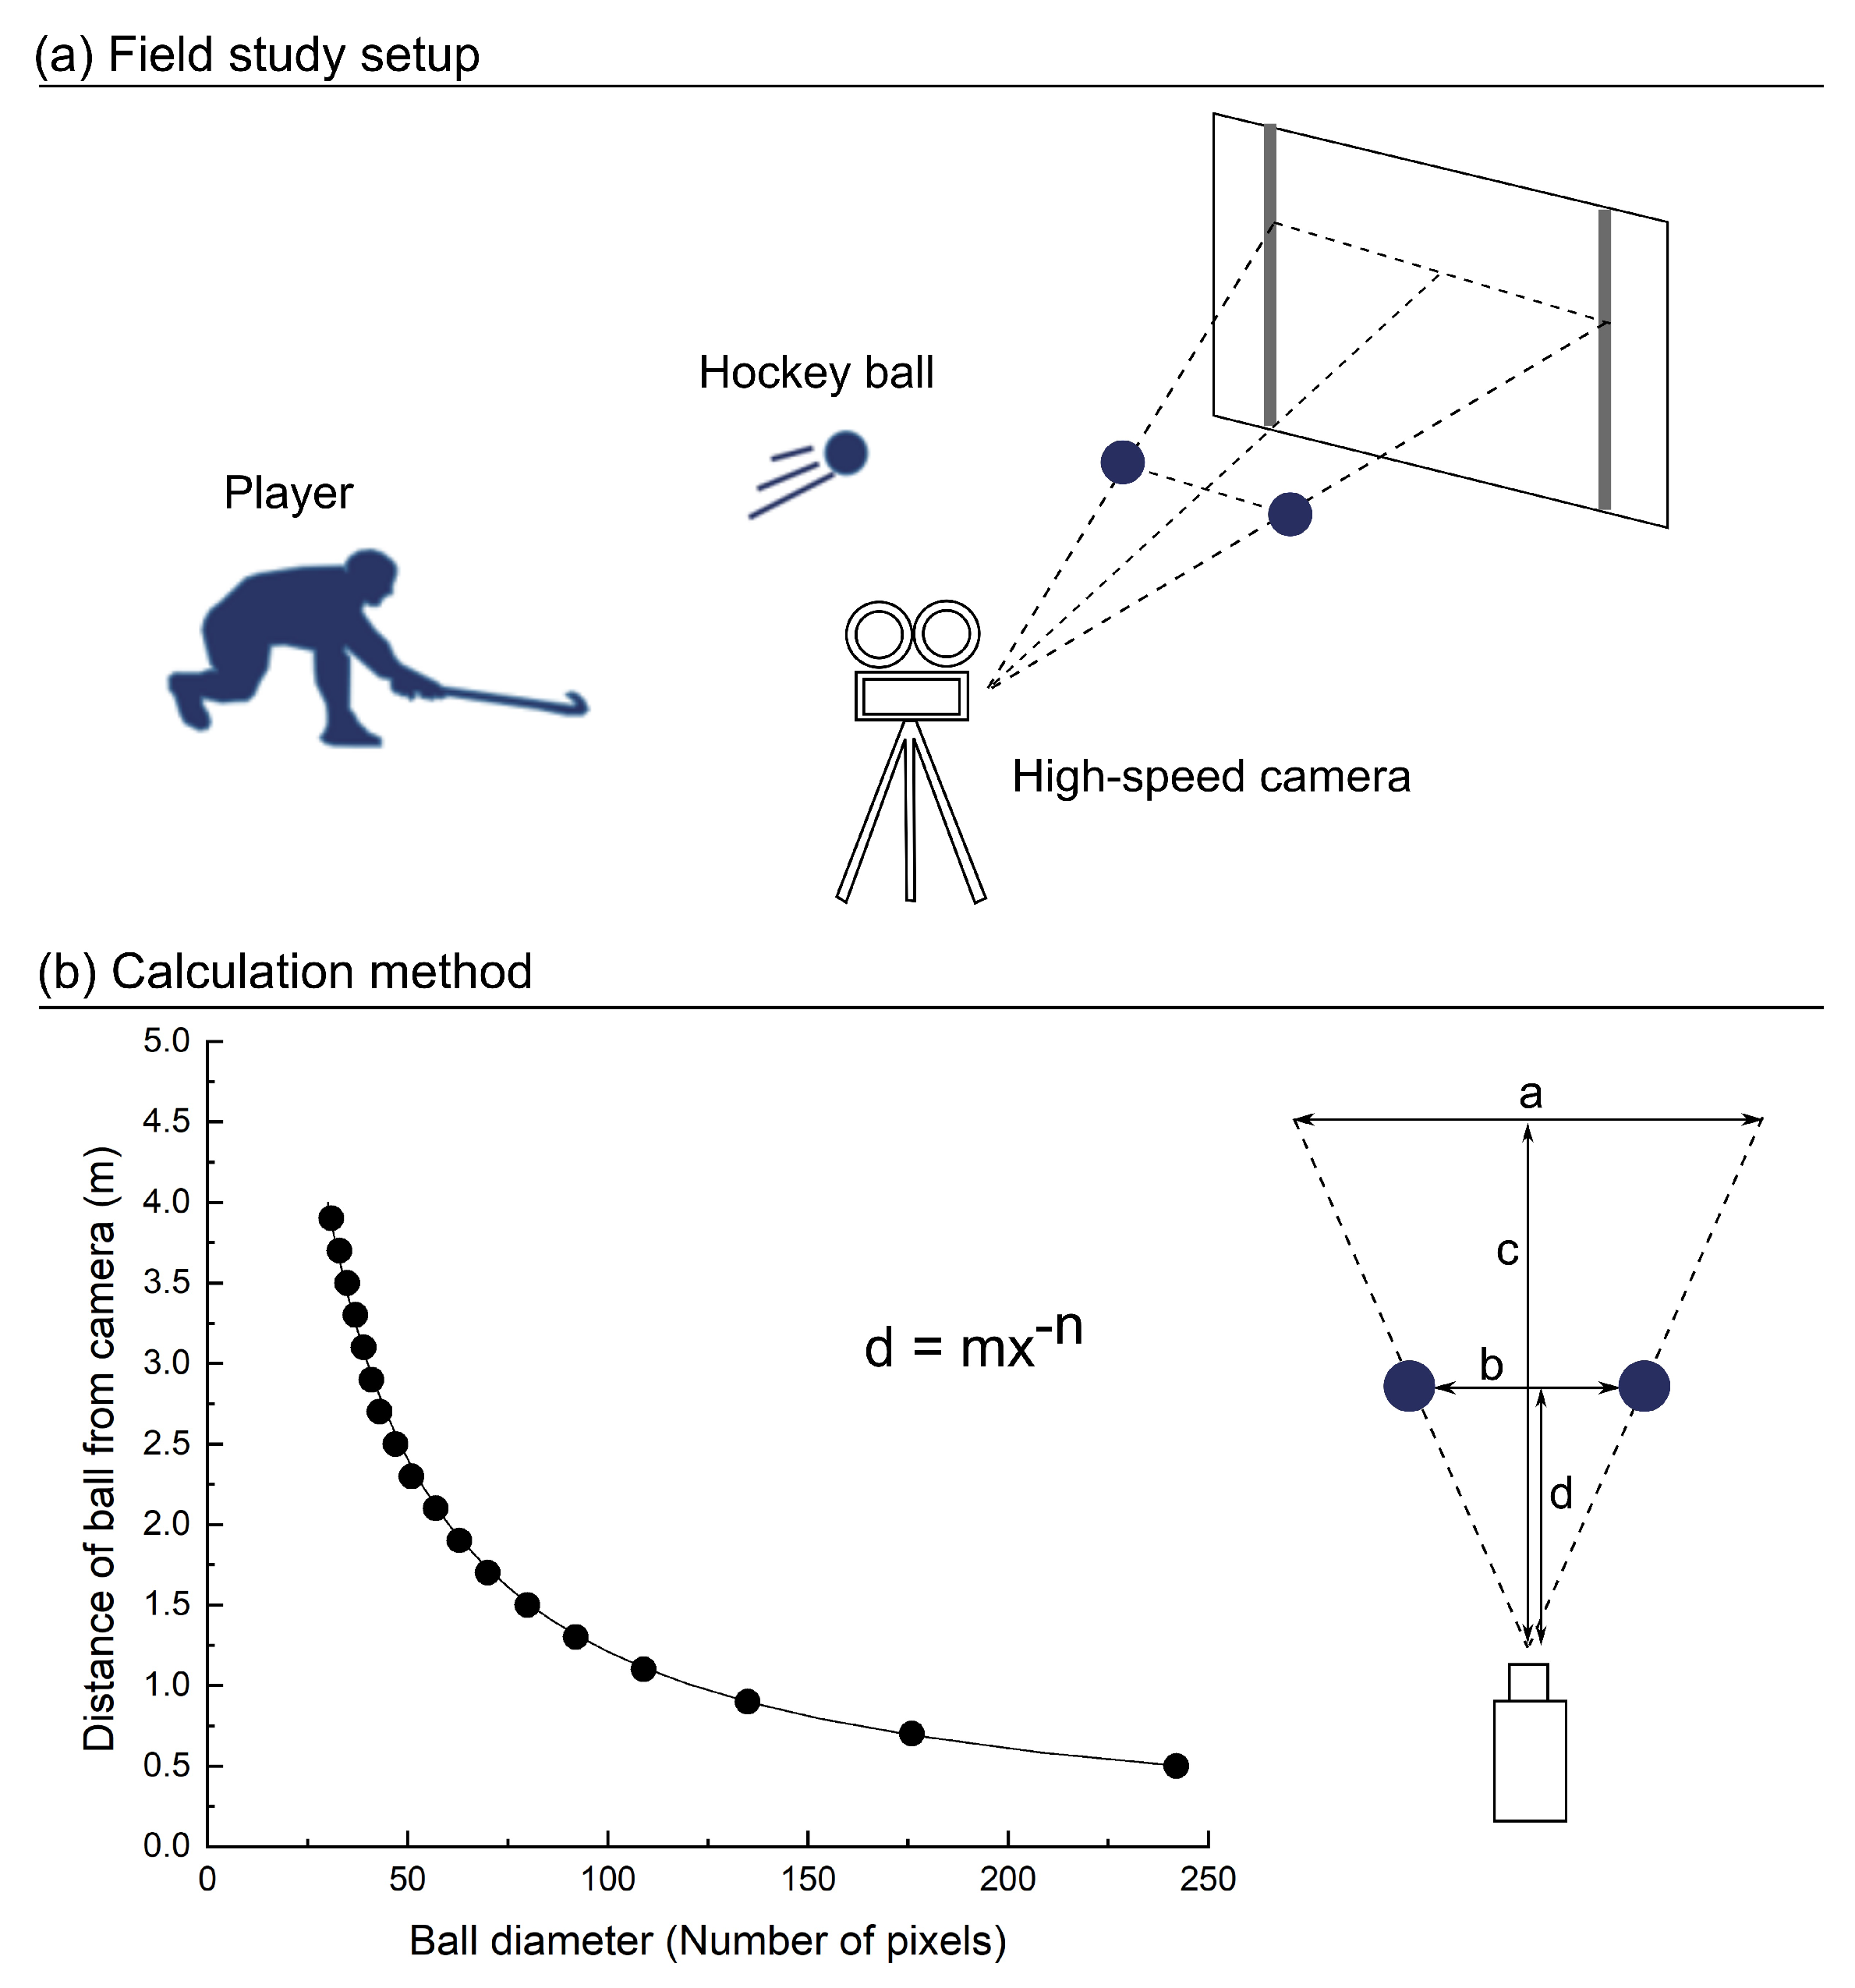
To determine the distance travelled by the ball, a reference distance of a = 0.8 m was plotted on a black board with two fiducial white lines, such that the ball passes between the board and the camera. Figure 1a illustrates this setup. The videos captured by the high-speed camera were processed and analysed in MATLAB (R2017a, Mathworks, Natick, MA, USA). To calculate the distance travelled in metres from the number of pixels travelled, the length of one pixel is used. This length is found by dividing the 0.8 m gap between the vertical lines on the board by the number of pixels between the white lines, which results in a pixel length of 0.0012 m. The MATLAB script identifies the number of pixels that the ball has travelled between two frames which, in conjunction with the pixel length, gives the distance in metres that the ball has travelled; however, due to the gap between the ball and the board, the pixel length on the board is different to the pixel length that the ball travels across. As a result, a parallax error is introduced as pixels cover a larger area when they are further from the camera. The parallax error is accounted for by using the size of the ball in the frame, which is used to determine the distance between the camera and the ball. This distance is known from a sample video in which the ball is captured at known distances and the size of the ball in pixels is recorded. Figure 1b demonstrates the distribution of the measured pixel size of the ball depending on the distance d to the camera with the exponential parameters m = 116.75 and n = 0.992. The script then combines the distance travelled by the ball with the corresponding frame numbers and frames per second of the camera to output the speed of the ball considering the parallax error and the known distance of the camera to the board, which is c = 2.0 m.
The easiest way to collect many data points is to take shots from close to the board, thus, each player takes 100 shots from a distance of 3.2 m. Furthermore, to investigate the effect of distance from the board on the speed of the ball, the players perform 30 shots from a further distance of 4.8 m.
2.2. Results
Over 85% of 612 shots fell between 20 ms (30 J) and 40 ms (122 J), and the maximum speed was 43.5 ms (145 J), which was similar to the maximum speed found in the literature [6]. The mean speed from the distance of 4.8 m was 24.2 ms (45 J), whereas it was 28.5 ms (62 J) for 3.2 m. Table 1 summarises the mean speeds and standard deviation of each data set. Shots were slower from a greater distance, yet the lowest speeds and highest variability were recorded for the closer distance.
In Figure 2a, data from the shorter distance are shown in more detail, and the eight players are plotted in different colours.
The observed impact velocities in the field study were converted into impact energies considering the known mass of the hockey ball (m = 0.153 kg) manufactured by Kookaburra, to circumvent the maximum height restriction of the drop tower available for the subsequent impact tests. Figure 2b presents the observed distribution of impact velocities and energies.
3. New Method for Testing Sports Mouthguards
Based on the observations in the field study, a new method for testing mouthguards at representative impact energies in real-world scenarios was developed.
3.1. Methods
3.1.1. Materials and Specimen Design
The investigated mouthguards are made from ethylene-vinyl acetate (EVA). The EVA material is bought as 3 mm thick, 120 mm sheets from Keystone Industries. This material is widely used for custom-fitted mouthguards. The EVA material has a mean Shore A hardness of 82, which was obtained using different studies ([13,14,15,16,17,18]). Five specimens were produced to be tested at five different impact energies based on the observations of the field study.
The thickness of the mouthguards is directly related to the energy experienced and inversely related to the transmitted forces; however, there is a trade-off in the user comfort as the thickness increases. Westerman et al. found that, for EVA mouthguards, increasing the thickness resulted in greater energy dissipation and reductions in the transmitted forces; however, the improvements lessened when increasing the thickness past 4 mm [19]. For this work, the thickness of the mouthguard models was designed to be 5 mm. This was to closely emulate the best performing thickness of 4 mm found by Westerman, but is slightly thicker due to the nature of the impact tests being conducted at up to 100 J; much higher than the 4.4 J used in Westerman’s study.
A simplified mouthguard based on a real mouth scan was designed as shown in Figure 3a. The original scan was taken from a healthy adult and used to ensure that the dimensionality of the simplified model was representative enough of a set of teeth. To fix the mouthguard in a way that resembles how it would appear in the user’s mouth, it was necessary to include a material that mimics the role of the teeth, of which there are multiple possibilities; therefore, materials that have similar mechanical properties to tooth enamel were investigated.
Lawn et al. studied the mechanical properties of teeth and found the results shown in Table 2 [20]. A material that Lawn et al. found to have similar properties to that of enamel is aluminium, which is a metal with low brittleness, but with similar hardness and Young’s modulus to that of enamel. Although aluminium does not represent perfectly how the teeth will respond, the mechanical properties are similar enough for the study to quantify the effect of the impacts that are analysed. Hence, the specimens were mounted for each test on the mouthguard fixture made from aluminium as shown in Figure 3a,b.
The mouthguards were manufactured using five layers of 3 mm thick EVA sheets. Figure 3a represents the dimensions of the mouthguard. Each layer was heated and as it was added on top, it fuses to the layer beneath. The layer was then allowed to cool and harden before another sheet was added on top. Although the mouthguards were designed with the same dimensions, due to variations in the manufacturing process, they were not identical. Table 3 provides the measured mean thickness of the manufactured mouthguards. Figure 3a indicates with the black dots the different thickness measurement locations.
The mouthguards were impacted with the hockey ball used in the field study, which is manufactured by Kookaburra, made from rotationally cast PVC (Polyvinyl chloride) casing and has a diameter of 73 mm.
3.1.2. Experimental Setup
A drop tower test was the chosen method for the impact testing of the mouthguards for this work. A disadvantage of a drop tower test is that the speed of the impact is limited by the maximum height of the tower. To achieve impact speeds of 43.5 ms, a ball would need to be dropped from a height of 96.4 m; however, by converting the speed of each impact to an impact energy, the impact energy can be reproduced in the laboratory by increasing the mass of the impact object. A distribution of impact energies was calculated from the distribution of ball speeds, shown in Figure 2b. This distribution was used as a basis for setting up the impact tests using the drop tower apparatus. It is important to test the mouthguards at various impact energies to ascertain how they respond to impacts with shots of different speeds. As a result, a range of impact energies were selected as a reference for the impact testing, displayed in Table 4. Specimens were used only once for each impact energy experiment.
The drop tower required the impactor, consisting of hockey ball and holder, to be attached to the drop rod via a screw at the end of the drop rod (Figure 3b). The ball could not be attached directly using a screw, so a ball fixture was created to connect it to the drop rod. The ball fixture also acted as a mass increase to the drop equipment to achieve the required impact energies. The ball fixture was made from an aluminium alloy cylinder. To attach the ball to its fixture, tape was applied around the circumference of the ball and fixture. The fixture had a threaded hole on the top face that the drop rod screws into, holding it in place during the test.
The specimens were mounted on the mouthguard fixture and positioned so that the hockey ball was aligned to the middle of the specimen’s width, as shown in Figure 3a,b. A high-speed camera was used to record the deformation of the ball and the mouthguard for the duration of the impact at 20,000 fps with an image resolution of 704 × 520 pixels. (Supplementary Material). Figure 3b shows the calibration method by considering the known length of the black tape, which is 0.018 m. The use of the high-speed camera enables the observation of the deformation of the mouthguard and the hockey ball separately. This allows a better understanding of the interaction between hockey ball and mouthguard material performance during impact. It is believed that the high-speed camera overcomes the limitation of using a load cell or accelerometer, which would only allow the measuring of the total impact scenario. Yet, in future work, a combination of different measurement methods can be considered.
3.1.3. Data Acquisition Method
High-speed images are the basis of the data analysis. A black point was placed on each mouthguard and the hockey ball before the impact test. The location of the marks was tracked throughout the duration of the impact to calculate the displacement of the ball and mouthguard in each frame. The mouthguard was placed on the aluminium fixture and the marks on the ball and mouthguard that were used to track the deformation are shown in Figure 3b.
Displacement-time data were obtained for each test by tracking the mark on mouthguard and hockey ball. Tracking was performed automatically with a MATLAB script which took each frame of the impact video and determined the position of the mark of the mouthguard and ball. The position of the mark at the beginning of each impact was set to zero so that the distance became the displacement during the impact. The pixel displacement was then translated to a distance in metres by using the small piece of tape on the aluminium mount as a reference distance of 0.018 m. Considering this, the pixel length amounts to 0.000046 m. The script took the impact videos and outputs a graph of displacement against time for the duration of the impact.
Using a spring-damper system, acceleration, force, impulse and energy can be analytically derived for the hockey ball and the mouthguard [21]. The impact can be thought of as a two degrees of freedom spring-mass-damper system. The system is illustrated in Figure 3c, and shows the ball modelled as a spring and damper in parallel attached to the mouthguard which was also modelled as a spring and damper in parallel, attached to a rigid base, representing the aluminium teeth model. Isolating the masses, the force between the ball and the mouthguard during the impact can be obtained using equations of motion for each mass. For simplicity, the force from gravity on the masses was disregarded as it is unlikely to have a substantial effect over such a small distance.
The force F acting on the mouthguard can be calculated considering the equation of motion in the two degree of freedom mass-spring-damper system as
where is the stiffness of the spring component and is calculated with
and is the damping coefficient, which is obtained through
where the indices stand for the hockey ball and the mouthguard, respectively, and is the mass of the relevant object.
The equations utilise the coefficient of restitution, , which was found using the velocity at the end and at the beginning of the impact with
where is the total contact time of the impact. The values of the constants k and c are not the same for each impact test, thus, they are recalculated using the velocity–time data to obtain the coefficient of restitution [22].
To support studying the effect on whether an orodental injury occurs during an impact, different variables were investigated. The first of these variables was the force (F) that the ball exerts on the mouthguard, calculated using Equation (1). From the force, the impulse I during the impact time t can be obtained through
Finally, using the force and displacement (x), the energy experienced by the mouthguard (W) is found using
To verify the method used and the results obtained are correct, the concept of energy conservation was used. It is known that, at the start of the impact, all the energy is contained in the kinetic energy of the drop mass. At the end of the impact, this energy had been transferred into deforming the mouthguard, deforming the ball and the kinetic energy objects as it rebounded; therefore, a conservation of energy equation can be written between the start and the end of the impact as
where is the known energy calculated at the start of the impact at time t = 0 using the drop mass and drop height as shown in Table 4. and are the energies of the mouthguard and hockey ball, respectively, at the end of the impact at time t = , while is the energy that is dissipated in the system during impact due to, i.e., heat. The impact scenario includes the time during loading and unloading (impact and rebound stage).
The mass-spring-damper model allows the calculation of the individual energies experienced by spring and dashpot for the hockey ball and mouthguard. Thus, the energy experienced by the dashpot is equivalent to the dissipated energy in the system. This dissipated energy is obtained using
3.2. Results
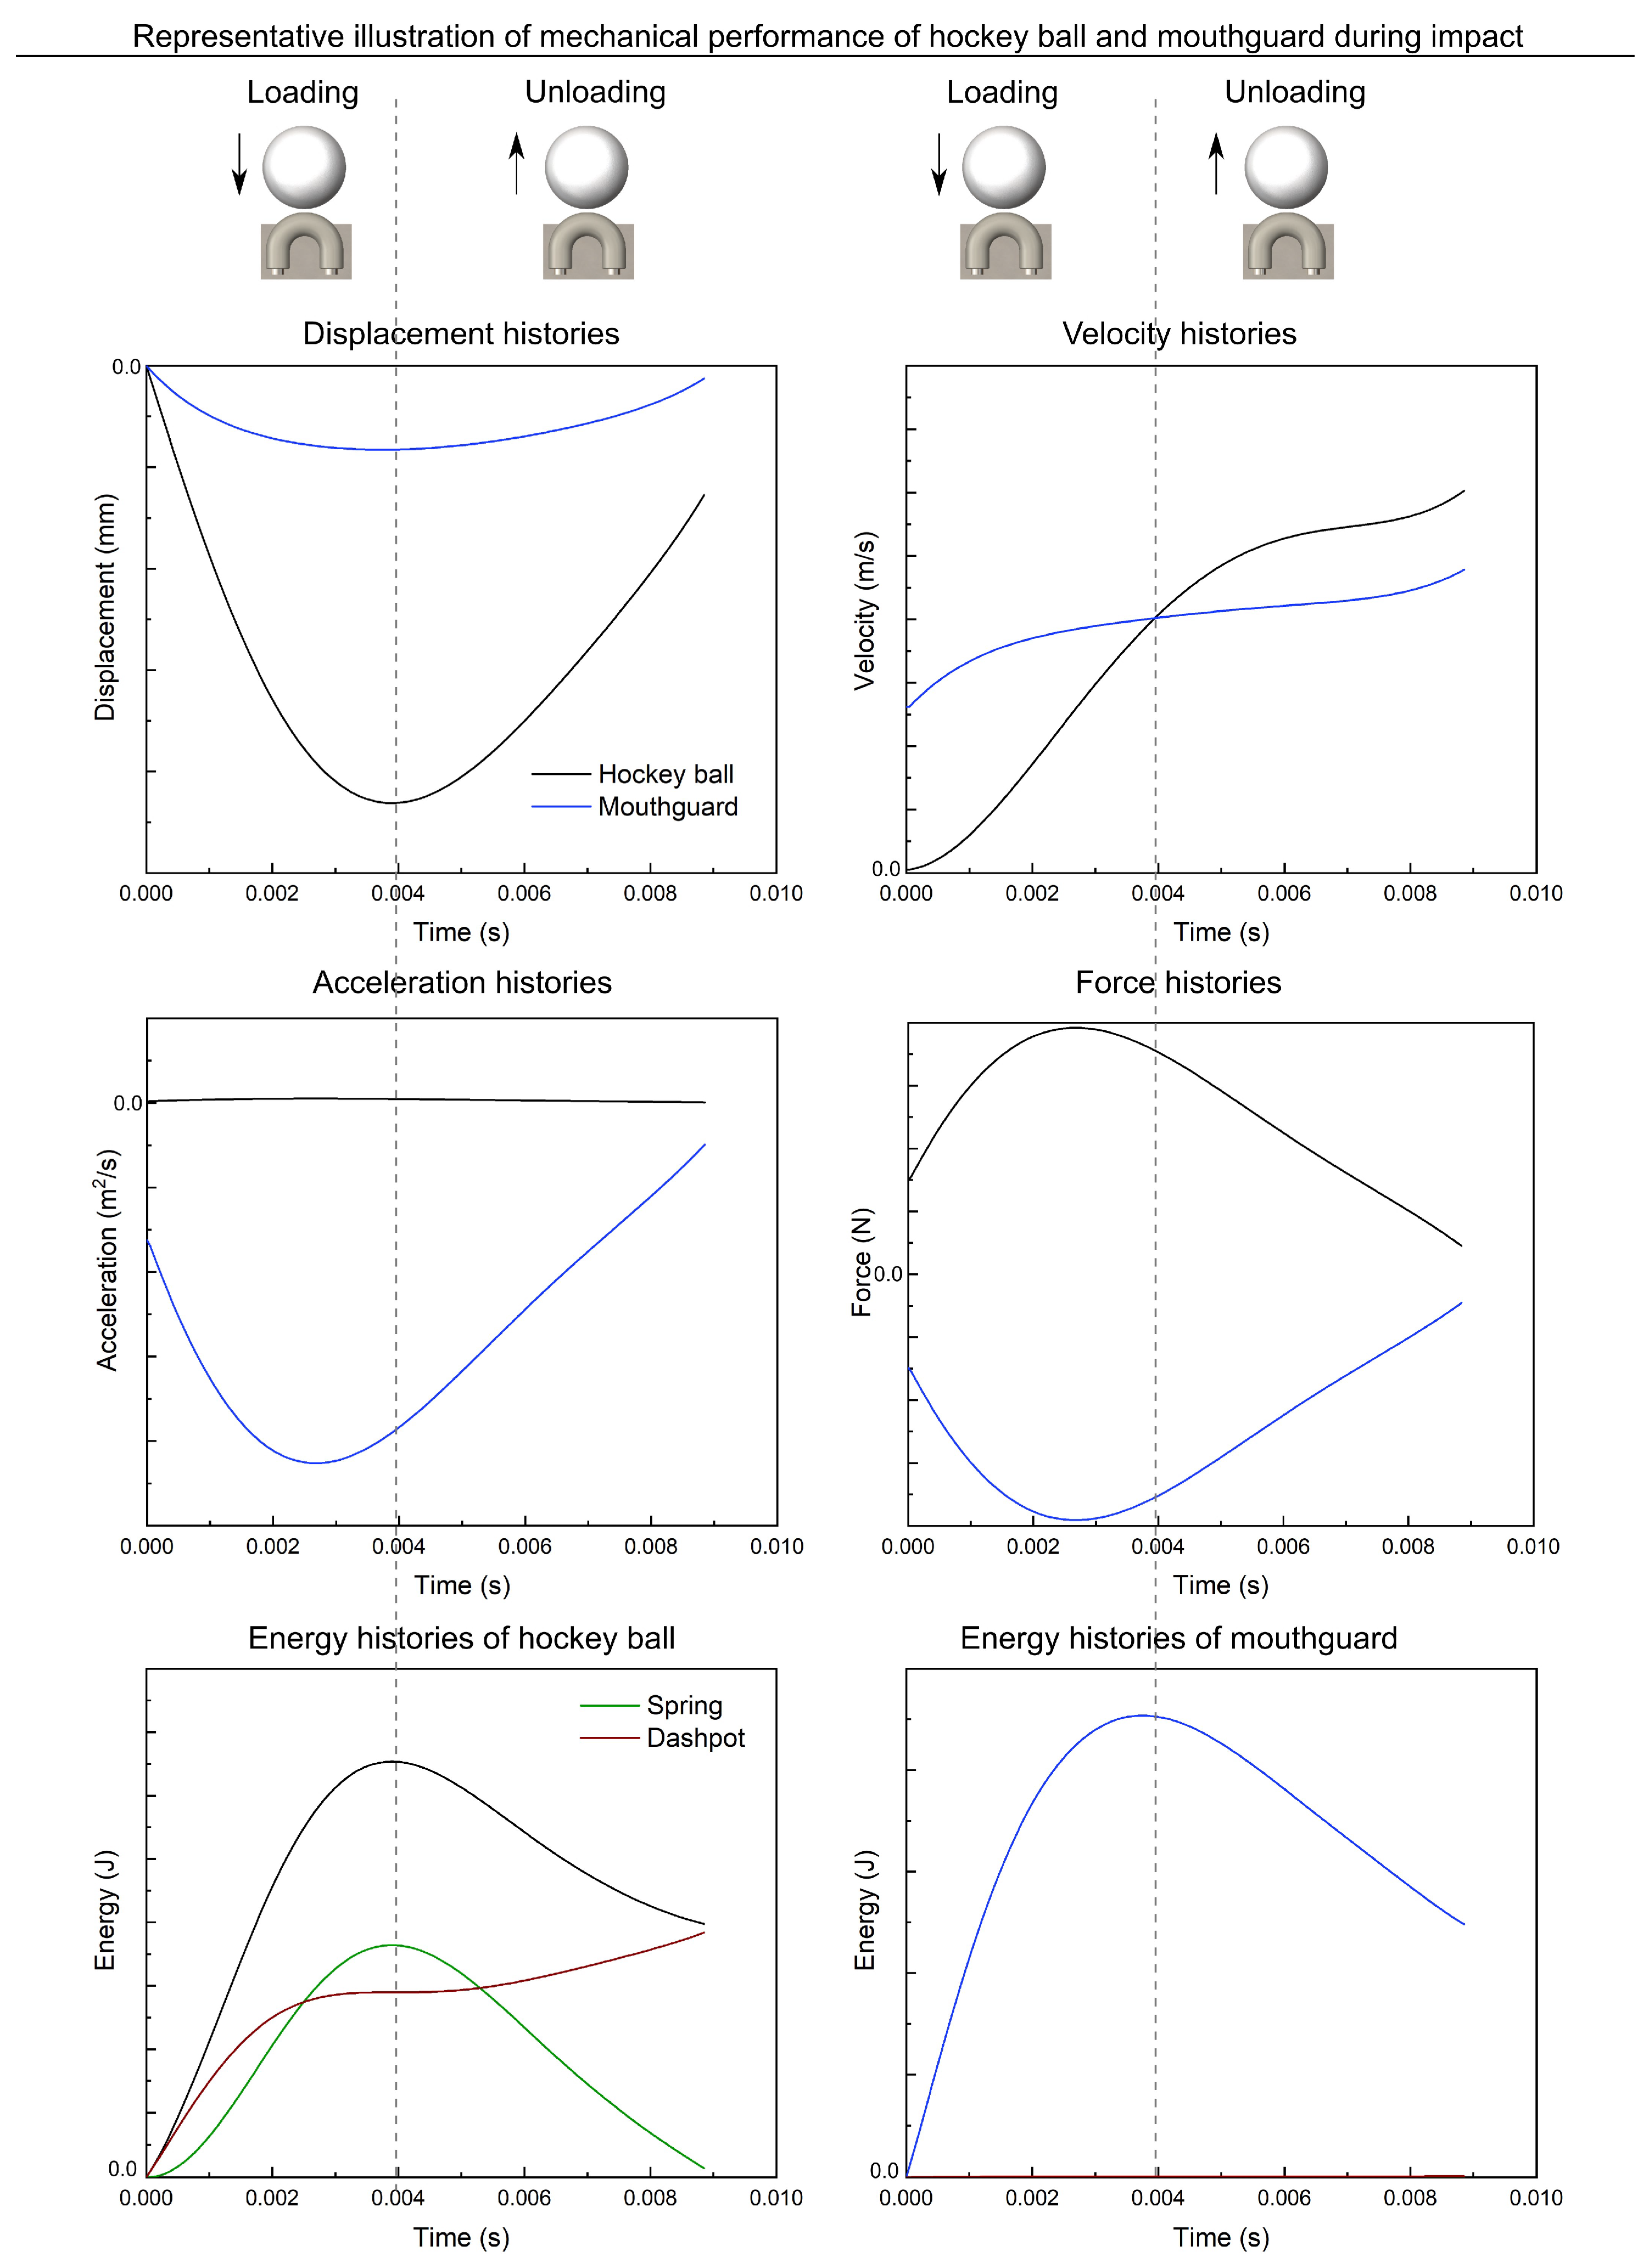
Figure 4 illustrates the calculation sequence from the obtained displacement–time data up to the calculated energy over time information for the whole system. This illustration provides an overview of the calculated mechanical characteristics obtained during impact for the mouthguard and hockey ball separately. Since the mechanical responses, e.g., force and acceleration, changes with the applied impact energies, Figure 4 solely shows representative curves. Figure 5a also provides an image sequence of the hockey ball impacting the mouthguard demonstrating the deformation of mouthguard and hockey ball.
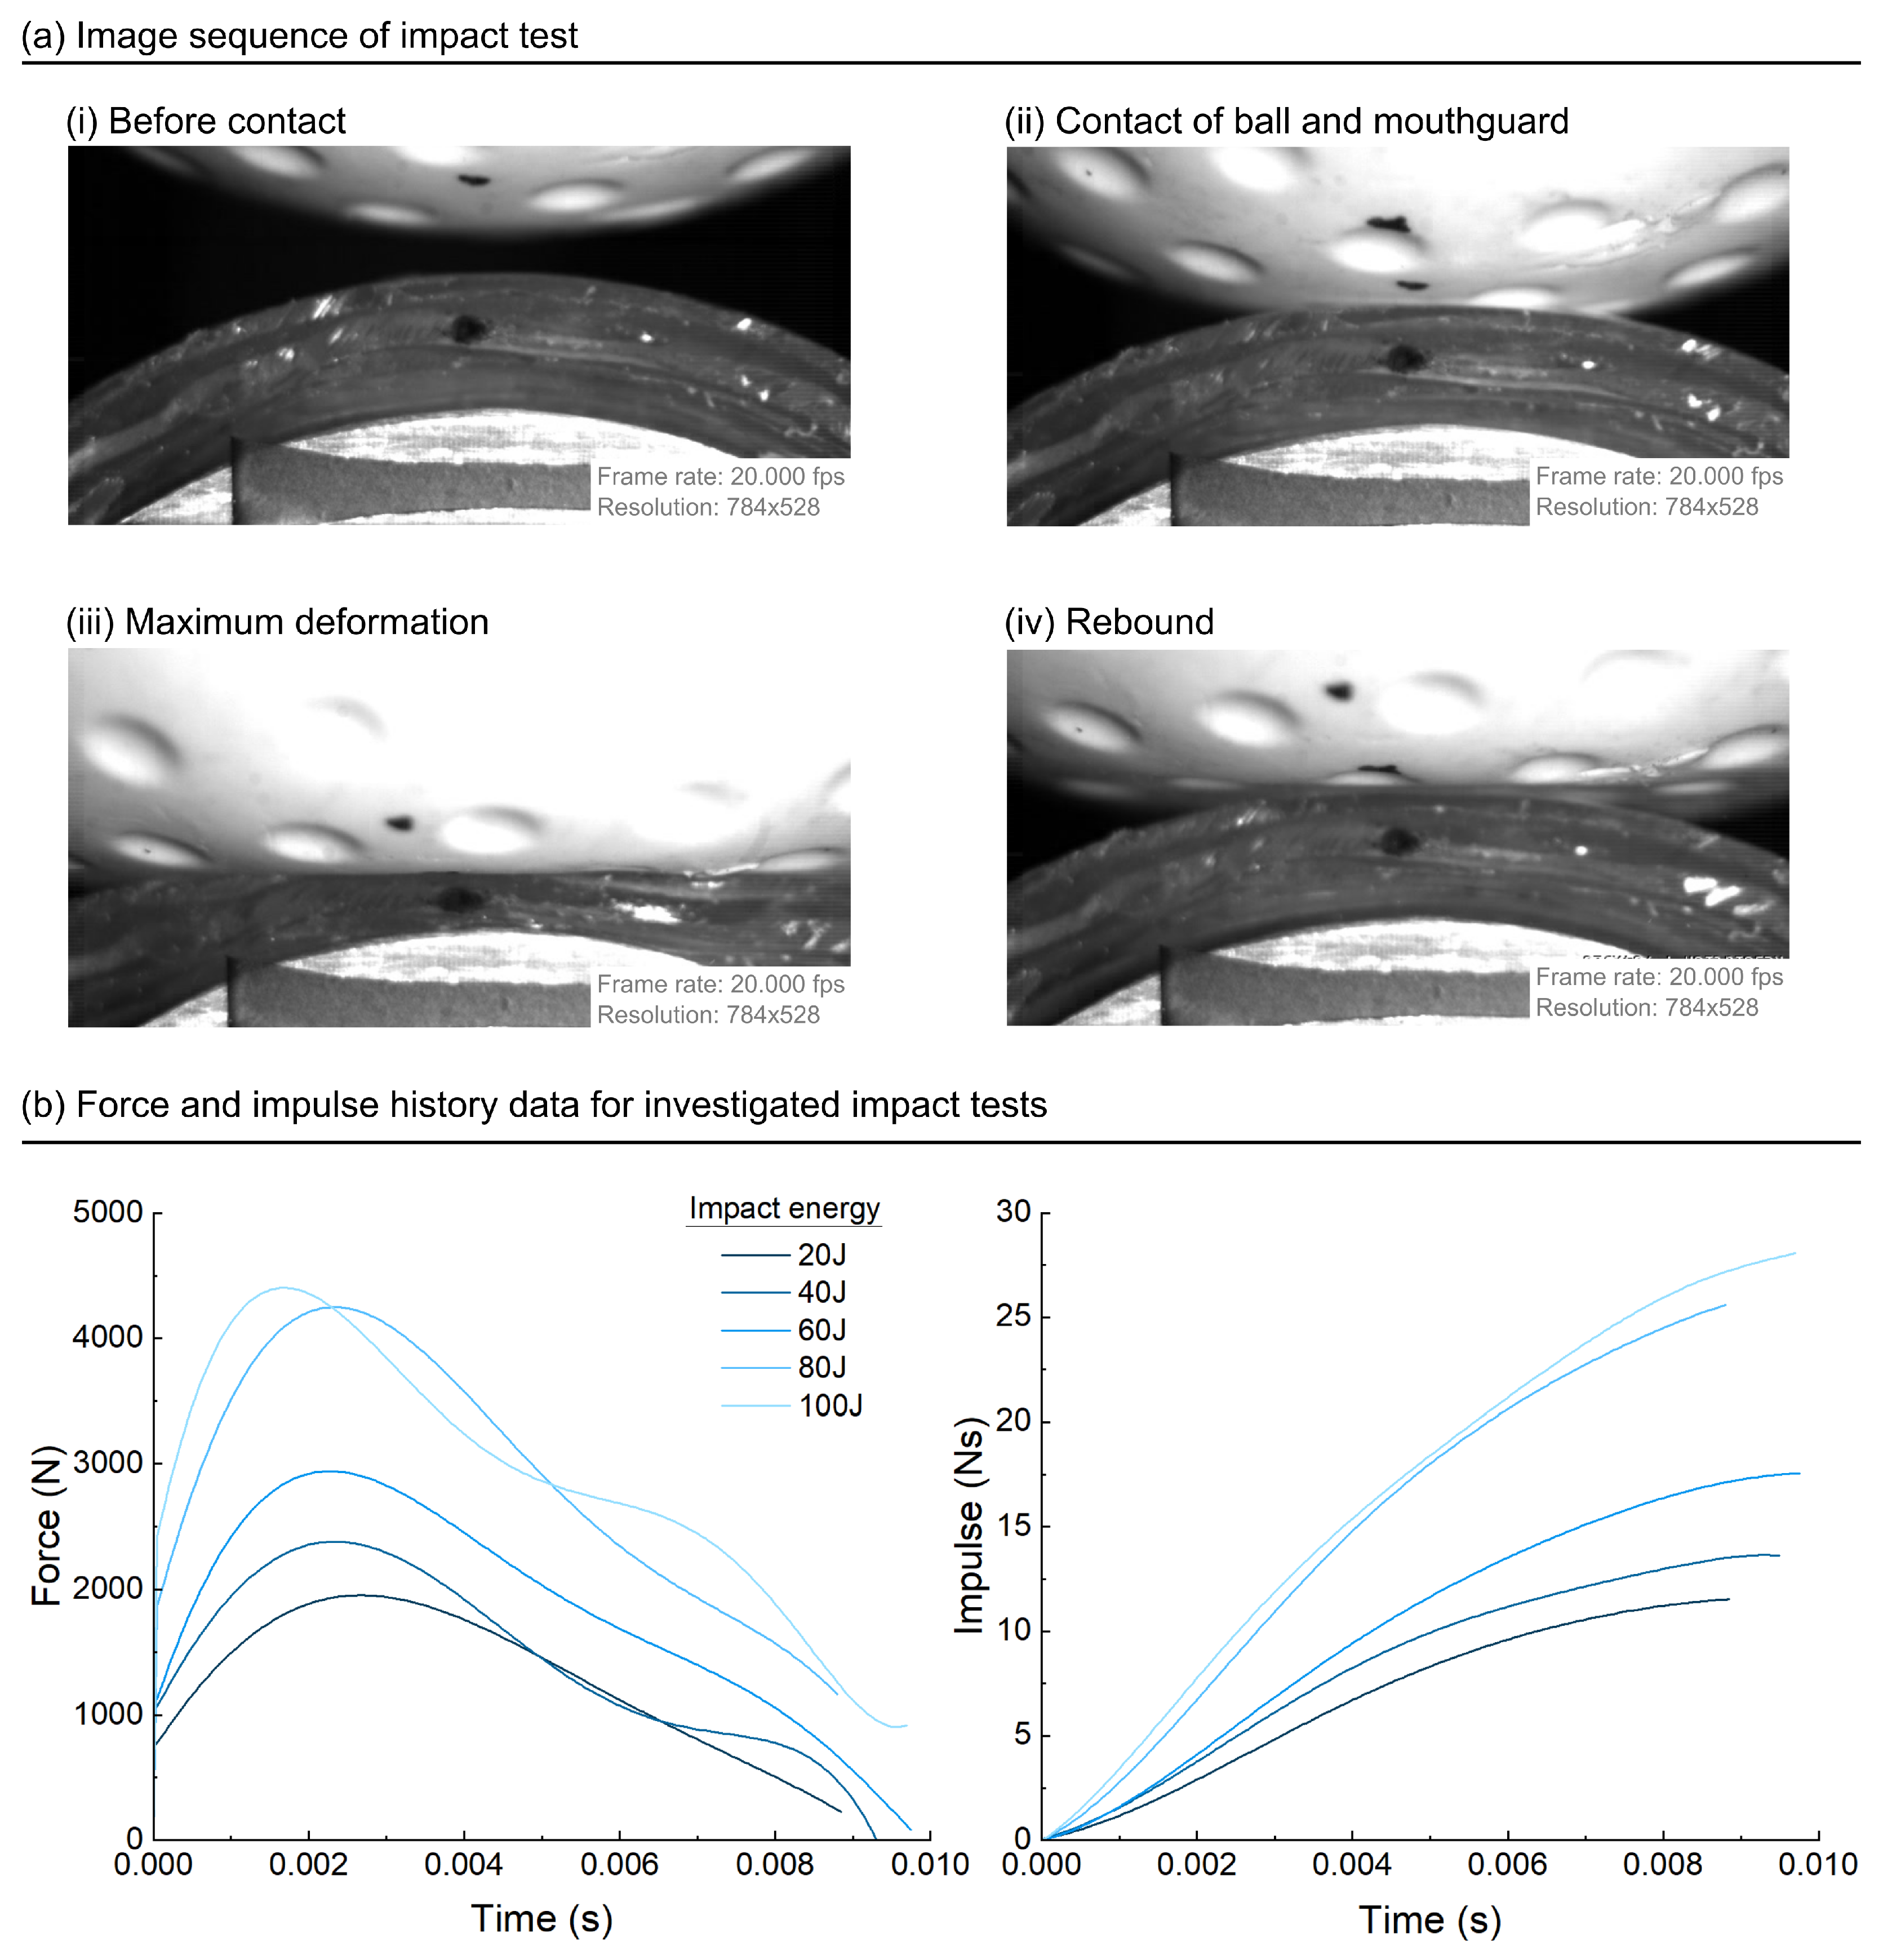
The mechanical responses, such as the resultant force and impulse experienced by the mouthguard, for each impact energy was presented by Figure 5b. The results of the impact tests are summarised in Table 5, which shows the peak force and impulse of each test, corresponding to the maximum values on Figure 5b. Furthermore, Table 5 displays the maximum experienced energy by the mouthguard in each of these tests calculated using Equation (6).
The experimental findings suggest that as the energy of the impact increases, so does the force, impulse and energy in the mouthguard. The graphs suggest that there is an initial quick increase in the force and then a gradual decrease as the ball rebounds.
4. Discussion
The experimental observations were used to quantify the mechanical performance and safety of each mouthguard during impact. Unfortunately, as of April 2021, the legislation that currently governs sports mouthguards is the Personal Protective Equipment (PPE) legislation, which contains three categories of PPE: simple, neither simple nor complex and complex [23]. Sports mouthguards fall under the category of neither simple nor complex PPE equipment, meaning that they must be tested and certified by an independent European notified body.
There is no standard for the testing of prototype mouthguards, thus, it is not possible to quantify the protection of the EVA mouthguard models against any government-set tests. The independent European notified body must ensure their tests cover the necessary requirements of the PPE legislation, normally including various impact tests.
Using the graphs in Figure 4, a more comprehensive analysis of the tests can take place. As described above, there is a lack of a government standards for the testing of mouthguards. The discussion aims, therefore, to verify that the method of impact testing used in this project is correct. In particular, we investigated whether the use of a mass-spring-damper system to model the impact is valid.
The experimental results were used to verify the new method of testing mouthguards at higher-impact energies when compared to the ones tested traditionally. Using the mass-spring-damper system, and Equation (6), the energy in the mouthguard and the ball throughout the impact are calculated. The obtained energy at the end of the impact (before the hockey ball looses contact with the mouthguard) is shown in Table 6 for the mouthguard and hockey ball. As the CR already suggests (1 < CR < 0) shown in Table 5, the impact of hockey ball to mouthguard is an inelastic collision. Thus, some kinetic energy is dissipated due to, i.e., heat.
Figure 6 illustrates the conservation of energy by plotting the energy before impact together with the energy after impact, which takes into account the final energy in the mouthguard, hockey ball and dissipated energy for each impact configuration. There are differences between the values of initial and final energy present in each test, which may be due to inefficiencies in the impact test, leading to imperfect energy transfer between the drop mass, the deformation of the ball and mouthguard. In some tests, the final energy calculated was higher than the initial energy, which is likely to be as a result of errors introduced during the analysis of the data, such as the calculation of the constants in the mass-spring-damper system. Although the final energy calculated is not exactly equal to the initial energy in each impact test, there is a strong agreement between the values, with a mean difference of 12.3% across the five impact tests.
The similarity between the energy in the drop mass at the start of each impact test and the final energy in the system that was calculated using the new method to analyse the impacts suggests that the test method used in this work is a viable new method to test mouthguards at various impact energies. This ability allows an improved understanding of the mechanical performance of mouthguards at impact energies higher than the ones reported in current literature, which amount to maximum 10 J to 20 J. Nevertheless, the method of mounting the mouthguard during the impact tests is unlikely to represent the head movement during an impact. Further investigation to consider the head movement during impact is necessary.
5. Conclusions
This work developed a new method to test mouthguards at impact energies obtained during a performed field study for field hockey.
Before conducting impact testing experiments on the mouthguards, data on the ball speed distribution within field hockey were analysed. Over 85% of 612 shots analysed fell between 20 ms (30 J) and 40 ms (122 J), and the maximum speed was 43.5 ms (145 J). A distribution was created from the data collected and used as a basis to setup the impact test experiments. The first part of this work fills a gap in the current literature for ball speed data in field hockey. As a result, it was found that many impact tests conducted on mouthguards currently correspond to impacts speeds and energies that are far lower than those actually experienced in sports.
Consequently, the second part of this work developed a new method of testing the safety of mouthguards using higher-impact energies than have previously been used. Thermoformed EVA mouthguards were tested and analysed at impact energies up to 100 J. The analysis of the results suggests that the new method described in this project was a reliable way of measuring the force, impulse and energy for the duration of the impact, using a drop tower. Furthermore, a benefit of this study in comparison to previous studies is the use of a high-speed camera to analyse the impact. The high-speed images allowed an understanding into what was happening throughout the impact.
An important benefit that this study has offered to the current literature is that it has found a new way of testing mouthguard models using a drop tower and a high-speed camera. This method can be developed further in the future to better understand the interaction between projectiles and mouthguards during impacts, which can be used to improve mouthguard design.
Finally, this method offers the opportunity to be applied to other sports in which mouthguard protection is of high importance and in which current test methods lack the representation of real-world high impact energies.
Supplementary Materials
The following are available online at https://www.mdpi.com/article/10.3390/app12073449/s1.
Author Contributions
T.G., M.L. and D.T. conducted the experiments, T.G., M.L. and D.T. analysed the results, T.G., M.L. and D.T. writing—original draft preparation, T.G., M.L., D.T., N.P. and J.B. writing—review and editing. All authors have read and agreed to the published version of the manuscript.
Funding
This research received no external funding.
Institutional Review Board Statement
This study was reviewed by the Medical Science Institutional Research Ethics Committee (reference: R80499/RE001).
Informed Consent Statement
Not applicable.
Data Availability Statement
Available from the second author upon reasonable request.
Acknowledgments
The authors are grateful to the Stuart Carter for manufacturing the mouthguard fixture and drop-tower holder.
Conflicts of Interest
The authors declare no conflict of interest.
References
- Cicek, T.; Dhamo, B.; Wolvius, E.B.; Wesselink, P.R.; Kragt, L. Effectiveness of the new mandatory mouthguard use and orodental injuries in Dutch field hockey. Phys. Sportsmed. 2021, 49, 455–462. [Google Scholar] [CrossRef] [PubMed]
- Theilen, T.M.; Mueller-Eising, W.; Bettink, P.W.; Rolle, U. Injury data of major international field hockey tournaments. Br. J. Sports Med. 2016, 50, 657–660. [Google Scholar] [CrossRef] [Green Version]
- Knapik, J.J.; Hoedebecke, B.L.; Rogers, G.G.; Sharp, M.A.; Marshall, S.W. Effectiveness of Mouthguards for the Prevention of Orofacial Injuries and Concussions in Sports: Systematic Review and Meta-Analysis. Sport. Med. 2019, 49, 1217–1232. [Google Scholar] [CrossRef]
- States News Service. HockeyTracker: How Fast Can They Go; States News Service: Boston, MA, USA, 2014. [Google Scholar]
- Willmott, A. The Dynamics of the Stick Motion in the Field Hockey Hit; UMI, ProQuest Dissertations Publication: Bethesda, MD, USA, 2010. [Google Scholar]
- Elliott, B.C.; Chivers, L. A three dimensional cinematographic analysis of the penalty corner hit in field hockey. In Biomechanics XI-B; de Groot, G., Hollander, A., Huijing, P., van Ingen Schenau, G., Eds.; Free University Press: Amsterdam, The Netherlands, 1987; pp. 791–797. [Google Scholar]
- Warnet, L.; Greasley, A. Transient forces generated by projectiles on variable quality mouthguards monitored by instrumented impact testing. Br. J. Sports Med. 2001, 35, 257–262. [Google Scholar] [CrossRef] [PubMed] [Green Version]
- Greasley, A.; Karet, B. Towards the development of a standard test procedure for mouthguard assessment. Br. J. Sports Med. 1997, 31, 31–35. [Google Scholar] [CrossRef] [PubMed] [Green Version]
- Greasley, A.; Imlach, G.; Karet, B. Application of a standard test to the in vitro performance of mouthguards. Br. J. Sports Med. 1998, 32, 17–19. [Google Scholar] [CrossRef] [Green Version]
- Kessler, A. Design and Testing of Novel Mouthguard with Intermediate Nitinol and Foam Layers; University Library, University of Nevada: Las Vegas, NV, USA, 2013. [Google Scholar]
- Bochnig, M.S.; Oh, M.J.; Nagel, T.; Ziegler, F.; Jost-Brinkmann, P.G. Comparison of the shock absorption capacities of different mouthguards. Dent. Traumatol. 2017, 33, 205–213. [Google Scholar] [CrossRef] [PubMed]
- Harrington, C.; Minhas, G.; Papageorgiou, S.N.; Coboume, M.T. What are the differences in protective characteristics of orthodontic mouthguards? An in vitro study. Europ. J. Orthod. 2021, 44, 95–100. [Google Scholar] [CrossRef] [PubMed]
- Going, R.E.; Loehman, R.E.; Chan, M.S. Mouthguard materials: Their physical and mechanical properties. J. Am. Dent. Assoc. 1974, 89, 132–138. [Google Scholar] [CrossRef] [PubMed]
- Tran, D.; Cooke, M.S.; Newsome, P.R.H. Laboratory evaluation of mouthguard material. Dent. Traumatol. 2001, 17, 260–265. [Google Scholar] [CrossRef] [PubMed]
- Craig, R.G.; Godwin, W.C. Properties of athletic mouth protectors and materials. J. Oral Rehabil. 2002, 29, 146–150. [Google Scholar] [CrossRef] [PubMed]
- Wilkinson, E.E.; Powers, J.M. Properties of custom-made mouth-protector materials. Phys. Sportsmed. 1986, 89, 132–138. [Google Scholar] [CrossRef] [PubMed]
- Auroy, P.; Duchatelard, P.; Zmantar, N.E.; Hennequin, M. Hardness and shock absorption of silicone rubber for mouth guards. J. Prosthet. Dent. 1996, 74, 463–471. [Google Scholar] [CrossRef]
- Jagger, R.; Milward, P.; Waters, M. Properties of an Experimental Mouthguard Material. Int. J. Prosthodont. 2000, 13, 416–419. [Google Scholar] [PubMed]
- Westerman, B.; Stringfellow, P.M.; Eccleston, J.A. EVA mouthguards: How thick should they be? Dent. Traumatol. 2002, 18, 24–27. [Google Scholar] [CrossRef] [PubMed]
- Lawn, B.R.; Lee, J.J.W.; Chai, H. Teeth: Among Nature’s Most Durable Biocomposites. Annu. Rev. Mater. Res. 2010, 40, 55–75. [Google Scholar] [CrossRef]
- Goodwill, S.R.; Haake, S.J. Spring damper model of an impact between a tennis ball and racket. Proc. Inst. Mech. Eng. Part C J. Mech. Eng. Sci. 2001, 215, 1131–1341. [Google Scholar] [CrossRef]
- Nagurka, M.; Shuguang, H. A mass-spring-damper model of a bouncing ball. In Proceedings of the 2004 American Control Conference, Boston, MA, USA, 30 June–2 July 2004; Volume 1, pp. 499–504. [Google Scholar]
- Natt, P.; Rolls-Willson, G. Sports Mouthguards—Complying with PPE Regulations; Dentistry: London, UK, 2021. [Google Scholar]
Figure 1.
Graphical illustration representing (a) field study test setup including player, hockey ball, high-speed camera and board including vertical lines used to measure the ball speed and (b) calculation method of the ball speed considering the parallax error.
Figure 1.
Graphical illustration representing (a) field study test setup including player, hockey ball, high-speed camera and board including vertical lines used to measure the ball speed and (b) calculation method of the ball speed considering the parallax error.

Figure 2.
Demonstration of (a) beeswarm plot showing all shots from 3.2 m and (b) distribution of obtained ball speeds taken from 3.2 and 4.8 m distance to the board and the corresponding impact energies.
Figure 2.
Demonstration of (a) beeswarm plot showing all shots from 3.2 m and (b) distribution of obtained ball speeds taken from 3.2 and 4.8 m distance to the board and the corresponding impact energies.

Figure 3.
Overview of the new experimental methodology for studying mouthguard impacts at high impact energies, detailing (a) the dimensions of the mouthguard including the manufactured mouthguard and mouthguard fixture, (b) demonstrating the experimental setup including camera position and high-speed imaging for analysis, and (c) showing the mechanical approach used to analyse the hockey ball mouthguard impact using a 2DOF mass-spring-damper model based on high-speed imaging.

Figure 4.
Representative illustration of the solutions for the 2DOF mass-spring-damper model system during loading and unloading of the mouthguard. The analysis starts when the hockey ball and mouthguard first come into contact and ends when they lose contact, in the following sequence: (1) The displacement histories measured using the high-speed images are used to calculate the corresponding velocity histories for the hockey ball and mouthguard separately. (2) The equation of motion obtained from the 2DOF system is used to calculate the individual accelerations for hockey ball and mouthguard. (3) Then the force is calculated considering the acceleration and mass of the ball and mouthguard individually. (4) The energy histories are then calculated from the force histories and the displacement histories for the mouthguard and ball.

Figure 5.
Results of the impact experiments showing (a) high-speed images of the impact sequence of hockey ball on mouthguard and (b) the force and impulse histories of the hockey ball–mouthguard impact tests for different impact energies.
Figure 5.
Results of the impact experiments showing (a) high-speed images of the impact sequence of hockey ball on mouthguard and (b) the force and impulse histories of the hockey ball–mouthguard impact tests for different impact energies.

Figure 6.
Comparison of the energy before impact and after to demonstrate energy conservation.


Table 1.
Mean and standard deviation (ms) of each data set including the total values across the total number of people.
Table 1.
Mean and standard deviation (ms) of each data set including the total values across the total number of people.
| Distance | Players | Total | ||||||||
|---|---|---|---|---|---|---|---|---|---|---|
| 1 | 2 | 3 | 4 | 5 | 6 | 7 | 8 | |||
| Mean | 3.2 m | 30.29 | 27.28 | 30.55 | 27.21 | 27.14 | 25.53 | 30.35 | 29.86 | 28.49 |
| speed | 4.8 m | 23.15 | 27.23 | 23.77 | 20.73 | 27.90 | 20.70 | 25.64 | 24.93 | 24.21 |
| Standard | 3.2 m | 6.25 | 7.09 | 6.67 | 6.60 | 7.04 | 6.76 | 6.06 | 6.96 | 6.89 |
| deviation | 4.8 m | 4.97 | 5.56 | 5.16 | 5.27 | 5.76 | 5.11 | 6.01 | 3.00 | 5.71 |
Table 2.
Comparison of hardness and Young’s modulus for enamel and aluminium [20].
Table 2.
Comparison of hardness and Young’s modulus for enamel and aluminium [20].
| Material | Young’s Modulus (GPa) | Hardness (GPa) |
|---|---|---|
| Enamel | 95 | 3.5 |
| Aluminium | 72 | 1.5 |
Table 3.
Measured mean thickness for each mouthguard.
| Mouthguard | Test 20 J | Test 40 J | Test 60 J | Test 70 J | Test 100 J |
|---|---|---|---|---|---|
| Mean thickness (mm) | 4.97 | 4.88 | 4.88 | 4.84 | 4.80 |
Table 4.
Overview of experiments specifications to obtain the different impact energies.
| Parameter | Test 20 J | Test 40 J | Test 60 J | Test 80 J | Test 100 J |
|---|---|---|---|---|---|
| Mass (kg) | 1.94 | 1.94 | 1.94 | 1.94 | 1.94 |
| Drop height (m) | 1.05 | 2.10 | 3.15 | 4.21 | 5.26 |
Table 5.
Overview of the obtained maximum force, impulse and energy depending on the impact energy for the mouthguard.
Table 5.
Overview of the obtained maximum force, impulse and energy depending on the impact energy for the mouthguard.
| Parameter | Test 20 J | Test 40 J | Test 60 J | Test 80 J | Test 100 J |
|---|---|---|---|---|---|
| Peak force (N) | 1954.3 | 2378.6 | 2940.2 | 4253.8 | 4394.2 |
| Impulse (Ns) | 11.5 | 13.6 | 17.5 | 25.7 | 27.9 |
| Energy in mouthguard (J) | 2.27 | 4.2 | 10.05 | 11.57 | 21.57 |
| Coefficient of restitution | 0.51 | 0.41 | 0.48 | 0.41 | 0.39 |
Table 6.
Overview of the energy at the end of the impact for hockey ball and mouthguard.
| Parameter | Test 20 J | Test 40 J | Test 60 J | Test 80 J | Test 100 J |
|---|---|---|---|---|---|
| Energy hockey ball (J) | 7.95 | 14.6 | 24.96 | 40.02 | 61.01 |
| Energy mouthguard (J) | 1.24 | 2.52 | 5.63 | 6.72 | 10.1 |
Publisher’s Note: MDPI stays neutral with regard to jurisdictional claims in published maps and institutional affiliations. |
© 2022 by the authors. Licensee MDPI, Basel, Switzerland. This article is an open access article distributed under the terms and conditions of the Creative Commons Attribution (CC BY) license (https://creativecommons.org/licenses/by/4.0/).
Share and Cite
MDPI and ACS Style
Goldberg, T.; Lißner, M.; Townsend, D.; Petrinic, N.; Bergmann, J. A Novel Method for the Mechanical Testing of Sports Mouthguards. Appl. Sci. 2022, 12, 3449. https://doi.org/10.3390/app12073449
AMA Style
Goldberg T, Lißner M, Townsend D, Petrinic N, Bergmann J. A Novel Method for the Mechanical Testing of Sports Mouthguards. Applied Sciences. 2022; 12(7):3449. https://doi.org/10.3390/app12073449
Chicago/Turabian StyleGoldberg, Thomas, Maria Lißner, David Townsend, Nik Petrinic, and Jeroen Bergmann. 2022. "A Novel Method for the Mechanical Testing of Sports Mouthguards" Applied Sciences 12, no. 7: 3449. https://doi.org/10.3390/app12073449
Note that from the first issue of 2016, this journal uses article numbers instead of page numbers. See further details here.