Article

An Investigation of Wood Baseball Bat Durability as a Function of Bat Profile and Slope of Grain Using Finite Element Modeling and Statistical Analysis

Baseball Research Center, Mechanical Engineering, University of Massachusetts Lowell, 1 University Avenue, Lowell, MA 01854, USA
*
Author to whom correspondence should be addressed.
Appl. Sci. 2022, 12(7), 3494; https://doi.org/10.3390/app12073494
Submission received: 30 January 2022 / Revised: 25 March 2022 / Accepted: 26 March 2022 / Published: 30 March 2022
(This article belongs to the Collection Sports Equipment and Materials)

Abstract

:
To counter a perceived increase in multi-piece fracturing of wood baseball bats, Major League Baseball implemented standards to regulate the quality of wood used in the making of professional-grade baseball bats. These specifications included a minimum density as a function of wood species and a standard related to slope of grain (SoG). Following the implementation of these specifications in 2008, there was a 65% reduction in the multi-piece failure rate. It is hypothesized that a further reduction in the breakage rate can be realized through the implementation of regulations on allowable bat profiles. In the current work, a parametric study was conducted to develop a quantitative understanding of the relationship between bat durability (i.e., resistance to breaking), SoG, and bat profile, thereby obtaining data to support or refute the hypothesis. Finite element models of the bat/ball impact of four different popular bat profiles were created using LS-DYNA software. Similarities and differences between bat profiles impacted at two relatively vulnerable axial locations are presented and discussed. Lastly, the respective bat durabilities for all of the profiles were compared using a probability analysis that considers the SoG, impact location, impact velocity, and it predicts an in-service bat durability.

1. Introduction

In the early 2000s hard maple (also known as rock maple and sugar maple) emerged as a popular wood species for baseball bats. Throughout the nineteenth century, northern white ash had been by far the most popular wood species. Many sports have a history of using woods in sporting goods, including yellow birch, European beech and red oak in baseball bats, hickory in golf club shafts, tipuana in polo, ash in hurling sticks and tennis rackets, and willow in cricket bats. Most of these woods were found by trial and error, and limited scholarly research has examined the mechanical characteristics of wood species applied to their use in sporting goods [1,2,3].
As more professional baseball players used maple baseball bats, it was perceived by players and fans that there was a sharp increase in the rate of bats breaking into multiple pieces [4,5,6]. To get the data to support or debunk the perception, Major League Baseball (MLB) authorized the collection of broken bats from games over a portion of the 2008 season [7]. From the bat collection, a high rate of multi-piece failures (MPF) was observed, and it was found that the wood slope of grain (SoG) was a deciding parameter as to whether the bats simply cracked or broke into multiple pieces [8]. Using the SoG observations, a team of wood science experts recommended wood-quality regulations which limited the SoG to be between and inclusive of ±3° [8]. These recommendations also included changing the preferred hitting surface of the maple wood from the edge grain to the face grain, and setting a lower bound of density 0.0245 lb/in3 (0.678 g/cm3) for the maple wood used to make baseball bats [8]. This combination of new regulations resulted in a 65% decrease in the MPF rate per game [9].
From 2008 to the present, much research and work has been performed to develop finite element modeling for durability examination of wood baseball bats. Drane et al. [10] utilized finite element models of the bat–ball impact to correlate to experimental durability results. Ruggiero et al. [11] used finite element modeling to investigate the relationship between wood density and baseball bat durability. Ruggiero et al. [12] developed calibrated finite element models of different bat profiles impacted in lab conditions to experimentally obtained data. Drane et al. [13] and Fortin-Smith et al. [14] utilized the finite element method to predict the relationship between wood baseball bat geometry and durability. Fortin-Smith et al. [15] used finite element modeling software to conduct a parametric study of the bat–ball impact of one popular bat profile made of varying woods to study the effect that SoG has with respect to baseball bat durability. Mechanical properties of the maple wood used in that study were developed experimentally [16]. The work concluded that bats with a positive SoG were more durable than negative SoG bats when impacted at the 14.0 in (35.6 cm) location measured from the barrel end of the bat. When impacted at the 2.0 in (5.1 cm) location, negative SoG bats were found to be more durable than positive SoG bats.
The motivation of this work is to explore potential changes to wood bat durability, and to reduce the MPF rate of wood baseball bats through a quantitative understanding of the relationship between bat durability, bat profile, and SoG. In this work, durability is defined as the relative bat/ball impact speed that results in bat breakage, i.e., the higher the speed required to break the bat, the better the durability. Experimental studies could be performed to understand how SoG is influencing bat durability with respect to different profiles; however, such an approach would be impractical due to the number of bats needed to conduct a sufficiently comprehensive study, the expense of the bats, and the laboratory time needed to do the tests. Alternatively, the finite element method (FEM) is used to model the bat/ball impact collisions that occur in MLB games.
This paper presents the first comprehensive investigation that considers both bat profile and durability for a full range of impact locations, and advances the fundamental understanding of some of the nuances associated with the breaking of wood baseball bats. Before this study, limited proprietary empirical data from broken bats during MLB games [8] and in-lab studies related to SoG were accessible [16]. The prior in-laboratory studies were limited to two impact locations and those experimental results were used to calibrate the finite element models. In the current work, a parametric study of four different bat profiles were conducted to investigate the relationship among bat profile, SoG, and bat durability across a complete range of impact locations along the hitting zone of the bat. Parameters that were varied in this study for each profile included wood bat SoG and ball impact velocity and location. A novel probability analysis approach was used to quantify baseball bat durability using a series of statistical distributions in conjunction with results from the finite element models. The results of this study will be a foundation for the development of future numerical and/or experimental studies related to durability, bat profile, and SoG, which will then be a guide for predicting the durability of other combinations of bat profiles, wood choice, and SoG.

2. Materials and Methods
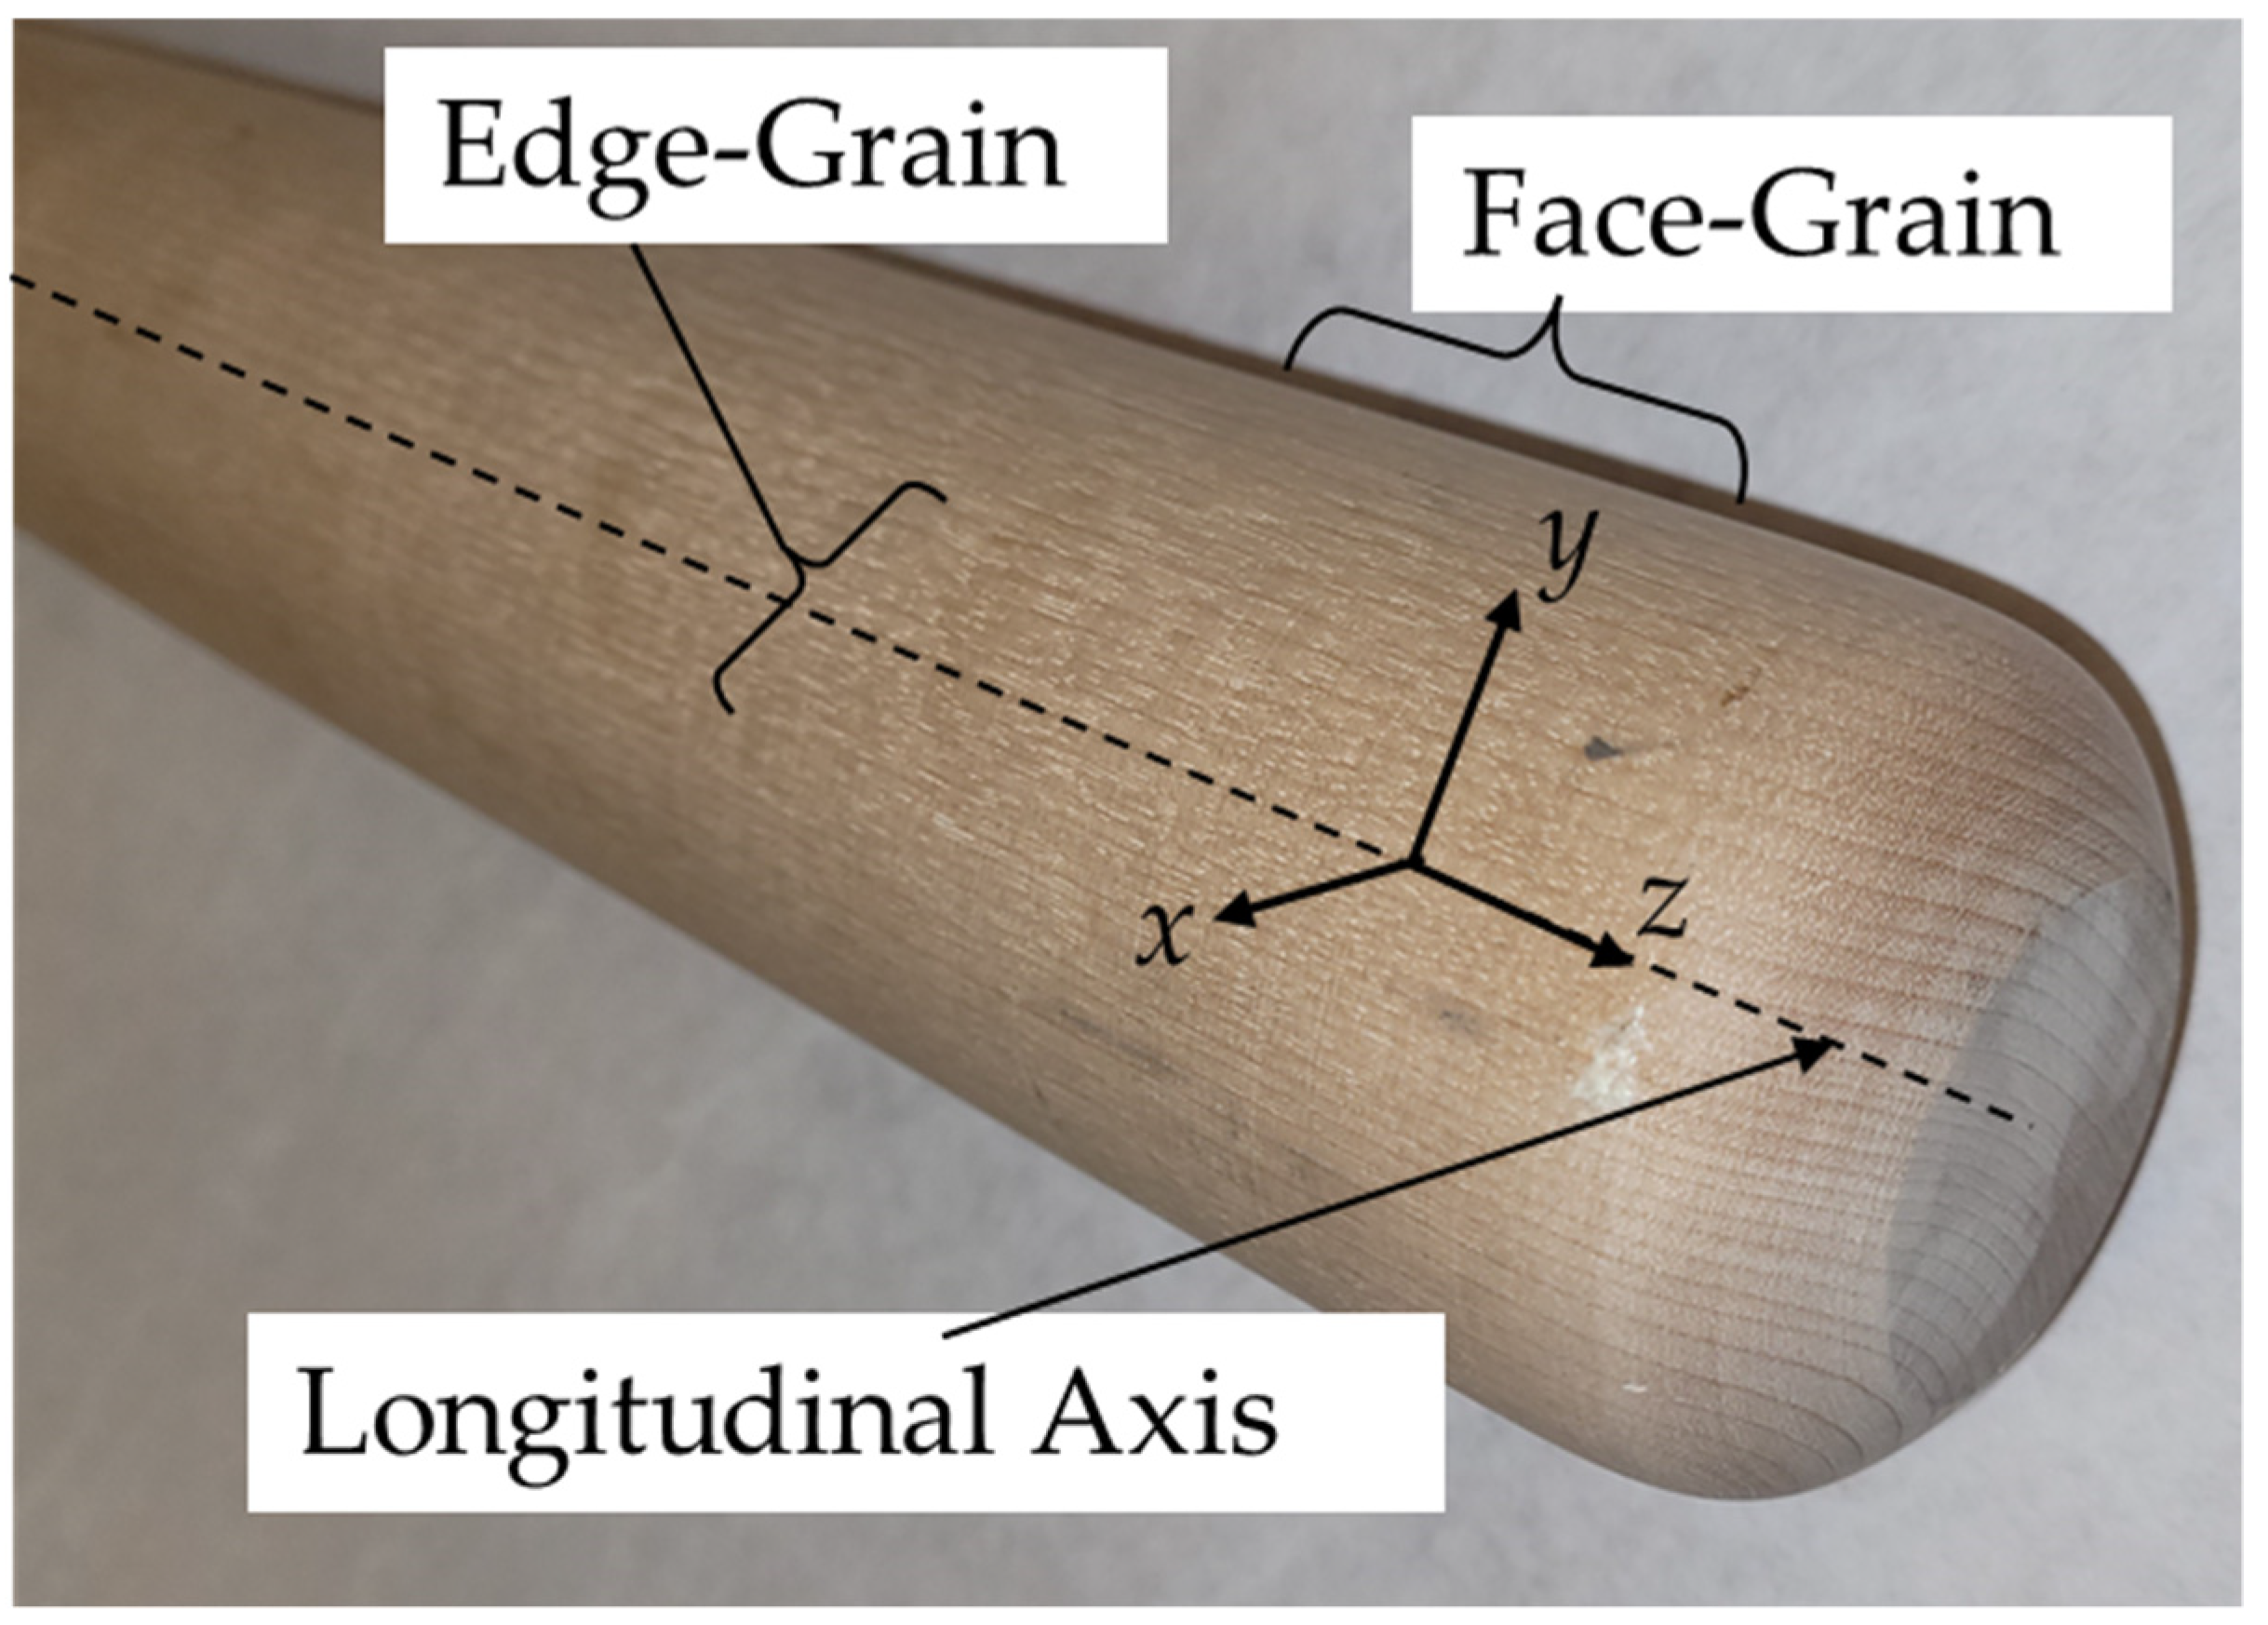
Fundamental to a study of wood baseball bats is a clear understanding of the features of a wood baseball bat. This section includes background information about the maple wood that is modeled, a breakdown of the sections of a baseball bat, and a description of the bat profiles used in this study, as well as their respective differences. Lastly, bat profile is defined as the geometry of the bat.

2.1. Wood

As northern white ash became the wood of choice among MLB players, it was found that hitting on the edge grain was better than hitting on the face grain. In Appendix A, Figure A1 identifies the face-grain and edge-grain surfaces. Due to the ring-porous microstructure of northern white ash [6], the bat would flake (i.e., delamination of the layers of the wood as defined by the growth rings) when impacted on the face grain. The bat is also stiffer when loaded on the edge grain than when loaded on the face grain. Knowing this information, bat manufacturers began to brand their bats on the face grain such that the players only needed to follow the rule of ‘hit the ball with the label facing up or down’. Utilizing this rule would ensure that the player impacted the ball on the edge-grain of the baseball bat. Unlike ash wood, maple has a diffuse porous microstructure [6]. As a result, the face grain surface of the bat is more durable than the edge-grain. In 2008, MLB instructed manufacturers to update their branding location for maple bats to maintain consistency with the ‘hit with the label up or down’ rule, a common rule of practice across both wood species.
The four major regions of the baseball bat and the definition of the positive and negative SoG directions are shown in Figure 1. A bat consists of the knob, handle, taper, and barrel. The knob is a reference point for a player to place their hands and it prevents the bat from slipping from a player’s grip during a swing. The handle is the portion that the player grips. The taper region acts as a transition from the handle to the barrel. Players will swing the bat with the intention of impacting the incoming pitch with the sweet spot of the bat which is typically located about 6.0 in (15.24 cm) from the barrel end of the bat, and has the best performance and durability due to the lack of excitation of bending vibrations within the bat. Depending on player preference, the barrel and handle regions can vary in length and diameter, which creates differences between the respective profiles in the taper region. The SoG measurement is typically made about 12 in (30.48 cm) from the knob end of the bat. This location is used to quantify the SoG because the handle is the smallest cross section on the bat, and thus, one of the more vulnerable locations on the bat to break as a result of a nonzero SoG.

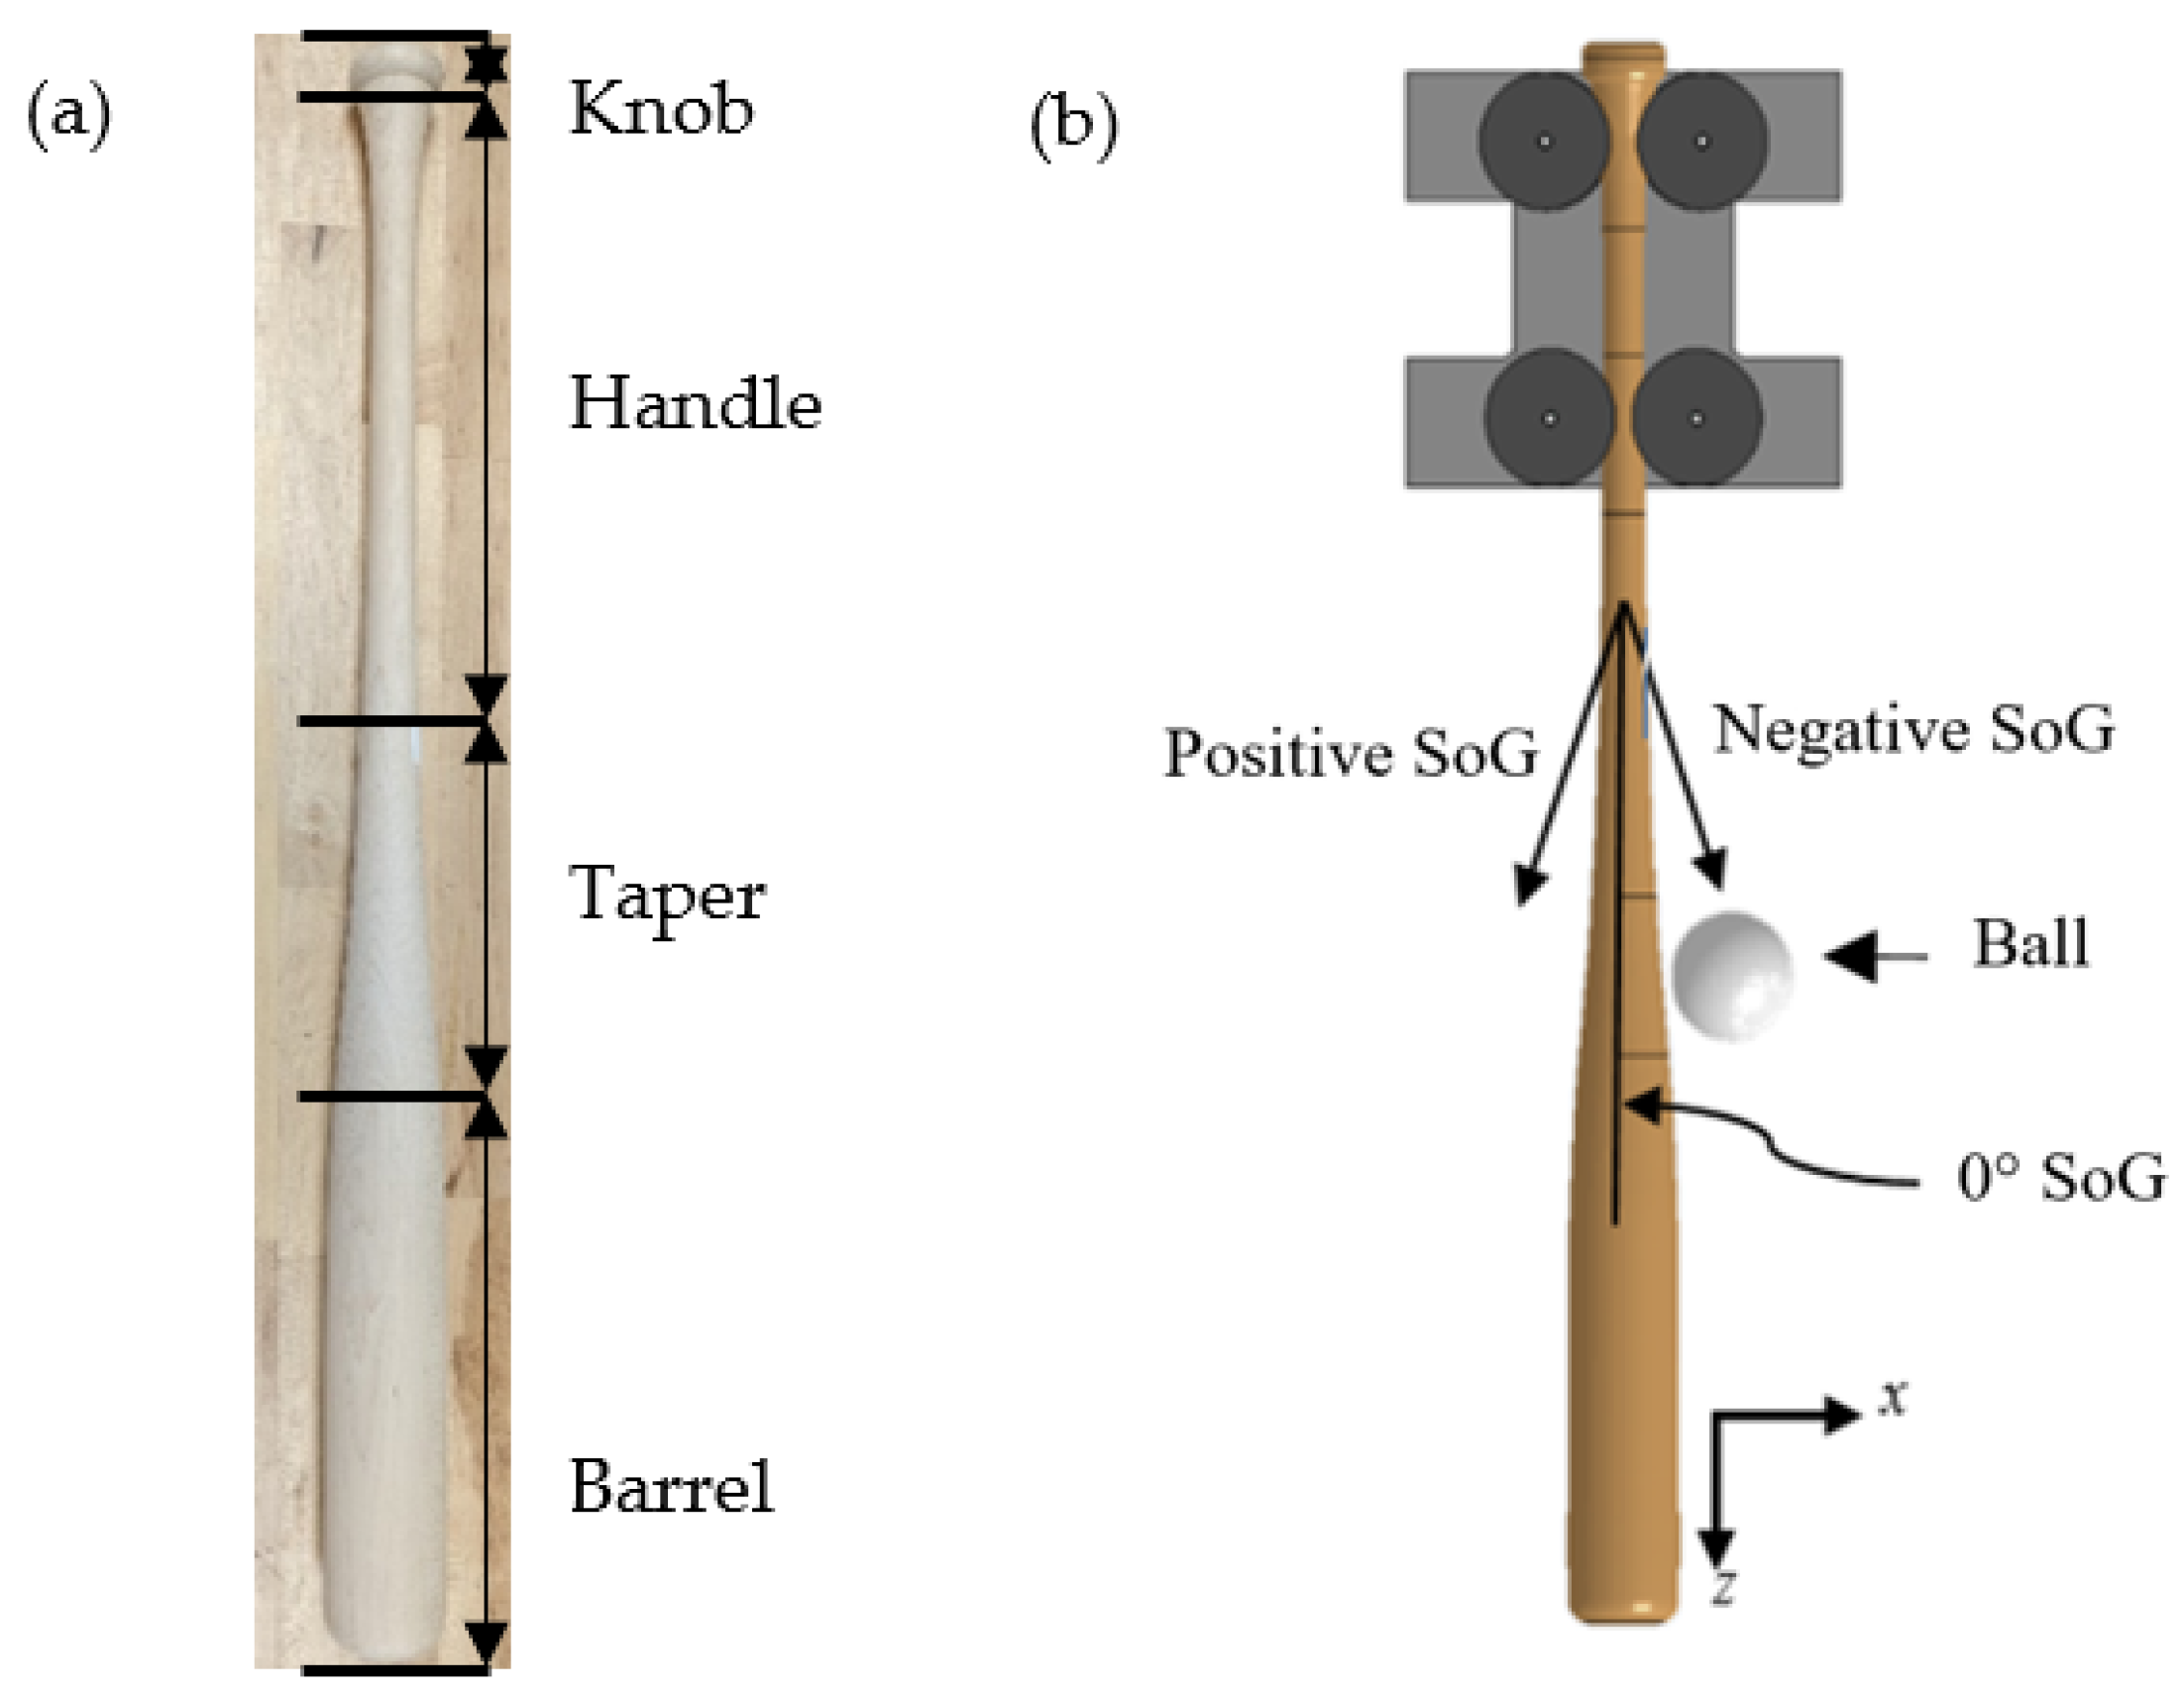
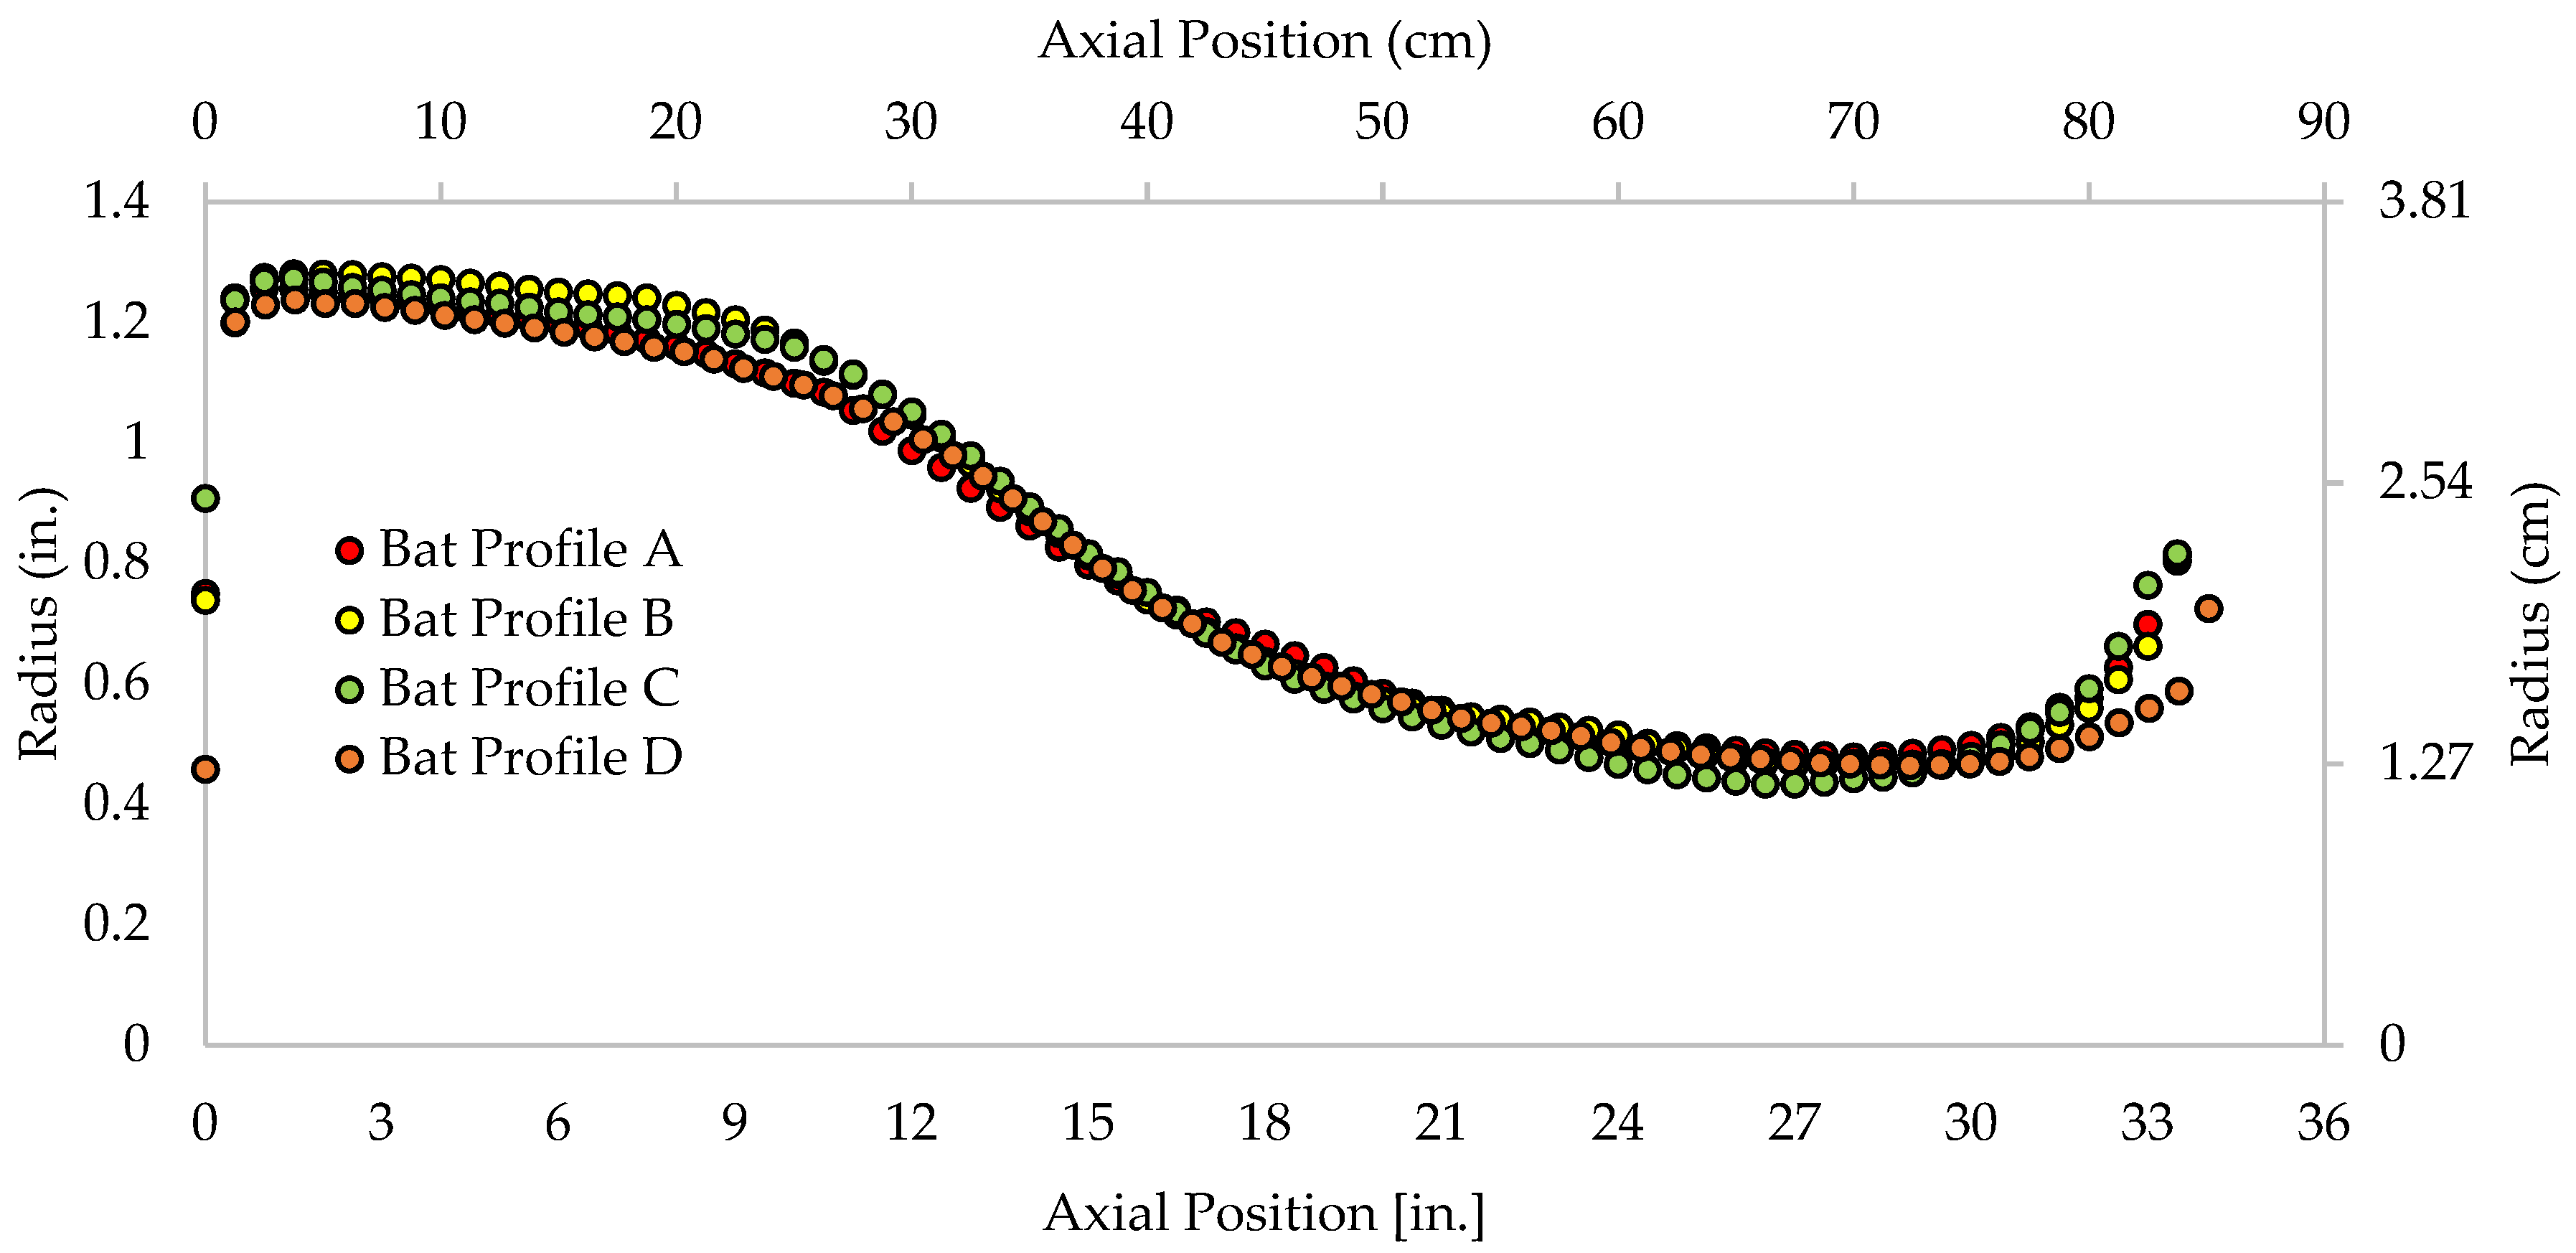
2.2. Baseball Bat Profiles

This study used four popular baseball bat profiles. The identifying names of the bat profiles are not included here to avoid initiating any controversy with respect to the performance of any one bat profile relative to another. Each profile was constrained to have a common 34 in (86.36 cm) length and 31 oz (879 g) weight. Profile data points, with respect to axial positions along the bat, are shared in Figure 2. At first glance, the respective profile differences look subtle; however, propagating these small differences along the entire length of each bat results in different volumes among the bats, and hence, different wood densities to achieve the target mass of 31 oz (879 g). Table 1 compares the volumes of the four bat profiles and their associated densities to have the target mass of 31 oz (879 g). The table also includes nominal maximum and minimum measurements in the barrel and handle regions, a measurement at the 6.0 in (15.2 cm) sweet spot location, and a transition diameter measurement taken at 11.0 in (27.9 cm) from the barrel end of the bat. Bat Profile D has the smallest wood density due to its relatively large volume, whereas Bat Profile A has the largest wood density. This difference in densities is critical, because the strain-to-failure and stiffness properties of wood are known to decrease with deceasing density [16]. The Bat IDs have been arranged by increasing, 11-in, taper-to-barrel transition diameter (as measured from the barrel end of the bat), where Bat profile A is the smallest and Bat Profile D is the largest.

2.3. Finite Element Analysis

The finite element models of the bats were built using HyperMesh (Altair Engineering Inc., Troy, MI, USA) and were analyzed using LS-DYNA R10.0 (Ansys Inc., Canonsbury, PA, USA). All post-processing procedures were completed using LS-PrePost V4.7.0. The profile points in Figure 2 were inputted to HyperMesh as temporary nodes, and a spline was fitted to these points to generate the profile. Using the splines, individual surfaces were defined, and each surface was meshed with quad elements. The two-dimensional mesh was revolved around a center dowel of the bat, resulting in a three-dimensional mesh of brick elements (8-noded brick elements with single Gauss-point integration). To capture an acceptable resolution of bat failure during post processing, the nominal height dimension of the elements was 0.1 in (0.254 cm), and the model had 36 elements around the center line.
The bat–ball impacts were simulated to occur in the Bat Durability System (Automated Design Corporation, Romeoville, IL, USA) at the Baseball Research Center at the University of Massachusetts Lowell. This system approximates an on-field bat/ball collision in a controlled lab environment. It uses two pairs of rollers to simulate a player’s grip and to keep the bat stationary [17]. The top set of rollers firmly holds the knob area of the bat, while the bottom ones loosely touch the bat’s handle. A comparison of a bat tested in the durability system and one of the bat models made using the finite element method is shown in Figure 3. The full model consists of the baseball bat, the roller grips, a rotating back plate, and the baseball. Once the finite element meshes for each of the components were assembled in HyperMesh, the baseball bat model was exported to an LS-DYNA keyword model file, and all analyses were completed. Further details of this modeling framework for baseball bats is presented in Campshure et al. [18]. The finite element models were analyzed over a span of bat/ball impact velocities ranging from 90 to 200 mph (145 to 322 kph) in 5 mph (8 kph) increments. All models represented maple wood over a SoG range of −3° to +3° in 1° increments and the SoG in each case is limited to being uniform over the entire length of the bat.
A LS-DYNA Material Model #143 (*MAT_WOOD) was employed to represent the maple wood species. Previous studies of this material model demonstrated that it can be used as an effective model to simulate wood structures subjected to dynamic loading [19,20]. As shown in Table 1, the bat profiles vary in volume. As a result, the density of the maple wood varies among the profiles to maintain the bats such that they all have the same mass of 31 oz (879 g). Previous empirical testing has allowed for the mechanical and failure properties of the maple wood to be related to density [11,16]. The properties used in the finite element keyword files for the respective bat profiles are shared in Appendix A, in both US customary units (Table A1) and SI units (Table A2). The AOPT option in the *MAT_WOOD material model accommodated the changing of the SoG among the models [21]. To model the wood bat crack initiation and propagation, a strain-to-failure criteria was prescribed in the *MAT_ADD_EROSION material keycard.

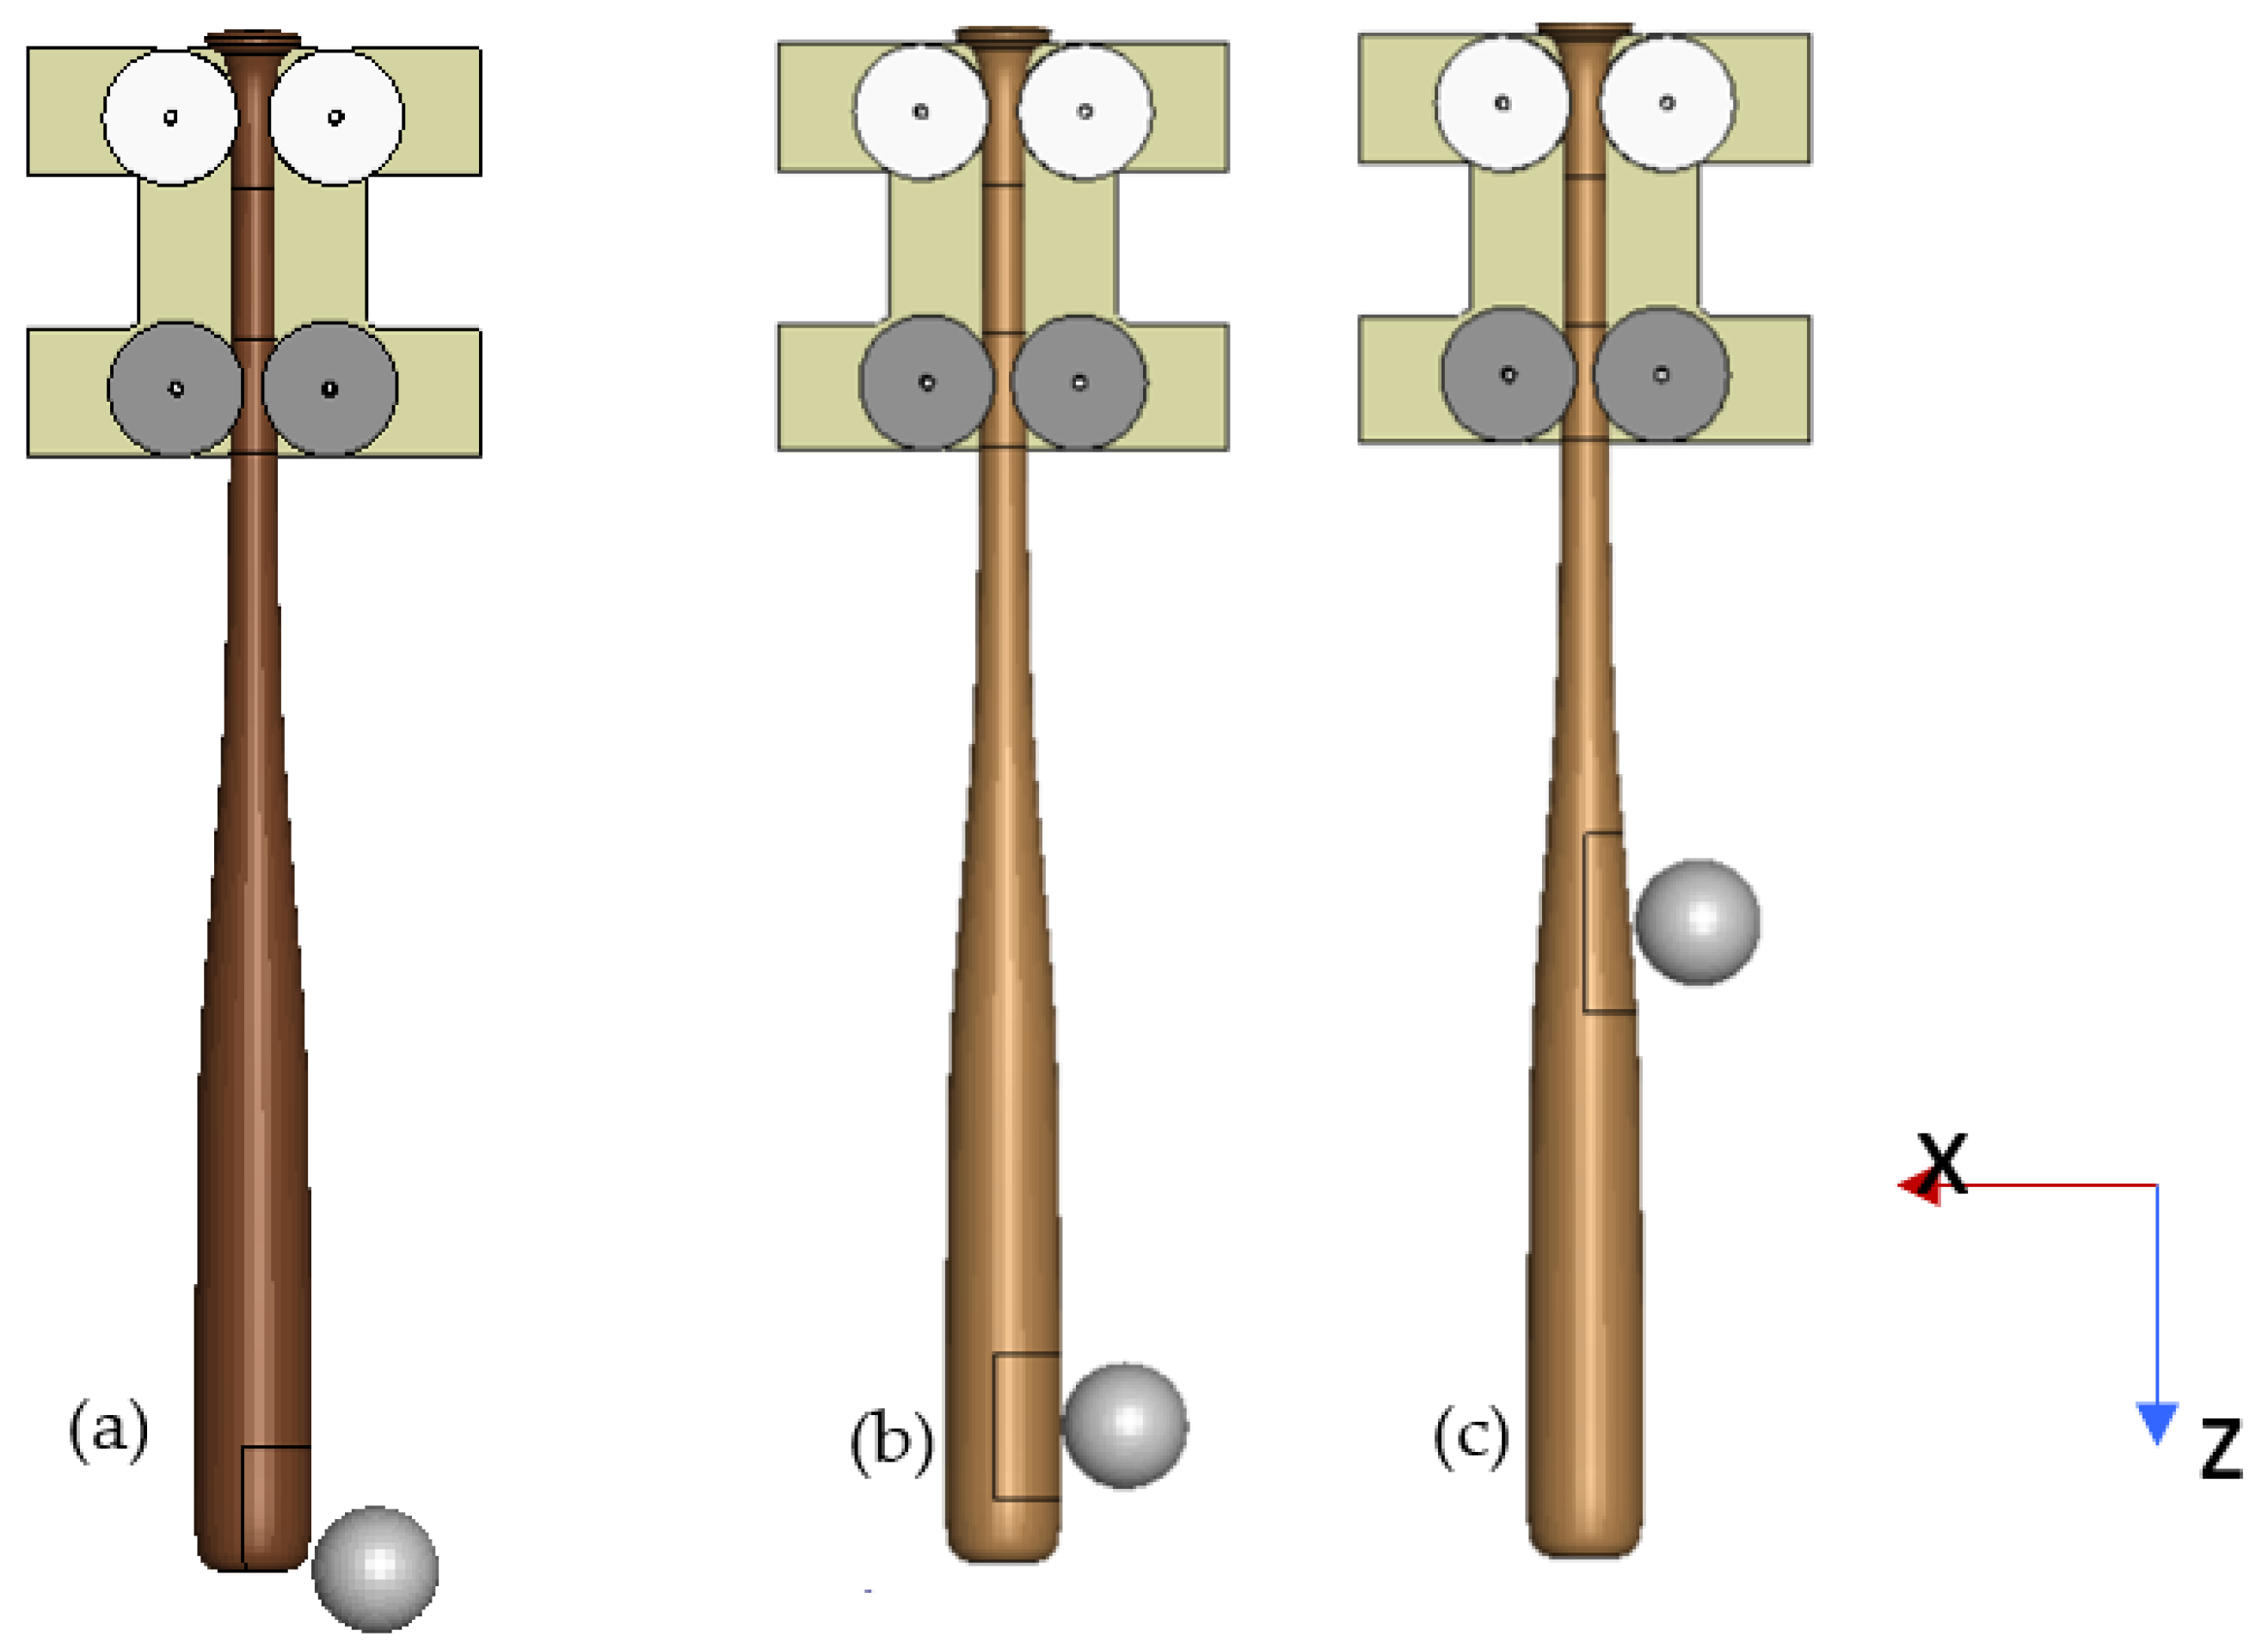
2.4. Impact Locations

Multiple impact locations were examined. All impact locations were measured from the barrel end of the bat. Starting with the ball at the tip of the barrel end of the bat (0 in (0 cm) location), impact locations were translated incrementally by 1 in (2.54 cm) down the length of the bat to the 14.0-in (35.6 cm) location. A snapshot of the 0, 2.0, and 14.0 in (0, 5.1, and 35.6 cm) impact locations are shown in Figure 4. To study the effects of SoG as they relate to baseball bat durability with respect to the profiles, the 2.0 and 14.0 in (5.1 and 35.6 cm) impact locations were analyzed in greater detail than the other impact locations by impacting a wider range of SoG. The 2.0 and 14.0 in (5.1 and 35.6 cm) impact locations are known to be critical locations that lead to MPF of wood baseball bats by creating large amplitudes of vibration along the bat [11]. These impact locations should provide the best insight to understand what combination of parameters leads to bat failure.
Additional analysis was conducted at the 2.0 in (5.1 cm) and 14.0 in (35.6 cm) impact locations as they have become common testing locations for wood baseball bat durability [11]. Supplementary Materials are available in the Study of Expanded Failure Modes for Two Impact Locations presents and discusses additional finite element models and their results at these two locations of interest.

2.5. Wood Failure

Three outcomes were originally anticipated to come out of the finite element models of the bat/ball impacts. The anticipated outcomes were no failure (NF) if the wood does not crack, single-piece failure (SPF) if the bat wood cracks, and multi-piece failure (MPF) if the crack propagates through the entirety of the bat, resulting in two or more large (i.e., at least 1.0 oz (28.35 g)) pieces of wood. Side-by-side comparisons of anticipated failure outcomes of both the finite element models and high-speed camera images are shown in Figure 5.

2.6. Failure Probability Analysis

To develop an analysis for the probability of failure, three assumptions were made related to statistical distribution. The first assumption was related to wood bat SoG. Since MLB implemented an allowable SoG range of ±3°, the wood requires sorting out which pieces of wood are outside of the range. It was assumed that a randomly selected professional-grade bat was equally likely to be any value within the allowable range, which means it can be represented as a uniform distribution. Further, the SoG was assumed to be uniform throughout the length of the bat. The second assumption was a normal distribution related to where the ball impact was located. Impact locations ranged from the 0.0 in (0.0 cm) location (tip of the barrel of the bat) to the 14.0 in (35.56 cm) location (inside-pitch scenario). By assuming a normal distribution where the 7.0 in. (17.78 cm) location is the mean, all data could be symmetrically incorporated into the statistical analysis. It should be noted that it is known that the sweet spot (at or very near to the vibrational node in the barrel) of the bat is located between the 5.5 and 6.0 in. (13.97 and 15.24 cm) locations. However, there are no data available to support that these spots are more likely to be impacted more often than other points on the bat. A distribution of how the impact locations are weighted is shown in Figure 6. The third assumption was that 80–100% of the maximum swing and pitch speed combinations consisted of three standard deviations (3σ, 99.7%) of all impact velocities.
Within this third assumption, there is a 90 mph (145 kph) baseball pitch speed, and a 90 mph (145 kph) linear bat swing speed, at the 2.0 in (5.1 cm) location rotating around a point, measured at 6 in (15.2 cm) from the base of the knob. The study is limited to baseballs with no initial spin. Using the relationship between linear and rotational kinematics in Equation (1), it was assumed that the bat was swung at the same angular speed (of the bat swing), regardless of where the ball impacted the bat,
ω = v r
where ω is the angular velocity, and v is the linear velocity of a point at a distance, r, from the center of rotation. Using this relationship, a linear bat speed was calculated for every impact location down the length of the bat. Using a Z-score and Z-table lookup, the probability was calculated for each of the tested impact velocities. As the resolution of the finite element simulations was 5 mph (8 kph), data points just outside the ±3σ values were included in the analysis, creating a certainty of at least 99.7%. Coupling the changing swing speed with the pitch velocity, with respect to impact location, created a moving combined swing and pitch speed window that accounted for 3σ+ of all possible impact velocities.

2.7. Probability Analysis

In this analysis, each bat profile was evaluated at the two extremes of the MLB allowable SoG range (i.e., +3° and −3°), and with the nominal SoG value of 0°. The bats were impacted at 1.0 in (2.54 cm) increments from the 0 in (0.0 cm) to the 14.0 in (35.6 cm) locations. The velocity range for these impacts ranged from 90–200 mph (145–321 kph), to capture wood failure through the identified 80–100% range of combined swing and pitch speeds. Applying the assumptions outlined in Section 2.6 to the outcomes of the finite element models yielded a single probability value for each finite element modeling outcome for the combination of bat profile and SoG.

3. Results & Discussion

This section shares the results of the analysis of the bat/ball impact finite element models and the resulting data, in order to understand baseball bat durability for the given bat profiles with respect to SoG. Applying the statistical distribution assumptions outlined in Section 2.6, a probability of failure analysis was conducted to compare the profiles and their respective durability. Figure 7 compares the NF, SPF, and MPF probabilities of each bat profile and each tested SoG. Table 2 summarizes the probability of a bat profile not to crack at all (NF), to crack (SPF), or to break completely (MPF).
The NF probability outcome data are shown in the green region of Figure 7. The zero-degree (0°) SoG was found to have the lowest NF% for Bat Profiles A, B, and D, but the highest NF% was for Bat Profile C. The highest mean values from Table 2 suggests that Bat Profile D is the most durable bat. An interesting note related to the NF probability is that there is no difference between the −3° and +3° SoG values for Bat Profiles A, B, or C, which indicates that there is no bias toward either positive or negative slopes of grain for these profiles when considering all impact locations. Bat Profile D shows signs of a bias toward the +3° SoG as it is 3% higher than the −3° SoG.
The SPF results of the finite element models are shown in the yellow regions of Figure 7. Bat Profile C has the largest SPF probability and largest SPF% standard deviation, despite having the lowest NF probability. Bat Profile B also had the largest sensitivity to SoG effects due to a 7% increase in SPF probability between the −3° and 0° SoG, followed by an 11% decrease from 0° to +3° SoG. The large changes lead to Bat Profile B having the largest SPF% standard deviation among the tested SoGs. Bat Profiles A and D were found to be the most insensitive to SoG effects. A final interesting note related to SPF probability is that the +3° SoG region resulted in the lowest SPF outcome likelihood across all profiles.
The results in Figure 7 also provide insight related to MPF bat durability with respect to each profile and SoG. Per Table 2, Bat Profile C had the largest mean MPF probability value followed by Bat Profiles D, A, and B. The nominal mean values suggest that Bat Profiles C and D had the worst MPF durability of the bat profiles studied. Bat Profile C was also found to have the largest standard deviation of the three SoGs modeled, which indicates that it was the most sensitive to SoG of the four tested profiles. Bat Profiles A and D had their largest MPF probability values at the 0° SoG location, whereas Profiles B and C had their largest MPF probability values at the +3° SoG location. For these profiles, a MPF outcome is over twice as likely to occur at the +3° SoG than the other tested slopes of grain.
The finding of Bat Profiles B and C having lower NF% than Bat Profile A correlates well with a proprietary and empirically observed order of relative durability; however, the NF% for Bat Profile D being higher than the NF% values for the rest of the profiles does not appear to correlate at first glance. Historically, Bat Profile D has been known to be a bat profile with poor durability. However, the data presented in Table 2 show that it has the largest probability of NF under the conditions considered here. The trade-off is that even though Bat Profile D is least likely to crack, it is also the second most likely to break into multiple pieces. That high probability may be why it is perceived to have poor durability, as noted in previous observations. Overall, Bat Profile C shows to be the least durable profile. Recall from Figure 7 that Profile C has significant durability differences among the wood SoGs, which indicates that SoG is more influential to this profile’s durability than to the other profiles. Bat Profile B is a good profile in that it has the lowest mean MPF%. Bat Profile A could also be a good profile as it has a relatively high NF% value, and it also has a relatively low MPF% probability. Utilizing the information from the contour plots in the Supplementary Materials, Bat Profile A was also found to have some of the highest maximum threshold velocities regarding SPF and MPF among the modeled profiles. The reasonably good correlation of the finite element results with proprietary data implies that the modeling approach can be used to study the relative durabilities of bat profiles.
All of the data shown in Table 2 are from finite element simulations of the bat/ball impact where the centerline of the baseball and the centerline of the bat were collinear. Intuitively, these types of collisions would be the “worst case” test of bat durability; however, such centerline-to-centerline impacts are rare occurrences in MLB games. It is much more common to see a glancing impact, which results in either a ball hit on the ground (ground ball) or a ball hit high into the air (fly ball/pop-up). The degree of severity of the ground ball or the fly ball depends on how far apart the centerlines of the baseball and bat are at impact. To understand how off-center impacts effect bat durability, finite element models were analyzed where the centerline of the baseball was incrementally translated by factors that were 1/3 of the bat radius at the 2.0 in (5.1 cm) and the 14.0 in (35.6 cm) locations. An illustration of the off-center impact locations is shown in Figure 8. It was based on the finite element model outcomes which state that overall, baseball bat durability generally increased as the baseball impact on the bat moved further away from the centerline of the bat at both locations.
Using the information related to off-centerline impacts and how they affect bat durability, allows for a full characterization of baseball bat durability. As the centerline impact resulted in the least durable bats, the baseball bat collisions that are most likely to result in MPFs are the same centerline collisions that are shared in Table 2. Thus, the information shown in Table 2 is a high estimate of how likely the bat is to break for a given impact speed and location scenario. Fully characterizing the baseball bat durability of one unique bat profile to include the effects of glancing impacts would lead to the creation and analysis of 12,420 finite element models (1 profile × 4 off-center locations × 15 impact locations × 23 impact velocities × 9 SoG), which can open the door for future studies.

4. Conclusions

Four volumetrically different baseball bat profiles were modeled to study the relationship between bat profile, bat durability, and wood SoG of maple wood. A probability analysis was conducted to compare the relative durability of the bat profile that considers wood SoG, ball impact location, and ball impact velocity. From the probability analysis, it was found that Bat Profile D had the highest NF probability, but one of the largest MPF probabilities. Bat Profile C was found to have the highest SPF probability. Considering all impacts, it was determined that Bat Profile A was the most durable profile as it has high NF% values, low MPF% values, and limited SoG effects on bat durability. The reasonably good correlation of the finite element results with proprietary data implies that the modeling approach can be used to study the relative durabilities of bat profiles.

Supplementary Materials

The following supporting information can be downloaded at: https://www.mdpi.com/article/10.3390/app12073494/s1, Study of Expanded Failure Modes for Two Impact Locations.

Author Contributions

B.C.’s author contributions to this research include the construction, running, post processing of finite element models, probability analysis, and writing of this document. J.A.S.’s author contributions include advising, reviewing, and writing the manuscript. P.D.’s author contributions include consulting throughout the analysis, advising, and reviewing the manuscript. All authors have read and agreed to the published version of the manuscript.

Funding

This research received no external funding.

Data Availability Statement

Available Upon Request to the Corresponding Author.

Acknowledgments

The authors extend their gratitude to Al Nathan for his consultation related to the probability analysis, Joshua Fortin-Smith for his initial development of the baseball bat models, and David Kretschmann for providing bat profile information.

Conflicts of Interest

The authors declare no conflict of interest.

Appendix A. LS-DYNA Material Properties Used in Finite Element Modeling

Figure A1. Wood grain identification.
Applsci 12 03494 g0a1
Table A1. Finite Element Model Material Properties in US Customary Units.
Material PropertyLS-DYNA
Material Variable
UnitProfile
A
Profile
B
Profile
C
Profile
D
Volume-in379.784.282.290.4
DensityROlb/in30.02430.02300.02360.0214
Strain-To-FailureMAXEPS-0.02340.02230.02270.0208
Parallel Normal ModulusELpsi2,250,4242,198,5072,220,8802,135,444
Perpendicular Normal ModulusETpsi146,278142,903144,357138,804
Parallel Shear ModulusGLTpsi249,797244,034246,518237,034
Perpendicular Shear ModulusGTRpsi79,66677,82878,62075,596
Poisson’s RatioPR-0.4760.4760.4760.476
Parallel Tensile StrengthXTpsi21,82120,51821,07918,936
Parallel Compressive StrengthXCpsi10,88210,23210,5129443
Perpendicular Tensile StrengthYTpsi2097197220261820
Perpendicular Compressive StrengthYCpsi2043192119741773
Parallel Shear StrengthSXYpsi3238304531282810
Perpendicular Shear StrengthSYZpsi4534426343803937
Table A2. Finite Element Model Material Properties in SI Customary Units.
Material PropertyLS-DYNA
Material Variable
UnitProfile
A
Profile
B
Profile
C
Profile
D
Volume-cm31306.01379.81347.01481.4
DensityROg/cm30.6730.6370.6530.592
Strain-To-FailureMAXEPS-0.02340.02230.02270.0208
Parallel Normal ModulusELMPa15,516.115,158.215,312.414,723.4
Perpendicular Normal ModulusETMPa1008.6985.3995.3957.0
Parallel Shear ModulusGLTMPa1722.31682.61699.71634.3
Perpendicular Shear ModulusGTRMPa549.3536.6542.1521.2
Poisson’s RatioPR-0.4760.4760.4760.476
Parallel Tensile StrengthXTMPa150.5141.5145.3130.6
Parallel Compressive StrengthXCMPa75.070.572.565.1
Perpendicular Tensile StrengthYTMPa14.513.614.012.5
Perpendicular Compressive StrengthYCMPa14.113.213.612.2
Parallel Shear StrengthSXYMPa22.321.025.619.4
Perpendicular Shear StrengthSYZMPa31.329.430.227.1

References

  1. Tinkler-Davies, B.; Ramage, M.H.; Shah, D.U. Replacing willow with bamboo in cricket bats. Proc. Inst. Mech. Eng. Part P J. Sports Eng. Technol. 2021, 17543371211016592. [Google Scholar] [CrossRef]
  2. Fahey, G.J.; Hassett, L.P.; Brádaigh, C.M. Mechanical analysis of equipment for the game of hurling. Sports Eng. 1998, 1, 3–16. [Google Scholar] [CrossRef]
  3. Knowles, S.; Mather, J.; Brooks, R. Cricket Bat design and analysis through impact vibration modelling. In The Engineering of Sport; Balkema: Rotterdam, The Netherlands, 1996; pp. 339–344. [Google Scholar]
  4. Jensen, D. The Timeline History of Baseball; Thunder Bay Press: San Diego, CA, USA, 2020. [Google Scholar]
  5. Guerrieri, V. How Maple Bats Kicked Ash and Conquered Baseball. Deadspin. 28 August 2018. Available online: https://deadspin.com/how-maple-bats-kicked-ash-and-conquered-baseball-1828559282 (accessed on 17 December 2020).
  6. Thompson, A. The Science Behind Breaking Baseball Bats Live Science, Future US, Inc. 15 July 2008. Available online: https://www.livescience.com/2699-science-breaking-baseball-bats.html (accessed on 21 January 2021).
  7. Major League Baseball. Safety and Health Advisory Committee Conducts First Meeting; Major League Baseball: New York, NY, USA, 2008. [Google Scholar]
  8. Major League Baseball. MLB, MLBPA Adopt Recommendations of Safety and Health Advisory Committee; Major League Baseball: New York, NY, USA, 2008. [Google Scholar]
  9. Saraceno, J. Taking a Swing as Safer Bats. USA Today, 15 August 2016. [Google Scholar]
  10. Drane, P.; Sherwood, J.; Colosimo, R.; Kretchmann, D. A study of wood baseball bat breakage. Procedia Eng. 2012, 34, 616–621. [Google Scholar] [CrossRef] [Green Version]
  11. Ruggiero, E.; Sherwood, J.; Drane, P.; Kretschmann, D. An investigation of bat durability by wood species. Procedia Eng. 2012, 34, 427–432. [Google Scholar] [CrossRef] [Green Version]
  12. Ruggiero, E.; Sherwood, J.; Drane, P.; Duffy, M.; Kretschmann, D. Finite Element Modeling of Wood Bat Profiles for Durability. Procedia Eng. 2014, 72, 527–532. [Google Scholar] [CrossRef] [Green Version]
  13. Drane, P.; Fortin-Smith, J.; Sherwood, J.; Kretschmann, D. Predict the Relationship Between Wood Baseball Bat Profile and Durability. Procedia Eng. 2016, 147, 425–430. [Google Scholar] [CrossRef] [Green Version]
  14. Fortin-Smith, J.; Sherwood, J.; Drane, P.; Kretschmann, D. A Finite Element Investigation of the Relationship Between Bat Taper Geometry and Bat Durability. Procedia Eng. 2016, 147, 419–424. [Google Scholar] [CrossRef] [Green Version]
  15. Fortin-Smith, J.; Sherwood, J.; Drane, P.; Ruggiero, E.; Campshure, B.; Kretschmann, D. A Finite Element Investigation into the Effect of Slope of Grain on Wood Baseball Bat Durability. Available online: https://www.mdpi.com/2076-3417/9/18/3733 (accessed on 17 December 2020).
  16. Fortin-Smith, J.; Sherwood, J.; Drane, P.; Kretschmann, D. Characterization of Maple and Ash Material Properties as a Function of Wood Density for Bat/Ball Impact Modeling in LS-DYNA. Procedia Eng. 2016, 147, 413–418. [Google Scholar] [CrossRef] [Green Version]
  17. Drane, P.J.; Sherwood, J.A.; Shaw, R.H. An Experimental Investigation of Baseball Bat Durability. In The Engineering of Sport 6; Moritz, E.F., Haake, S., Eds.; Springer: New York, NY, USA, 2006; pp. 5–10. [Google Scholar]
  18. Campshure, B.; Drane, P.; Sherwood, J. An Investigation of Maple Wood Baseball Bat Durability as a Function of Bat Profile Using LS-DYNA. In Proceedings of the 16th International LS-DYNA Users Conference, 10–11 June 2020; Available online: https://www.dynalook.com/conferences/16th-international-ls-dyna-conference/modeling-t11-1/t11-1-c-modeling-062.pdf (accessed on 21 January 2021).
  19. Trentacoste, M.F. Manual for LS-DYNA Wood Material Model 143; p. 166. Available online: https://rosap.ntl.bts.gov/view/dot/35895/dot_35895_DS1.pdf?download-document-submit=Download (accessed on 21 January 2021).
  20. Marray, Y.D.; Reid, J.D.; Faller, R.K.; Bielenberg, B.W.; Paulsen, T.J. Evaluation of LS-DYNA Wood Material Model 143; Federal Highway Adminstration: Washington, DC, USA, 2005.
  21. LivermoreSoftware Technology (LST). LS-DYNA Keyword User’s Manual. 2020. Available online: https://www.dynasupport.com/manuals/ls-dyna-manuals/ls-dyna_manual_volume_ii_r12.pdf (accessed on 21 January 2021).
Figure 1. (a) Regions of the baseball bat. (b) SoG definition of Finite Element Models [15].
Applsci 12 03494 g001
Figure 2. Bat profile overlay comparison. Bats are symmetrical along their long axis.
Applsci 12 03494 g002
Figure 3. Comparison of (a) bat in ADC Bat Durability System and (b) finite element model of the bat in the ADC system. Note: rectangular box on the bat surface indicates the contact area for impact.
Applsci 12 03494 g003
Figure 4. Ball impacts for the (a) 0.0 in (0 cm), (b) 2.0 in (5.1 cm), and (c) 14.0 in (35.6 cm) locations.
Applsci 12 03494 g004
Figure 5. Finite element model outcomes compared to high-speed video images: (a) NF, (b) SPF, and (c) MPF.
Applsci 12 03494 g005
Figure 6. Probability distribution of ball impact location relative to bat position.
Applsci 12 03494 g006
Figure 7. Probability analysis results of each bat profile by SoG.
Applsci 12 03494 g007
Figure 8. Off-center impacts (a) 0/3R, (b) 1/3R, (c) 2/3R, (d) 3/3R, where R is the radius of the bat.
Applsci 12 03494 g008
Table 1. Bat Profile Measurement Comparison.
ProfileVolumeDensityMin Handle DiameterMax Barrel Diameter6-Inch Sweet Spot Diameter11-Inch Transition Diameter
in3 (cm3)lb/in3 (g/cm3)in. (cm)in. (cm)in. (cm)in. (cm)
A79.7(1306)0.0243(0.673)0.479(1.217)1.257(3.193)1.201(3.051)1.054(2.677)
B84.2(1380)0.0230(0.637)0.465(1.181)1.281(3.254)1.251(3.178)1.112(2.824)
C82.2(1347)0.0236(0.672)0.434(1.102)1.273(3.233)1.218(3.093)1.115(2.832)
D90.4(1481)0.0214(0.592)0.497(1.262)1.326(3.368)1.269(3.223)1.133(2.878)
Table 2. Summarized Probability Analysis Results for Centerline Impacts.
Bat ProfileMean ValuesStandard Deviation
NF%SPF%MPF%NF%SPF%MPF%
A81.514.24.33.11.32.5
B74.121.94.03.45.72.9
C80.013.16.93.13.54.5
D82.910.76.42.20.22.0
Publisher’s Note: MDPI stays neutral with regard to jurisdictional claims in published maps and institutional affiliations.

