
Probabilistic Seismic Safety Assessment of Railway Embankments
by
 ,
,
Mohammadreza Mohammadi
1,
Araliya Mosleh
1,* ,
,
Mehran S. Razzaghi
2,
Pedro Alves Costa
1 and 
Rui Calçada
1 1
CONSTRUCT—LESE, Faculty of Engineering, University of Porto, 4200-465 Porto, Portugal
2
Department of Civil Engineering, Qazvin Branch, Islamic Azad University, Qazvin 3419915195, Iran
*
Author to whom correspondence should be addressed.
Appl. Sci. 2023, 13(1), 598; https://doi.org/10.3390/app13010598
Submission received: 21 November 2022
/
Revised: 15 December 2022
/
Accepted: 28 December 2022
/
Published: 1 January 2023
(This article belongs to the Special Issue Recent Advances in Vehicle-Track-Ground Coupling Dynamics and Railway-Induced Ground Vibration)
Abstract
:The purpose of this research is to study the seismic performance of railway embankments through a probabilistic approach. Nonlinear response history analyses were conducted utilizing PLAXIS software. Three categories of railway embankments were selected and more than 2400 embankment-earthquake case studies were performed. Sensitivity analyses were implemented to obtain the most important variables in the seismic performance of railway embankments. Finally, analytical fragility curves were generated in terms of the mechanical properties of railway embankments (e.g., soil cohesion and friction angle). Fragility functions were developed, employing an incremental dynamic analysis approach using a set of ground motions, including near- and far-field earthquakes. The maximum vertical displacement of the embankment was chosen as a damage index parameter. Fragility curves were derived for three damage states, including slight, moderate and extensive damage, with respect to threshold values proposed in the literature. The results of this study revealed that the mechanical properties of embankments could be considered one of the crucial uncertainty factors in seismic fragility analysis of railway embankments.
1. Introduction
Transportation systems play a significant role in the world’s economy. They may affect economic growth and thus, they can be considered key facilitators of sustainable development [1]. Railways are known as fundamental components of transportation networks [2]. They can provide a safe platform for large-scale transportation of goods and passengers over long distances in reasonable durations [3].
Accordingly, damage to railway infrastructures due to natural hazards (e.g., earthquakes, floods, etc.) may lead to significant consequences [4,5]. Strong ground motions can be considered potential threats to railways. Improper performances of railways during earthquakes revealed that they are seismically vulnerable. For instance, The Izmit earthquake in Turkey in 1999 interrupted rail transportation because of track failure [6]. Following the Niigata Ken Chuetsu earthquake in Japan in 2004, several local train lines were temporarily closed because of track failure [7]. Most Northern Line railway services in New Zealand have been suspended for more than 100 days following the Kaikoura earthquake in 2016 [8]. Earthquake-induced damage to railways can occur in several forms, such as failure of cuts and slopes, damage to infrastructures (such as bridges and tunnels) and track deformation due to fault surface rupture [6,9]. In addition to the aforementioned failure modes, embankment failure is one of the most frequently observed forms of damage following seismic events.
The importance of proper seismic performance for railway systems has highlighted the necessity of assessing the seismic safety of railway structures. Quantifying the potential for damage as a function of earthquake intensity is a substantial requirement for the seismic safety evaluation of a particular structure. Fragility curves relate the probability of reaching or exceeding a certain damage state to the level of seismic hazard. Hence, they can provide an appropriate framework for railway seismic safety assessment [10,11,12].
Several methodologies have been developed to generate fragility curves, i.e., empirical, analytical, expert judgment and hybrid methods [13,14,15]. Several researchers performed empirical fragility curves with respect to post-earthquake damage data and observations. The lack of observed damage surveys on the studied structures for different intensities of seismic loading is the main drawback of this method. Moreover, a rapid fragility-curve estimation can be developed considering expert judgment. In addition to the above two methods, analytical techniques have become more popular because of the recent developments in computer and software capabilities. In other words, they make the analysis of a problem at different boundaries and seismic loading conditions possible. Moreover, when one of the above methods cannot sufficiently cover the entire range of the fragility curve, a hybrid method is used. This method combines two or more of the above methods of fragility analysis.
The seismic behavior of an embankment can be established using several test methods, including the shaking table [16] and dynamic centrifuge test [17]. Although laboratory tests expose the seismic behavior of the embankment, they are costly. Moreover, in some cases, there are some limitations to utilizing full-scale test models because of the capacity and size of the testing apparatuses. Accordingly, employing numerical techniques instead of test methods can be an appropriate way to simulate the seismic performance of embankments. However, numerical methods have shortcomings themselves. Numerical instability and the divergence of results are some of the common problems encountered during numerical analysis. During the past decades, several researchers have focused on numerical analysis methods in geotechnical engineering [18,19,20,21,22,23,24,25]; however, to the knowledge of the authors, reported literature on the seismic vulnerability of embankments has been very limited so far.
Yu-liang et al. (2016) [26] studied the seismic behavior of embankments under earthquake loading using numerical analysis. They also conducted a shaking table test to validate their numerical results. To obtain the seismic behavior of an embankment, they evaluated the dynamic displacement response alongside horizontal and vertical acceleration responses, and the block state of the embankment during earthquake loading. The results showed that the value of the horizontal acceleration response calculated by the numerical study was coincident with the one obtained by the test.
Argyroudis & Kaynia (2015) [27] presented a numerical seismic fragility curve for embankments. In that research, the soil conditions, the geo-construction and the embankment geometry are considered the first objective in evaluating the vulnerability of highway and railway embankments. Sakai et al. [28] performed a response failure analysis on a collapsed railway embankment considering tensile cracks during the 1968 Tokachi-Oki earthquake. The result is entirely consistent with the damaged state reported. Oblak et al. [29] performed a vulnerability analysis of embankments to liquefaction-induced deformations. In addition to the above studies, several researchers have shown the different failure mechanisms of embankments during earthquakes, including slipping of the slope surface, piping failure, crest settlements and lateral spreading [30,31].
In order to reduce the socio-economic loss due to earthquakes and enhance the resilience of society to these events, it is necessary to ensure the serviceability of traffic systems as soon as possible. All the above mentioned studies are focused on performing fragility curves under earthquake loading. However, according to the authors’ literature survey, no investigation has been conducted so far regarding the influence of soil material properties on fragility curves.
This research aims to present the effect of several model parameters, particularly soil cohesion and friction angle, on the response of an embankment on a probabilistic platform. The following noteworthy contributions have been made in this research study.
- -
- The first main contribution is to develop fragility curves for railway embankments and present the effect of several soil material properties on the embankment response during earthquakes.
- -
- The effect of embankment geometry, including embankment height and width, on embankment response during an earthquake, is investigated.
- -
- The fragility functions are derived utilizing an incremental dynamic analysis [32] approach considering a set of near-field and far-field earthquake ground motions.
The rest of the paper is organized as follows. Section 2 shows the methodology to perform the fragility curves. In Section 3, the definition of intensity measure, damage index and damage limit states are explained. Permanent vertical displacement of the embankment is selected as a damage index, while peak ground acceleration is considered the intensity measure. Section 4 summarizes the selected ground motions. Ten appropriate records of natural earthquakes considering near- and far-field records are selected and utilized for incremental dynamic analysis. For each embankment–earthquake set, an IDA was conducted. In Section 5, the seismic safety of three typical railway embankments is numerically evaluated using nonlinear response history analyses, and numerical models are provided in Section 6. The selected railway embankments are categorized into three groups with respect to their heights. Moreover, several friction angles and cohesions are considered for each group. Finally, fragility analyses are performed for railway embankments according to damage data simulated by numerical computations, as presented in Section 8.
2. Methodology to Perform Fragility Curves
Fragility curves are usually described by a cumulative distribution function (CDF) of lognormal distribution, and thus they can be expressed as follows:
where F denotes a seismic fragility, is the probability of reaching or exceeding a particular damage state with , is a cumulative distribution function (CDF) of lognormal distribution, is the median of fragility function and is the standard deviation of . There are two common statistical approaches for estimating parameters (). The parameters are obtained by the method of moments so that the distribution has the same moments (e.g., mean and standard deviation) as the sample moments of the observed data. The obtained results can be utilized to identify the fragility variables considering the maximum likelihood approach, as suggested by [29,33]. Maximum likelihood determines the parameters that produce the distribution with the highest likelihood of having produced the observed data. Assuming the independence of the perception generated for several ground motions and a lognormal distribution of fragility function Equation (1), the likelihood function is specified as the product of binomial probabilities as multiple levels, as follows:
where is the number of levels, denotes the number of cases exceeding a certain damage state at the th intensity level, defines the number of ground motions, and ∏ is the product of all individual likelihoods over values from 1 to m [33]. The fragility function variables are estimated by maximizing the likelihood function from Equation (2). The framework to drive fragility curves is presented in Figure 1, and the following steps should be taken into account to develop fragility curves.
- 1-
- Select several categories of railway embankments with different geometry.
- 2-
- Select earthquake ground motions (GMs) considering a set of near-field and far-field ground motions. Each earthquake is scaled from 0.1 g to 1 g to specify intensity measure (IM) levels.
- 3-
- Define damage indexes, intensity measure and damage limit state. In this study, certain levels of the maximum permanent vertical displacement (PVD) are selected as a limit states, and PVDs are calculated for each nonlinear response history analysis. Moreover, peak ground acceleration is considered the intensity measure. Based on the literature, threshold values were set for assessing three damage states, including slight, moderate and extensive deformation of the embankment [27].
- 4-
- Evaluate the performance level for each embankment, considering a given ground motion earthquake record, and determine the damage limit state.
- 5-
- Plot calculated probabilities versus PGAs for each damage state.
- 6-
- Develop fragility curves based on the most likelihood method.
The whole process may be divided into three main blocks, as shown in the flowchart presented in Figure 1. The first block contains the embankment modeling subjected to a set of near- and far-field ground motions, and obtains the maximum vertical displacement for each embankment, while the second block aims to obtain damage states with respect to the parameters available in the literature [27]. An example of performing a fragility curve for an embankment using the explained approach is shown in the last block.
3. Definition of Intensity Measure, Damage Index and Limit States
An analysis of vulnerability can result in a set of fragility curves that can be used for seismic risk assessment purposes. Previous researchers utilized various parameters such as peak ground velocity [34] and pseudo-static horizontal acceleration [35] as intensity measures to derive fragility curves. Peak ground acceleration (PGA) is one of the most commonly used IMs used to perform fragility curves [27,36]. In this study, the level of ground shaking is defined by peak ground acceleration (PGA).
Several damage indexes (DI) can be used to drive fragility curves. Based on damage datasets from expressway embankments, Maruyama et al. [34] generated fragility curves in response to recent earthquakes in Japan. Lagaros et al. [35] used safety factors, while other researchers [36] continue to use crest deployments for DI, as their measurements can be compared easily with field data. In this present study, damage indexes are defined based on permanent vertical ground displacement, as presented in Table 1. As shown in this table, the threshold values for three damage states of the selected DI are derived from the following sources [27].
4. Ground Motion Selection
Selecting appropriate input ground motions is essential to generate reliable fragility curves. In this study, probabilistic seismic safety assessment analyses are performed considering the nonlinear response history of the embankment. The selected seismic records that are presented in Table 2 show ten strong motions, including both near- and far-field earthquakes. The response spectra for the 5% damping ratio of the selected ground motions are illustrated in Figure 2. The mean value of the response spectra is shown by thicker lines. The selected earthquakes were downloaded from the PEER website (http://peer.berkeley.edu/smcat/ (accessed in August 2018)) and satisfy the following conditions:
- -
- All embankments are assumed to be resting on the hard soil. Therefore, accelerograms recorded on soil sites have a shear velocity of vs. ≥360 m/s.
- -
- Earthquakes have a PGA of more than 0.1 g.
- -
- The magnitude of the earthquakes is between 6–7.5.
In order to cover an appropriate range for IM, ground accelerations ranging from 0.1 g to 1 g were selected.
5. Seismic Safety Probability Assessment
This study performed an analytical probabilistic seismic safety assessment (PSSA) for railway embankments. The PSSA procedure of this study is based on a nonlinear response history analysis. In the literature, various methods are available for developing fragility curves from numerical simulations [33,37,38]. It is common to use incremental dynamic analysis [39] to find levels of intensity by scaling ground motions. Ten appropriate records of natural earthquakes were selected and utilized for IDA. For each embankment-earthquake set, an incremental dynamic analysis was conducted. Hence, 2400 analysis cases were performed, and eventually, fragility functions according to the simulated damage data were obtained by numerical analysis. Fragility curves indicate the probability that the demand on an embankment will exceed its capacity given a level of ground motion [40,41].
The PSSA of a particular structure is generally associated with a variety of uncertainties. According to previous research, embankment seismic performances depend on embankment heights (h) and mechanical properties [42,43]. In other words, they can be considered important sources of uncertainty in the seismic safety evaluation of embankments. Hence, the selected railway embankments were categorized into three groups based on their heights (H = 2, 3 and 4 m). Moreover, the soil cohesion (c) and the friction angle (ϕ) are two of the most important geotechnical parameters. Many of the soil’s mechanical properties are directly or indirectly dependent on c and ϕ. For this reason, several different friction angles (ϕ = 30°, 32°, 34°) and cohesions (c = 16, 32, 40 kPa) were considered for each group.
6. Numerical Analysis
Incremental dynamic analyses are performed on three categories of railway embankments. The geometric scheme of the considered embankments is illustrated in Figure 3 and their geometrical specifications are presented in Table 3. The selected embankments are rested on considerably stiff ground; therefore, the interaction of soil and embankment is not considered in this study.
The numerical model is implemented using PLAXIS finite element code in 2D (plane strain) [44]. For the FEM domain, 15-noded triangular elements covering the embankment’s trapezoidal shape are used. By considering the first two modal periods, the mass and stiffness proportional Rayleigh damping coefficients were determined. The ballast, capping and embankment layers are modeled using material model, which provides responsible soil behavior modeling for shear stress exceeding the internal friction resistance between the material particles. The mechanical properties of several layers of embankments are tabulated in Table 4.
7. Development of Fragility Curves
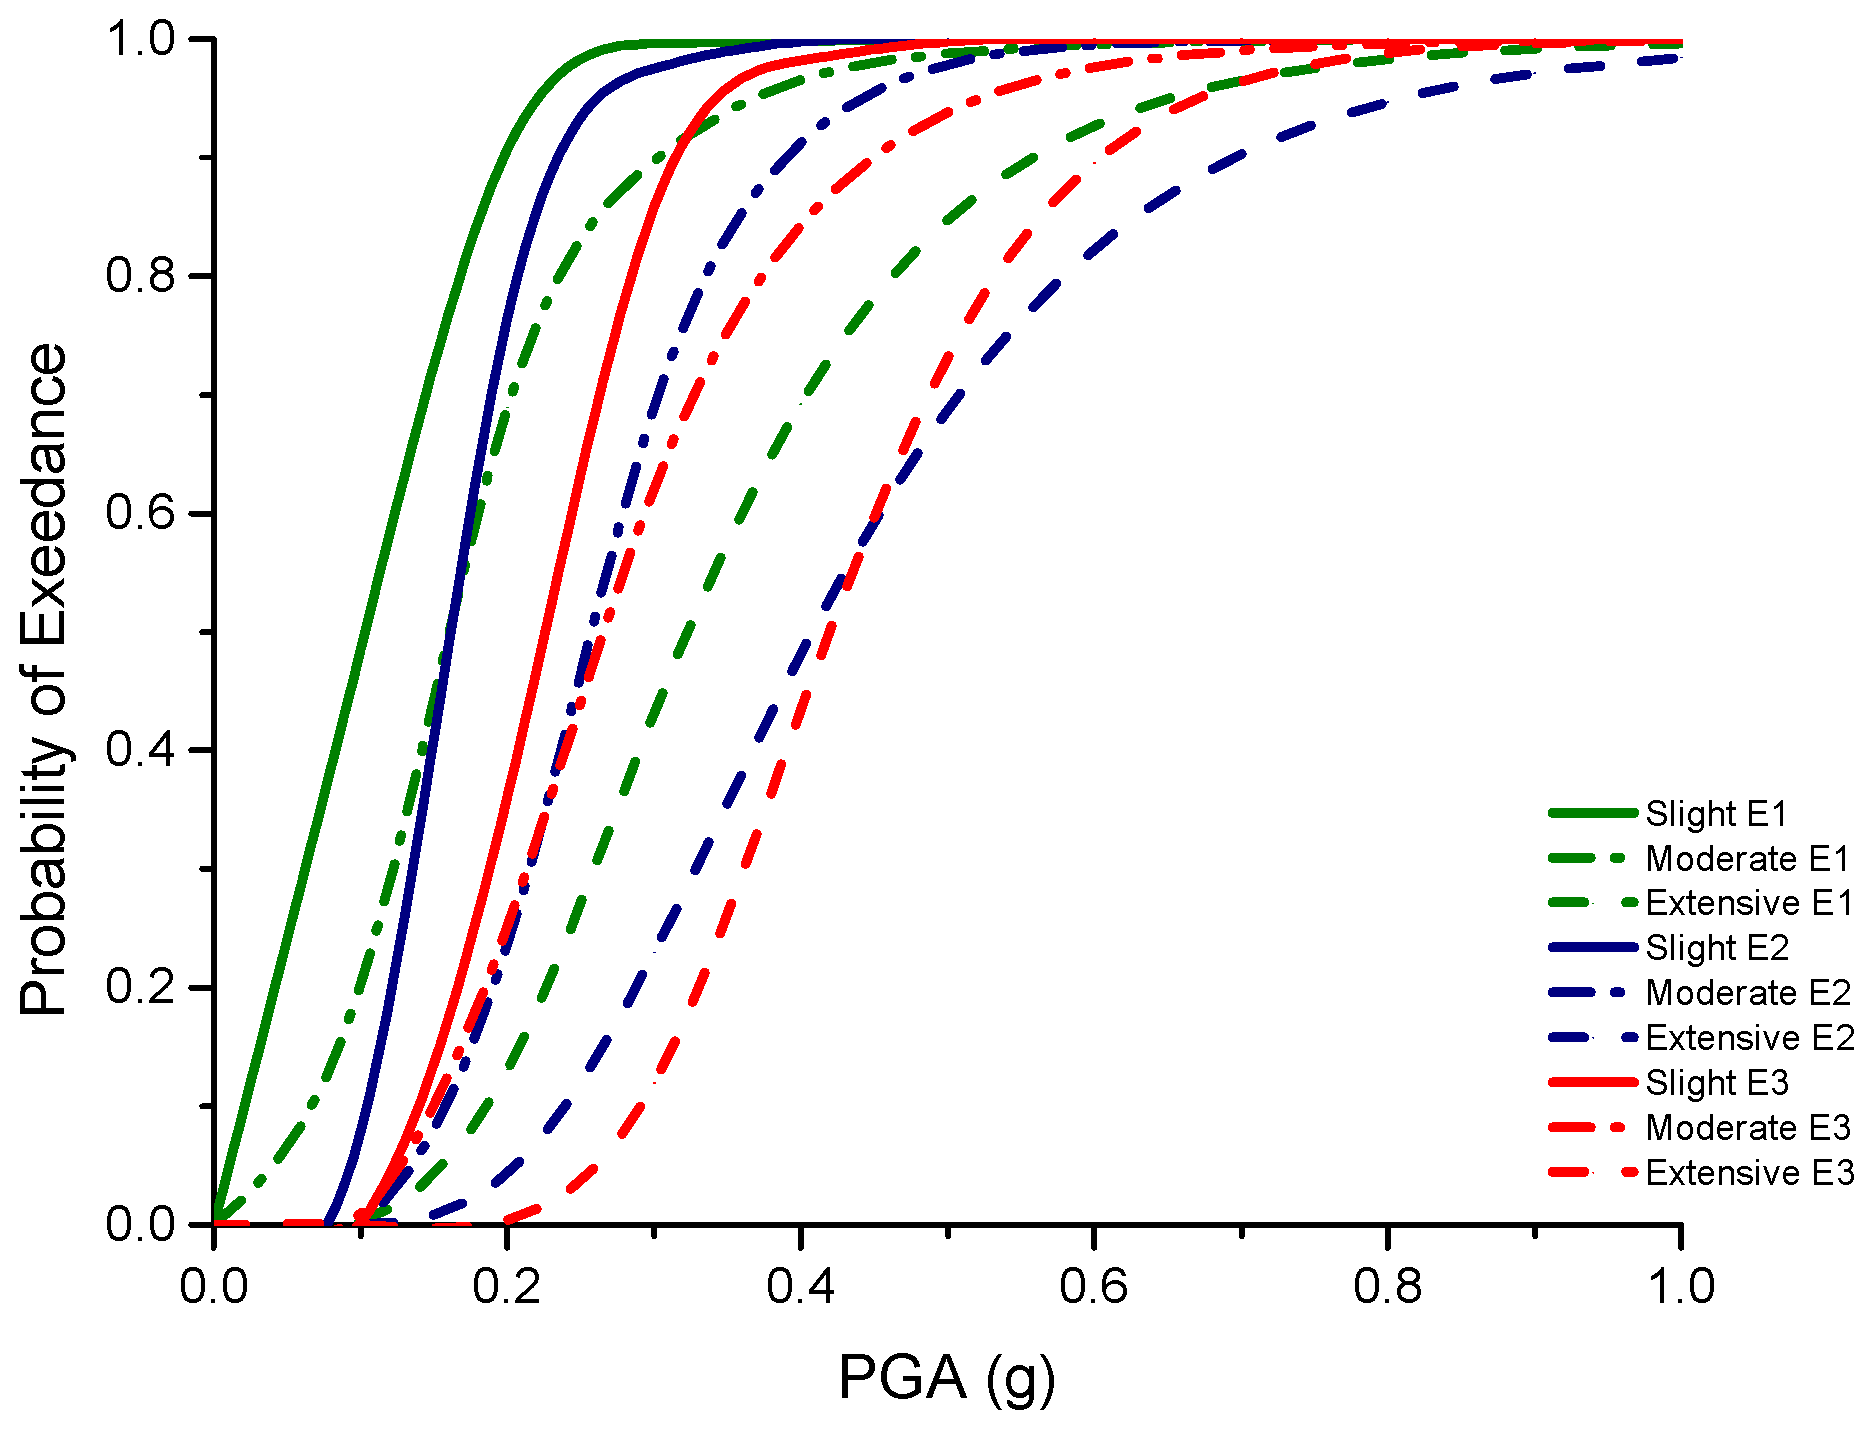
To evaluate the seismic safety of the selected railway embankments, fragility curves were developed. Every accelerogram was scaled to 10 peak ground accelerations varying from 0.1 g to 1 g. A total number of 2400 embankment-earthquake cases were analyzed. The maximum vertical displacement of the railway embankment was evaluated for each analysis. Finally, the most likelihood approach was used to develop the curves. Table 5 shows the fragility curve parameters for several limit states for all ground motion records considering ϕ = 30° and c = 40 kPa. In this table, is the median value of fragility function and is the standard deviation of . Fragility curves are derived using peak ground acceleration as an intensity measure. Note that these results are credible only in the hypotheses defined in this research study (e.g., soil properties, the embankment geometry) and cannot be easily extrapolated to other conditions. In this study, individual model variables are examined to establish their effect on fragility curves. Figure 4 presents the fragility curves of different embankments for ϕ = 30° and c = 40 kPa. The fragility curves are performed for three damage states, namely DS1- Slight, DS2- Moderate and DS3- Extensive.
As indicated in Figure 4, the slight failure of embankments is considered probable for the special case of ϕ = 30° and c = 40 kPa. As the seismic performances of embankments are highly dependent on their geometric specifications and the soil mechanical properties, they can be considered the most essential uncertainty sources. Hence, the sensitivity of the seismic performance of the embankment to the above parameters is investigated.
7.1. Sensitivity to H/B
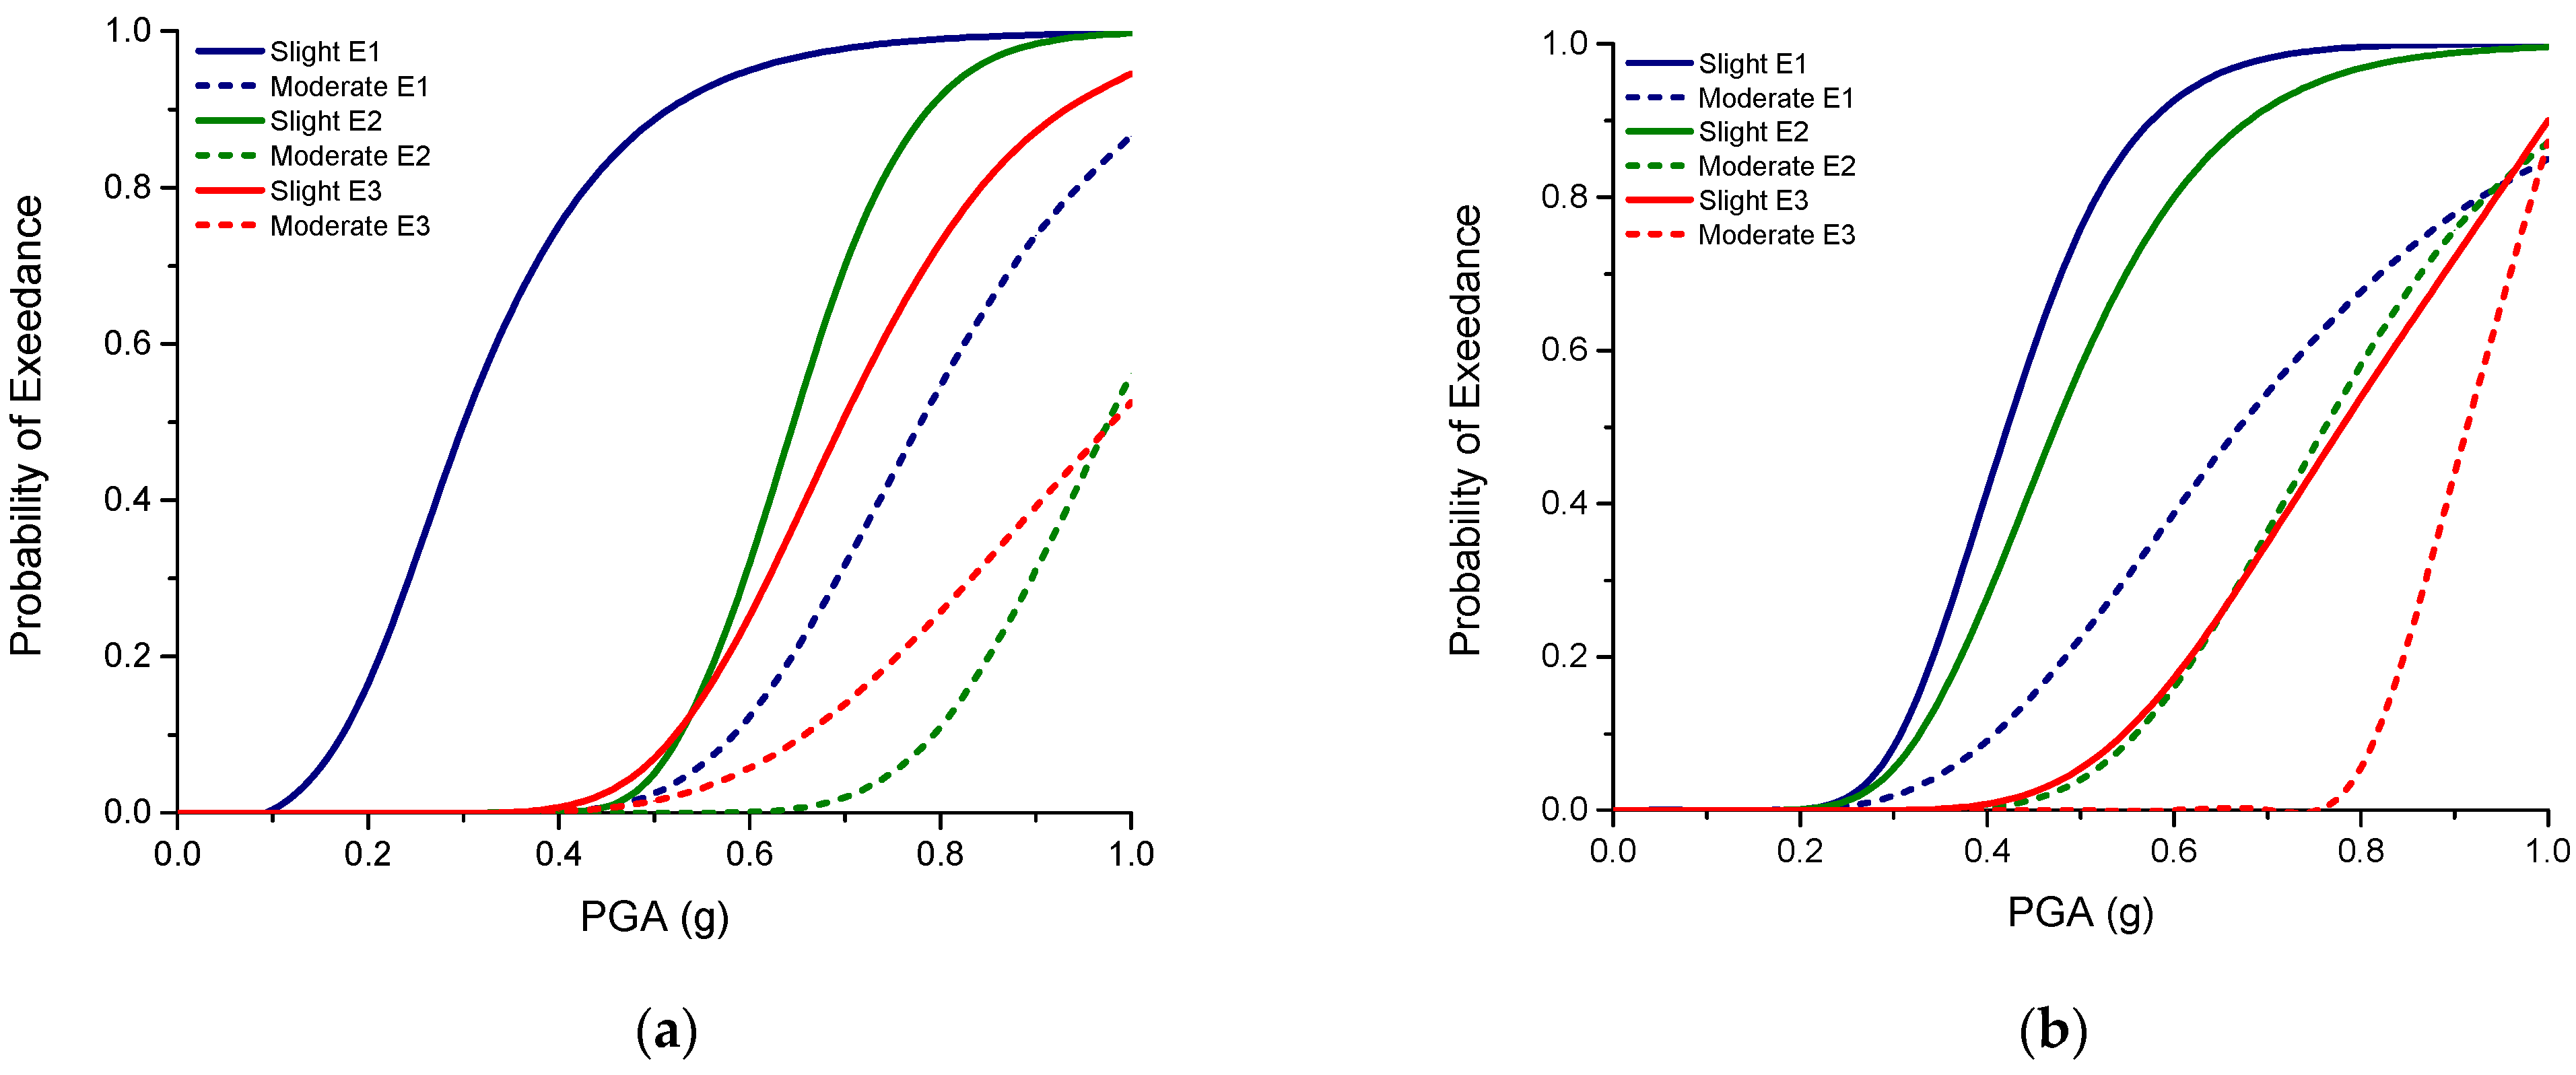
Figure 5 presents the fragility curves of the embankments in terms of their height (H) to length (B) ratio considering near- and far-ground motions. The values of H, B and their ratio are presented in Table 3, and the parameters for the embankment layers are illustrated in Table 4. From the results presented in Figure 5, it is possible to conclude that the embankments with a higher H/B ratio are seismically more vulnerable than those with a lower H/B ratio. The threshold values for three damage states, including slight, moderate and extensive are equal to 3 cm, 7.5 cm and 20 cm, respectively, due to the maximum vertical displacement of the embankment (presented in Table 1). As shown in Figure 5, since there is no earthquake-embankment case beyond the extensive damage, only the slight and moderate damage states are presented in this Figure.
According to the fragility curves shown in Table 6, different damage states are associated with different H/B ratios due to near-field and far-field earthquakes.
As an example of the influence of the H/B ratio and the seismic sources on the probability of reaching the limit, Figure 5a shows that, for PGA = 0.7 g, the probabilities of reaching or exceeding DS1 (slight) for three embankments subjected to near ground motion are 97, 75, and 56%, respectively. In other words, increasing the H/B ratio leads to the enhancement of the probabilities of reaching or exceeding for both seismic sources. This outcome is consistent with the embankment responses observed by previous researchers [27,29]. Moreover, the embankments subjected to near-fault records were more vulnerable than those subjected to the far-fault ones. The reason is related to the response spectra of the selected ground motion records. As illustrated in Figure 2, the response spectra of the near-field seismic records are higher than the response spectra of the selected far-field ground motion records. Therefore, less deformation occurred for embankments subjected to far-field ground motion records. Moreover, the results show that E3 is less vulnerable than E1 and E2. The reason for such a result is the cohesion of embankment E3, which is 0.
7.2. Sensitivity to Friction Angle
The objective of the present section is to assess the sensitivity of the embankments’ seismic performance to friction angle variations. For this reason, the cohesion of each embankment was considered constant, and fragility curves were performed for several friction angles of 30°, 32° and 34°. Figure 6 shows the fragility curves of embankments considering different friction angles subjected to near and far seismic sources. Table 7 presents fragility curve parameters considering several friction angles of the embankment’s soil. Three damage limit states are shown in this table to compare the effect of friction angle variation and different seismic sources on the fragility curves. Figure 6 shows that the vulnerability of the embankments decreases when the friction angle enhances. Only the slight and moderate damage states are presented for higher friction angles. When ϕ is considered as 30°, an extensive damage state appears for embankments E1 and E3. However, for ϕ = 32° or 34°, only the slight and moderate damage states appeared in the fragility curves. Once again, empty cells (/) in Table 7 indicate that no extensive damage state results exist while ϕ = 32° or 34°. As mentioned above, the fragility curves present that both embankments are more prone to failure due to the near-fault records.
7.3. Sensitivity to Cohesion
The previous section shows that the vulnerability of embankments increases with decreasing friction angle, and when ϕ = 30°, the maximum vulnerability occurs. The main focus of this section is to consider ϕ = 30° and vary the cohesion as 16, 32 and 40 kPa and perform the fragility curves for the near-field and far-field seismic sources. Therefore, all further analyses are performed using ϕ = 30°. Table 8 presents the fragility curve parameters by considering the different cohesion of the embankment soil properties for near-field and far-field ground motion records. Figure 7 shows the fragility curve for three embankments due to cohesion variation. From the results presented in these figures, it is possible to infer that the maximum vertical displacement for this particular case enhances with an increase in cohesion. Consequently, the curves for the higher cohesion of the embankment soil move to the left, indicating higher vulnerability. Moreover, as can be seen in Figure 7, E1 with the highest ratio of H/B is more vulnerable than E2 and E3 for both near- and far-field seismic sources.
8. Conclusions
A fragility analysis has been generated for railway embankments in this study. For this purpose, the seismic safety of three typical railway embankments was numerically evaluated using nonlinear response history analyses. The selected railway embankments were categorized into three groups based on their heights (H = 2, 3 and 4 m). Moreover, several friction angles (ϕ = 30°, 32°, 34°) and cohesions (c = 16, 32, 40 kPa) were considered for each group. In other words, the height to width ratio of the embankment, soil material properties and different ground motion sources were examined in this parametric study. Ten appropriate records of natural earthquakes considering near-field and far-field records were selected and utilized for IDA. For each embankment-earthquake set, an incremental dynamic analysis was conducted. To perform fragility curves, each model was subjected to ten intensities of a set of ten ground motions. The displacement of the embankment in a vertical direction served as the damage index, while PGA was considered the intensity measure. Based on the literature, threshold values were set for assessing three damage states, including slight, moderate and extensive deformation of the embankment [27]. Hence, 2400 analysis cases were implemented. Finally, fragility functions were derived according to damage data simulated by numerical analyses. The results of the study lead to the following conclusions.
- -
- As a result of this study, it was determined that railway embankments’ mechanical properties could be considered significant sources of uncertainty in seismic fragility analyses.
- -
- The results of this study indicate that embankments with a high H/B ratio were more susceptible to earthquakes than embankments with a low H/B ratio.
- -
- As a result of the selected records, near-fault embankments were more prone to failure than far-fault ones.
- -
- The results show that by increasing cohesion, the vulnerability of the embankments is enhanced. However, curves for the embankments considering higher friction angles move to the right, indicating lower vulnerability.
Although this study’s results are limited to specific locations, they are suitable for assessing embankment vulnerability at the initial stage. It can also be mentioned that the outputs of this research are limited by the number of analyses performed, and to come by more reliable results, more analyses are required. This study aims to analyze the response behavior of embankments, considering geometry and material properties using fragility curves. A general parametric study is required to obtain the spatial variability of soil properties and embankment geometry. Furthermore, the results of a parametric study that considers different soil layers under the embankment can also be used in the analysis of transportation network vulnerability in future scenarios.
Author Contributions
Conceptualization, A.M., P.A.C., R.C. and M.S.R.; methodology, A.M.; software, A.M. and M.S.R.; validation, M.M.; formal analysis, M.M.; investigation, A.M., M.M.; resources, R.C.; data curation, M.M.; writing—original draft preparation, A.M.; writing—review and editing, P.A.C., R.C. and M.S.R.; visualization, A.M., P.A.C., R.C. and M.S.R.; supervision, A.M., P.A.C., R.C. and M.S.R.; project administration, R.C.; funding acquisition, R.C. All authors have read and agreed to the published version of the manuscript.
Funding
The work was financially supported by the IDB/04708/2020 and Programmatic Funding–of the CONSTRUCT—Instituto de I&D em Estruturas e Construções—funded by the FCT/MCTES (PIDDAC). The paper reflects research developed in the ambit of the project RISEN “RISEN: Rail Infrastructure Systems Engineering Network” (Grant No. 691135) provided by the European Commission to the H2020 MARIE SKŁODOWSKA-CURIE. The idea of this research was initiated during the visit of the second author to Wollongong University, funded by the RISEN program as a collaborative project.
Institutional Review Board Statement
Not applicable.
Informed Consent Statement
Not applicable.
Data Availability Statement
All data: models: and code generated or used during the study appear in the paper.
Acknowledgments
The work was financially supported by the IDB/04708/2020 and Programmatic Funding–of the CONSTRUCT—Instituto de I&D em Estruturas e Construções—funded by the FCT/MCTES (PIDDAC). The paper reflects research developed in the ambit of the project RISEN “RISEN: Rail Infrastructure Systems Engineering Network” (Grant No. 691135) provided by the European Commission to the H2020 MARIE SKŁODOWSKA-CURIE. The idea of this research was initiated during the visit of the second author to Wollongong University, funded by the RISEN program as a collaborative project. Therefore, the authors thank Alex Remennikov and Jayan Vinod from Wollongong University, whose expertise was valuable in formulating the research questions and methodology.
Conflicts of Interest
The authors declare no conflict of interest.
References
- Pradhan, R.P.; Bagchi, T.P. Effect of transportation infrastructure on economic growth in India: The VECM approach. Res. Transp. Econ. 2013, 38, 139–148. [Google Scholar] [CrossRef]
- Wiłkomirski, B.; Sudnik-Wójcikowska, B.; Galera, H.; Wierzbicka, M.; Suska-Malawska, M. Railway transportation as a serious source of organic and inorganic pollution. Water Air Soil Pollut. 2010, 218, 333–345. [Google Scholar] [CrossRef] [PubMed] [Green Version]
- Abramović, B.; Zitricky, V.; Biškup, V. Organisation of railway freight transport: Case study CIM/SMGS between Slovakia and Ukraine. Eur. Transp. Res. Rev. 2016, 8, 1–13. [Google Scholar] [CrossRef] [Green Version]
- Ham, H.; Kim, T.J.; Boyce, D. Assessment of economic impacts from unexpected events with an interregional commodity flow and multimodal transportation network model. Transp. Res. Part A Policy Pract. 2005, 39, 849–860. [Google Scholar] [CrossRef]
- Azadi, M.; Ghasemi, S.H.; Mohammadi, M. Reliability Analysis of Tunnels with Consideration of the Earthquakes Extreme Events. Geomech. Eng. 2020, 22, 433–439. [Google Scholar]
- Byers, W.G.; Edwards, C.; Tang, A.; Eidinger, J.; Roblee, C.; Yashinsky, M.; Bardet, J.-P.; Swift, J. Performance of Transportation Systems after the 1999 Kocaeli Earthquake. Earthq. Spectra 2000, 16 (Suppl. 1), 403–410. [Google Scholar] [CrossRef]
- Ashford, S.A.; Kawamata, Y. Performance of Transportation Systems during the 2004 Niigata Ken Chuetsu, Japan, Earthquake. Earthq. Spectra 2006, 22 (Suppl. 1), 111–132. [Google Scholar] [CrossRef]
- Davies, A.J.; Sadashiva, V.; Aghababaei, M.; Barnhill, D.; Costello, S.B.; Fanslow, B.; Headifen, D.; Hughes, M.; Kotze, R.; Mackie, J.; et al. Transport infrastructure performance and management in the South Island of New Zealand, during the first 100 days following the 2016 Mw 7.8 “Kaikōura” earthquake. Bull. N. Z. Soc. Earthq. Eng. 2017, 50, 50271–50299. [Google Scholar] [CrossRef] [Green Version]
- Koseki, J.; Koda, M.; Matsuo, S.; Takasaki, H.; Fujiwara, T. Damage to railway earth structures and foundations caused by the 2011 off the Pacific Coast of Tohoku Earthquake. Soils Found. 2012, 52, 872–889. [Google Scholar] [CrossRef] [Green Version]
- Ellingwood, B.R.; Rosowsky, D.V.; Li, Y.; Kim, J.H. Fragility Assessment of Light-Frame Wood Construction Subjected to Wind and Earthquake Hazards. Eng. Struct. 2004, 130, 1921–1930. [Google Scholar] [CrossRef]
- Razzaghi, M.S.; Eshghi, S. Probabilistic seismic safety assessment of precode cylindrical oil tanks. J Performance of Constructed Facilities. J. Perform. Constr. Facil. 2014, 29, 04014170. [Google Scholar] [CrossRef]
- Razzaghi, M.S.; Safarkhanlou, M.; Mosleh, A.; Hosseini, P. Fragility assessment of RC bridges using numerical analysis and artificial neural networks. Earthq. Struct. 2018, 15, 431–441. [Google Scholar]
- Billah, A.H.M.M.; Alam, M.S.; Bhuiyan, A.R. Fragility analysis of retrofitted multi-column bridge bent subjected to near fault and far field ground motion. ASCE J. Bridge Eng. 2013, 18, 992–1004. [Google Scholar] [CrossRef]
- Avsar, O.; Yakut, A. Seismic vulnerability assessment criteria for RC ordinary highway bridges in Turkey. Struct. Eng. Mech. 2012, 43, 127–145. [Google Scholar] [CrossRef]
- Mosleh, A.; Razzaghi, M.S.; Jara, J.; Varum, H. Development of fragility curves for RC bridges subjected to reverse and strike-slip seismic sources. Earthq. Struct. 2016, 11, 517–538. [Google Scholar] [CrossRef] [Green Version]
- Yu-liang, L. Shaking table modeling of embankment slope response to earthquake loading. Disaster Adv. 2013, 6, 69–77. [Google Scholar]
- Lee, C.-J.; Chen, H.-T.; Lien, H.-C.; Wei, Y.-C.; Hung, W.-Y. Centrifuge modeling of the seismic responses of sand deposits with an intra-silt layer. Soil Dyn. Earthq. Eng. 2014, 65, 72–88. [Google Scholar] [CrossRef]
- Allulakshmi, K.; Vinod, J.S.; Heitor, A.; Fourie, A.; Reid, D. DEM Study on the Instability Behaviour of Granular Materials. Geotech. Geol. Eng. 2021, 39, 2175–2185. [Google Scholar] [CrossRef]
- Barbosa, J.; Costa, P.A.; Calçada, R. Abatement of railway induced vibrations: Numerical comparison of trench solutions. Eng. Anal. Bound. Elements 2015, 55, 122–139. [Google Scholar] [CrossRef]
- Indraratna, B.; Thakur, P.K.; Vinod, J.S. Experimental and Numerical Study of Railway Ballast Behavior under Cyclic Loading. Int. J. Geomech. 2010, 10, 136–144. [Google Scholar] [CrossRef]
- Kouroussis, G.; Connolly, D.P.; Olivier, B.; Laghrouche, O.; Costa, P.A. Railway cuttings and embankments: Experimental and numerical studies of ground vibration. Sci. Total Environ. 2016, 557–558, 110–122. [Google Scholar] [CrossRef] [PubMed]
- Mosleh, A.; Meixedo, A.; Ribeiro, D.; Montenegro, P.; Calçada, R. Automatic clustering-based approach for train wheels condition monitoring. Int. J. Rail Transp. 2022, 1–26. [Google Scholar] [CrossRef]
- Mosleh, A.; Meixedo, A.; Ribeiro, D.; Montenegro, P.; Calçada, R. Early wheel flat detection: An automatic data-driven wavelet-based approach for railways. Veh. Syst. Dyn. 2022, 1–30. [Google Scholar] [CrossRef]
- Mohammadi, M.; Mosleh, A.; Razzaghi, M.; Alves Costa, P.; Calçada, R. Stochastic analysis of railway embankment with uncertain soil parameters using polynomial chaos expansion. Struct. Infrastruct. Eng. 2022, 1–20. [Google Scholar] [CrossRef]
- Vale, C. Wheel Flats in the Dynamic Behavior of Ballasted and Slab Railway Tracks. Appl. Sci. 2021, 11, 7127. [Google Scholar] [CrossRef]
- Lin, Y.L.; Shi, F.; Yang, X.; Yang, G.L.; Li, L.M. Numerical analysis on seismic behavior of railway earth embankment: A case study. J. Cent. South Univ. 2016, 23, 906–918. [Google Scholar] [CrossRef]
- Argyroudis, S.; Kaynia, A.M. Analytical seismic fragility functions for highway and railway embankments and cuts. Earthq. Eng. Struct. Dyn. 2015, 44, 1863–1879. [Google Scholar] [CrossRef]
- Sakai, H.; Sawada, S.; Toki, K. Non-linear analyses of dynamic behavior of embankment structures considering tensile failure. In Proceedings of the12WCEE 2000: 12th World Conference on Earthquake Engineering, Auckland, New Zealand, 30 January–4 February 2000. [Google Scholar]
- Oblak, A.; Kosic, M.; Fonseca, A.; Logar, J. Fragility Assessment of Track Embankments Exposed to Earthquake-Induced Liquefaction. Appl. Sci. 2020, 10, 6832. [Google Scholar] [CrossRef]
- Rapti, I.; Lopez-Caballero, F.; Modaressi-Farahmand-Razavi, A.; Foucault, A.; Voldoire, F. Liquefaction analysis and damage evaluation of embankment-type structures. Acta Geotech. 2018, 13, 1041–1059. [Google Scholar] [CrossRef] [Green Version]
- Yoshimichi, T.; Kenji, I.; Shohei, K.; Shigeru, K. Liquefaction-induced road embankment failures. Proc. Inst. Civ. Eng.-Forensic Eng. 2013, 166, 64–71. [Google Scholar]
- Shinoda, M.; Nakajima, S.; Watanabe, K.; Nakamura, S.; Yoshida, I.; Miyata, Y. Practical seismic fragility estimation of Japanese railway embankments using three seismic intensity measures. Soils Found. 2022, 62, 101160. [Google Scholar] [CrossRef]
- Baker, J. Efficient Analytical Fragility Function Fitting Using Dynamic Structural Analysis. Earthq. Spectra 2015, 31, 579–599. [Google Scholar] [CrossRef]
- Maruyama, Y.; Yamazaki, F.; Mizuno, K.; Tsuchiya, Y.; Yogai, H. Fragility curves for expressway embankments based on damage datasets after recent earthquakes in Japan. Soil Dyn. Earthq. Eng. 2010, 30, 1158–1167. [Google Scholar] [CrossRef]
- Lagaros, D.; Tsompanakis, Y.; Psarropoulos, N.; Georgopoulos, C. Computationally efficient seismic fragility analysis of geostructures. Comput. Struct. 2009, 87, 1195–1203. [Google Scholar] [CrossRef]
- Argyroudis, S.; Mitoulis, S.; Kaynia, A.M.; Winter, M. Fragility Assessment of Transportation Infrastructure Systems Subjected to Earthquakes. Geotech. Earthq. Eng. Soil Dyn. 2018, 292, 174–183. [Google Scholar]
- Mosleh, A.; Razzaghi, M.S.; Jara, J.; Varum, H. Seismic fragility analysis of typical pre-1990 bridges due to near- and far-field ground motions. Int. J. Adv. Struct. Eng. 2016, 8, 1–9. [Google Scholar] [CrossRef] [Green Version]
- Manjili, F.; Mosleh, A.; Razzaghi, M. Seismic fragility of concrete bridges designed to current and older AASHTO specifications. Proc. Inst. Civ. Eng.-Struct. Build. 2021, 175, 808–823. [Google Scholar] [CrossRef]
- Vamvatsikos, D.; Cornell, C.A. Incremental dynamic analysis. Earthq. Eng. Struct. Dyn. 2002, 31, 491–514. [Google Scholar] [CrossRef]
- Mosleh, A.; Jara, J.; Razzaghi, M.S.; Varum, H. Probabilistic Seismic Performance Analysis of RC Bridges. J. Earthq. Eng. 2020, 24, 1704–1728. [Google Scholar] [CrossRef]
- Mosleh, A.; Varum, H.; Jara, J. A methodology for determining the seismic vulnerability of old concrete highway bridges by using fragility curves. J. Struct. Eng. Geotech. 2015, 5, 1–7. [Google Scholar]
- Lilei, F.; Xiaojie, M.; Zhirong, M. Failure Characteristics and Influencing Factors Analysis of Embankment Engineering damage due to Wenchuan Earthquake. Electron. J. Geotech. Eng. 2013, 18, 5759–5772. [Google Scholar]
- Lin, Y.L.; Yang, G.L. Seismic residual deformation behavior of embankment slopes of different compaction degrees. J. Cent. South Univ. Sci. Technol. 2012, 9, 3631–3637. [Google Scholar]
- Brinkgreve, R.B.J.; Swolfs, W.M.; Engin, E.; Waterman, D.; Chesaru, A.; Bonnier, P.G.; Galavi, V. PLAXIS 2D 2010; User manual; Bentley Systems Company: Rotterdam, The Netherlands, 2010. [Google Scholar]
- Fu, Q.; Zheng, C. Three-Dimensional Dynamic Analyses of Track-Embankment-Ground System Subjected to High Speed Train Loads. Sci. World J. 2014, 2014, 924592. [Google Scholar] [CrossRef] [PubMed]
Figure 1.
The framework of the proposed method.

Figure 2.
Ground motion response spectra, (a) near-field, (b) far-field.

Figure 3.
A geometric scheme of the considered railway embankments.

Figure 4.
Fragility curves of the embankments due to all records with ϕ = 30° and c = 40 kPa.

Figure 5.
Fragility curves of the embankments due to H/B ratio (a) near-ground motions (b) far-ground motions.
Figure 5.
Fragility curves of the embankments due to H/B ratio (a) near-ground motions (b) far-ground motions.

Figure 6.
Fragility curves of the embankments due to friction angle variation, (a) E1, near-field, c = 32.5 kPa (b) E3, near-field, c = 0 kPa (c), E1, far-field, c = 32.5 kPa (d) E3, far-field, c = 0 kPa.
Figure 6.
Fragility curves of the embankments due to friction angle variation, (a) E1, near-field, c = 32.5 kPa (b) E3, near-field, c = 0 kPa (c), E1, far-field, c = 32.5 kPa (d) E3, far-field, c = 0 kPa.

Figure 7.
Fragility curves of the embankments due to cohesion variation and ϕ = 30°, (a) E1, near-field, (b) E2, near-field, (c) E3, near-field (d), E1, far-field, (e) E2, far-field, (f) E3, far-field.
Figure 7.
Fragility curves of the embankments due to cohesion variation and ϕ = 30°, (a) E1, near-field, (b) E2, near-field, (c) E3, near-field (d), E1, far-field, (e) E2, far-field, (f) E3, far-field.


Table 1.
Railway embankment damage states [27].
Table 1.
Railway embankment damage states [27].
| Damage States | Description | Permanent Vertical Displacement (mm) | Median (mm) |
|---|---|---|---|
| Slight (DS1) | Reduction in speed without operation abandon | 10–50 | 30 |
| Moderate (DS2) | Operation abandon is required during repair | 50–100 | 75 |
| Extensive (DS3) | Operation abandon is required during reconstruction | 100–300 | 200 |
Table 2.
Ground motion parameters of selected earthquakes.
| Earthquake | Station | PGA (g) | Year | Magnitude | R (km) | |
|---|---|---|---|---|---|---|
| Far-field | Griva, Greece | Edessa (bsmt) | 0.103 | 1990 | 6.1 | 32.84 |
| Kern county | Taft Lincoln School | 0.18 | 1954 | 7.36 | 38.42 | |
| Sanfernando | Pasadena—CIT Athenaeum | 0.109 | 1971 | 6.61 | 25.47 | |
| Taiwan SMART | SMART1 E02 | 0.142 | 1986 | 7.3 | 51.35 | |
| Trinidad | Rio Dell Overpass—FF | 0.147 | 1980 | 7.2 | 76.06 | |
| Near-field | Cape Mendocino | Petrolia | 0.661 | 1992 | 7.01 | 0 |
| Chuetsu-oki, Japan | Oguni Nagaoka | 0.455 | 2007 | 6.8 | 10.31 | |
| Montenegro, Yugoslavia | Bar-Skupstina Opstine | 0.372 | 1979 | 7.1 | 0 | |
| Northridge-01 | Pacoima Kagel Canyon | 0.43 | 1994 | 6.69 | 5.26 | |
| Tabas, Iran | Tabas | 0.861 | 1978 | 7.35 | 1.79 | |
Table 3.
Geometrical specifications of the selected embankments.
| Embankment | H (m) | B (m) | H/B | h (m) | b (m) | b1 (m) | b2 (m) |
|---|---|---|---|---|---|---|---|
| E1 | 3.0 | 19.60 | 0.153 | 0.5 | 13.6 | 7.6 | 7.0 |
| E2 | 4.5 | 27 | 0.129 | 1.0 | 15.0 | 10.0 | 7.5 |
| E3 | 2.0 | 18.95 | 0.106 | 0.35 | 8.5 | 6.1 | 2.75 |
Table 4.
Material modeling parameters for embankment’s layers [45].
Table 4.
Material modeling parameters for embankment’s layers [45].
| Parameters for Embankment 1 (E1) | Parameters for Embankment 2 (E2) | Parameters for Embankment 3 (E3) | ||||||
|---|---|---|---|---|---|---|---|---|
| Ballast | Capping Layer | Embankment | Ballast | Embankment | Ballast | Capping Layer | Embankment | |
| Module of elasticity, E (kPa) | 389,000 | 120,000 | 250,000 | 389,000 | 250,000 | 389,000 | 140,000 | 67,000 |
| Density, ρ (kg/m3) | 2200 | 1935 | 1800 | 2200 | 1800 | 1590 | 1937 | 1733 |
| Poisson coefficient, υ | 0.3 | 0.3 | 0.3 | 0.3 | 0.3 | 0.3 | 0.35 | 0.35 |
| Friction angle, ϕ (°) | 35 | 20 | 34 | 35 | 34 | 45 | 45 | 40 |
| Cohesion, c (kPa) | 5 | 5 | 32.5 | 5 | 32 | 5 | 0 | 0 |
| Permeability (m/s) | 10−4 | 10−4 | 10−4 | 10−4 | 10−4 | 10−4 | 10−4 | 10−4 |
| Dilatancy angle, ψ (°) | 5 | 0 | 4 | 5 | 4 | 15 | 15 | 10 |
| R | 0.6 | 0.6 | 0.6 | 0.6 | 0.6 | 0.6 | 0.6 | 0.6 |
| Saturation, γSAT (kN/m3) | 21.575 | 18.976 | 17.652 | 21.575 | 17.652 | 15.6 | 19 | 17 |
Table 5.
Fragility curve parameters for different damage limit states due to all records with ϕ = 30° and c = 40 kPa.
Table 5.
Fragility curve parameters for different damage limit states due to all records with ϕ = 30° and c = 40 kPa.
| Fragility Curve Parameters | E1 | E2 | E3 | |||||||
|---|---|---|---|---|---|---|---|---|---|---|
| DS1 | DS2 | DS3 | DS1 | DS2 | DS3 | DS1 | DS2 | DS3 | ||
| c = 40 ϕ = 30° | β | 0.46 | 0.52 | 0.43 | 0.32 | 0.33 | 0.42 | 0.28 | 0.41 | 0.28 |
| θ | −2.28 | −1.86 | −1.13 | −1.84 | −1.36 | −0.89 | −1.50 | −1.33 | −0.86 | |
Table 6.
Fragility curve parameters considering the influence of H/B ratios on near-field and far-field earthquake records.
Table 6.
Fragility curve parameters considering the influence of H/B ratios on near-field and far-field earthquake records.
| Fragility Curve Parameters | E1 | E2 | E3 | |||||||
|---|---|---|---|---|---|---|---|---|---|---|
| DS1 | DS2 | DS3 | DS1 | DS2 | DS3 | DS1 | DS2 | DS3 | ||
| Near-field | β | 0.42 | 0.23 | / | 0.15 | 0.16 | / | 0.23 | 0.31 | / |
| θ | −1.20 | −0.24 | / | −0.43 | −0.02 | / | −0.36 | −0.02 | / | |
| Far-field | β | 0.24 | 0.39 | / | 0.28 | 0.24 | / | 0.28 | 0.08 | / |
| θ | −0.86 | −0.40 | / | −0.74 | −0.27 | / | −0.25 | −0.09 | / | |
Table 7.
Fragility curve parameters considering several friction angles of the soil properties subjected to near-field and far-field earthquake ground motions.
Table 7.
Fragility curve parameters considering several friction angles of the soil properties subjected to near-field and far-field earthquake ground motions.
| Field | Fragility Curve Parameters | ϕ = 30° | ϕ = 32° | ϕ = 34° | |||||||
|---|---|---|---|---|---|---|---|---|---|---|---|
| DS1 | DS2 | DS3 | DS1 | DS2 | DS3 | DS1 | DS2 | DS3 | |||
| E1 c = 32.5 kPa | Near-field | β | 0.7 | 0.5 | 0.47 | 0.25 | 0.32 | / | 0.41 | 0.22 | / |
| θ | −2.54 | −2.09 | −1.23 | −1.46 | −1.29 | / | −1.20 | −0.24 | / | ||
| Far-field | β | 0.72 | 0.61 | 0.79 | 0.22 | 0.24 | / | 0.24 | 0.38 | / | |
| θ | −2.49 | −1.92 | −1.41 | −1.18 | −0.86 | / | −0.86 | −0.40 | / | ||
| E3 c = 0 kPa | Near-field | β | 0.36 | 0.34 | 0.52 | 0.08 | 0.06 | / | 0.22 | 0.31 | / |
| θ | −1.97 | −1.69 | −1.07 | −0.39 | −0.16 | / | −0.36 | −0.02 | / | ||
| Far-field | β | 0.28 | 0.19 | 0.3 | 0.07 | 0.05 | / | 0.27 | 0.08 | / | |
| θ | −1.39 | −1.12 | −0.81 | −0.33 | −0.15 | / | −0.25 | −0.09 | / | ||
Table 8.
Fragility curve parameters considering the different cohesion of the soil properties subjected to near-field and far-field earthquake ground motions.
Table 8.
Fragility curve parameters considering the different cohesion of the soil properties subjected to near-field and far-field earthquake ground motions.
| Field | Fragility Curve Parameters | ϕ = 30° | |||||||||
|---|---|---|---|---|---|---|---|---|---|---|---|
| c = 16 kPa | c = 32 kPa | c = 40 kPa | |||||||||
| DS1 | DS2 | DS3 | DS1 | DS2 | DS3 | DS1 | DS2 | DS3 | |||
| E1 | Near-field | β | 0.46 | 0.45 | 0.32 | 0.71 | 0.51 | 0.49 | 0.46 | 0.52 | 0.47 |
| θ | −2.28 | −1.58 | −1.43 | −2.69 | −2.19 | −1.20 | −2.28 | −2.04 | −1.23 | ||
| Far-field | β | 0.46 | 0.41 | 0.32 | 0.29 | 0.19 | 0.30 | 0.46 | 0.48 | 0.36 | |
| θ | −2.28 | −2.05 | −1.43 | −1.39 | −1.12 | −0.81 | −2.28 | −1.70 | −1.03 | ||
| E2 | Near-field | β | 0.47 | 0.45 | 0.34 | 0.74 | 0.62 | 0.77 | 0.36 | 0.28 | 0.51 |
| θ | −2.26 | −1.67 | −1.41 | −2.47 | −1.94 | −1.43 | −1.97 | −1.50 | −1.02 | ||
| Far-field | β | 0.32 | 0.41 | 0.33 | 0.46 | 0.36 | 0.28 | 0.33 | 0.31 | 0.28 | |
| θ | −1.43 | −2.05 | −1.35 | −2.28 | −1.97 | −0.80 | −1.79 | −1.23 | −0.76 | ||
| E3 | Near-field | β | 0.46 | 0.36 | 0.55 | 0.08 | 0.06 | 0.08 | 0.33 | 0.32 | 0.40 |
| θ | −2.28 | −1.97 | −1.31 | −0.39 | −0.16 | −0.38 | −1.79 | −1.44 | −0.92 | ||
| Far-field | β | 0.30 | 0.33 | 0.32 | 0.42 | 0.28 | 0.43 | 0.28 | 0.24 | 0.26 | |
| θ | −1.89 | −1.79 | −1.29 | −1.71 | −1.36 | −0.93 | −1.39 | −1.03 | −0.67 | ||
Disclaimer/Publisher’s Note: The statements, opinions and data contained in all publications are solely those of the individual author(s) and contributor(s) and not of MDPI and/or the editor(s). MDPI and/or the editor(s) disclaim responsibility for any injury to people or property resulting from any ideas, methods, instructions or products referred to in the content. |
© 2023 by the authors. Licensee MDPI, Basel, Switzerland. This article is an open access article distributed under the terms and conditions of the Creative Commons Attribution (CC BY) license (https://creativecommons.org/licenses/by/4.0/).
Share and Cite
MDPI and ACS Style
Mohammadi, M.; Mosleh, A.; Razzaghi, M.S.; Alves Costa, P.; Calçada, R. Probabilistic Seismic Safety Assessment of Railway Embankments. Appl. Sci. 2023, 13, 598. https://doi.org/10.3390/app13010598
AMA Style
Mohammadi M, Mosleh A, Razzaghi MS, Alves Costa P, Calçada R. Probabilistic Seismic Safety Assessment of Railway Embankments. Applied Sciences. 2023; 13(1):598. https://doi.org/10.3390/app13010598
Chicago/Turabian StyleMohammadi, Mohammadreza, Araliya Mosleh, Mehran S. Razzaghi, Pedro Alves Costa, and Rui Calçada. 2023. "Probabilistic Seismic Safety Assessment of Railway Embankments" Applied Sciences 13, no. 1: 598. https://doi.org/10.3390/app13010598
Note that from the first issue of 2016, this journal uses article numbers instead of page numbers. See further details here.