Dynamic Response Analysis of Soil around Curve Section Tunnel under Train Vibration Load

1
Zhengzhou Metro Group Technology Department, Zhengzhou 450000, China
2
China Railway No. 4 Engineering Group Co., Ltd., Hefei 230023, China
3
College of Geoscience and Engineering, North China University of Water Resources and Electric Power, Zhengzhou 450046, China
*
Author to whom correspondence should be addressed.
Appl. Sci. 2023, 13(14), 8013; https://doi.org/10.3390/app13148013
Submission received: 3 May 2023
/
Revised: 5 July 2023
/
Accepted: 5 July 2023
/
Published: 8 July 2023
Abstract
:To investigate the changes in soil dynamic response around the tunnel periphery under the vibration loads generated by train operation on curved sections, field measurements were carried out to observe void water pressure, water level, and settlement on the ground. Additionally, simulation modeling using MIDAS was employed to simulate and analyze the soil’s dynamic response under the impact of train loads. Based on the track stress diagram combined with the axle weight of the train, the transverse and vertical loads of the track are calculated. The corresponding parameters are entered into the train dynamic load table in the MIDAS/GTS NX dynamic analysis module, so as to simulate the vibration loads of the tunnel. The results show that the application of vibration load is an important reason for the change in pore water pressure during train operation. During the initial stages of train operation, the pore water pressure exhibits a significant increase, followed by a gradual decrease over time. The overall variation follows a seasonal pattern, with the pore pressure increasing as the depth of burial increases. The response of the soil around the tunnel to the vibration of the train is closely related to the location. The closer to the tunnel, the more sensitive the soil is to the vibration of the train, and the greater the amplitude and rate of pore pressure change and vertical deformation in the soil. The variation trend of groundwater level in soil is basically consistent with that of pore pressure, and the groundwater level is proportional to the depth. The dynamic response of the soil at the bottom of the curved tunnel decreases with the increase in the turning radius. The main influence range of the dynamic response is 0~15 m at the bottom of the tunnel. The excess pore water pressure generated by the soil gradually dissipates, and it can be predicted that the vibration of the train will not cause deformation damage to the surrounding soil.
1. Introduction
During the operation of trains on curved sections within tunnels, centrifugal forces are generated. To counterbalance these forces, excessive settlement may occur as a result of the elevated height of the outer rail. This is more likely to occur compared to straight sections. In saturated soils, the pore water pressure is particularly sensitive to the effects of vibration loads. Consequently, it can further cause the soil around the tunnel to become soft, increase the pore water pressure, and even cause soil fluidization, leading to excessive settlement of the underlying soil layer, which has a significant impact on safety. Currently, there are few studies on the response of the pore water pressure in the underlying soil layer caused by the vibration loads of subway trains on curves. The changes in pore pressure within the soil layer directly impact tunnel settlement. Therefore, there is a need to conduct research on the response of pore water pressure to train vibrations on curves and understand the underlying dynamic response patterns.
Recently, there have been notable advancements in research regarding the pore water pressure and dynamic response of the soil surrounding tunnels caused by the vibration loads of underground train vehicles [1,2,3,4,5]. Tang [6,7] conducted indoor GDS tests and corrected the actual field measurement data to obtain the pore water pressure change development model in saturated soft silt under the cyclic vibration load of underground trains, and calculated the soil settlement value caused by the walking load of the train. Dai [8] established a numerical model using the FLAC3D finite difference software, considering the fluid-solid coupling effect, to study the dynamic response characteristics of the soil layer due to the vibration load of underground trains, and analyzed the changes in soil pore water pressure and void ratio during high-speed passage of trains through the tunnel. Xu [9] combined the numerical simulation of ADINA with field experiments to study the development rules of soil settlement and pore water pressure changes in the tunnel and its surrounding soil due to the vibration load of underground trains. Meng [10] used the finite element software ABAQUS to establish a numerical model to study and analyze the deformation of soil mass in horizontal and vertical directions at different distances between the soil layer around the tunnel and the tunnel. Lei [11] took the saturated clay in Tianjin as the research object, carried out an indoor cyclic triaxial undrained test, and analyzed the dynamic response of saturated clay under the intermittent action of cyclic load. Wang [12] used a dynamic model based on multi-body mechanics and finite element methods to study the dynamic response of a low-speed magnetic levitation vehicle on an overhead track in a small radius curve. The model considered the vibration behavior of the track key components and the space dynamic magnetic field effects. The research and analysis of the dynamic response of the vehicle-track coupling system in a small radius curve were conducted. Bian [13] established a coupling dynamic analysis model of the vehicle-track-foundation system using a 2.5D thin layer element finite element model, and derived the equation of the rolling interaction force between the wheel and rail considering the irregular track surface. Taking the Beijing–Shanghai high-speed railway as the research background, the new high-speed railway track was found to have good track linearity due to the application of grinding operations, and the vehicle parameters determined the dynamic response characteristics of the track structure. Zhou [14] proposed an effective method for predicting train-induced vibrations in circular tunnels within porous elastic half-space. This method was applied to investigate soil vibrations caused by train loads on tracks and simple harmonic loads.
In addition to this, numerous studies have been conducted by scholars abroad. Cary [15] studied the response of soil pore water pressure under saturated and unsaturated conditions through triaxial tests, and proposed a model that could predict the accumulated excess pore water pressure under saturated and unsaturated conditions. Jones [16] established a two-dimensional finite element vibration propagation model to study the influence of vibration propagation in the frequency range below 200 Hz in dug and drilled tunnels. Gardien [17] proposed a modular model composed of three sub-models: the propagation model, orbit model, and static deflection model. The propagation model has also been used to study the effects of parameters such as soil stiffness, mesh size, boundary conditions, damping, and finite element analysis techniques on the vibration characteristics of a subway tunnel in Japan. Clouteau [18] established an efficient modular numerical model for predicting the impact of vibration and radiated noise of subway trains on adjacent buildings in existing and new tunnels. The object of this study is a shallow buried tunnel in Paris. The dynamic response of soil mass and tunnel is analyzed using Floquet transform. Gupta [19] used a coupled periodic boundary-finite element model for the numerical modeling of the London Underground Bakerloo Tunnel. The model is induced by underground railway, and the interaction among soil, tunnel, track, and train is fully considered. The free field vibration of trains traveling at different speeds is predicted, and the results are compared with the measured results. The results show that the coupled periodic finite element model with boundary is suitable for the practical prediction of subway vibration. Xia [20] used a Line 3 curve segment of the Hangzhou metro under a middle school as an engineering background, using the finite element software ABAQUS train-track-vehicle vibration response research system coupling model. By using finite element software MIDAS to establish a double-parallel curve tunnel, hole-soil-pile 3D model structure, Xia calculated the vibration response of the subway train runtime. The propagation mode of the vibration wave generated by the subway in the foundation soil and the dynamic response characteristics of the building were analyzed, and the vibration comfort of the building was evaluated according to the relevant environmental vibration control standards. Ngamkhanong [21] investigated the effects of ground vibration generated by high-speed trains on mast structures by combining finite element models with semi-empirical formulas. The results indicate that the transverse effects of train-induced vibrations on mast structures are more significant than the longitudinal effects. Li [22] demonstrated the practical impact of dynamic material properties on train-track vibration interaction based on the principles of multibody simulation and the finite element method using LS-DYNA. The study confirmed that dynamic material properties have a significant influence on the interaction between train and track vibrations when the train speed exceeds 70 km/h. In order to analyze the accelerated track degradation caused by variations in track stiffness and increased dynamic wheel loads, Ramos [23] developed a hybrid method that combines 3D finite element modeling with empirical settlement equations in an iterative manner. This method enables the simulation of the degradation process of ballasted tracks. Yaseri [24] established a three-dimensional calculation model by using the scaled proportional boundary finite element method (SBFEM) to study the dynamic response of tunnel structures and soil under train vibration load. In order to fully understand the development law of pore water pressure and its influence on tunnel settlement, it is necessary to carry out long-term field monitoring. Based on the first-phase project of Zhengzhou Rail Transit Line 1, this project conducts real-time monitoring of pore water pressure and water level under the subway vibration effect, studies the deformation law of the soil layer at the bottom of the tunnel caused by the change in pore water pressure under the train vibration load, and analyzes the response characteristics of pore water pressure in the soil layer around the tunnel caused by the subway vibration load in the small-radius curve section. The obtained data are integrated to provide a basis for the safety evaluation of subway train operation.
2. Engineering Overview and Monitoring Point Layout
The Nongye Road–Dongfeng Road station interval of the Zhengzhou Metro Line 1 phase 1 features a small radius curve, specifically with a radius of 350 m. The tunnel is buried under a sandy layer. Since its opening on 28 December 2013, the cumulative settlement range in the area has been recorded as 63.83–84.54 mm, which is notably higher compared to the settlement observed in the adjacent straight section. At the same time, the adjacent settlements of the upper and lower tunnels in this interval are not consistent, with a maximum difference of about 27 mm, and there is a trend of further settlement. Therefore, the test site was selected in the shield tunnel interval of the Nongye Road station–Dongfeng Road station interval on the Zhengzhou Metro Line 1. The terrain of the test site is level, with a ground elevation of 87.9–89.8 m.
Based on the geological investigation report, the terrain of the area is the Yellow River channel and alluvial plain, and there are no special rock and soil types within the site. The exposed strata in Zhengzhou are all Quaternary strata, and the deposition time is from Lower Pleistocene to Holocene. The total thickness of the layer is 50–200 m. From southwest to northeast, the layer thickens from a thin bed and is in unconformable contact with the underlying Tertiary strata. The stratigraphic lithology in this area is mainly composed of Quaternary Holocene (Q4) strata with a depth of 30 m, silty soil (slightly dense to medium dense) and silty clay with a depth of 0–20 m, containing silty sand and fine sand, and medium dense to dense fine sand with a depth of 20–30 m. The strata in the 30–50 m depth range are mainly silty clay (plastic-hard plastic) in the Upper Pleistocene (Q3) of the Quaternary System. Silty sand (dense), mainly yellowish brown, with few calcium nuclei and iron rust spots. The tunnel is mainly located in silty clay, silty sand, medium sand stratum. The buried depth of the site’s groundwater level is 9.37–15.4 m, and the groundwater is mainly stored in silty clay, silt, and silty soil layer below 9 m.
The pore water pressure testing elements were selected from the ATJ-3030 type pressure water level meters produced by the Sichuan Aojitao Company, providing a measurement accuracy of ±0.05% F·S. Since Line 1 has been put into operation, a total of 11 monitoring points have been set up along the subway line at the tunnel bottom, all at the same horizontal level. Among these points, K3 and K11 were selected for layering layout, with an additional three vertical monitoring points added to obtain data at different depths and different layers. According to the on-site exploration, the specific locations of the monitoring points are shown in Figure 1, and the geological profile is shown in Figure 2. The information on the location of the monitoring points is shown in Table 1.
3. Analysis of Pore Water Pressure Response to Vehicle-Induced Vibration Loads
3.1. Analysis of In Situ Pore Pressure Monitoring Results
Figure 3 and Figure 4 shows the changes in pore water pressure observed at both manual and automatic monitoring points. From the 12 manual monitoring points depicted in Figure 3, it can be seen that the overall trend of pore water pressure is a gradual decrease. During the period from 23 March to 24 March, all monitoring point values experienced a significant change, but after 24 March, they tended to stabilize. This is due to the impact of construction disturbance caused by the initial installation and debugging of the pore water pressure sensors on the value of pore water pressure. In the subsequent days, the accumulated pressure resulting from the construction disturbance will gradually dissipate, leading to a return of the data at each monitoring point to its normal level. Of the 12 manual monitoring points, the pore water pressure values at K2, K4, K6, K7, K8, K9, K10, and K11-4 during the period from 18 April to 23 May showed an ascending trend followed by a descending trend, while the remaining four points showed a descending trend overall. From 23 May to 18 July, all monitoring points were basically in a slow downward trend. Although the monitoring values at the 12 manual monitoring points sometimes showed an ascending trend on a single day due to a decrease in temperature or an increase in groundwater level caused by thunderstorms, the magnitude was usually very small, and the daily rise was not enough to make up for the previous decline, resulting in an overall downward trend.
Based on the development of pore water pressure at the automatic monitoring points shown in Figure 4 and the monitoring data, it can be seen that the pore water pressure monitoring values at K1, K3-2, K3-3, K3-4, and K5 are overall in a downward trend. It can be seen from the daily monitoring curves that the development of pore water pressure at these five automatic monitoring points shows a trend of increasing first, decreasing later, and then slightly increasing. This is due to the fact that during the day, the subway is in operation, which applies vibration loads to the underground soil, causing an increase in pore water pressure. As the frequency of subway trains decreases, the load on the soil also reduces gradually, leading to the gradual dissipation of pore pressure. Finally, during the night, the temperature drops and the groundwater level rises, resulting in a small increase in pore water pressure at each monitoring point. From the overall development situation, during the period from 23 March to 24 March, all of the automatic monitoring points experienced a significant change in pore water pressure values, and during the period from 24 March to 15 July, the groundwater level and pore water pressure values overall showed a downward trend, although there were occasionally recoveries due to rainfall.
Overall, there was a noticeable seasonal variation, particularly in the second quarter, characterized by improved weather conditions with rising temperatures and reduced rainfall. These changes contributed to a significant decrease in groundwater levels and pore water pressure. However, the rate of decline in pore water pressure and groundwater levels after 24 March varied depending on the depth of burial, with the deeper K3-4 and K11-4 points experiencing smaller rates of change, while other shallow points experienced greater rates of change. It is expected that during the flood season, the pore water pressure and groundwater levels will rise, and may return to their initial values in the fourth quarter.
3.2. Analysis of Excess Pore Water Pressure Response
The monitoring values of manual and automatic monitoring points are relatively close to the static water pressure values (excess pore water pressure) generated by the detected water level difference, as shown in Figure 5 and Figure 6. In most times, the difference is within 0.7 kPa, with the exception of the K9 monitoring point and various points before 10 April, which may generate relatively large excess pore water pressure. The maximum excess pore water pressure is divided into three stages: the first stage is from 26 March to 10 April, during which the maximum excess pore water pressure is not stable; the second stage is from 10 April to 18 July, during which the maximum excess pore water pressure is relatively stable around 0.34 kPa; the third stage is from 20 July to 26 September, during which the maximum excess pore water pressure of automatic monitoring points is similar to the second stage, and the maximum excess pore water pressure of manual monitoring points shows significant fluctuations. Due to the heavy rain disaster on 20 July, the third stage from 20 July to 15 September, the Zhengzhou metro was in maintenance and debugging mode, and the results have little reference value.
3.3. Variation Patterns of Pore Pressure at Different Depths under Vibration Loads
During train operation, the response of the pore water pressure sensors buried at different depths to the changes in pore water pressure caused by the subway vibration is different. Taking May 3rd as an example, Figure 7 shows the daily pore water pressure monitoring data at the K3-2 monitoring point, and the train operating schedule. The first train arrived at the monitoring point around 6:07, and the pore pressure was detected by the instrument. The pore pressure detected at this time was static water pressure with a value of 148.869 kPa. The pore pressures detected in the next three minutes were 148.874 kPa, 148.884 kPa, and 148.879 kPa, with excess pore water pressures of 0.005 kPa, 0.015 kPa, and 0.01 kPa, respectively. The excess pore water pressure detected during the first pass at the K3-2 monitoring point was 0.015 kPa. After the train passed, the excess pore water pressure slowly disappeared.
Due to the accuracy of measurement, it is not possible to determine the peak value of excess pore water pressure with certainty. However, by reviewing the entire day’s monitoring data at the K3-2 monitoring point, it can be seen that after train operations, there are constantly occurring peaks of excess pore water pressure that are generated and dissipated, and the values are not significant. The maximum excess pore water pressure tested that day was 0.265 kPa. The pore water pressure fluctuated between 148.582 kPa and 149.134 kPa, and gradually decreased in the afternoon period without any apparent accumulation of pore pressure. This is because the time interval between trains allows for the dissipation of excessive pore water pressure before the arrival of the next train.
As the train vibration load is applied, the pore pressure at K3-2 and K3-3 rapidly increases and reaches a peak in a short time. After the night train stops operating, the pore pressure at K3-2 shows a slow upward trend, but at K3-3, the pore pressure remains in a fluctuating state after the train stops operating, as shown in Figure 8. The pore pressure at K3-4 gradually increases with time, and the groundwater level at this point is also rising. A small downward trend is observed in the morning peak period (8:00–10:30) and evening peak period (20:00–21:00), considering the peak hours and a certain time delay effect, as shown in Figure 9. According to the distribution of each layer in this small radius interval, it can be known that K3-2 is located in the silty soil and silty sandy soil layer, while K3-3 is located in the silty sand layer, and K3-4 is located in the silty soil. This indicates that the silty sand layer is more susceptible to the impact of train vibration.
Based on the above, it can be inferred that the response of the soil surrounding the tunnel to train vibration loading is closely related to the location, and the sensitivity of the response increases the closer the soil is to the tunnel. After exceeding a certain depth range, the disturbance impact of train vibration on the soil gradually decreases, and the soil is more affected by changes in groundwater level and rainfall. The pore pressure in the soil is basically the same as the static water pressure at the same depth, and it increases as the depth increases.
3.4. Analysis of Groundwater Level Response
The groundwater level changes at each monitoring point are shown in Figure 10. It can be seen that before the 20 July 2022 heavy rain in Zhengzhou, the overall groundwater level at each monitoring point was in a slow downward trend, and there were occasional recoveries during the period due to rainfall. The trend of groundwater level change at each point closely corresponds to the trend of pore pressure change, with the rate of decrease varying depending on the burial depth. Among them, the K3-4 and K11-4 points with deeper burial depth have a smaller rate of change, while the other shallow burial depth points have a larger rate of change. This is because due to the impact of train vibration loading, the response of the soil is more sensitive the closer it is to the tunnel. After exceeding a certain depth range, the disturbance impact of train vibration on the soil gradually decreases, and it is more affected by rainfall. The groundwater level in the soil is proportional to the depth.
3.5. Analysis of Settlement Response
In order to study the variation in the vertical displacement of the metro line bed over time under vibrating train loads, a Trimble DiNi03 electronic level (Accuracy 0.3 mm/km) was used to make on-site observations of the vertical displacement of the bed. The settlement observation results of the downstream line of Nongye South Road Station–Dongfeng South Road Station monitored by the first-phase operation of Zhengzhou Rail Transit Line 1, shown in Figure 11, indicate that the monitoring points along the route exhibit fluctuations with both downward and upward trends, and there are both subsidence and uplift. Compared with the observation area of the adjacent straight section, the curve section (C32~36) of the project shows greater downward shift and a larger range of fluctuations. With the increase in train operation time, the overall downward shift amount of each monitoring point gradually decreases. The tunnel settlement is reduced from 1.5 mm to 0.5 mm during train operation and the resulting track unevenness is more moderate and the deteriorating effect on wheel-rail dynamics is weaker, so the displacement caused by vibration is safe for vehicle operation.
3.6. Characteristics of Soil Pore Water Pressure under Train Operation Conditions
According to the effective stress principle proposed by Terzaghi, it can be inferred that the effective stress and pore water pressure in a saturated soil always should equal the total stress in the saturated soil. The relationship should satisfy the following equation: σ = σ′ + μ, where σ is the normal total stress in a plane, σ′ is the effective normal stress in a plane, and μ is the pore water pressure. Therefore, in order to increase the effective stress in a saturated soil, it is generally beneficial to improve soil drainage, allowing for faster dissipation of pore water pressure induced by vibrations. Based on the previous analysis of the pore water change curve, it can be inferred that the pore water pressure changes gradually with time and gradually dissipates. Assuming that the total stress σ remains constant, the effective stress σ′ increases, and the volume of the soil gradually decreases, while the strength also increases. The increase in effective stress causes a new stress balance to be established, and the effective stress increases, resulting in the soil skeleton being compressed and ground settlement occurring.
4. Model Establishment
4.1. Establishment of Three-Dimensional Finite Element Model for Subway
4.1.1. Geometric Dimensions
A study was conducted on the effect of pore water pressure in the surrounding soil of the subway tunnel during one-way operation. As the foundation soil is a semi-infinite space, a certain range of the soil mass is usually selected for finite element calculation. According to the soil distribution of the subway tunnel section of the Zhengzhou metro line 1, the simulation calculation range was set to be 120 m × 90 m × 68.3 m (X × Y × Z). The geometric model is shown in Figure 12, where the tunnel diameter is 6 m and the tunnel buried depth is 15–20 m. The bottom of the model was set as a fixed condition, allowing for no displacement. The top was not constrained, and the four sides were set as free field boundaries. The boundaries between different soil masses were set as drainage boundaries, and the contact between the lining and the soil mass was set as a non-drainage surface. In addition, consider that the groundwater level is 9 m underground.
4.1.2. Selection of Material Parameters
A three-dimensional numerical model of the coupled roadbed-tunnel-soil was developed based on the finite element software MIDAS. The simulated soil parameters are given in the geological survey report, and the soil layers in the study area are simplified into eight layers by weighted average of thickness, which are used as the soil layer parameters for the numerical model. Detailed soil parameters are shown in Table 2 below. The lining and the ballast bed were simulated using an elastic model, and the other soil layers were simulated using the Mohr–Coulomb constitutive model in GTS NX.
4.2. Simulation and Application of Train Vibration Loads
4.2.1. Simulation of Train Vibration Loads
The train of the Zhengzhou Metro Line 1 adopts a four-action, two-drag, six-section, marshalling B-type car with a gauge of 1435 mm. In this study, the fully loaded train condition is considered. Based on the vibration load characteristics of the train, the train loads are divided into horizontal loads and vertical loads. Additionally, the centrifugal force caused by the track superelevation acts on the ballast bed. The force distribution on the track is shown in Figure 13. Considering the current design of Zhengzhou Metro Line 1, this study focuses on the assumption of raising the outer track by a superelevation of 150 mm.
Fx = F·cosθ−G·sinθ,
Fz = F·cosθ + G·sinθ,
F = Mv2/R
In the equation, Fx represents the lateral force caused by track superelevation, and Fz represents the vertical force caused by track superelevation.
Based on different load conditions of the train, different axle loads are selected and applied as moving loads to the model. Considering an axle load of 13t, the load conditions are shown in Table 3.
4.2.2. Application of Train Vibration Loads
According to the relevant information, it is known that the Zhengzhou Metro operates for 16 h a day with a train interval of approximately 5 min for the two trains, resulting in a total of 192 train operations per day. Since the metro train operates in a 6-car formation, the number of vibrations at the same location is approximately 4608 times per day, around 140,000 times per month, and approximately 1.68 million times per year. When calculating, the train operating speed is assumed to be 80 km/h, and considering the model scale, the average duration of each cyclic load application is 5 s. Using the MIDAS numerical simulation software, the vibration load curve for a 5 s duration of the train was determined for a tunnel curve radius of R = 350 m and train operating speed of v = 80 km/h, as shown in Figure 14.
5. Analysis of Computational Results
5.1. Comparison between Simulation Results and Experimental Measurements
Four reference points were selected at locations identical to monitoring points K3-1, K3-2, K3-3, and K3-4, to analyze the response characteristics of pore water pressure. The locations of the reference points are shown in Figure 15.
The calculation results are shown in Figure 16. Under the assumption of solely considering the impact of train vibration loads and not accounting for the effects of temperature increases or rainfall, the pore pressure at each reference point experienced a slight increase after the application of vibration loads. Subsequently, it gradually returned to its original value and fluctuated within a certain range before eventually stabilizing. The magnitude of pore pressure changes at different depths below the tunnel floor, and decreased gradually with increasing depth down the vertical direction as the distance from the tunnel decreased. Away from the tunnel, the pore pressure changes decreased and the changes in speed slowed down. The pore pressure in the soil is proportional to the depth, so the larger the depth, the greater the pore pressure. The overall trend in changes in reference and measured points is basically consistent, and at K3-4, the absolute value of the average relative error of pore pressure is about 8%, within a reasonable range, verifying the reliability of the model. However, the numerical simulation results in this paper show a slightly smaller magnitude of change than actual measurements. This may be due to factors such as changes in groundwater levels due to temperature increases, rainwater precipitation, and the fact that the numerical model uses a single-tube, single-track tunnel structure, while the actual condition is a double-tube, single-track tunnel structure.
5.2. Analysis of Pore Water Pressure
For analyzing the pore water and deformation responses following the application of a single load, six nodes were selected at depths of 0, 2, 5, 8, 15, and 25 m below the tunnel foundation as analysis points.
The pore pressure response characteristics of the soil during a single load application are shown in Figure 17. During the first 10 s after applying train vibration loads to the ballast bed, the pore pressure at analysis points 0, 2, 15, and 25 m away from the tunnel rapidly increased and then fluctuated constantly. After the train passed, the pore pressure at each point decreased to different degrees, and the pore pressure at the two farthest points decreased to below their initial values and then rebounded. Finally, all points returned to their initial levels. The pore pressure changes at 5 and 8 m away from the tunnel followed an opposite trend, decreasing first and then fluctuating within a certain range before returning to their initial levels and stabilizing. Considerable time lags and differences in soil properties may have affected the pore pressure changes. The magnitude of pore pressure changes at different depths below the tunnel floor decreased gradually with increasing depth down the vertical direction, due to the smaller impact of train vibration at greater distances from the tunnel. Away from the tunnel, the pore pressure changes decreased, and the changes in speed slowed down, eventually reaching stability. The pore pressure in the soil is proportional to the depth and is approximately equal to the static water pressure at the same depth.
5.3. Analysis of Vertical Deformation Response
From Figure 18, it can be observed that under the influence of train vibration loads, areas with larger vertical displacements are mostly located near the tunnel, with smaller settlements as the distance from the tunnel increases. Among them, the maximum vertical displacement is the smallest at the top of the tunnel, measuring approximately 1.035 mm. The maximum vertical displacements on both sides of the tunnel arch are almost equal, measuring 1.038 mm and 1.039 mm, respectively. The maximum vertical displacement is the largest at the bottom of the tunnel, measuring approximately 1.054 mm.
Selecting nodes located directly beneath the tunnel at distances of 0 m, 2 m, 5 m, 8 m, 15 m, and 25 m from the tunnel base, the vertical deformation responses after a single load are studied. The vertical deformation of the analysis points after a single load is shown in Figure 19 and Figure 20. Under the influence of train vibration loads, areas with larger vertical displacements are mostly located near the tunnel, with smaller settlements as the distance from the tunnel increases. The locations with the maximum settlements are concentrated at the top and bottom of the tunnel. Among them, the smallest maximum vertical displacement occurs at the top of the tunnel, and the maximum vertical displacements on both sides of the tunnel arch are almost equal. The largest maximum vertical displacement occurs at the bottom of the tunnel.
The vertical deformation trends are similar in the vicinity of the tunnel and within the soil mass, while the vertical deformation trend at the ground surface is significantly different. This trend indicates that when the train vibration loads act on the tunnel, the vertical deformation around the tunnel undergoes much larger variations compared to the vertical deformation at the ground surface. At the same time, the maximum vertical displacements occurring around the tunnel are also much larger than those occurring at the ground surface. From Figure 19 and Figure 20, it can be observed that the peak vertical deformation, amplitude of fluctuation, and attenuation rate decrease as the distance from the point of vibration load application increases. At the base of the tunnel, the peak vertical deformation is 1.054 mm, while at distances of 2 m, 5 m, 8 m, 15 m, and 25 m from the tunnel base, the peak vertical deformations decrease to 0.963 mm, 0.844 mm, 0.762 mm, 0.557 mm, and 0.342 mm, respectively, representing reductions of 8.6%, 19.9%, 27.7%, 47.2%, and 67.6%, respectively. Furthermore, the vertical displacement after a single load applied to the tunnel exhibits a rebound trend, and all analysis points show displacement rebound after reaching the maximum vertical displacement. In terms of the magnitude of rebound after reaching the maximum vertical deformation, the farther the point is from the location of vibration application, the slower the rebound velocity and the flatter the trend. Combining the analysis of pore pressure discussed earlier, it can be concluded that the locations where the variation amplitude and rate of pore pressure are greater in the bottom soil layer of the tunnel correspond to larger vertical deformations in the soil mass.
5.3.1. Vertical Deformation under Different Curve Radii
The vertical deformation variations after a single load at different curve radii while maintaining a constant speed of 80 km/h are shown in Figure 21 and Figure 22. When the train vibration load acts on the ballast bed, the vertical deformation of the soil mass decreases with an increase in the tunnel curve radius. After a single load is applied to the tunnel, a rebound trend is observed in the vertical deformation, and displacement rebound occurs after reaching the maximum vertical displacement for different curve radii. In terms of the magnitude of rebound after reaching the maximum vertical deformation at each node, the smaller the tunnel curve radius, the slower the rebound velocity and the flatter the trend.
The peak vertical deformation and attenuation rate decrease with an increase in the depth distance from the tunnel base. Smaller curve radii result in larger vertical displacement fluctuations in the soil mass at the tunnel bottom. Additionally, larger curve radii lead to smaller peak vertical displacements in the soil at the tunnel bottom. As the curve radius increases, the peak vertical deformation at the tunnel base gradually decreases, and the maximum settlement difference under different curve radii is 0.045 mm. This is because in tunnels with smaller curve radii, the lateral load caused by the subway train increases, resulting in larger soil settlement. The farther away from the tunnel, the smaller the disturbance caused by subway vibrations. Therefore, the magnitude of vertical deformation peak decreases with distance from the tunnel, eventually stabilizing. The influence of different curve radii on the soil layers beneath the tunnel is mainly concentrated within 0–15 m. When the distance from the tunnel base exceeds 15 m, the variation trend and peak of vertical deformation become consistent under various working conditions. The curve radius of the tunnel affects the vertical deformation of the soil at the tunnel base.
The vertical deformation trends and patterns in different sections of the tunnel, including straight sections and curved sections, are consistent. However, the vertical displacements in the straight sections are smaller than those in the curved sections. This is because centrifugal forces are generated when the train runs through curved sections with smaller radii. In order to balance the centrifugal force, the outer rail superelevation will be set at design time. The lateral load induced by the subway train increases, resulting in larger settlements compared to straight sections.
5.3.2. Vertical Deformation at Different Velocities
The vertical deformation variations after a single load at different speeds while maintaining a curve radius of 350 m are shown in Figure 23 and Figure 24. When the train vibration load acts on the tunnel, rapid vertical deformation occurs in the soil mass, followed by fluctuation around the peak vertical deformation and a subsequent rebound trend. After the rebound, the vertical deformation in all working conditions rises upwards and then stabilizes back to the initial level. From the perspective of fluctuation after reaching the maximum vertical deformation at each node, higher speeds result in smaller amplitude and shorter duration of fluctuations, and the deformation rebounds earlier.
The peak vertical deformation decreases with an increase in the depth distance from the tunnel base, and higher speeds lead to larger vertical deformation variations in the soil at the tunnel bottom. Additionally, as the train speed increases, the peak vertical deformation in the soil at the tunnel bottom also increases. The maximum vertical deformation peak differs by 0.077 mm under different speeds. Beyond 80 km/h, not only does the vertical load on the track increase, but the ballast bed also needs to provide centripetal force to maintain the balance of the train body. Therefore, it experiences greater horizontal loads. The increased train load leads to increased soil displacement. Therefore, it is important to pay attention to the speed of the train during cornering to prevent excessive tunnel settlement caused by high speeds. It is recommended to maintain a speed of 60–80 km/h for subway trains when passing through tunnels with smaller curve radii.
5.4. Settlement Comparison
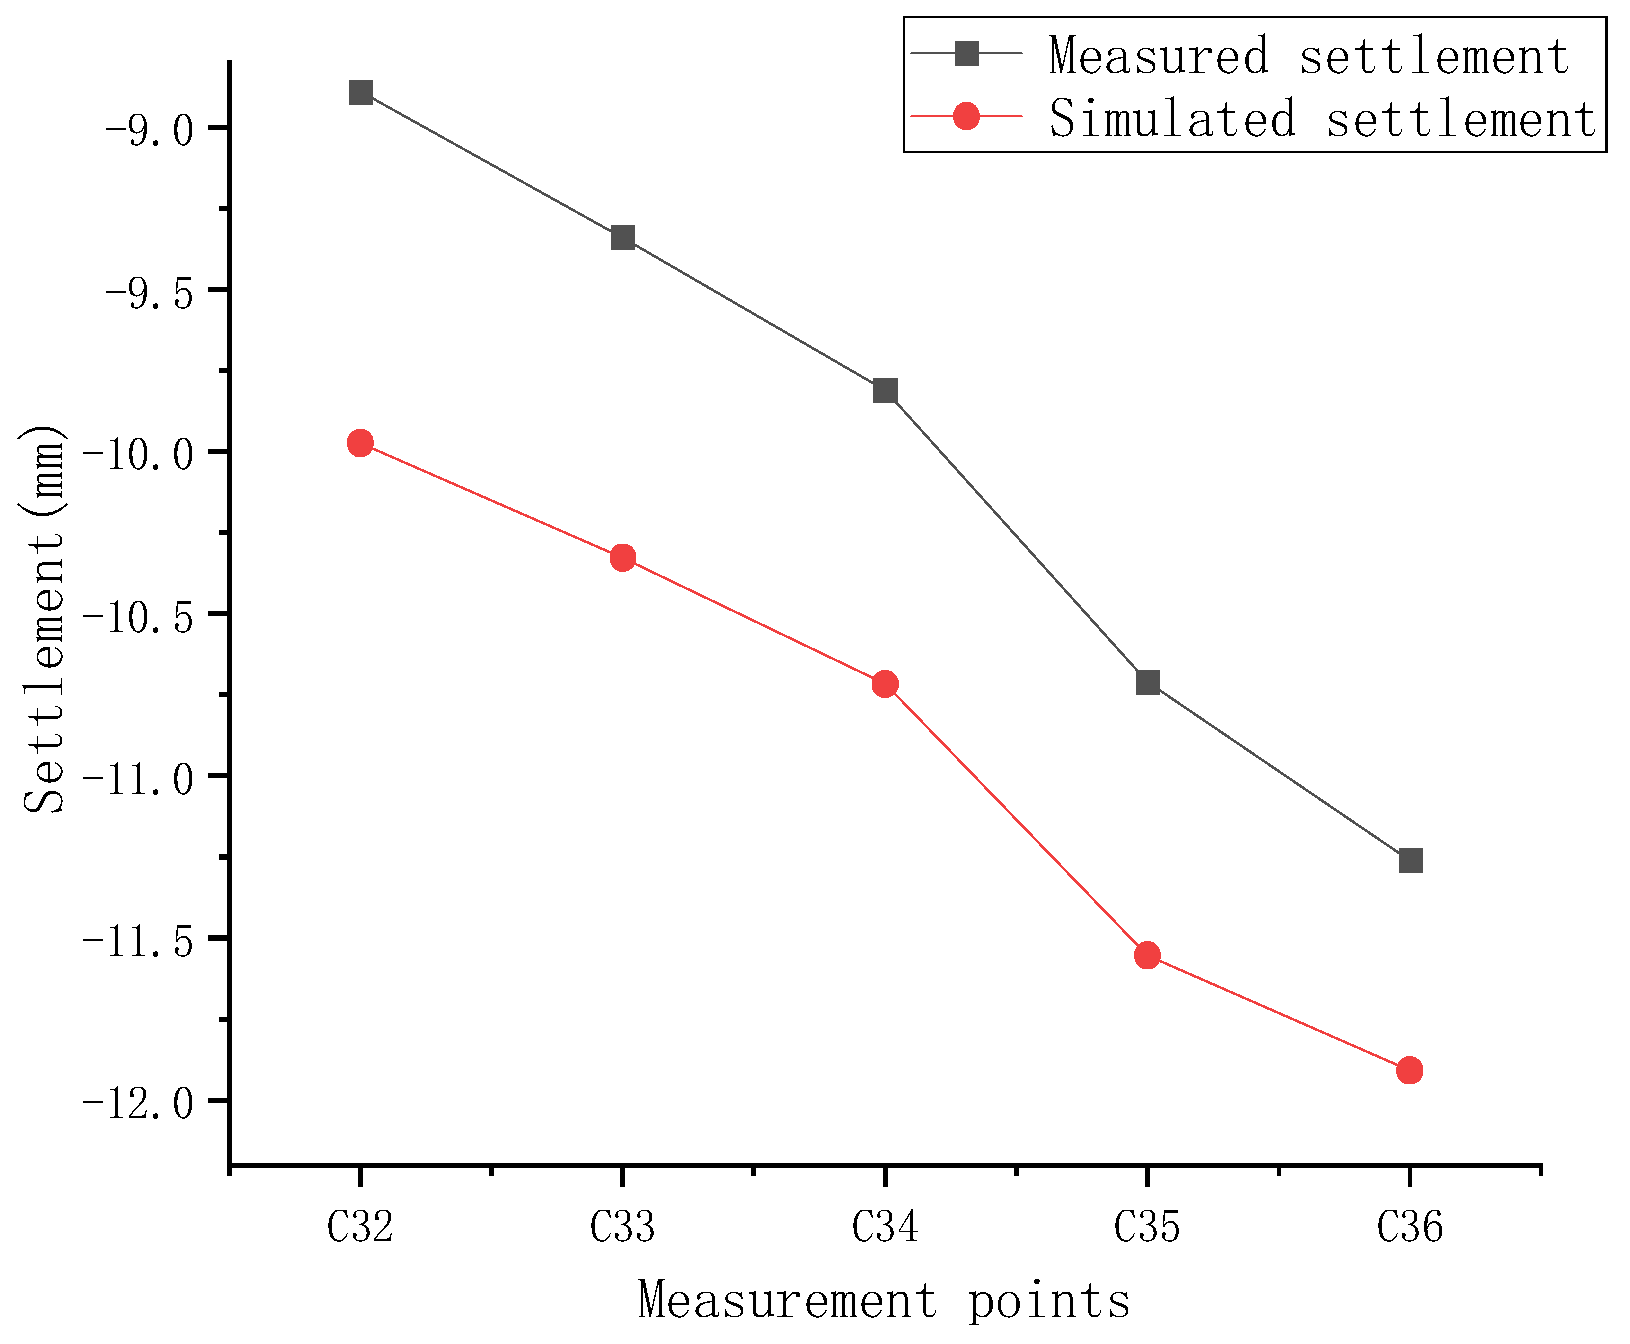
Four reference points were selected at the same locations as settlement monitoring points C32, C33, C34, C35, and C36. The simulated settlement values one year after the opening of subway train operation were compared with the measured settlement values one year after the opening of the uphill tunnel with a curve radius of 350 m. The comparison is shown in the following Figure 25.
It can be observed that the settlement values gradually increase along the subway route, and the change trend is generally consistent. The absolute average relative error between the simulated settlement values and the measured settlement values is 8.20%, which is within a reasonable range, thus verifying the reliability of the model. However, the magnitude of settlement variation in the numerical simulation results is slightly smaller. This is attributed to the analysis of simulated settlement calculations from the perspective of engineering precision, assuming that soil consolidation has been completed and neglecting consolidation settlement caused by dissipation of pore water pressure. In the actual operational process, apart from cumulative plastic deformation caused by train vibrations, there is also a small amount of consolidation settlement. It is also possible that the discrepancy arises from the fact that the actual scenario involves a dual-tube single-track tunnel structure, while the numerical model assumes a single-tube single-track tunnel structure.
6. Conclusions
In this paper, through the combination of field monitoring, numerical simulation and theoretical analysis, the dynamic response of the soil layer around the tunnel under the train vibration load is studied, and the conclusions are as follows:
- During the initial stage of train operation, the pore water pressure is relatively high. However, as time passes, the pore pressure gradually decreases. Overall, there is a seasonal trend, with the weather warming up in the second quarter, the temperature rising, and rainfall reducing, leading to a significant drop in water level and pore pressure. The rate of decrease in pore pressure and water level differs depending on the depth of burial, with deeper monitoring points showing smaller changes in rate, and shallower monitoring points showing larger changes in rate;
- Under the action of train vibration load, the response of the soil surrounding the tunnel is closely related to the location, and the response becomes more sensitive the closer it is to the tunnel. After exceeding a certain depth range, the disturbance effect of train vibration on the soil gradually reduces and is more affected by changes in groundwater level and rainfall. The pore pressure in the soil is basically the same as the static water pressure at the same depth, and is proportional to the depth;
- The trend of groundwater level change in the soil is basically consistent with the trend of pore pressure change, and the groundwater level is proportional to the depth;
- Under the action of subway vibration load, the closer to the bottom of the tunnel the curves are, the greater the amplitude and rate of change of pore pressure, and the greater the vertical deformation. The vertical deformation response of the bottom soil of the small radius curve tunnel under the action of different train running speeds decreases with the increase in the distance from the tunnel and increases with the increase in the speed. The dynamic response of the soil at the bottom of the tunnel decreases with increasing depth and radius of curvature, and the main impact range of the dynamic response is 0–15 m below the bottom of the tunnel.
The above research results can provide the basis for the safety evaluation of subway train operation in small radius curve sections.
Author Contributions
Conceptualization, L.S., J.Z. and X.W.; Methodology, L.S.; Software, W.Q.; Formal analysis, J.Z.; Resources, L.S.; Writing—original draft, W.Q., D.H. and X.W.; Supervision, J.Z. and X.W. All authors have read and agreed to the published version of the manuscript.
Funding
This research was funded by the National Natural Science Foundation of China (No. 51309100), Science and Technology Project of Henan Province (No. 222102320135).
Institutional Review Board Statement
Not applicable.
Informed Consent Statement
Not applicable.
Data Availability Statement
Not applicable.
Conflicts of Interest
The authors declare no conflict of interest.
References
- Fan, Y.; Su, Y.; Yuan, Y.; Yao, X.P. Study on the surface subsidence law of composite formation double-line subway tunnel construction. J. Undergr. Space Eng. 2020, 16, 762–768+789. [Google Scholar]
- Zhang, B.W.; Qian, W.P.; Qi, T.Y.; Xiang, Z.R.; Wang, Y. Settlement prediction and safety control of subgrade through high-speed railway under urban subway. J. Undergr. Space Eng. 2021, 17, 282–289. [Google Scholar]
- Yao, Z.X.; Liu, Y.X.; Zhang, Z.X.; Zeng, Z.Y.; Deng, L.Z. Study on dynamic response of group tunnel under the action of overlying surface. J. Undergr. Space Eng. 2022, 18, 1363–1373. [Google Scholar]
- Zhang, X.W.; Wang, C. Analysis of surrounding rock stability and surface settlement in weak layered foundation tunnel. J. Undergr. Space Eng. 2022, 18, 396–403+411. [Google Scholar]
- Yang, W.B.; Li, L.G.; Dai, Z.R.; Xu, C.Y. Analysis of the environmental impact of shield tunnel operation in water-rich pebble land layer. J. Undergr. Space Eng. 2018, 14, 1709–1716. [Google Scholar]
- Tang, Y.Q.; Zhang, X.; Zhao, S.K.; Wang, J.X.; Zhou, N.Q. Hole pressure development model of saturated soft clay around the tunnel under subway vibration load. J. Civ. Eng. 2007, 4, 82–86. [Google Scholar]
- Tang, Y.Q.; Luan, C.Q.; Zhang, X.; Wang, J.X.; Yang, P. Numerical simulation of tunnel soil deformation under subway vibration load. J. Undergr. Space Eng. 2008, 4, 105. [Google Scholar]
- Dai, L.F.B.; Wang, G.D.; Gao, B. Study on Sand liquefaction around Tunnel. J. Undergr. Space Eng. 2012, 2, 434–438. [Google Scholar]
- Xu, Y.; Xu, J.L.; Dai, J.; Xu, C.S.; Cui, C.Y.; Meng, K. Study on pore water pressure and deformation characteristics of tunnel bottom under the vibration load of subway train. Tunn. Constr. 2018, 38, 1785–1792. [Google Scholar]
- Meng, G.; Zhang, J.X.; Wu, T.L. Numerical Simulation of Tunnel Soil formation under Subway Load. J. Tianjin Urban Constr. Coll. 2012, 18, 103. [Google Scholar]
- Lei, H.Y.; Yang, X.N.; Xu, Y.G.; Zhang, L. Dynamic property test of saturated remodeling clay under intermittent cyclic load conditions. J. Tianjin Univ. (Nat. Sci. Eng. Technol. Ed.) 2021, 54, 799–806. [Google Scholar]
- Wang, X.P.; Li, G.F.; Mu, X.L.; Wang, H.B.; Jin, Z.Y.; Ding, W.C. Dynamic response analysis of the low-speed maglev vehicle-orbit coupling system in the small radius curve. Vib. Impact 2022, 41, 81–89+105. [Google Scholar]
- Bian, X.C. Track and ground vibrations generated by high-speed train running on ballastless railway with excitation of vertical track irregularities. Soil Dyn. Earthq. Eng. 2015, 76, 29–43. [Google Scholar] [CrossRef]
- Zhou, S.; He, C.; Di, H. An efficient method for predicting train-induced vibrations from a tunnel in a poroelastic half-space. Eng. Anal. Bound. Elem. 2017, 85, 43–56. [Google Scholar] [CrossRef]
- Cary, C.E.; Zapata, C.E. Pore Water Pressure Response of Soil Subjected to Dynamic Loading under Saturated and Unsaturated Conditions. Int. J. Geomech. 2016, 16, D4016004. [Google Scholar] [CrossRef] [Green Version]
- Jones, C.J.C.; Thompson, D.J.; Petyt, M. A model for ground vibration from railway tunnels. Proc. Inst. Civ. Eng.—Transp. 2002, 153, 121–129. [Google Scholar] [CrossRef]
- Gardien, W.; Stuit, H.G. Modelling of soil vibrations from railway tunnels. J. Sound Vib. 2003, 267, 605–619. [Google Scholar] [CrossRef]
- Clouteau, D. Freefield vibrations due to dynamic loading on a tunnel embedded in a stratified medium. J. Sound Vib. 2004, 283, 173–199. [Google Scholar] [CrossRef]
- Gupta, S.; Degrande, G.; Lombaert, G. Experimental validation of a numerical model for subway induced vibrations. J. Sound Vib. 2008, 321, 786–812. [Google Scholar] [CrossRef]
- Xia, Z.Q.; Ling, K.S.; Dong, K.S. Vibration response analysis of school buildings caused by metro trains running on a curved track. China Earthq. Eng. J. 2021, 43, 1377–1386. [Google Scholar]
- Ngamkhanong, C.; Kaewunruen, S. The effect of ground borne vibrations from high speed train on overhead line equipment (OHLE) structure considering soil-structure interaction. Sci. Total Environ. 2018, 627, 934–941. [Google Scholar] [CrossRef] [PubMed] [Green Version]
- Li, T.; Su, Q.; Kaewunruen, S. Influences of dynamic material properties of slab track components on the train-track vibration interactions. Eng. Fail. Anal. 2020, 115, 104633. [Google Scholar] [CrossRef]
- Ramos, A.; Correia, A.G.; Calçada, R. Ballastless railway track transition zones: An embankment to tunnel analysis. Transp. Geotech. 2022, 33, 100728. [Google Scholar] [CrossRef]
- Yaseri, A.; Bazyar, M.H.; Hataf, N. 3D coupled scaled boundary finite-element/finite-element analysis of ground vibrations induced by underground train movement. Comput. Geotech. 2014, 60, 1–8. [Google Scholar] [CrossRef]
Figure 1.
Monitoring point plan.
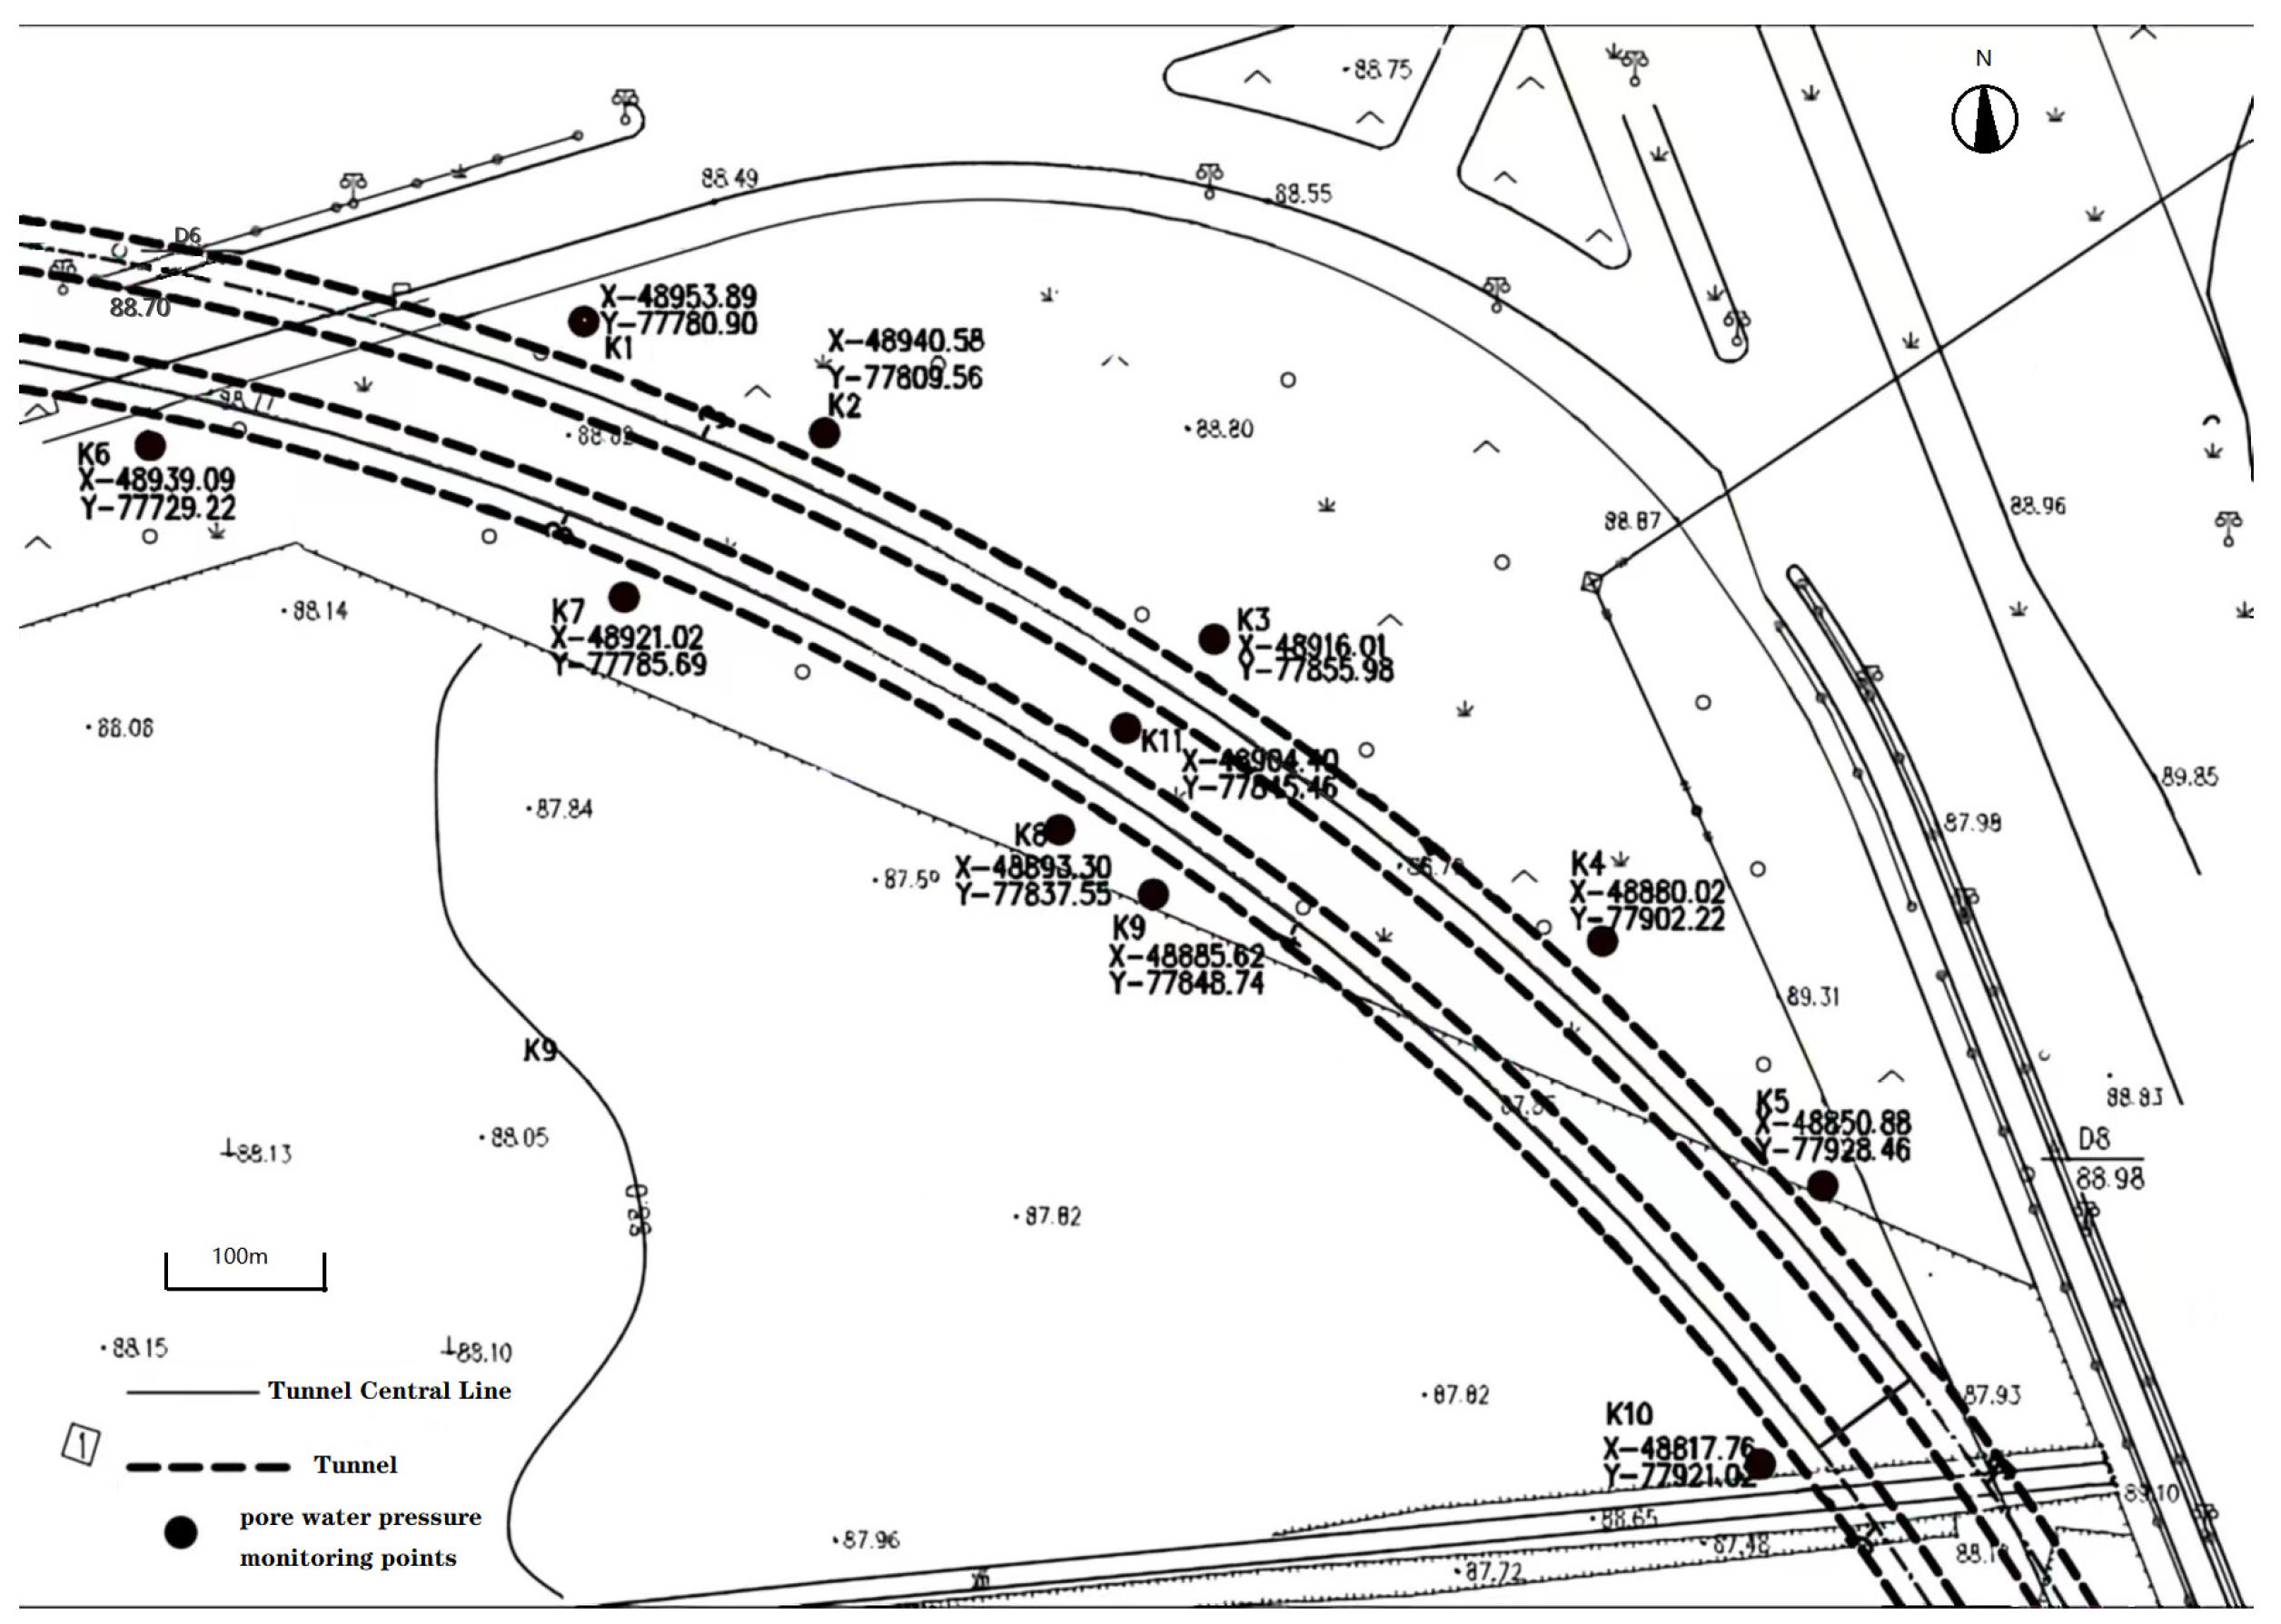
Figure 2.
Geological profile of each soil layer.

Figure 3.
Change in pore water pressure at manual monitoring points.
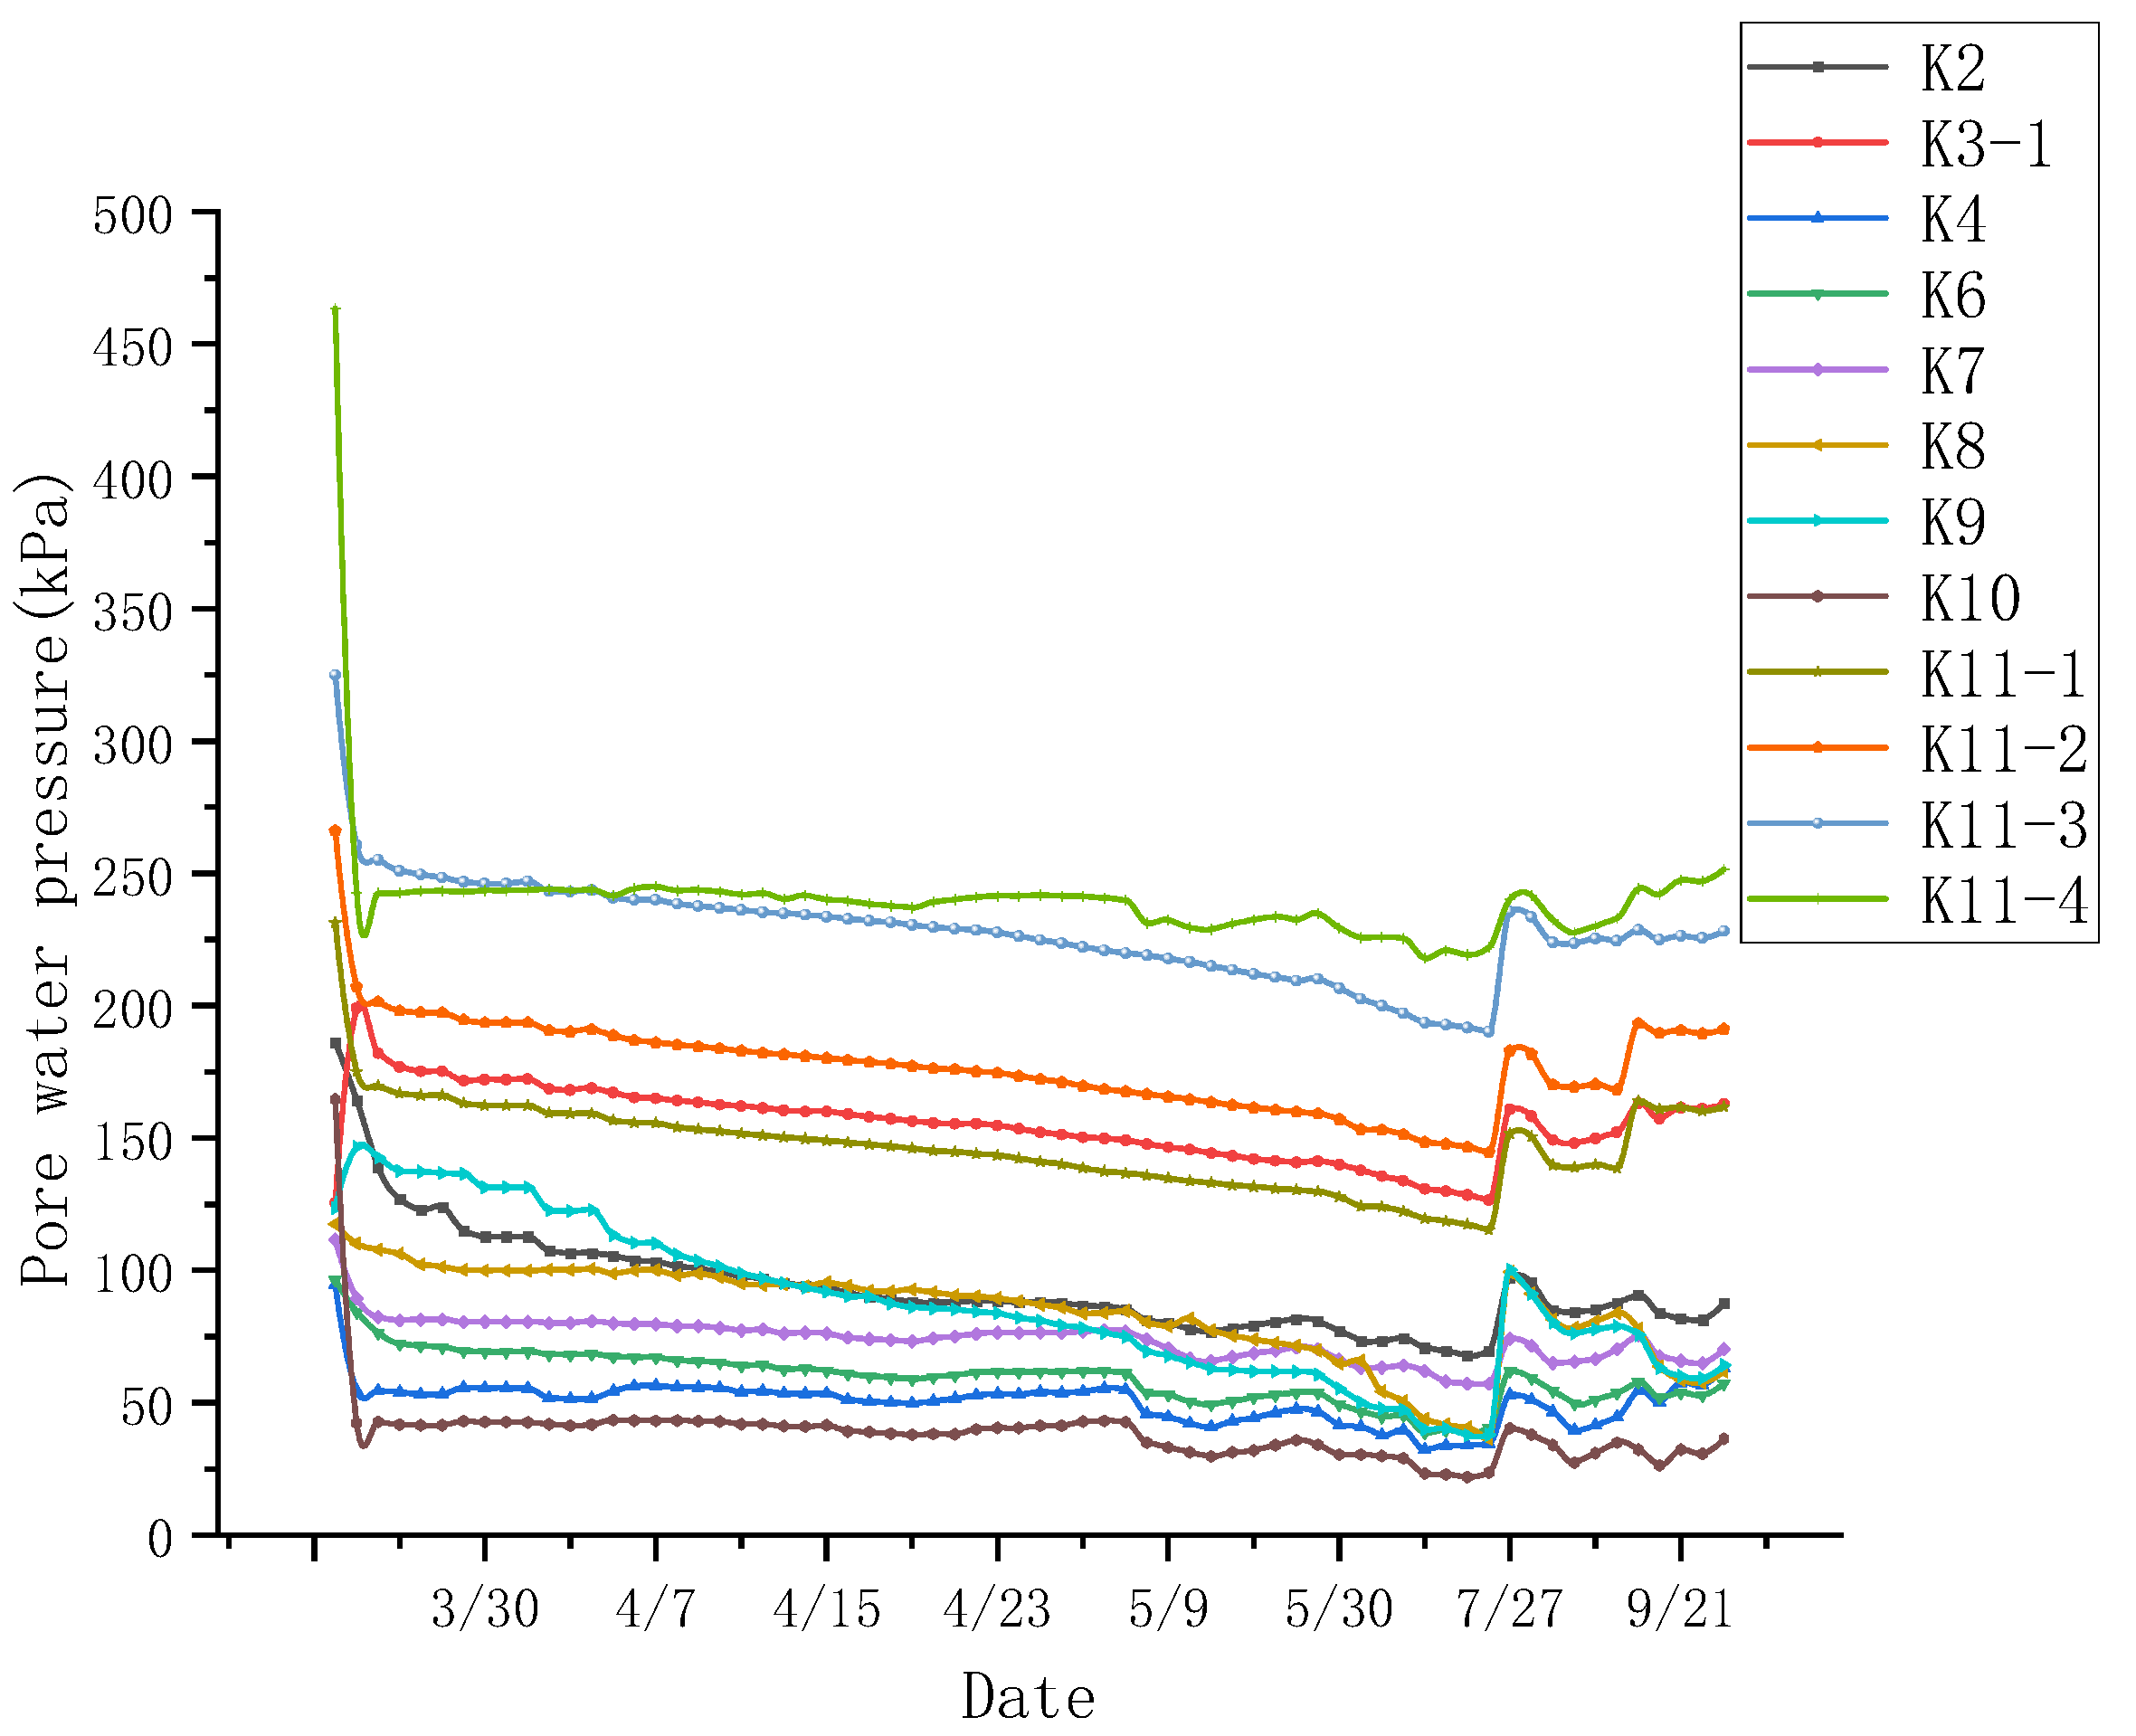
Figure 4.
Change in pore water pressure at the automatic monitoring point.
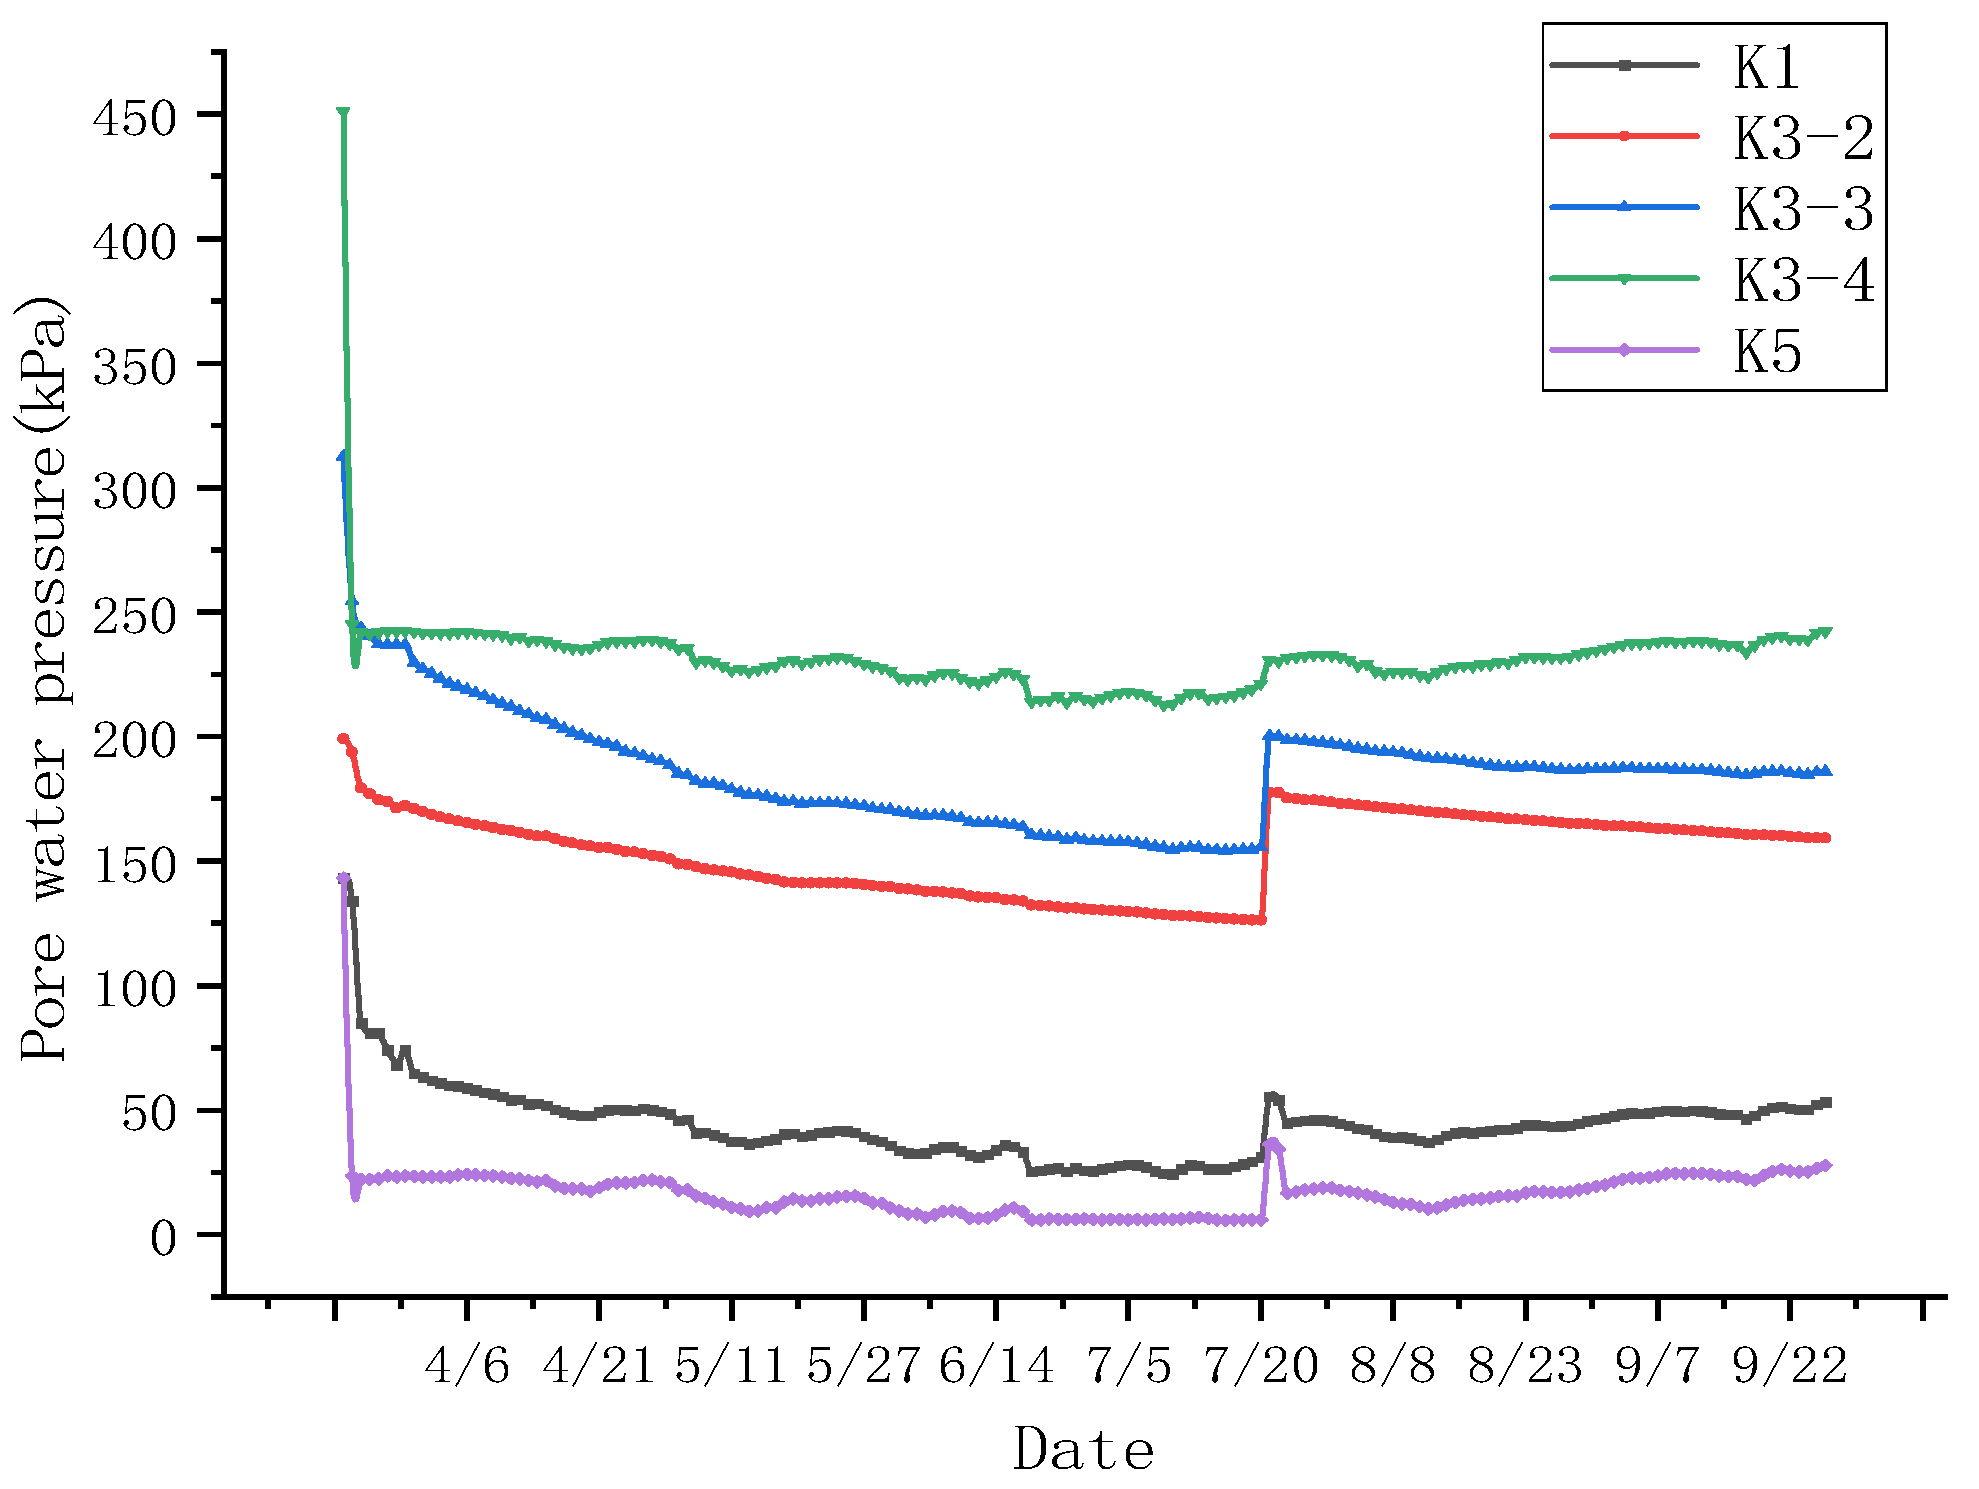
Figure 5.
Change in excess pore water pressure at manual monitoring points.
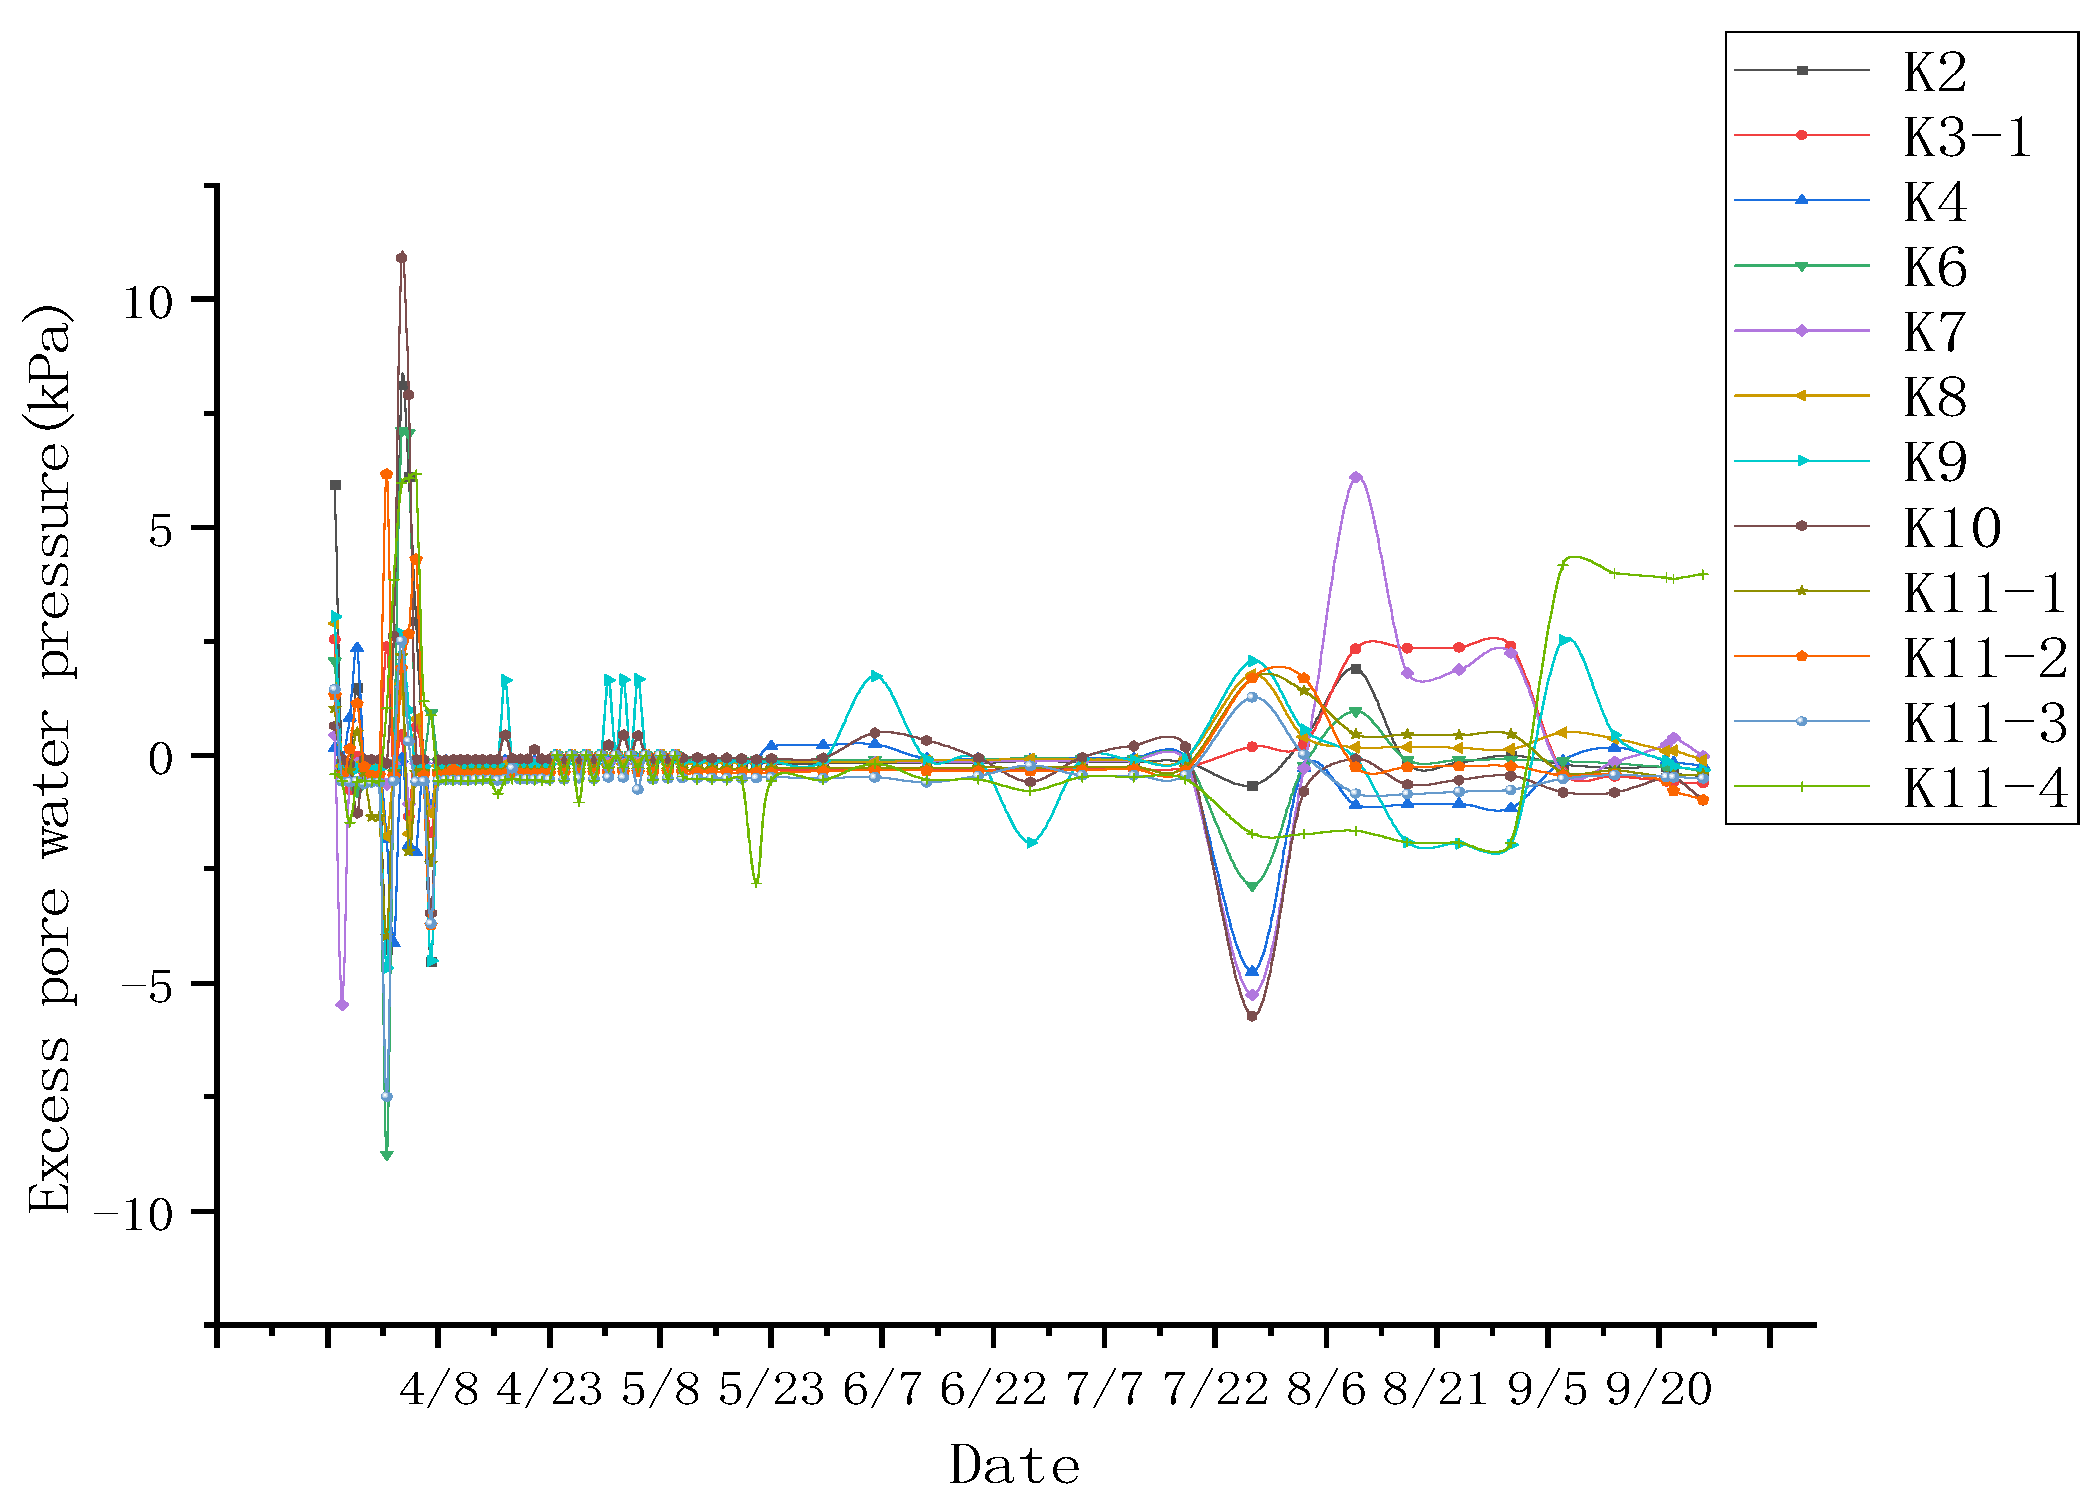
Figure 6.
Change in super-pore water pressure at automatic monitoring point.

Figure 7.
Variations in pore pressure for K3-2 on May 3rd.
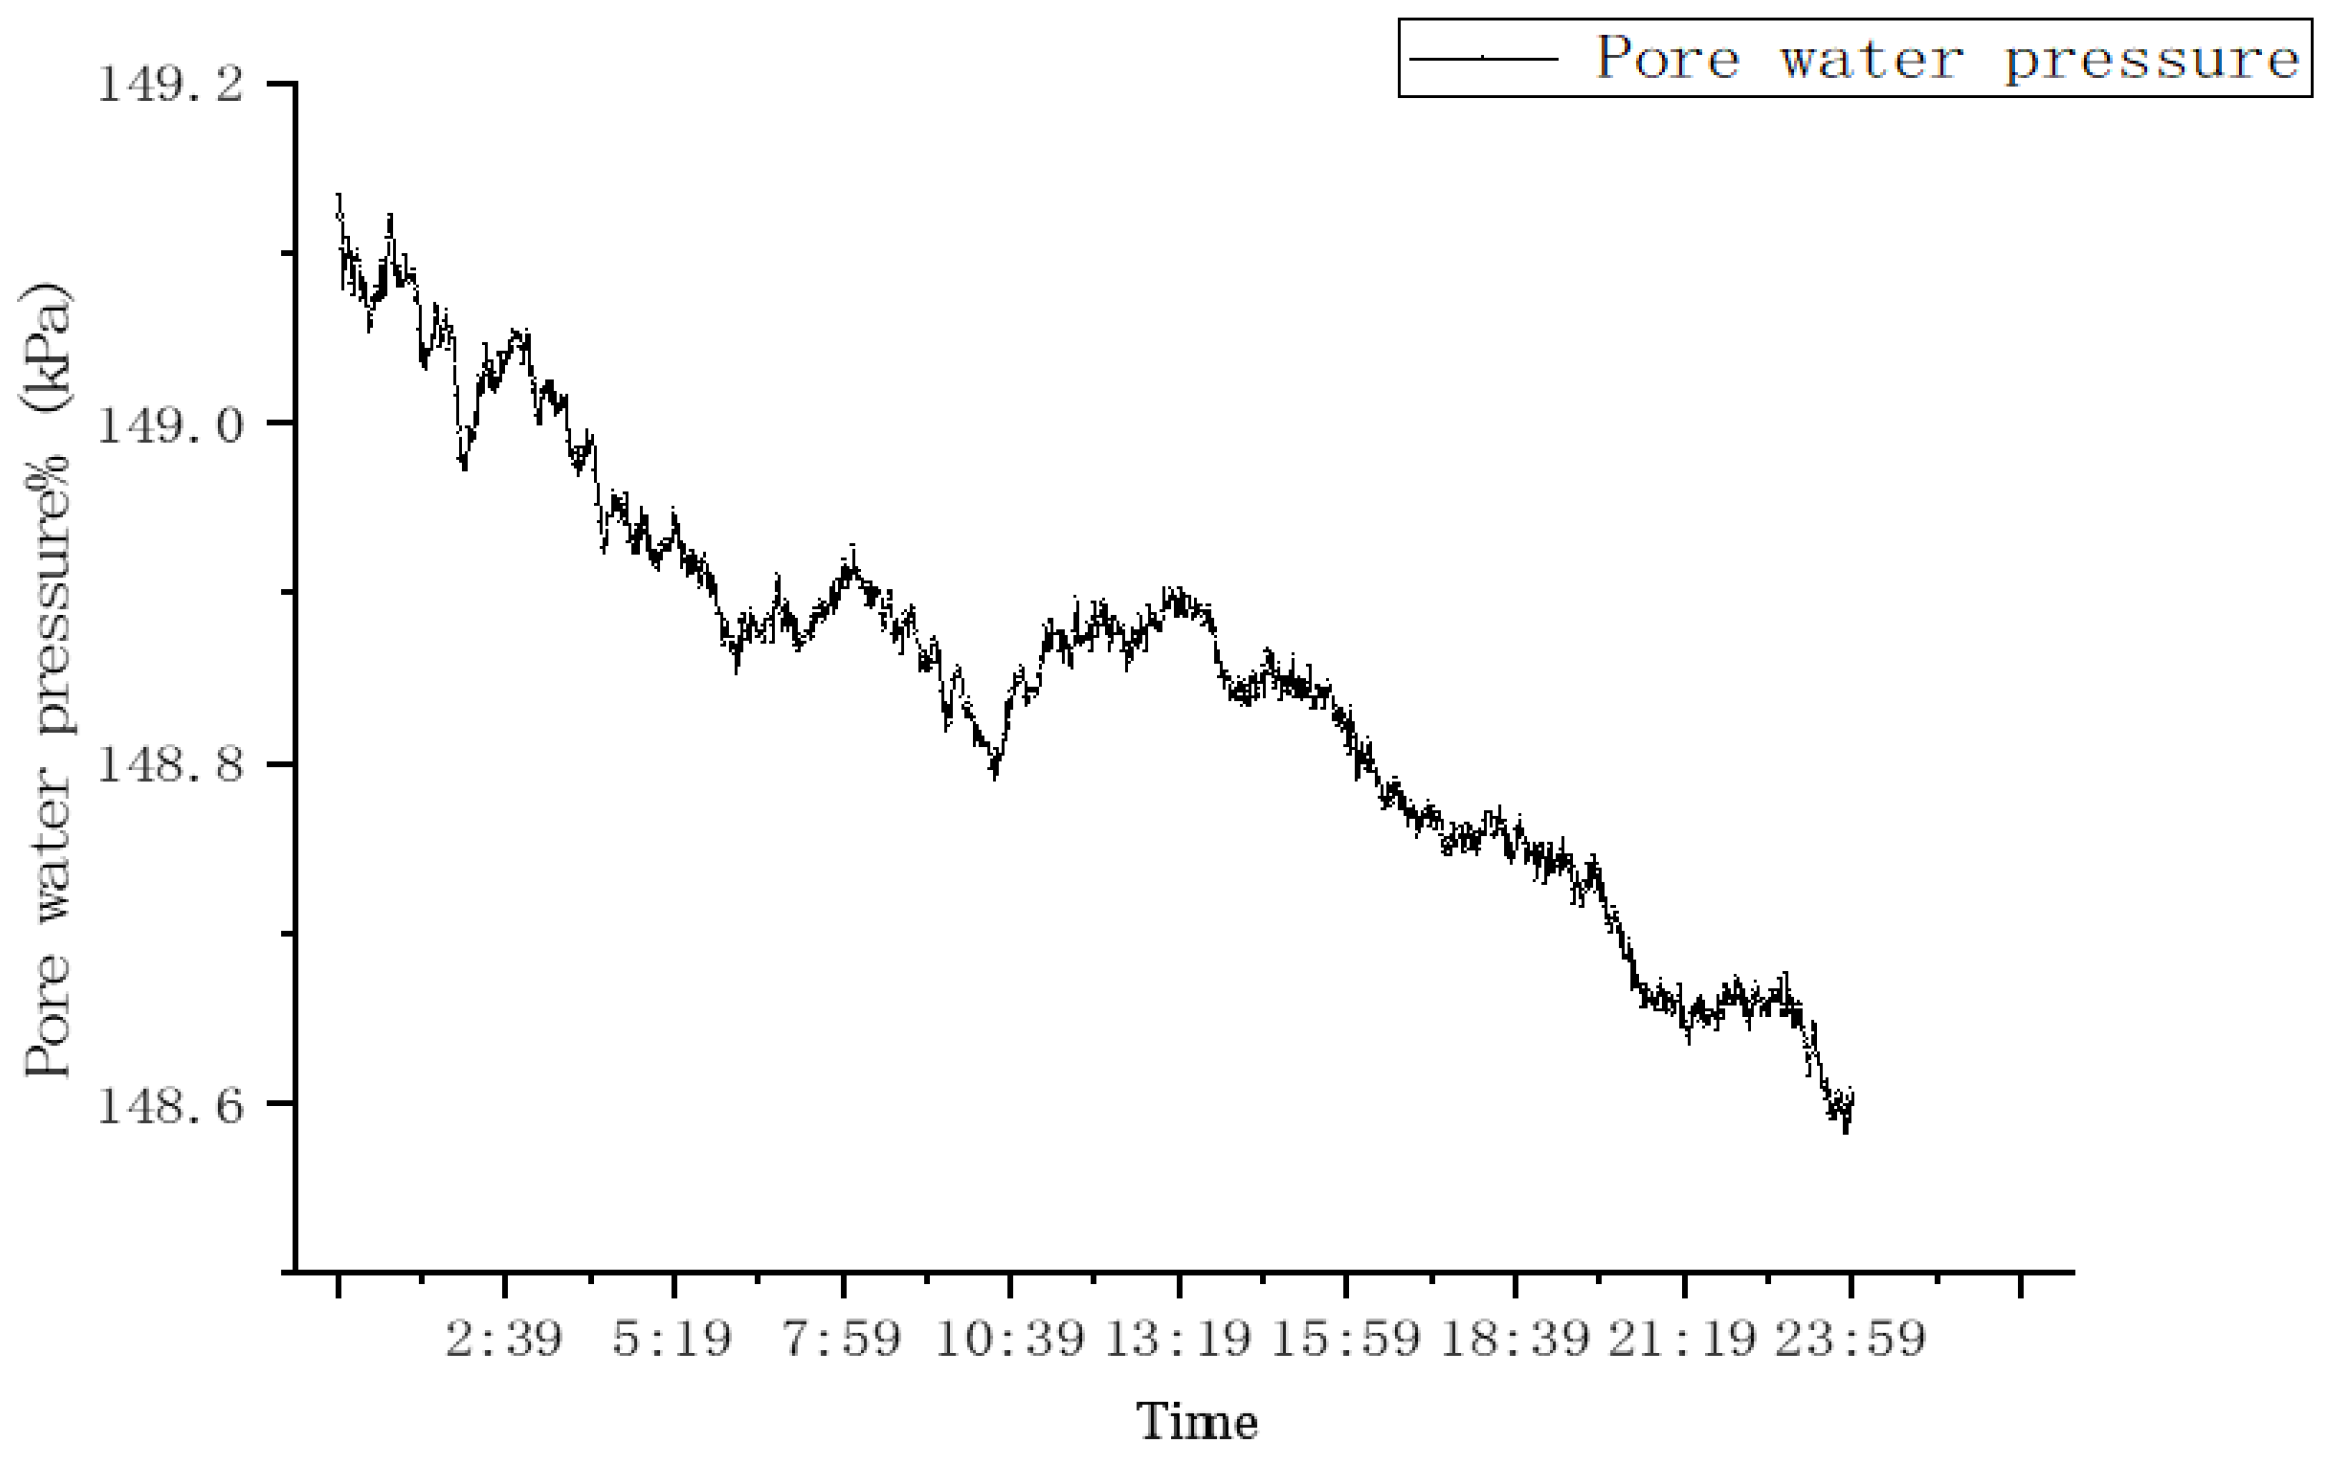
Figure 8.
Variations in pore pressure for K3-3 on May 3rd.
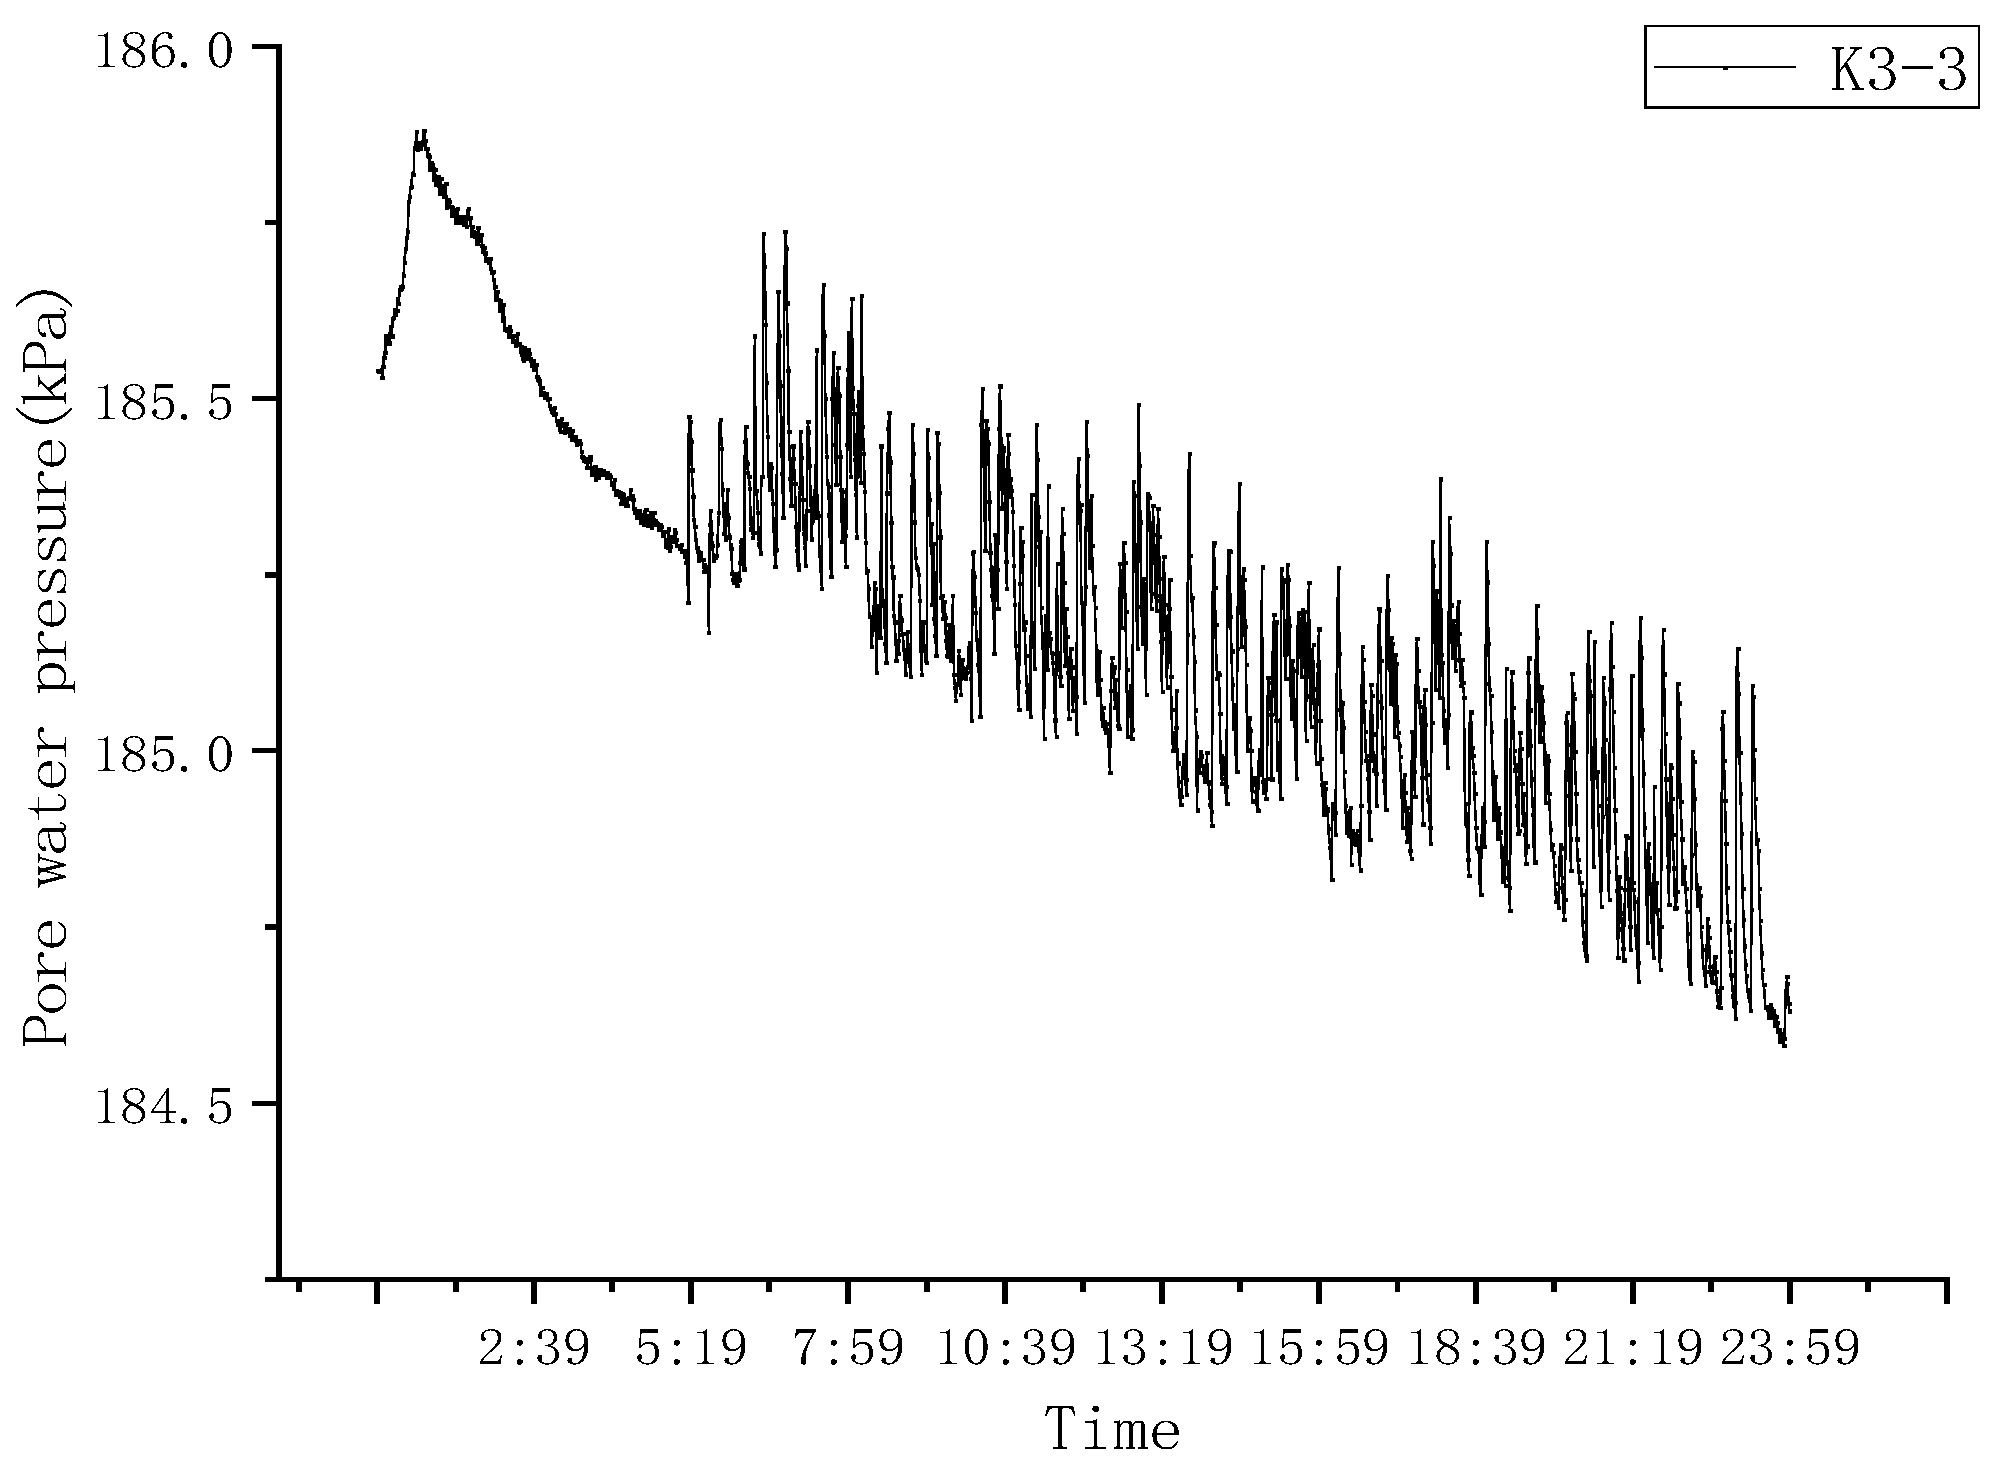
Figure 9.
Variations in pore pressure for K3-4 on May 3rd.
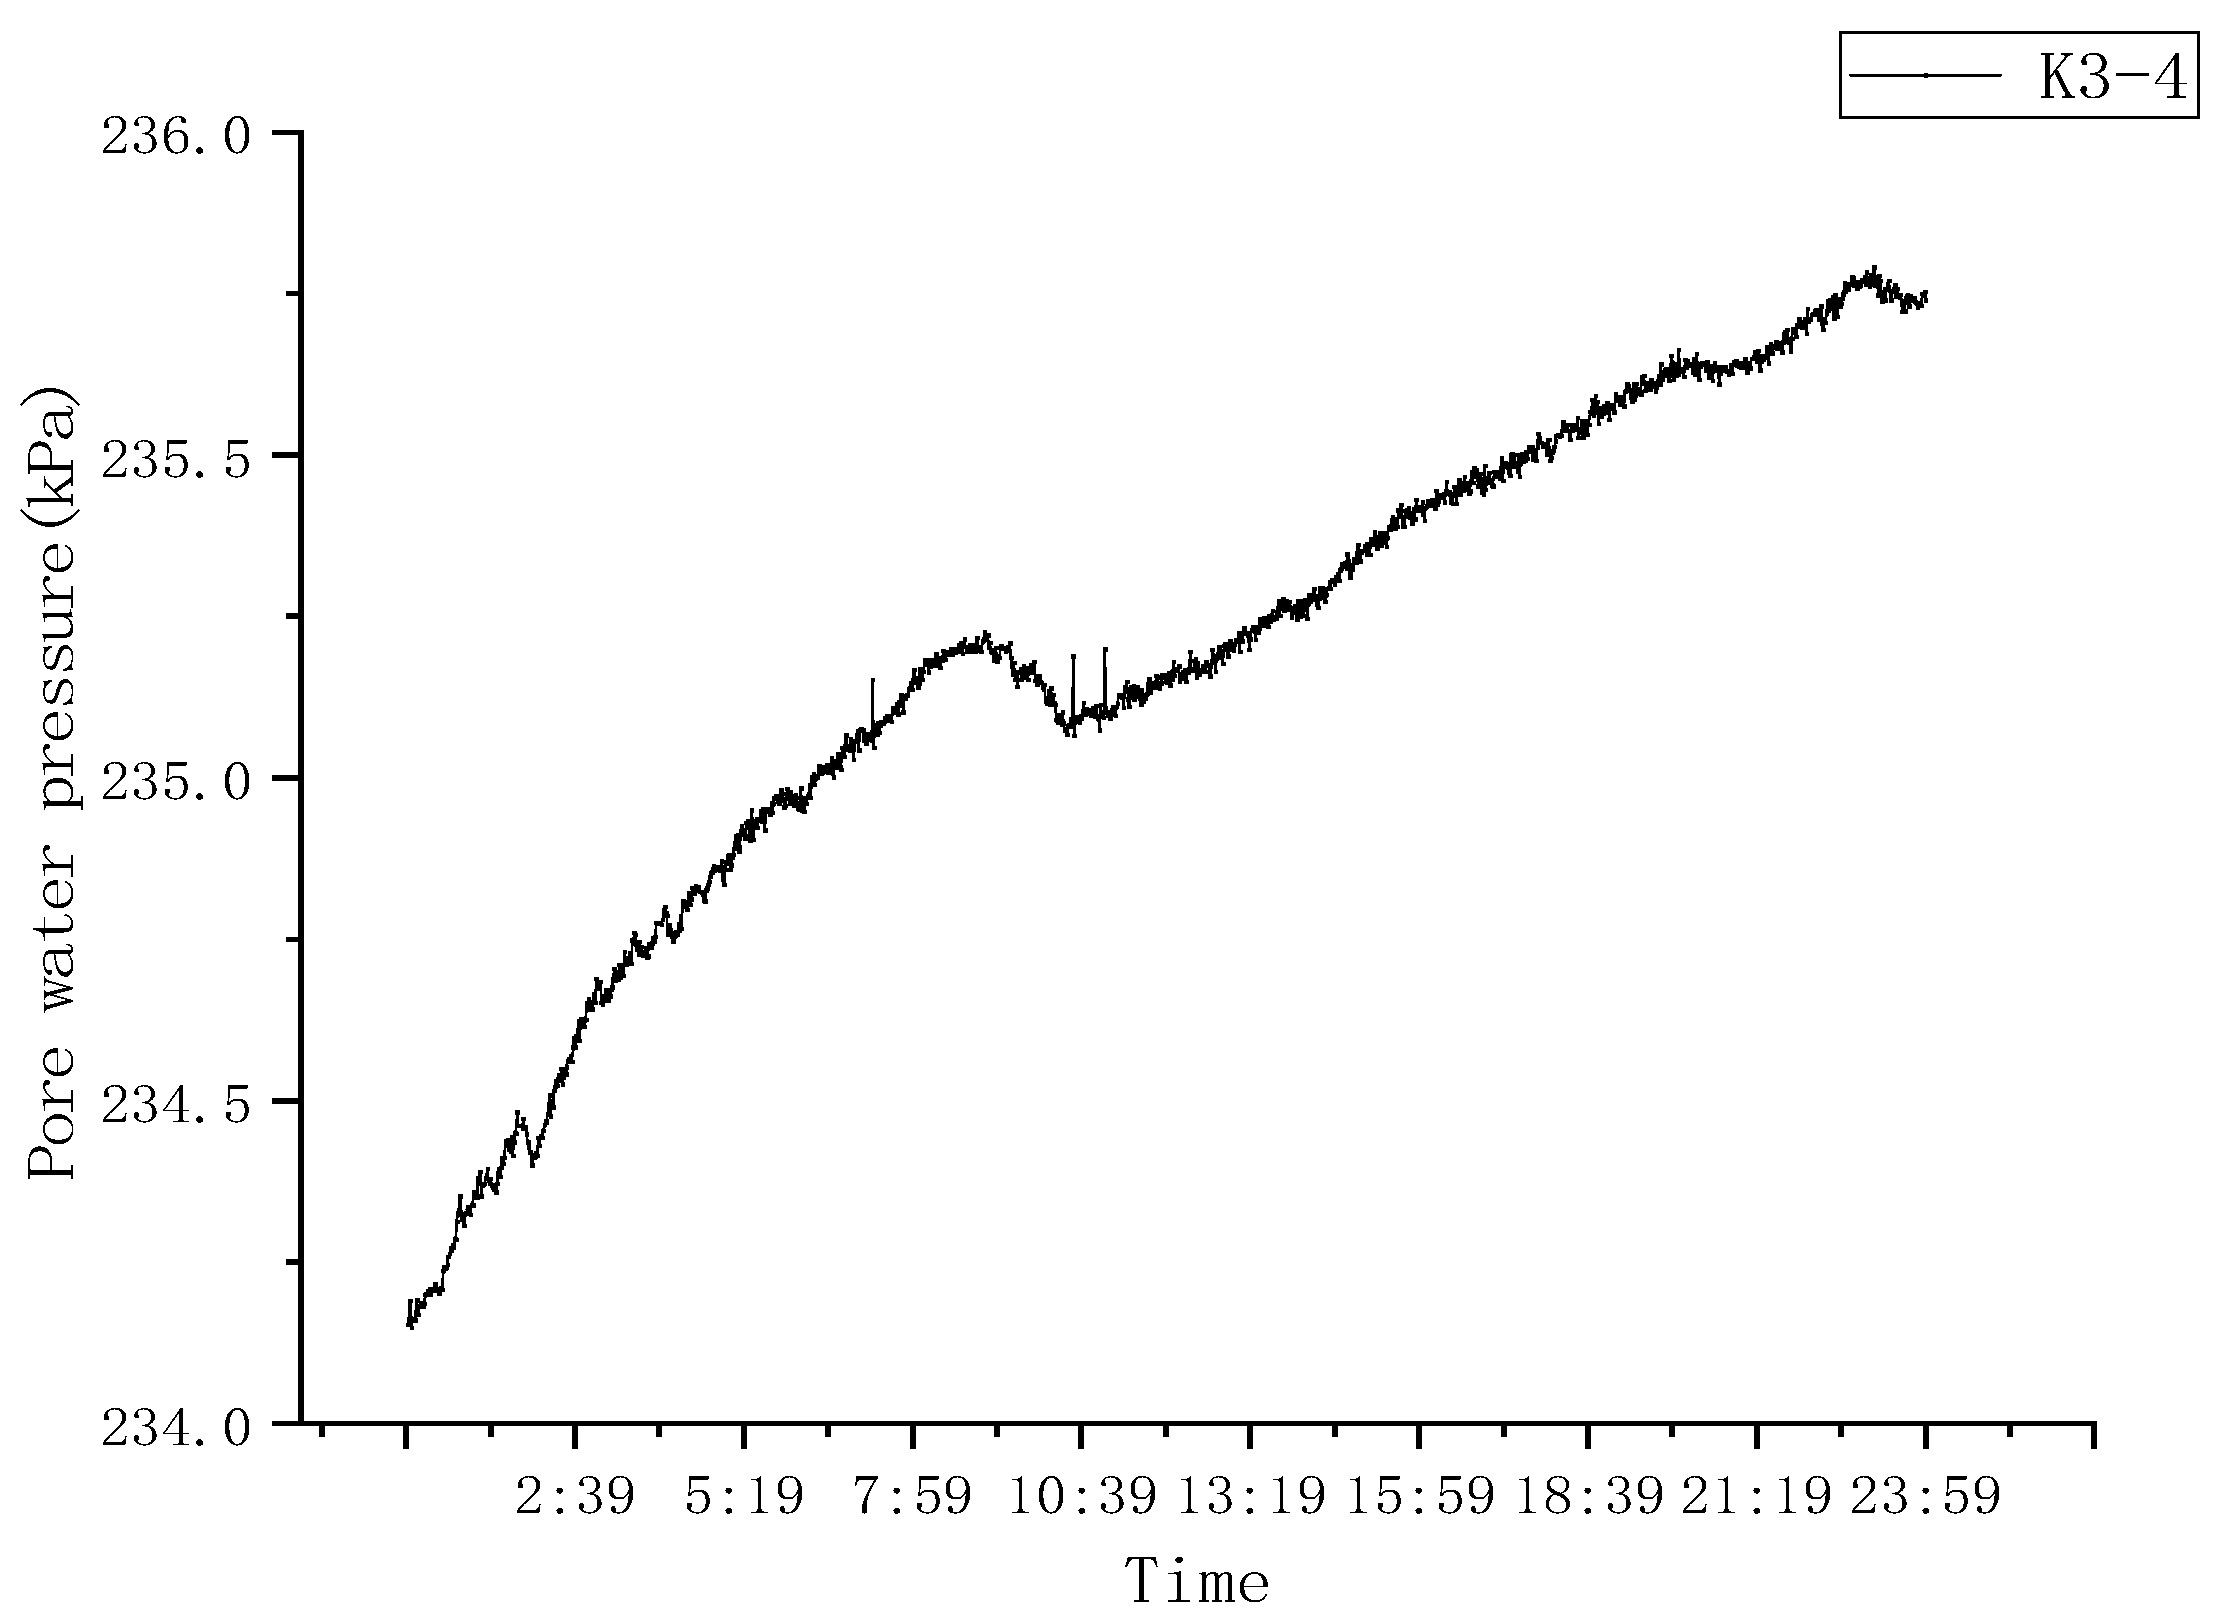
Figure 10.
Water level change at the monitoring points.
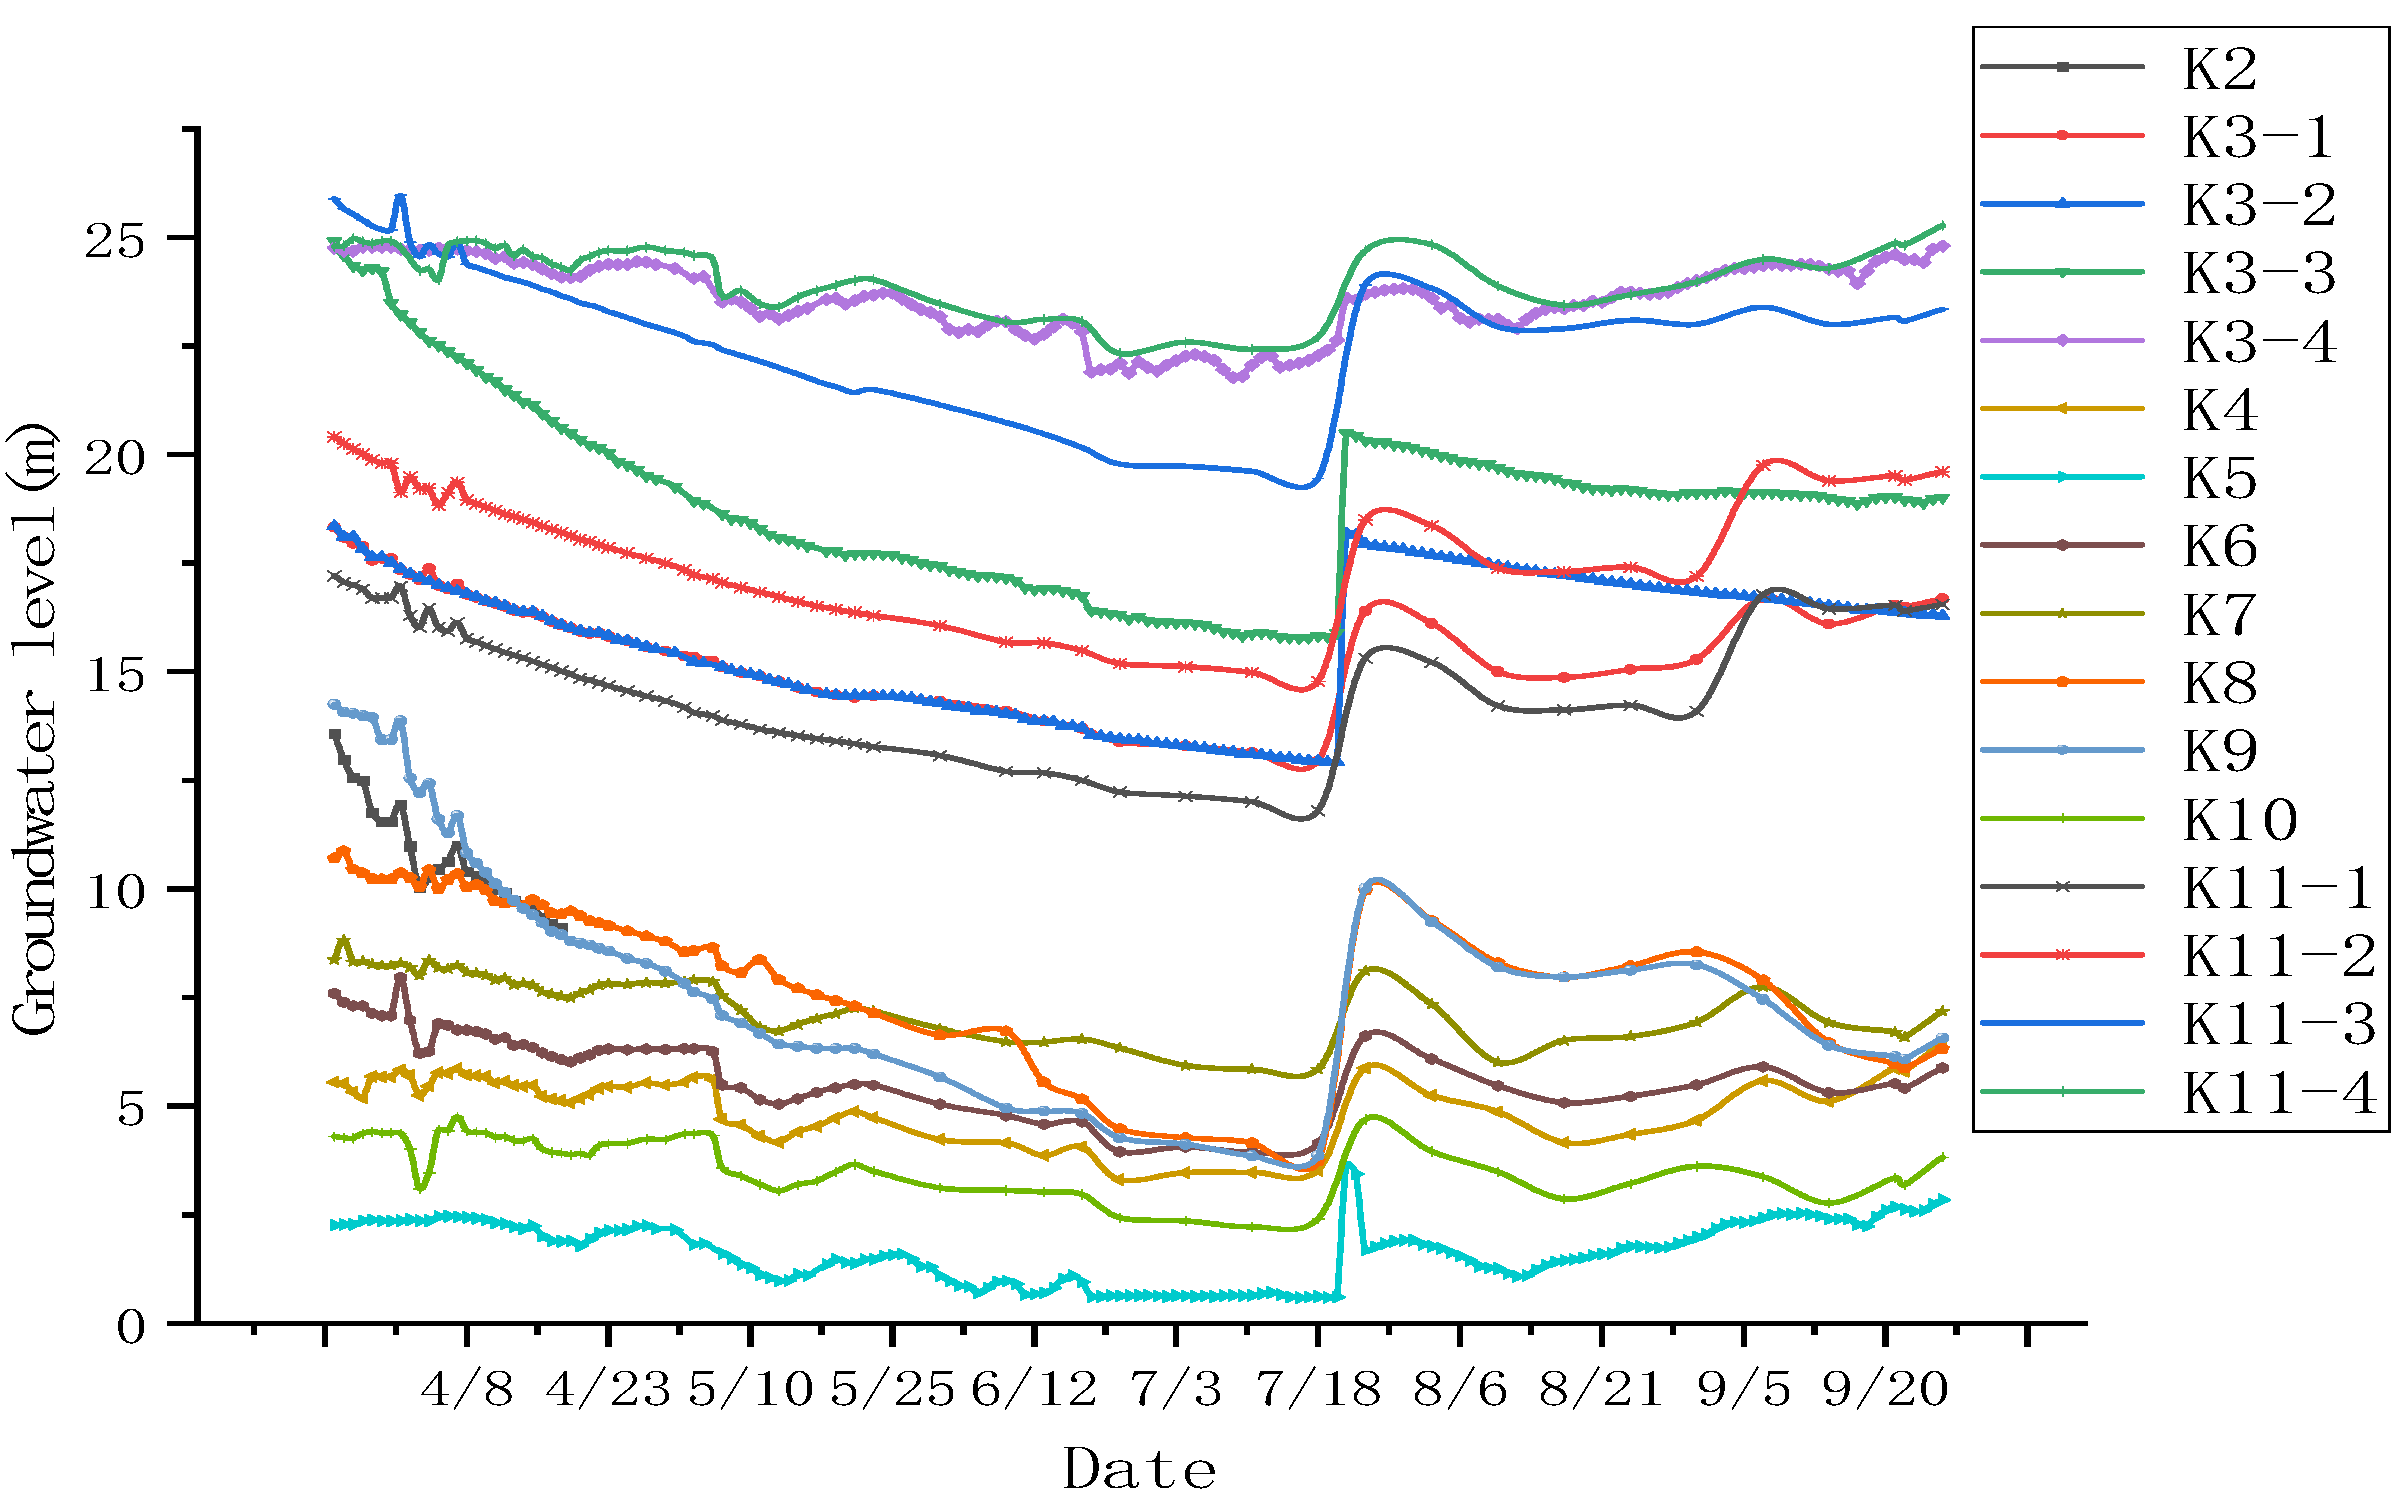
Figure 11.
Settlement monitoring data of Nongye South Road Station–Dongfeng South Road Station.

Figure 12.
Metro 3D finite element model.
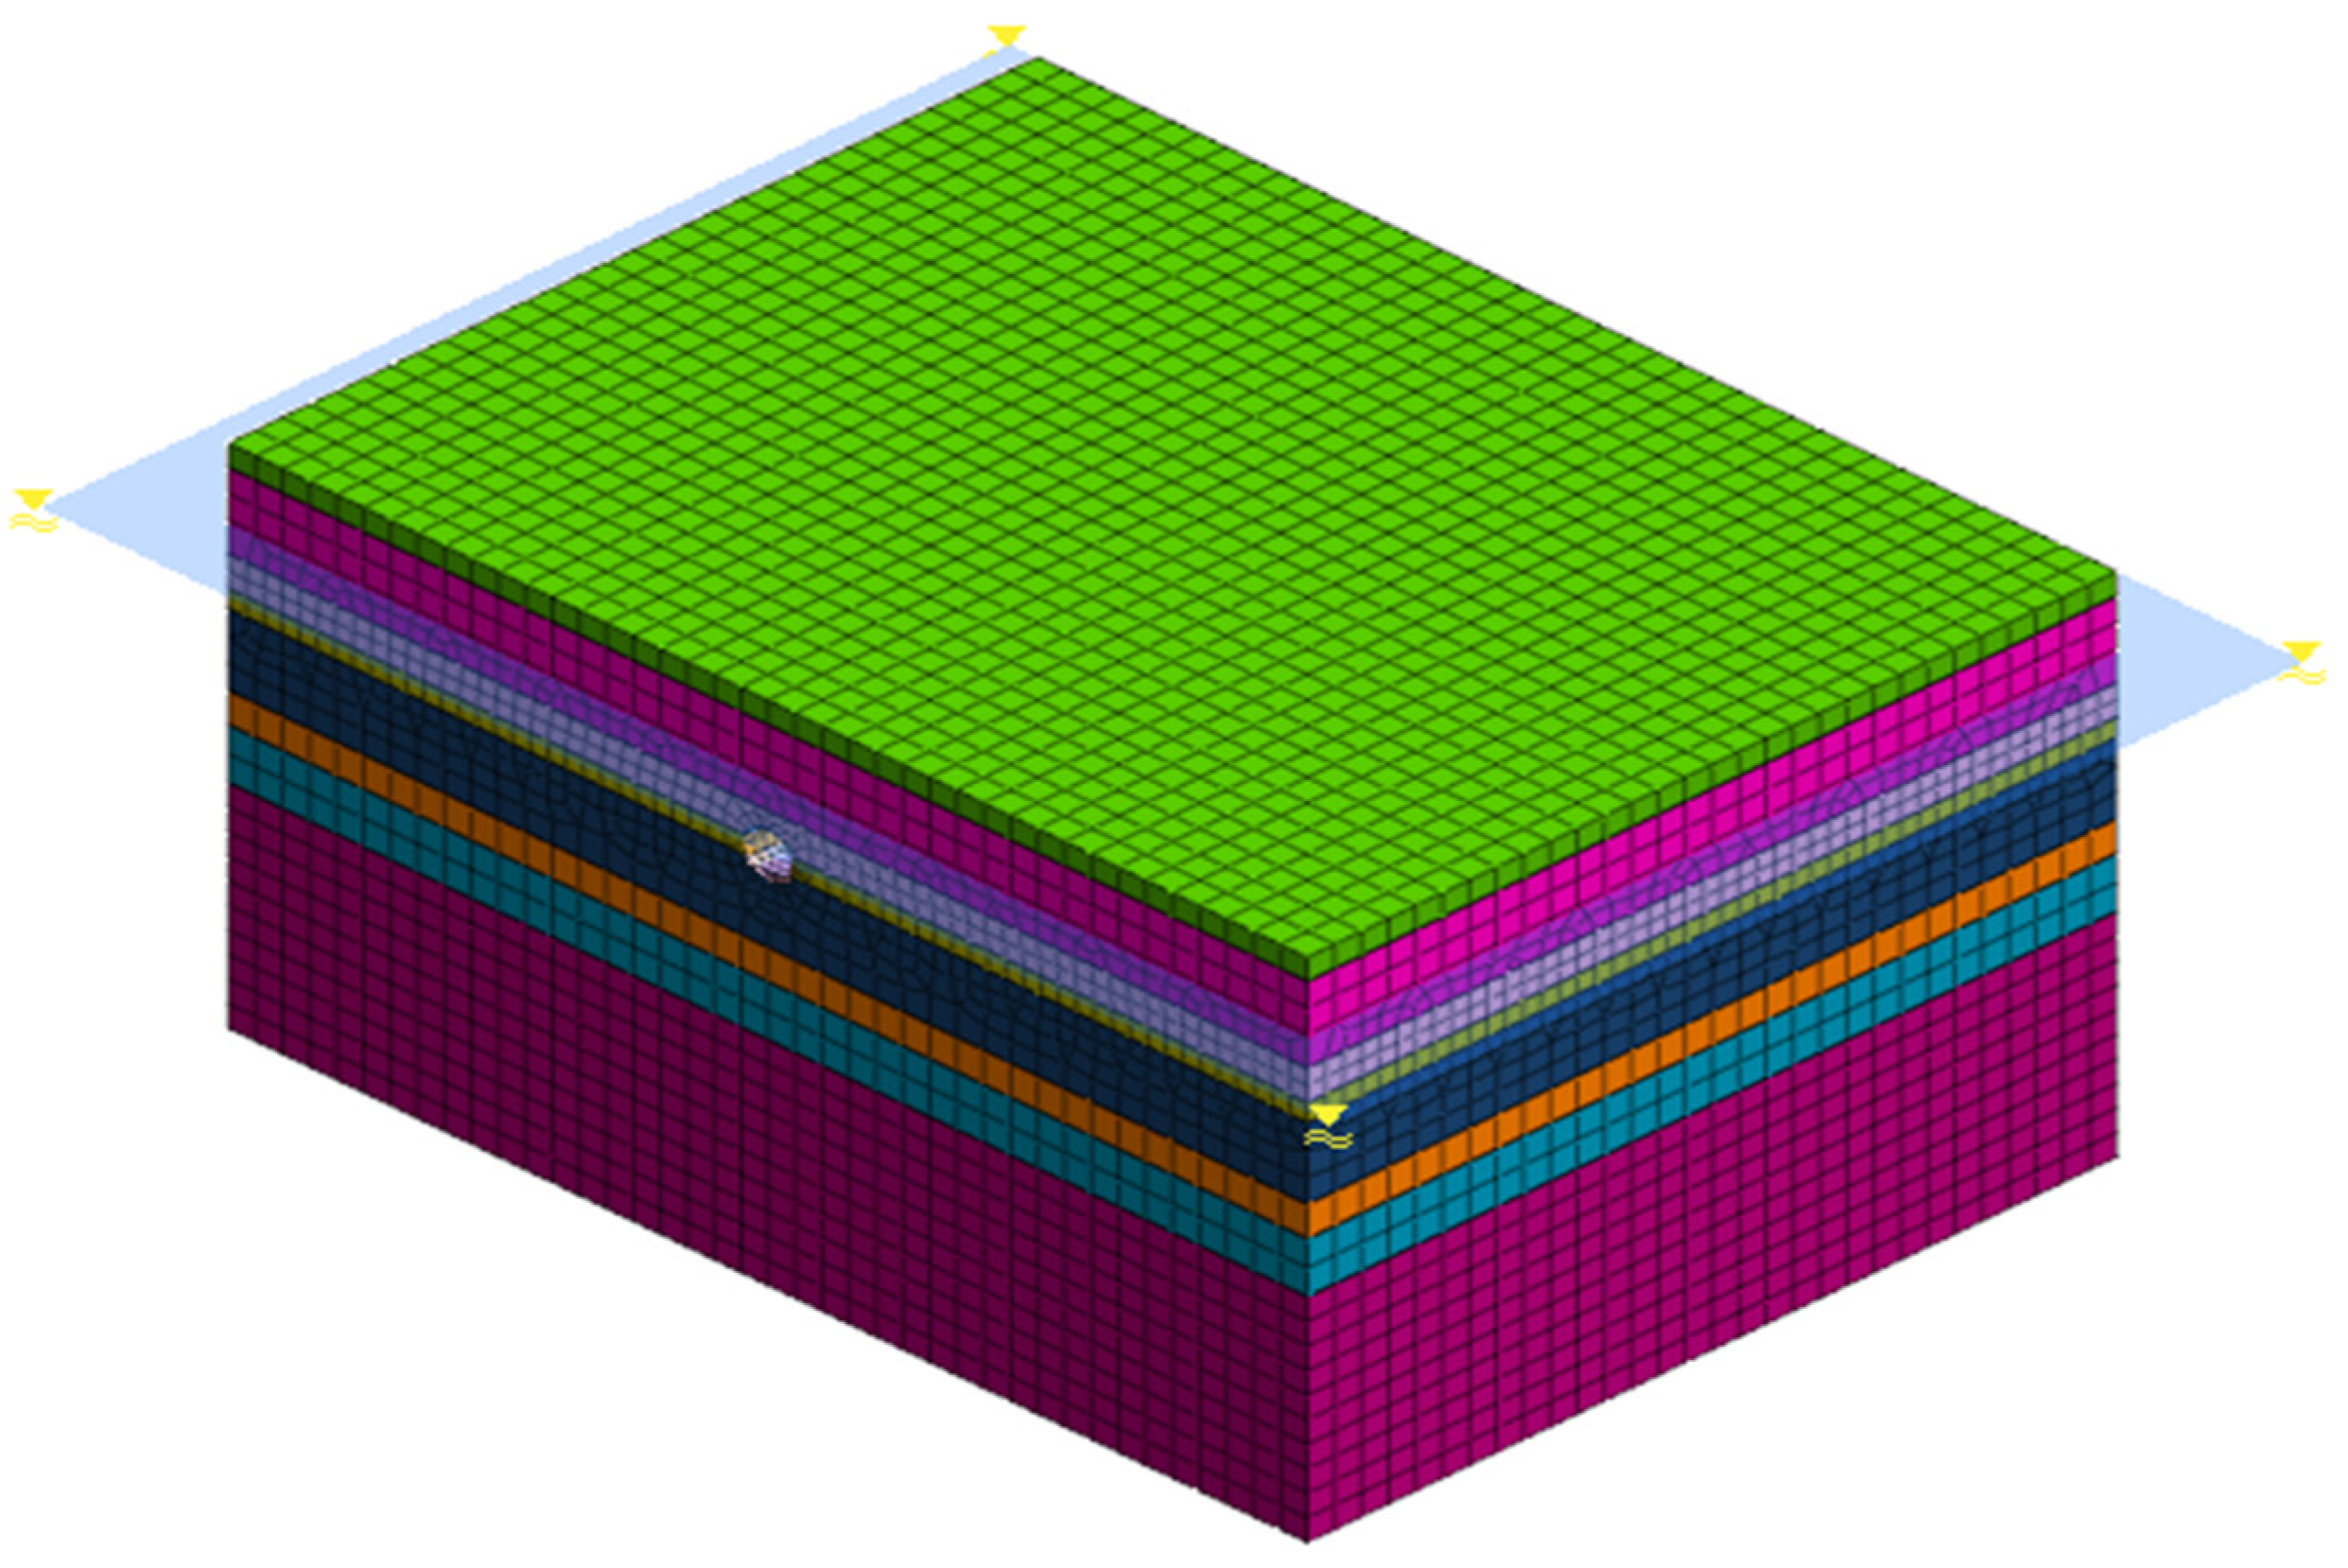
Figure 13.
Track force map.
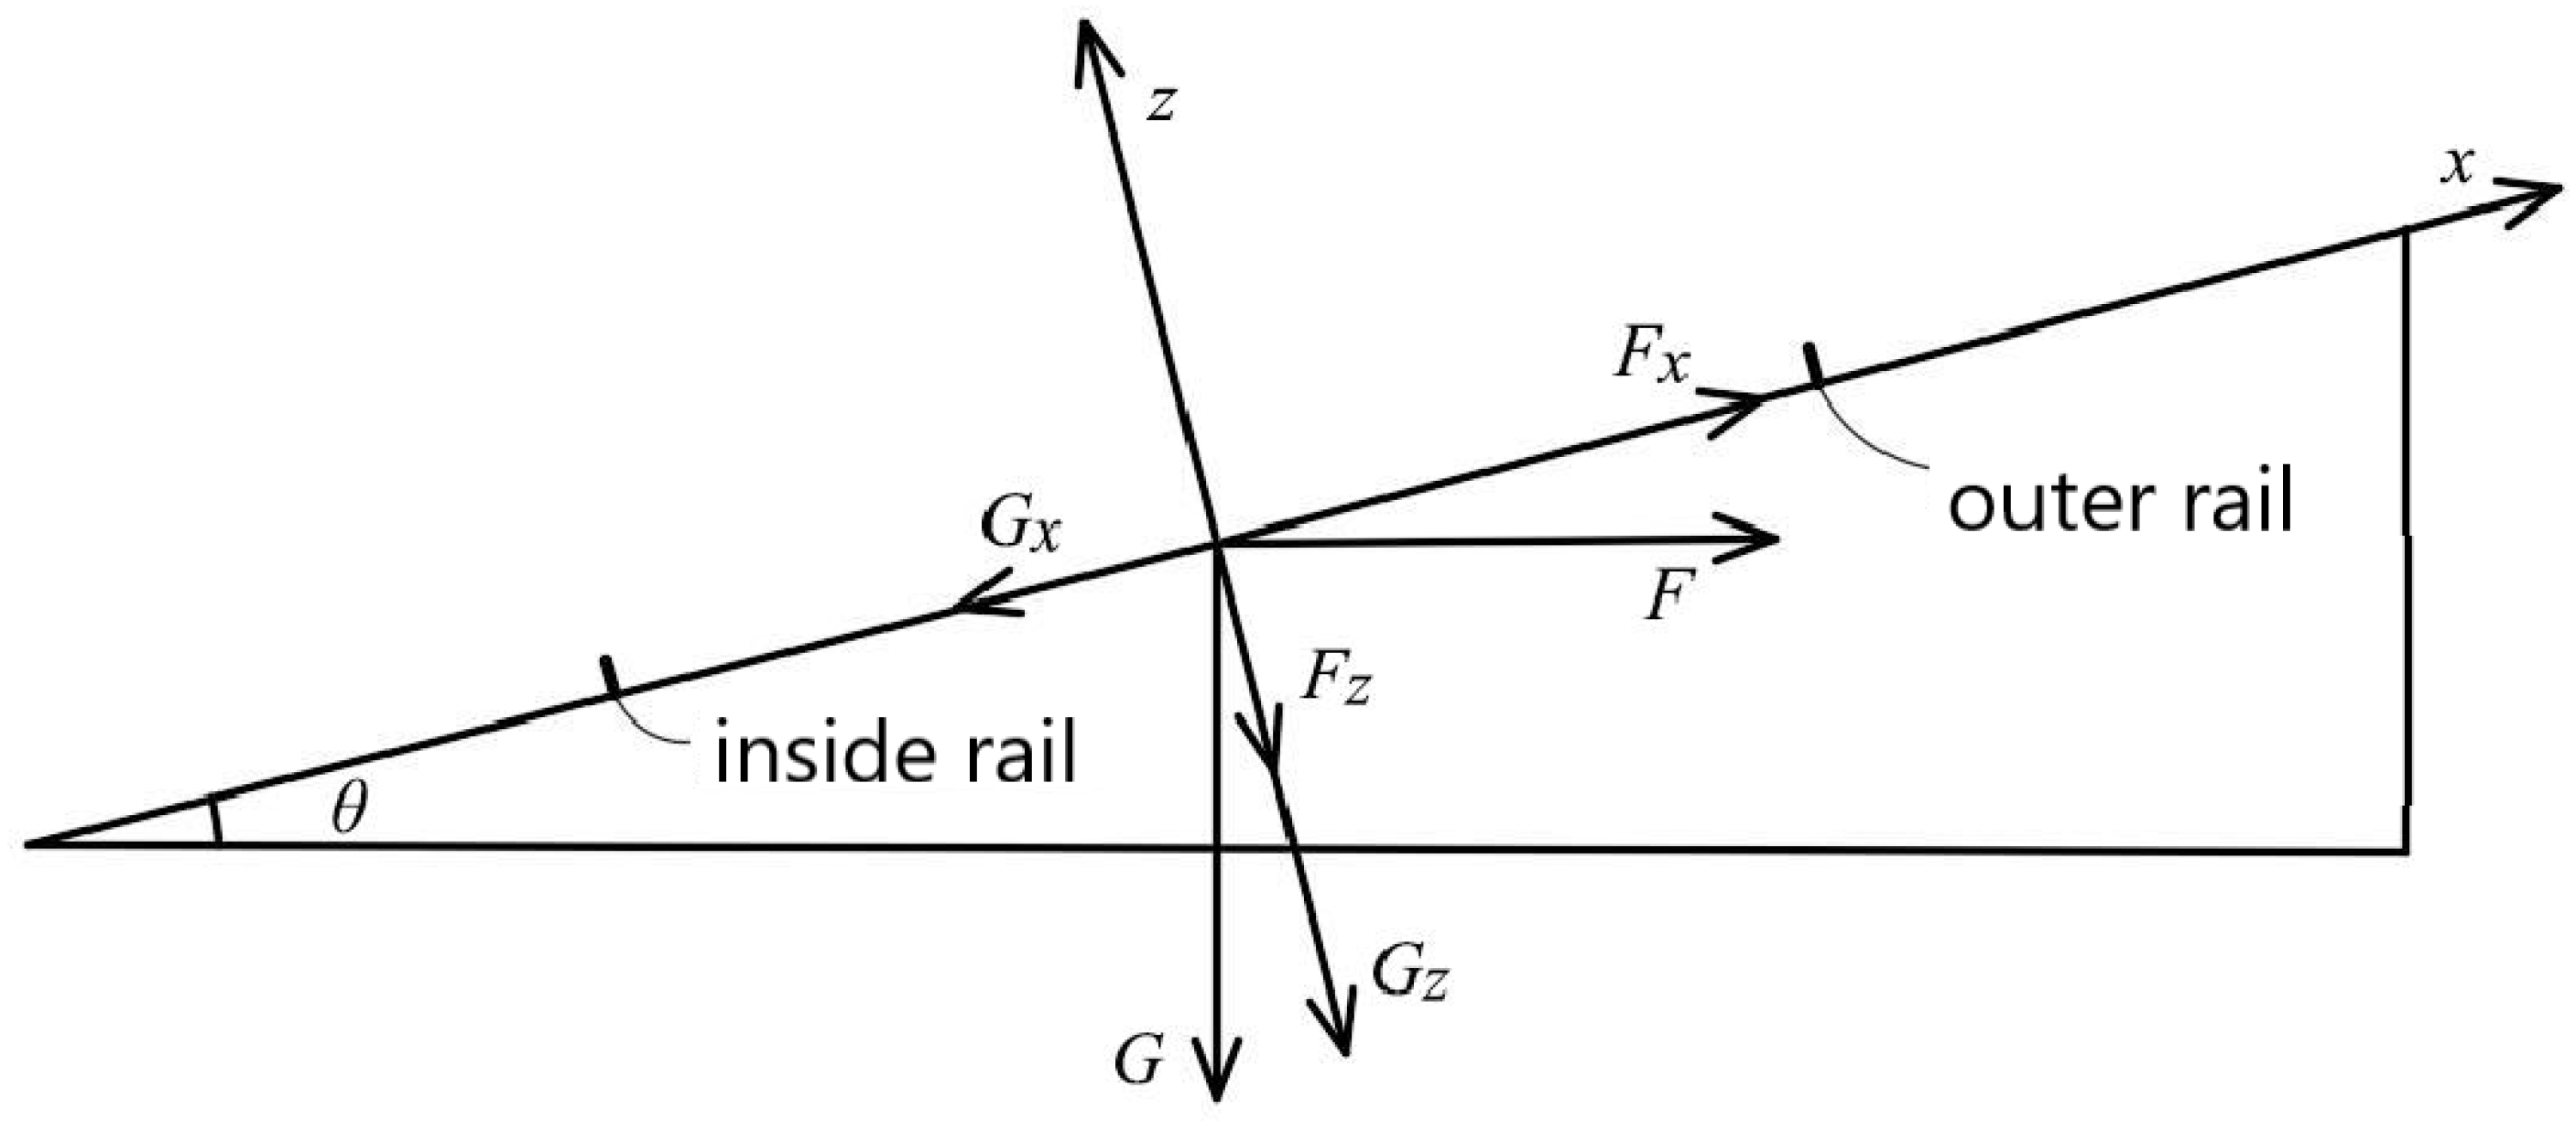
Figure 14.
Train vibration load time course curve at v = 80 km/h.

Figure 15.
Reference point location map.

Figure 16.
Change of hole pressure at the reference point.
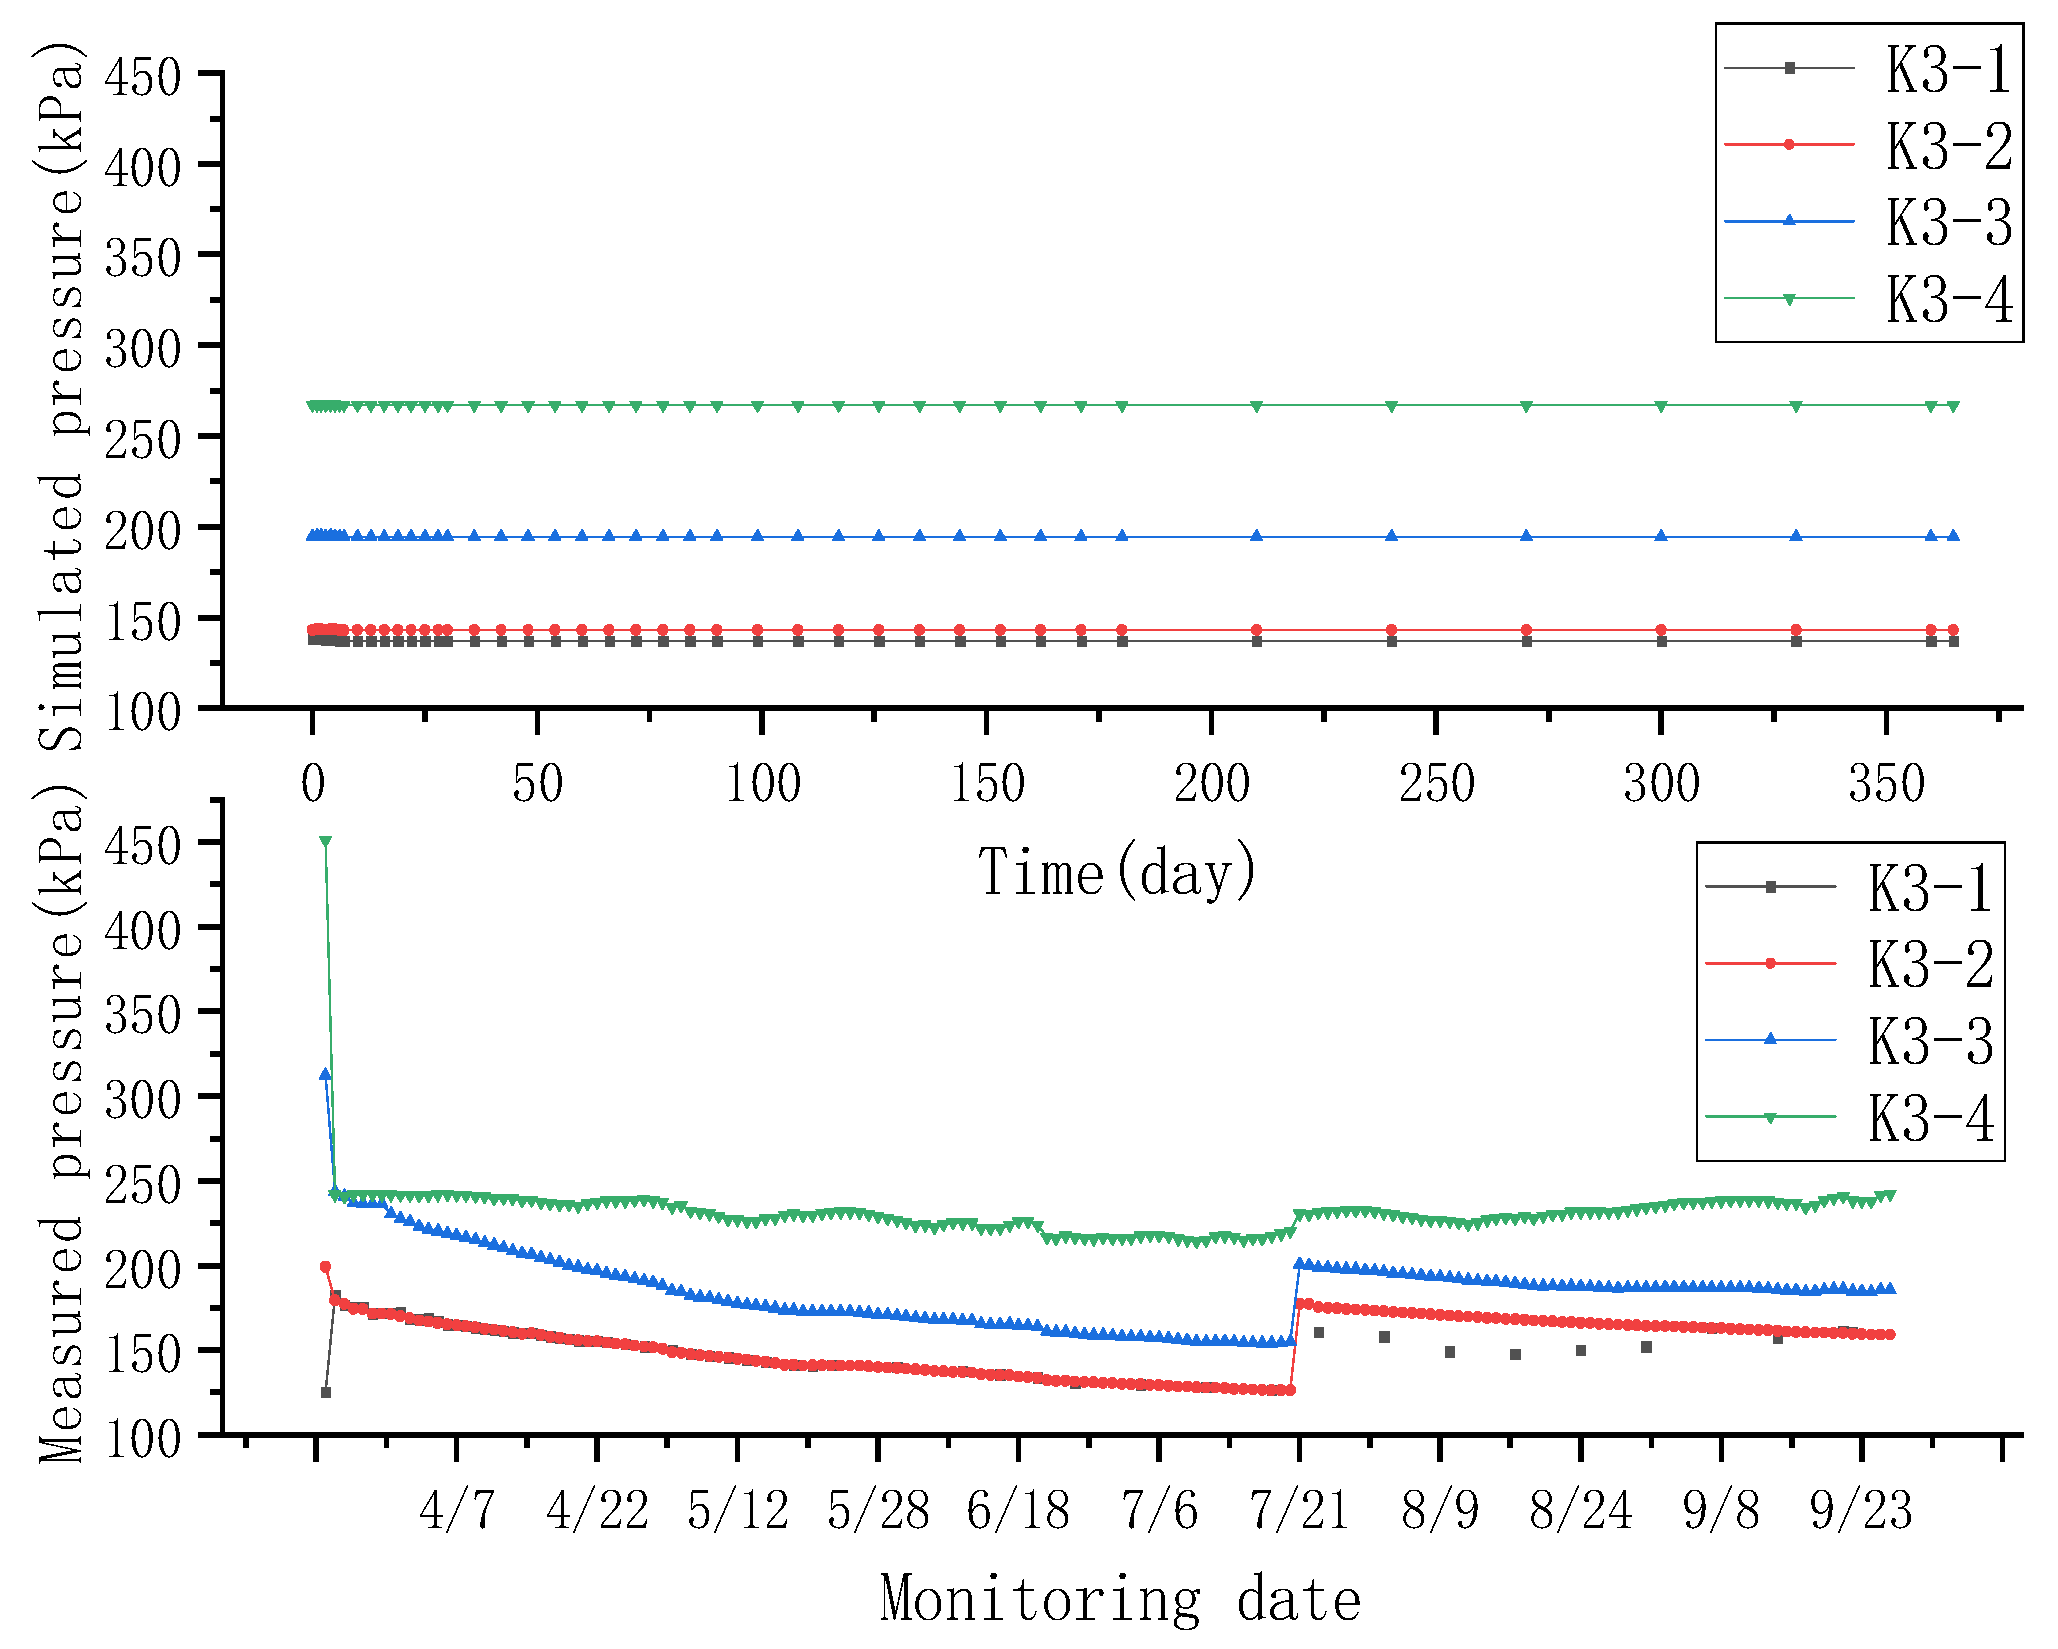
Figure 17.
The change in pore pressure in a single loading point was analyzed.
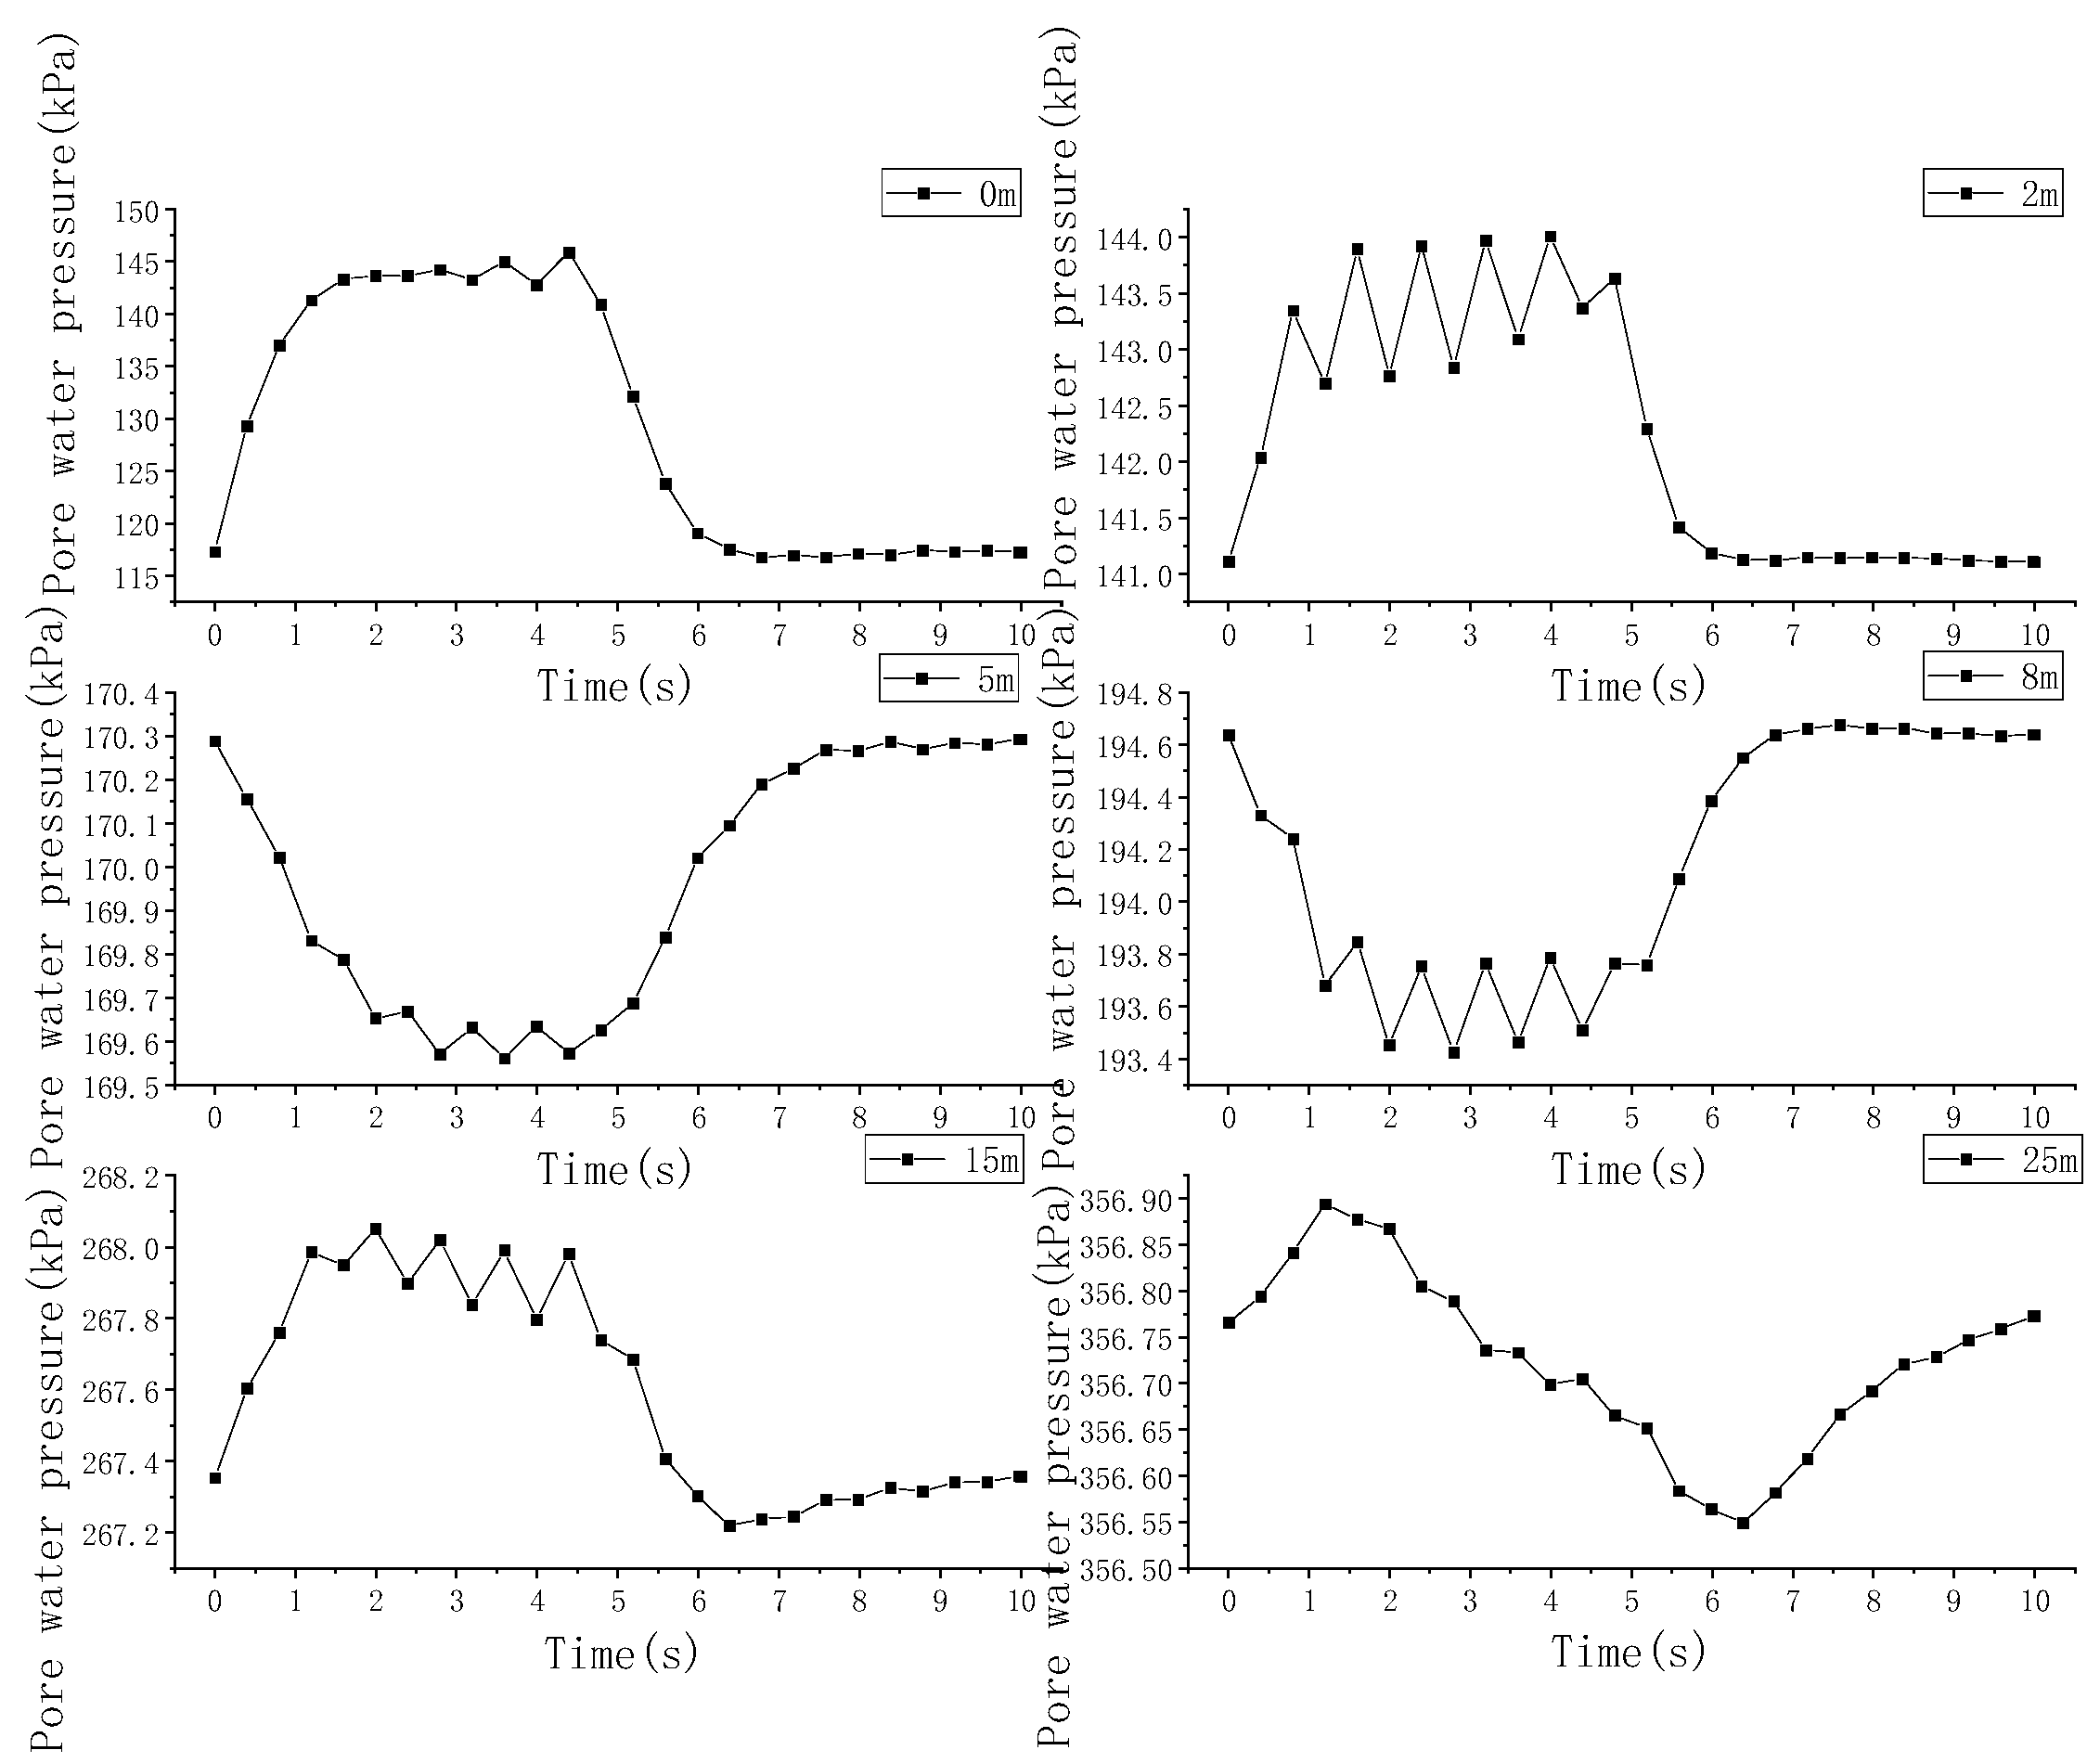
Figure 18.
Cloud diagram of vertical displacement of tunnel single load.
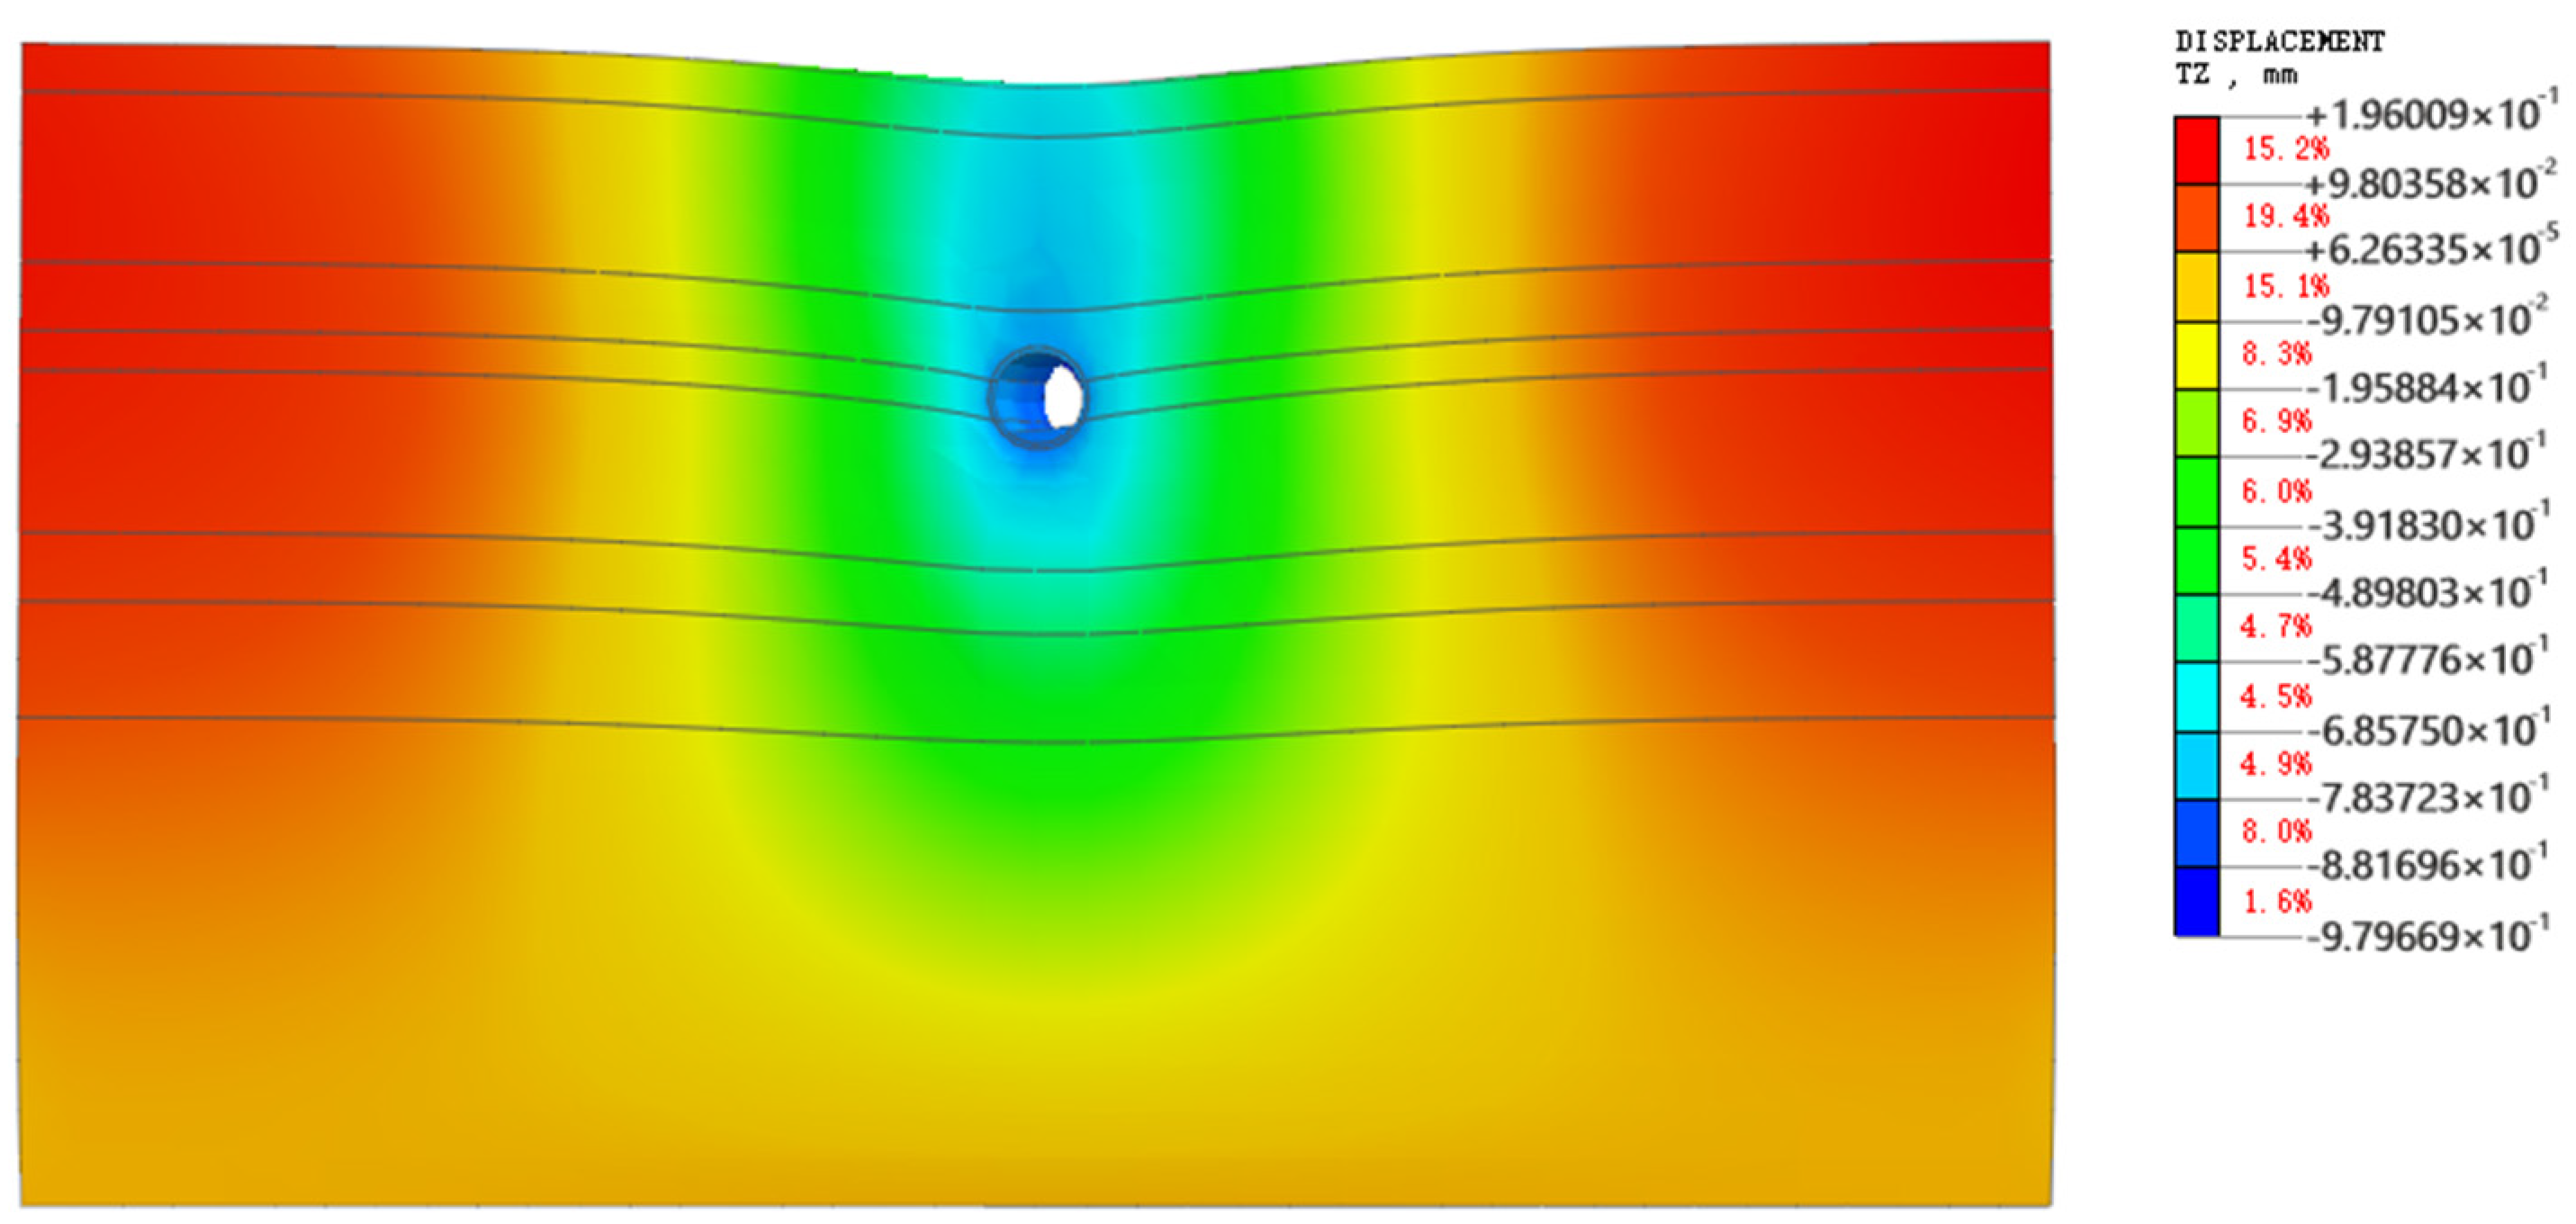
Figure 19.
Analyze the vertical deformation of the point.
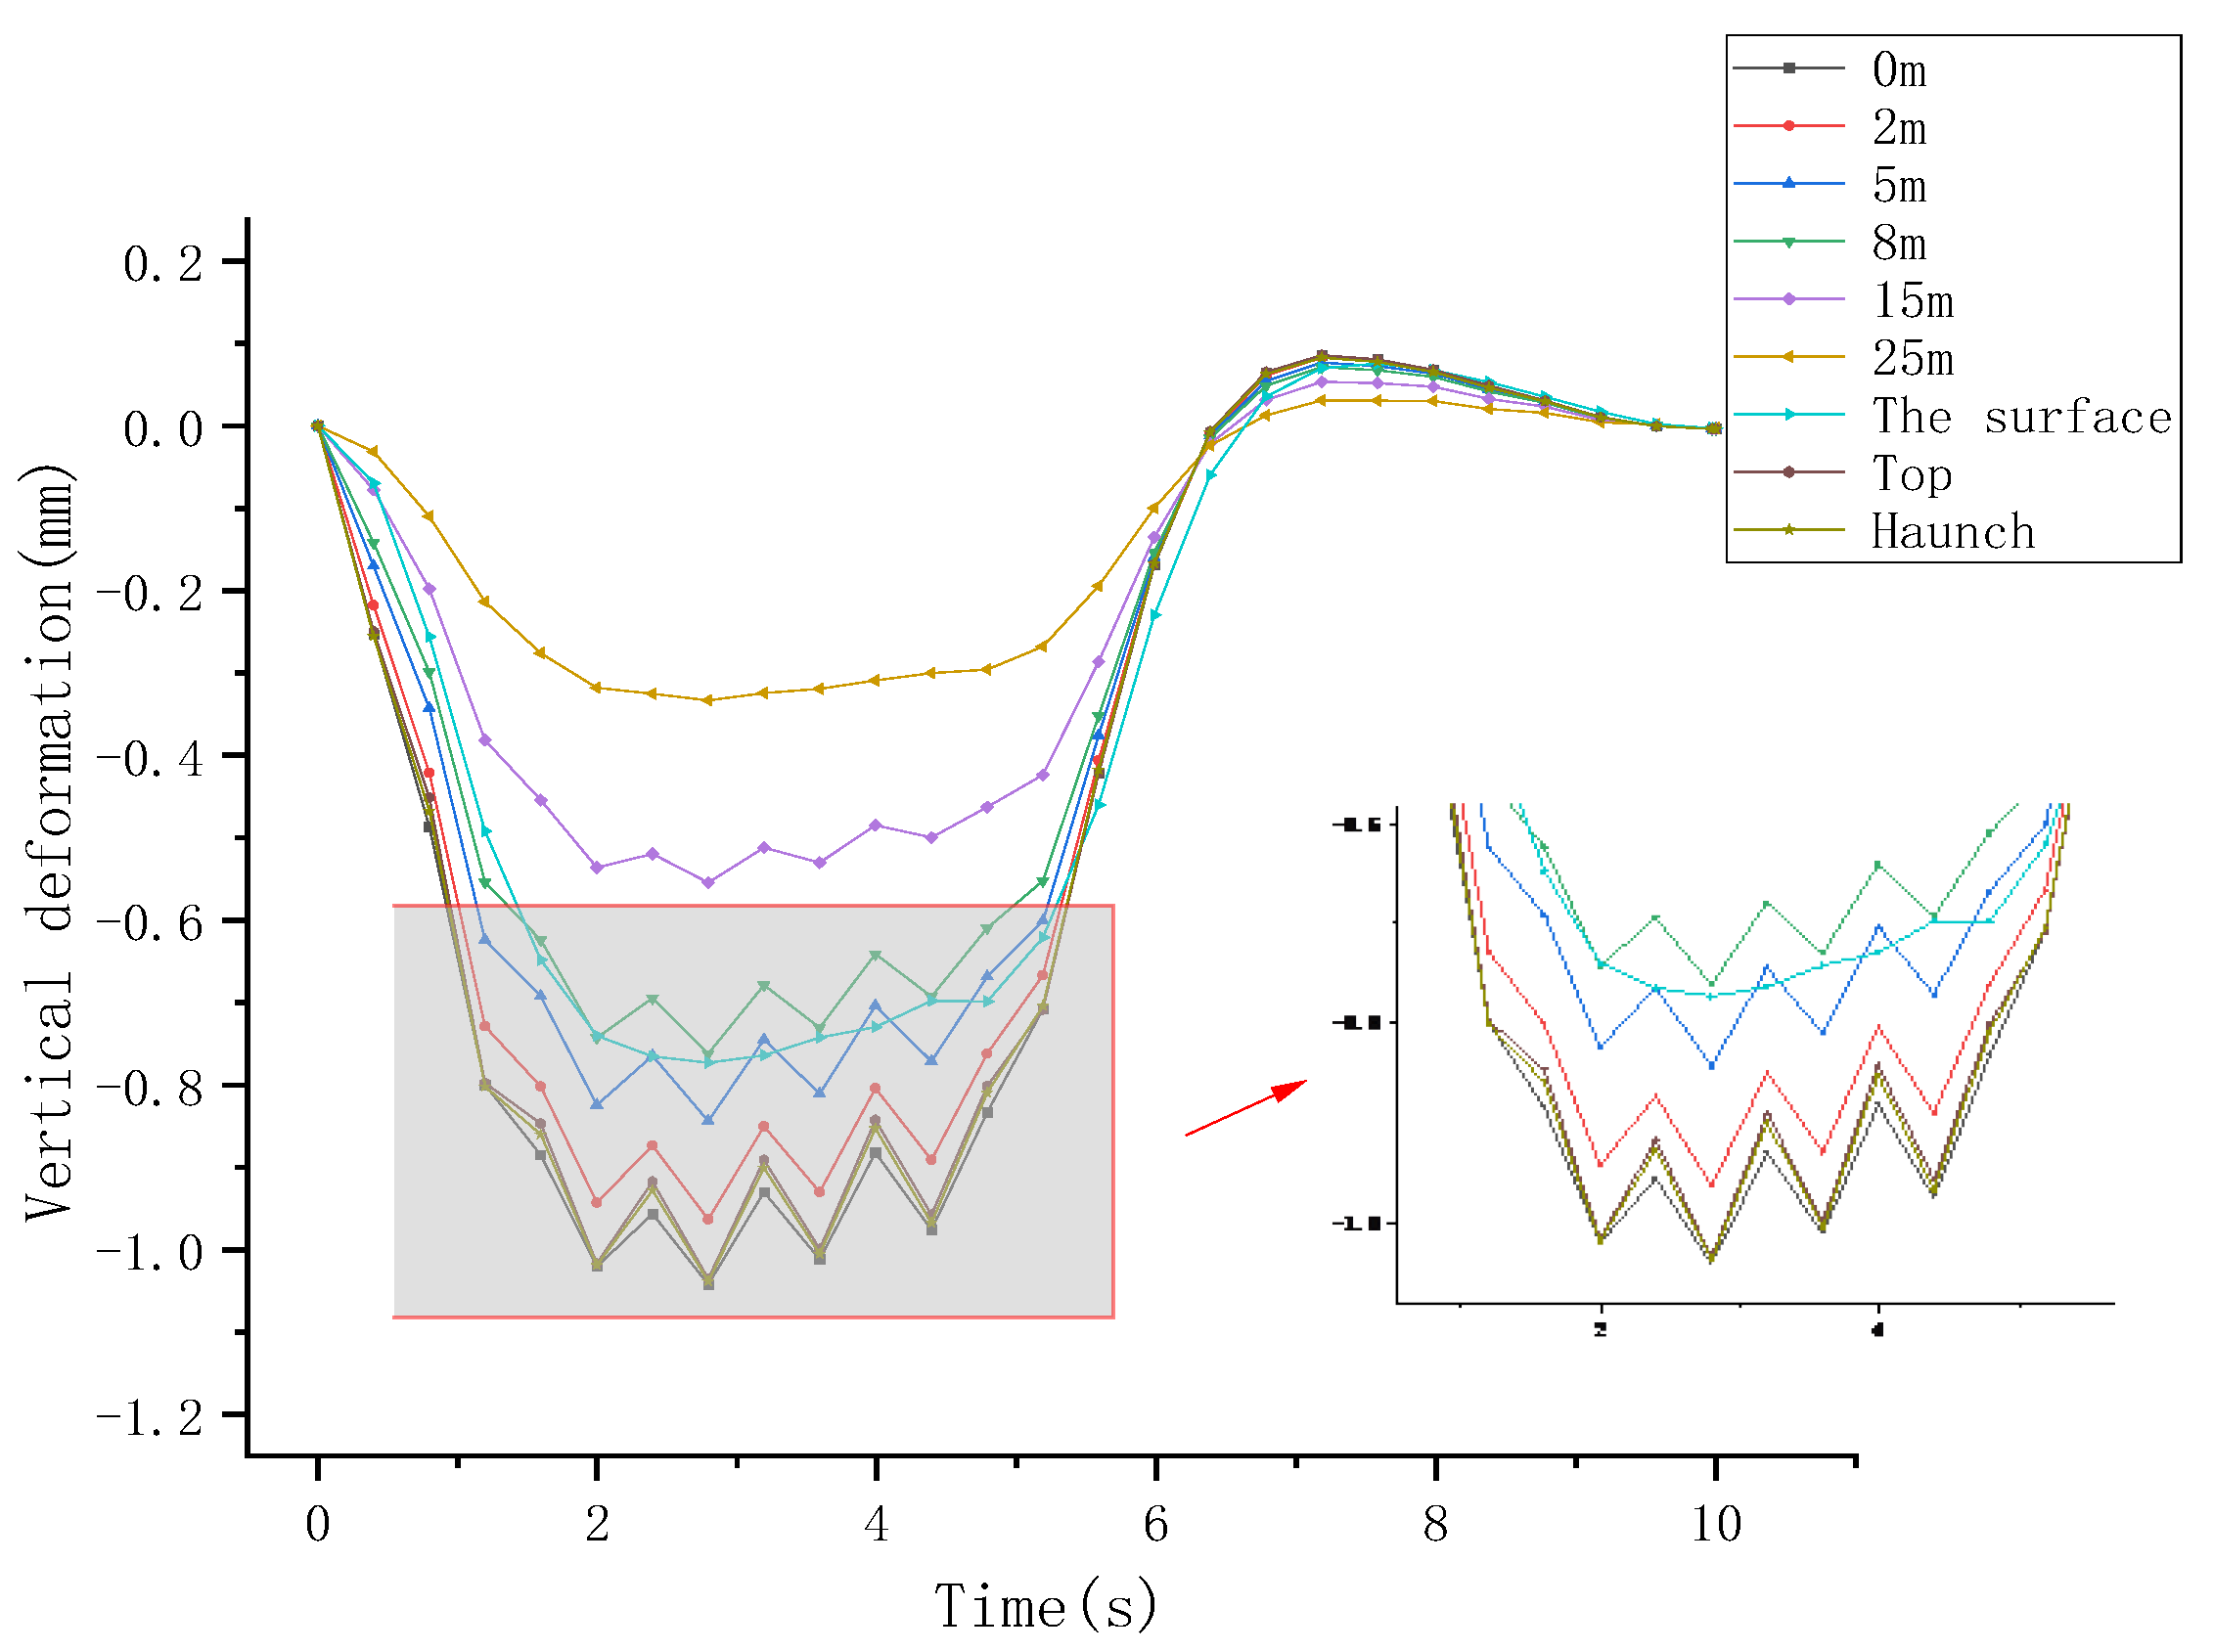
Figure 20.
Analyze the peak vertical deformation of the point.

Figure 21.
Vertical deformation changes after a single loading of different curve radii.

Figure 22.
Peak comparison of single-loaded vertical deformation of different curve radii.

Figure 23.
Vertical deformation of the tunnel base after single loading at different speeds.
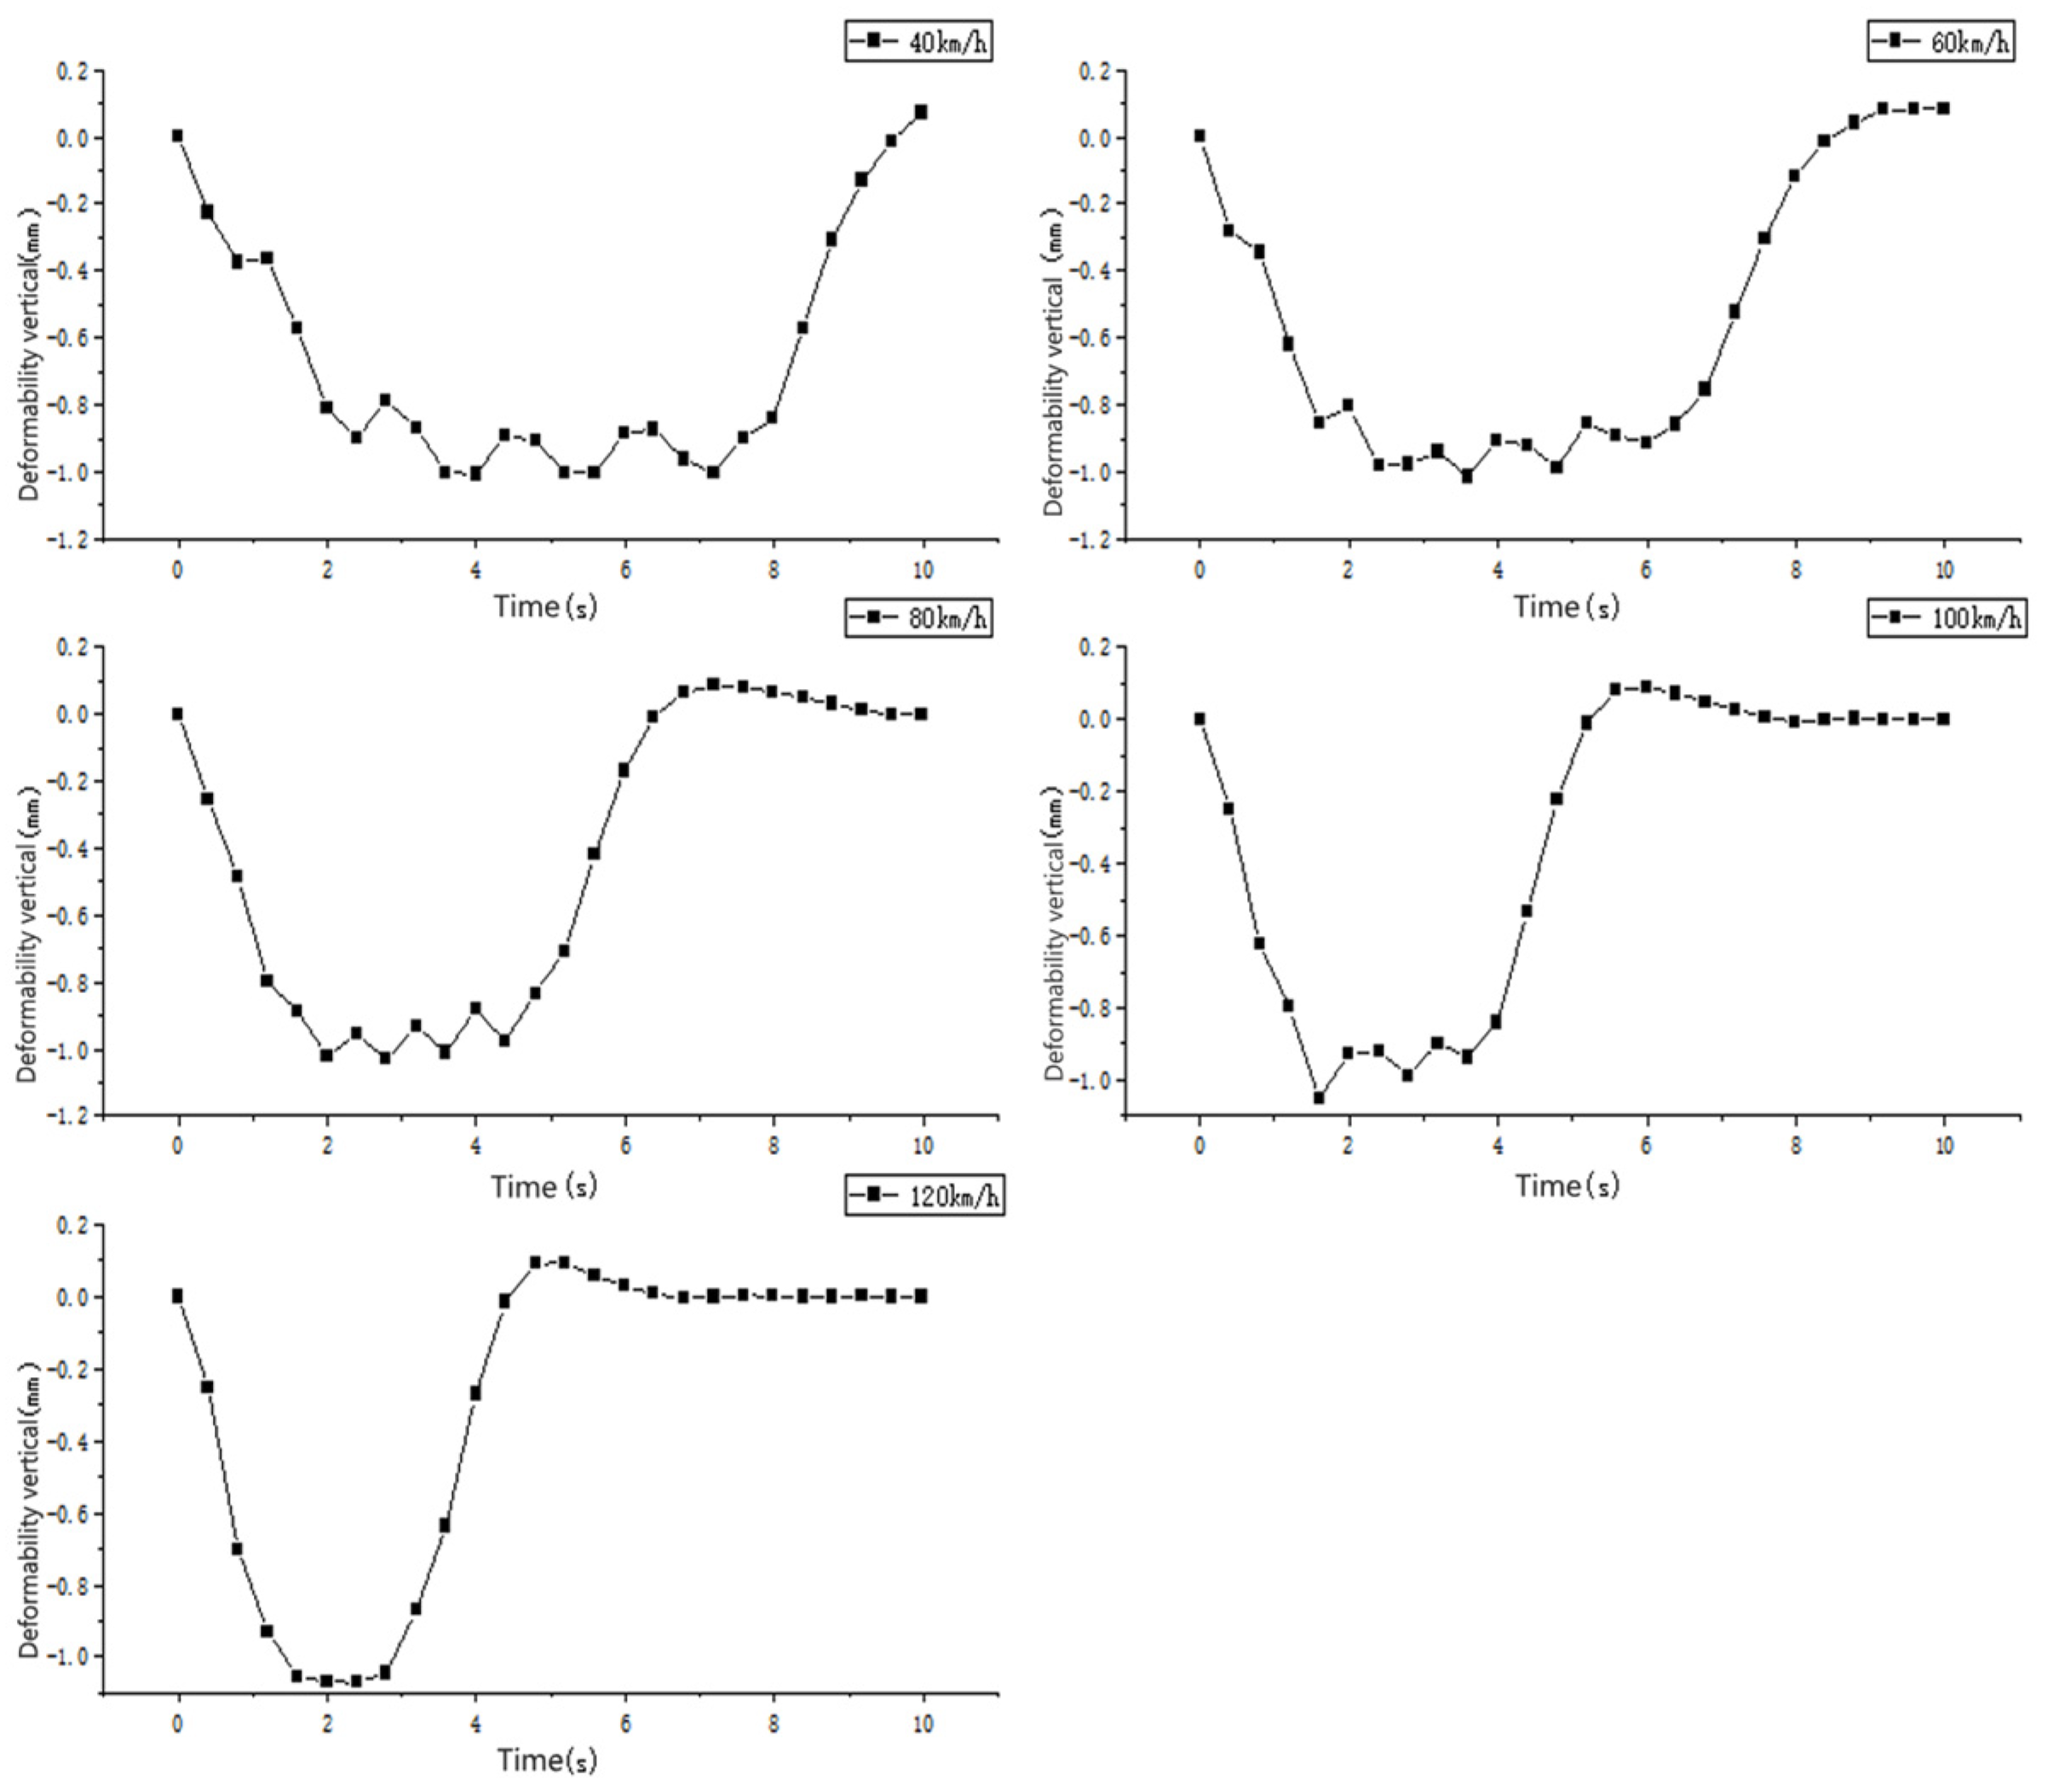
Figure 24.
Comparison of vertical deformation peak of single loading at different speeds.
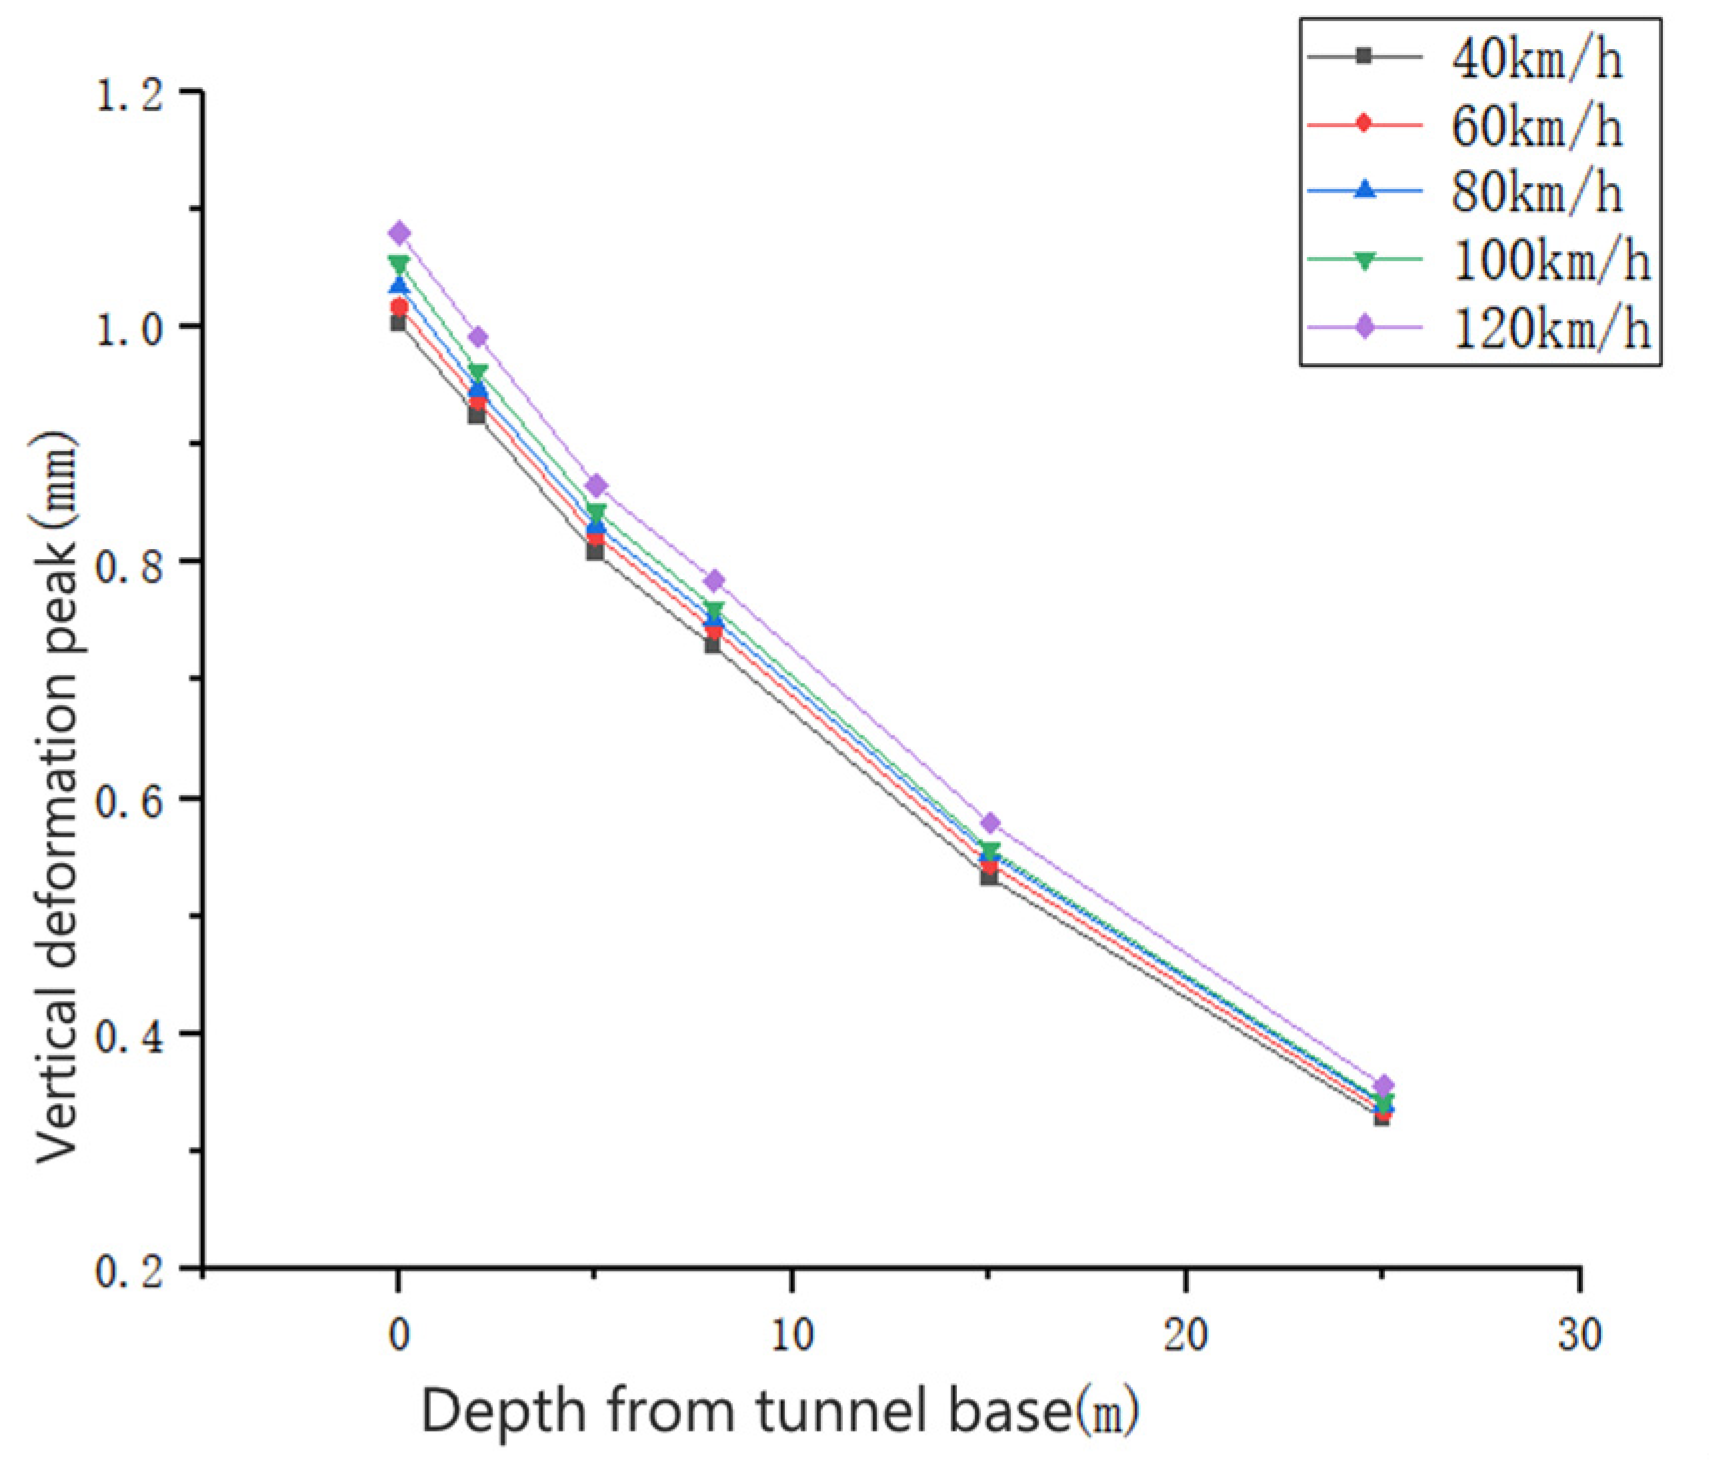
Figure 25.
Comparison between measured and simulated settlement values on the upward track of the tunnel.
Figure 25.
Comparison between measured and simulated settlement values on the upward track of the tunnel.

Table 1.
Monitoring site information.
| Monitoring Point Number | Clear Distance between Monitoring Point and Tunnel Contour Plane/m | Monitoring Point Hole Depth/m | Distance between Hole Bottom and Tunnel Floor/m | Monitoring Equipment |
|---|---|---|---|---|
| K1 | 4.8 | 21.5 | 0.5 | Automatic |
| K2 | 3.6 | 21.5 | 0.9 | Artificial |
| K3-1 | 4.6 | 20.0 | 0.6 | Artificial |
| K3-2 | 4.6 | 23.0 | 3.6 | Automatic |
| K3-3 | 4.6 | 28.0 | 8.6 | Automatic |
| K3-4 | 4.6 | 38.0 | 18.6 | Automatic |
| K4 | 4.8 | 19.0 | 0.8 | Artificial |
| K5 | 3.3 | 18.0 | 0.8 | Automatic |
| K6 | 3.7 | 21.5 | 0.5 | Artificial |
| K7 | 3.9 | 21.5 | 0.9 | Artificial |
| K8 | 4.4 | 20.0 | 0.5 | Artificial |
| K9 | 3.8 | 19.0 | 0.6 | Artificial |
| K10 | 3.6 | 18.0 | 0.6 | Artificial |
| K11-1 | 4.0 | 20.0 | 0.5 | Artificial |
| K11-2 | 4.0 | 23.0 | 3.5 | Artificial |
| K11-3 | 4.0 | 28.0 | 8.5 | Artificial |
| K11-4 | 4.0 | 38.0 | 18.5 | Artificial |
Table 2.
Physical and mechanical properties indexes of each soil.
| Name of Soil Layer | Layer Thickness/m | Modulus of Elasticity E/MPa | Poisson’s Ratio/µ | Heavy KN/M3 | Angle of Friction/° | Cohesion /KPa |
|---|---|---|---|---|---|---|
| Miscellaneous fill | 2.855 | 9 | 0.37 | 17 | 18 | 10 |
| Silt | 10.095 | 8.1 | 0.3 | 19.6 | 20 | 14 |
| Silty clay | 4.04 | 5.2 | 0.3 | 19.2 | 10 | 19 |
| Silty sand | 2.3475 | 12.63 | 0.3 | 20.2 | 24 | 0 |
| Medium sand | 9.51 | 34.58 | 0.25 | 20.8 | 31 | 0 |
| Silty clay | 4.0275 | 11.58 | 0.25 | 20 | 13 | 22 |
| Medium sand | 6.775 | 33.33 | 0.25 | 20.8 | 30 | 0 |
| Silty clay | 28.65 | 20.35 | 0.3 | 20.1 | 14 | 16 |
| Lining | 0.3 | 34.5 | 0.2 | 25 | / | / |
| Roadbed | 0.44 | 30 | 0.2 | 25 | / | / |
Table 3.
Train loads at different curve radii.
| Axle Load /t | Vehicle Speed km/h | Turning Radius /m | Vertical Load /kN | Lateral Load /kN |
|---|---|---|---|---|
| 13 | 80 | 250 | 128.82 | 12.66 |
| 80 | 350 | 128.62 | 7.61 | |
| 80 | 500 | 128.17 | −0.56 | |
| 80 | 700 | 127.79 | −4.21 | |
| 80 | 1000 | 127.50 | −6.94 | |
| 80 | straight line | 130 | / |
Disclaimer/Publisher’s Note: The statements, opinions and data contained in all publications are solely those of the individual author(s) and contributor(s) and not of MDPI and/or the editor(s). MDPI and/or the editor(s) disclaim responsibility for any injury to people or property resulting from any ideas, methods, instructions or products referred to in the content. |
© 2023 by the authors. Licensee MDPI, Basel, Switzerland. This article is an open access article distributed under the terms and conditions of the Creative Commons Attribution (CC BY) license (https://creativecommons.org/licenses/by/4.0/).
Share and Cite
MDPI and ACS Style
Sun, L.; Zhao, J.; Qin, W.; Hou, D.; Wang, X. Dynamic Response Analysis of Soil around Curve Section Tunnel under Train Vibration Load. Appl. Sci. 2023, 13, 8013. https://doi.org/10.3390/app13148013
AMA Style
Sun L, Zhao J, Qin W, Hou D, Wang X. Dynamic Response Analysis of Soil around Curve Section Tunnel under Train Vibration Load. Applied Sciences. 2023; 13(14):8013. https://doi.org/10.3390/app13148013
Chicago/Turabian StyleSun, Liguang, Jiansheng Zhao, Wenqian Qin, Dazhao Hou, and Xiaorui Wang. 2023. "Dynamic Response Analysis of Soil around Curve Section Tunnel under Train Vibration Load" Applied Sciences 13, no. 14: 8013. https://doi.org/10.3390/app13148013
Note that from the first issue of 2016, this journal uses article numbers instead of page numbers. See further details here.