
Techno-Economic Assessment of an Innovative Small-Scale Solar-Biomass Hybrid Power Plant


1
Departamento de Máquinas y Motores Térmicos, Escuela Superior de Ingeniería, Universidad de Cádiz, Avda. Universidad de Cádiz, n° 10, 11519 Puerto Real (Cádiz), Spain
2
Departamento de Ingeniería Energética, Escuela Técnica Superior de Ingeniería, Universidad de Sevilla, Camino de los Descubrimientos s/n, 41092 Seville, Spain
*
Author to whom correspondence should be addressed.
Appl. Sci. 2023, 13(14), 8179; https://doi.org/10.3390/app13148179
Submission received: 13 June 2023
/
Revised: 10 July 2023
/
Accepted: 11 July 2023
/
Published: 13 July 2023
(This article belongs to the Special Issue Sustainable Biomass Energy: Recent Technologies and Applications)
Abstract
:The current context of the climate emergency highlights the need for the decarbonization of the energy sector by replacing current fossil fuels with renewable energy sources. In this regard, concentrating solar power (CSP) technology represents a commercially proven alternative. However, these types of plants are associated with high production costs and difficulties in controlling production during temporary variations in solar resource availability. In order to minimize these drawbacks, this study proposes the hybridization of CSP technology with direct biomass combustion, with the particularity of an innovative process scheme that does not correspond to traditional series or parallel configurations. This paper focuses on the techno-economic evaluation of this novel configuration in a small-scale power plant. To achieve this, both solar resource and biomass production, which are dependent on the selected location, were analyzed. Additionally, the plant was characterized from both technical and economic perspectives. The obtained results allowed for the characterization of the Levelized Cost of Energy (LCOE) based on various parameters such as the size of the solar field and biomass boilers, as well as limitations on biomass consumption.
1. Introduction
The need to limit the impact of the power generation sector on the environment is clearly identified in the UN’s Sustainable Development Goals, which propose actions in the areas of energy, the atmosphere, and climate change [1]. Currently, there is evidence of a nearly linear relationship between cumulative greenhouse gas (GHG) emissions and global temperature variation [2]. In such a scenario, there has been a growing interest in the development and application of cleaner and more sustainable power generation technologies [3]. Renewable energies constitute a technically feasible alternative, allowing for the simultaneous reduction of GHG emissions.
Unlike other renewable technologies such as wind or photovoltaic, concentrating solar power (CSP) plants are currently not economically competitive compared to fossil fuel-based power generation due to their high production costs [4,5]. Additionally, CSP technology has an added disadvantage in managing electricity production due to the high variability of solar resources, which necessitates costly thermal energy storage systems [6]. However, there is a wide consensus in the scientific community that one of the most promising alternatives for reducing the costs of CSP plants is hybridization with other lower-cost generation technologies [7], such as direct biomass combustion, which is considered carbon-neutral [8,9]. The cost reduction attributed to CSP-biomass hybridization stems from the shared use of infrastructure and common equipment [10]. In addition to the aforementioned production cost reduction, hybridization contributes to improving the dispatchability of electricity generation compared to conventional CSP plants, which are more or less subject to the randomness of solar resources [11,12]. Furthermore, other additional advantages derived from CSP-biomass hybridization include improved thermal cycle efficiency and reduced environmental impact due to the smaller solar field size and lower water consumption [13].
While most publications regarding CSP-biomass hybridization refer to theoretical studies [14,15,16], the most notable milestone in this field is the Termosolar Borges project in Spain. This 22.5 MW capacity plant, operational since 2012, was the first commercial plant to use biomass from agricultural residues to complement solar resource generation through parallel hybridization [17]. The Brønderslev plant in Denmark, although smaller in size (4 MW), is also noteworthy [18].
Economic analysis is a fundamental part of any feasibility study, especially when addressing projects of an innovative nature [19]. In the field of power generation plants, the Levelized Cost of Energy (LCOE) serves as the benchmark indicator for comparing different technologies [20,21] and as a guide for design optimization [22,23]. However, the LCOE has limitations, such as not taking into account the dispatchability of electricity production when evaluating certain renewable technologies [24,25]. In the specific case of CSP-biomass hybridization, noteworthy economic analyses were conducted by Milani et al. [26] and Bai et al. [27].
The objective of this study was to assess the economic viability of a CSP-biomass hybrid plant based on an innovative series/parallel-process scheme. The hypothetical power plant analyzed in this work had a capacity corresponding to a small scale, with a chosen gross generation capacity of 2 MW. This study was structured into three parts. First, the materials and methods applied in this work, including the influence of the selected location, technical plant characterization, and economic analysis details, are presented. Next, the obtained results are analyzed, encompassing daily simulations, annual balances, and the calculation of the LCOE. Finally, the conclusions drawn from this analysis are presented.
2. Materials and Methods
2.1. Plant Location Characterization
The development of the feasibility analysis for the hybrid plant under study required the characterization of both the available solar resources and the biomass production. However, these two parameters are strongly dependent on the selected plant location. Therefore, the decision made regarding the chosen location for this study is justified below.
While selecting a location for a conventional power plant is always a critical decision, the complexity of this decision increases in the case of a CSP-biomass hybrid power plant. This added complexity arises from the need for high availability of both of the two primary energy sources used for electricity generation. In other words, in the case of the plant under study, high levels of both annual irradiation and biomass production had to be ensured. For this reason, the region of Andalusia (southern Spain) was selected as an optimal location for a plant of this type.
From the perspective of solar resources (Figure 1), the most attractive areas in Andalusia are the Guadalquivir Valley (western Andalusia) and the province of Almería (eastern Andalusia), both of which have annual direct normal irradiation values exceeding 1900 kWh/m2.
On the other hand, Andalusia is a region with a high capacity for biomass generation with an estimated annual production of 20.1 million tons, encompassing sources such as agriculture, forestry, industry, energy crops, and urban and industrial waste. However, the technical characterization of the hybrid plant required the selection of a specific type of biomass, as this aspect greatly influences the design of critical components such as biomass boilers. Agricultural biomass represents 33% of the total energy potential of biomass produced in Andalusia, with olive crop residues (2.5 million tons/year) being particularly significant. However, due to its lower chlorine content, which allows for higher working temperatures in the boilers, the chosen biomass type corresponded to forest residues. This type, consisting of residues from the maintenance (pruning and cutting) of forest stands mainly composed of pine (pinus), eucalyptus (eucalyptus), and oak (quercus), has an annual production of 1.3 million tons, with the province of Huelva (western Andalusia) contributing 50% of it (Figure 2).
The combined analysis of available solar resources and biomass led to the conclusion that the western region of Andalusia combines high levels of both resources. For this reason, a site corresponding to the latitude 37.25° north and longitude 6.50° west was chosen as the hypothetical plant location.
Once the exact location of the hybrid plant under study was determined, a typical design year was developed based on the information available in the NSRDB (NREL) [30,31], which provides representative values of various meteorological variables. Among these variables, direct normal irradiance (DNI) is worth noting, and its annual evolution is shown in Figure 3. The typical design year had a resolution of 10 min, as can be observed in Figure 4, which displays the temporal evolution of DNI for the four days corresponding to the two equinoxes and the two solstices. Lastly, the typical design year revealed an annual direct normal irradiation of 2150 kWh/m2 with an uncertainty of less than 10%, making it highly suitable for the implementation of a CSP plant.
Regarding the impact of the hybrid plant’s location on the availability of forest biomass, it is worth noting that within a radius of 25 km, a production of 146 kton/year was quantified. The maximum distance of 25 km chosen as a reference was based on the fact that biomass, unlike traditional fossil fuels, has a large volume, which directly affects transportation costs [32].
2.2. Technical Characterization
Below are the most characteristic parameters of the plant. In terms of the power cycle, since the gross electrical power of the plant was 2 MW, it is worth noting that a non-regenerative Rankine cycle without intermediate reheating was employed. Table 1 summarizes the main characteristics of the Rankine cycle considered.
Next, the parameters corresponding to the solar field of the parabolic trough collectors are presented. The solar field consisted of loops of 4 collectors with a length of 150 m each, and their main characteristics are shown in Table 2 [33]. The collectors were aligned along the north–south axis. Although the final size of the solar field was determined through a techno-economic optimization process, it was initially considered that the design DNI of the solar field was 850 W/m2 and was the optical efficiency corresponding to solar noon on the summer solstice. The heat transfer fluid used in the solar field was a synthetic oil. Specifically, a eutectic mixture of 73.5% diphenyl oxide and 26.5% diphenyl was considered [34]. Due to the temperature limitations of the heat transfer fluid in the boundary layer of the absorber tube, a minimum DNI of 150 W/m2 was required for the operation of the solar field. The analyzed plant did not have a thermal energy storage system, as one of the aims was to demonstrate the production management capability derived from the proposed process scheme.
In terms of the hybridization configuration for steam generation, the solar steam generator (SSG) consisted of shell-and-tube heat exchangers, while the boilers used for the proposed plant were based on the cooled grate burner technology. Given that the proposed hybrid scheme involved operating the biomass boilers at partial load, it was necessary to characterize their performance. Within the range from their nominal power to 75% load, the biomass boilers are capable of generating steam at nominal conditions, with only the mass flow rate being modified. In the range from 75% to 50% load, in addition to reducing the steam mass flow rate, the boilers are unable to generate steam at nominal conditions. Instead, it was assumed that there is a linear decrease in temperature from the nominal temperature (at 75% load) to the saturation temperature (at 50% load). Finally, within the range from 50% load to the minimum load (20%), the biomass boilers generate saturated steam. The design inputs for the biomass boilers were completed with the assumption of a combustion efficiency of 88%, an excess air factor of 30%, and a furnace exit gas temperature (FEGT) of 700 °C. This temperature could be reached because the chosen biomass type was forest residue, which has a lower heating value of 14.63 MJ/kg on a dry basis.
The main decision regarding the technical characterization of the plant in this study was determining the hybridization configuration of the two technologies used for steam generation. Traditionally, hybrid plants have been based on either series or parallel designs. Below are some of the most relevant advantages and disadvantages of these two types of hybrid configuration:
- The main advantage of series hybridization is that it allows for an increase in the live steam temperature of the Rankine cycle, which contributes to improving the thermal efficiency of the plant [35]. Additionally, this compensates the limitation of the maximum allowable temperature of the synthetic oil employed as heat transfer fluid in current parabolic trough solar power plants. One disadvantage of series hybridization is that the biomass boiler and the solar steam generator must operate simultaneously, limiting the operating time of the hybrid plant and linking its operation to the availability of solar radiation. This does not improve the dispatchability of the energy supplied to the electrical distribution grid and negatively affects the profitability of the plant.
- Although parallel hybridization designs do not improve the efficiency of the hybrid plant compared to conventional parabolic trough solar plants, this configuration allows the hybrid plant to operate during periods of null or low solar radiation [36]. This improvement has a very positive influence on the dispatchability of the electrical supply, decoupling it from the random nature of solar resources. Additionally, the increase in operating hours of this configuration has a positive impact on the profitability of the plant.
While initially considering only the possibility of choosing between series or parallel hybridization between the solar steam generator and the biomass boiler, a more complex configuration was ultimately adopted, consisting of a mixed series/parallel hybridization (Figure 5). It can be observed that the SSG was supported by a biomass boiler in parallel (Boiler 2). In this way, Boiler 2 compensated for fluctuations in solar resource availability. Additionally, an additional biomass boiler (Boiler 1) was proposed in the series with the SSG and Boiler 2 to improve the quality of the generated steam. The combustion products used in the superheater of Boiler 1 came from a furnace, which needed to be cooled. For this reason, the furnace of Boiler 1 also acted as an evaporator located in parallel with the evaporators of the SSG and Boiler 2. Finally, the thermal energy from the combustion products at the outlet of the superheater of Boiler 1 was utilized in an economizer located upstream of the SSG and Boiler 2. This achieved higher process efficiency by reducing the stack temperature of the flue gases in Boiler 1. The proposed configuration, although more complex than traditional hybridizations, simultaneously allowed for control of the dispatchability of the power plant and for the improvement of the live steam parameters, resulting in improved thermal performance. Furthermore, the proposed hybridization scheme enabled a significant increase in the operating hours of the hybrid plant compared to a conventional CSP plant, without the need for expensive thermal energy storage systems. Lastly, compared to conventional biomass plants, the proposed hybrid plant reduced biomass consumption, thereby reducing its global carbon footprint. Although the present study did not consider it, in the future, the possibility of extending the hybridization to include biomass treatment will be evaluated, for instance, through the use of solar-based drying technologies as proposed by Kumar et al. [37].
The following economic analysis took into account different designs of CSP-biomass hybrid power plants, all based on the previously described concept of mixed hybridization. The various designs considered variations in the size of the solar field, characterized by the Solar Multiple (SM); as well as the thermal power of Boiler 2, characterized by the Biomass Fill Fraction (BFF). The SM represents the ratio between the surface area actually considered for the solar field and the surface area of the solar field that, under the design conditions (850 W/m2, noon of the summer solstice), provides the nominal thermal power. On the other hand, the BFF corresponds to the percentage of electrical power that can be achieved by operating solely with biomass in the complete absence of solar radiation.
2.3. Economic Analysis
The economic viability analysis of the hybrid power plant proposed in this study was based on the assessment of the LCOE, commonly used in evaluating the profitability of power production technologies [38,39]. The suitability of this parameter lies in comparing the present value of investment costs (CAPEX), operation and maintenance costs (OPEX), and financing costs with the annual energy production [40]:
where the term LCC corresponds to life cycle cost, is the annual energy production (assumed constant throughout the project’s lifetime), is the project’s lifetime period, and is the discount rate considered. In turn, the LCC is obtained from the initial investment () and the present value of the annual operation and maintenance costs (), which also include costs associated with project financing, insurance, and taxes:
The analysis of the LCOE allows for the determination of a theoretical constant price throughout the project’s lifetime (EUR/kWh). The CAPEX includes costs such as development, consenting, engineering, procurement, construction, and commissioning, while the OPEX encompasses both direct and indirect costs [41]. Both the investment required for the plant’s execution and the operation and maintenance costs (Table 3) were characterized using the System Advisor Model [42]. The main financial and tax parameters considered for the LCOE analysis are presented in Table 4.
As shown in Table 4, no incentives such as subsidies or tax exemptions were considered. Additionally, the depreciation of assets followed a linear model applied over the plant’s lifetime. Furthermore, the debt return period varied for each analyzed case. Although its impact was not significant, the objective was to minimize the duration of this period while ensuring positive cash flows at all times. An annual availability of 95% and parasitic losses of 10% were assumed. Regarding biomass consumption, which constituted the main operating and maintenance costs of the hybrid plant, a cost of EUR 65/ton was considered. This cost included the acquisition, preprocessing (chipping), and transportation of forest biomass to the plant.
To conclude with the characterization of the applied methodology, Figure 6 shows a workflow that summarizes the different stages that were addressed in carrying out this work. Figure 6 shows the input data, the most significant calculation processes, the decisions and, finally, the results generated.
3. Results and Discussion
3.1. Simulation
As mentioned earlier in Section 2.2, for the development of this analysis, different designs of hybrid plants were considered, varying both the SM and the BFF. Given the relatively small size of the proposed plant in this study, only two realistic values of BFF were considered. This is due to the technical difficulty of implementing biomass boilers with cooled grate burners on a very small scale. Therefore, two alternatives were analyzed regarding the size of Boiler 2, one corresponding to a BFF of 100% and another to a BFF of 50%. Regarding the size of the solar field, SM values from 0.5 to 2.5 were considered in intervals of 0.5.
Figure 7 and Figure 8 show the hourly evolution of both the biomass consumption and gross electric power generated for the same four representative days previously shown in Figure 4. Both figures assume SM = 1. However, Figure 7 considers BFF = 100%, while Figure 8 considers BFF = 50%. The analysis of Figure 7 (BFF = 100%) highlights the complete independence of the generated power from the solar resource, even on days with high variability such as days #172 and #355. By regulating the mass flow rate of the biomass consumed in Boiler 2, the steam turbine can maintain operation at its nominal power. It can be observed that during periods of null or low solar resource availability, biomass consumption increases, compensating for the deficit of thermal energy from the solar field. When the BFF is reduced to 50% (Figure 8), notable differences compared to Figure 7 are observed. The first difference is the inability to maintain the steam turbine operating at full load during periods of null or low solar resource availability, resulting in a decrease in gross electric power generated to 1 MW (BFF = 50%). Additionally, it is identified that when the thermal power provided by the solar field drops below a certain value, biomass consumption decreases. This decrease corresponds to the reduction in the steam turbine load to 50%, as mentioned earlier.
3.2. Annual Balances
After simulating the daily behavior of the different analyzed plant configurations (with varying SM and BFF values), annual balances were conducted for both the gross electric energy generated and the biomass consumption by combining the typical design year (Section 2.1) and the technical characterization (Section 2.2). However, the mentioned annual energy and biomass balances not only depended on the combination of SM and BFF considered in each analyzed case but also on the existence of limits on the amount of biomass consumed. This was because it is common for current legislation to limit the maximum fraction of energy generated from biomass [43], which is cheaper than energy generated from CSP technology. For this reason, two extreme situations were identified for each considered plant. The first corresponded to the absence of limits on biomass consumption. In this case, the mixed hybrid plant could generate during periods of no solar radiation, with the only limit on biomass consumption derived from the BFF and the maximum allowable hours of annual operation. The second extreme case corresponded to a situation where biomass could only be consumed as a complement to solar resources. In other words, in the second case, biomass could not be used for nighttime operation (direct biomass combustion without solar input). In addition to the mentioned extreme cases, intermediate limitations on biomass consumption were considered. Specifically, limits from 40% to 75% were considered, with increments of 5%, although not all analyzed plant configurations could reach all these intermediate limits due to reaching one of the aforementioned extreme situations.
Figure 9 and Figure 10 show the annual biomass consumption (kton/year) and gross electric energy generated (GWh/year), respectively, as a function of the SM and the biomass consumption limit for the two considered BFF values. Firstly, it is worth noting that for any of the displayed graphs, the upper white area is delimited by the extreme case corresponding to the maximum allowable hours of annual operation. On the other hand, the lower white area corresponds to the limit derived from the impossibility of biomass consumption during nighttime operation. In both figures, it can be observed that within the analyzed ranges, both biomass consumption and energy generation increase with increasing SM or the limit of the maximum fraction of energy generated from biomass, regardless of the BFF value. The increase in both variables with increasing SM is not only due to the greater contribution of thermal energy from the solar field but also, given a biomass consumption limit, a higher solar production enables a greater generation of electricity from direct biomass combustion, which increases both the biomass consumption and the annual electricity generated. Regarding the influence of the BFF, when it is lower, both annual biomass consumption and gross electric energy production are lower due to the increased hours of operation at partial load.
3.3. Levelized Cost of Energy
The combination of annual balances of biomass consumption and gross electricity production (Section 3.2) with the previously mentioned economic parameters (Section 2.3) allowed for the characterization of the LCOE for the different plant configurations analyzed in this study. However, before proceeding to the analysis of the obtained results, it is necessary to quantify a series of relevant parameters. Firstly, although the LCOE associated with CSP technology strongly depends on factors such as the employed technology, the plant location, and the inclusion of thermal energy storage systems, representative values exceeding cEUR 23/kWh [44,45] are considered, while the corresponding value for biomass combustion plants is estimated at cEUR 18/kWh [46].
Figure 11 displays the results regarding the LCOE (cEUR/kWh) as a function of the SM and the biomass consumption limit for the two considered values of BFF. The obtained results demonstrate that increasing the biomass consumption limit leads to a reduction in LCOE, as the initial investment remains unchanged (constant SM and BFF) and the higher energy production compensates for the increased operation cost resulting from higher biomass consumption. In other words, for the considered biomass cost (EUR 65/ton), the most attractive scenarios in terms of minimizing the LCOE are those in which the majority of production is achieved through biomass combustion. Regarding the proposed hybrid plant configuration, the results indicate that for any considered biomass consumption limit, the optimal LCOE corresponded to SM = 1.5. This indicates that in designs with higher SM values, the increase in electricity production does not compensate for the cost increment.
Since, as shown in Figure 11, for the two considered values of BFF, the optimal LCOE corresponded to the extreme case associated with the absence of biomass consumption limits, Figure 12 presents the LCOE (cEUR/kWh) as a function of the SM in this scenario, as well as the biomass contribution (%) to annual electricity production. Under such circumstances, it can be concluded that lower BFF values resulted in a higher obtained LCOE. In other words, the lower investment and operating costs associated with the configuration with BFF = 50% failed to compensate for the lower annual electricity production. Additionally, it should be clarified that, given a BFF value, the SM value that optimized the LCOE did not correspond to 1.5, contrary to what was indicated earlier. This is because Figure 12 compares cases with different biomass contributions (Figure 12 right), whereas the SM = 1.5 optimum corresponds to constant biomass contributions.
However, the previous scenario where there are no limits on biomass contribution to annual electricity production is not representative of legal frameworks that prioritize renewable energies and provide incentives. In these situations, solar contribution is usually prioritized over biomass. As mentioned in Section 3.2, this is achieved by establishing a limit on biomass consumption, with a 50% limit being quite representative. For this reason, Figure 13 shows the LCOE (cEUR/kWh) as a function of SM for a 50% biomass contribution limit. It can be observed that for the BFF = 100% configuration, there is no case of SM = 1, as the minimum biomass contribution was 55%, which exceeded the maximum limit of 50%. As mentioned in the analysis of Figure 11, the first conclusion drawn from comparing Figure 12 and Figure 13 is the increase in LCOE resulting from the establishment of limits on biomass contribution. However, unlike Figure 12 and Figure 13 highlights that in contexts with limitations on biomass consumption, the BFF = 50% configuration was more cost-effective. This is justified by the fact that the limitation on biomass contribution results in periods of shutdown for the hybrid plant. In this situation, the lower investment and operating costs associated with the BFF = 50% configuration compensated for the lower annual electricity production, making this configuration more attractive. Finally, it can be observed that for the BFF = 50% case, the optimal LCOE was achieved with SM = 1.5, as previously indicated for cases with the same biomass contribution limit.
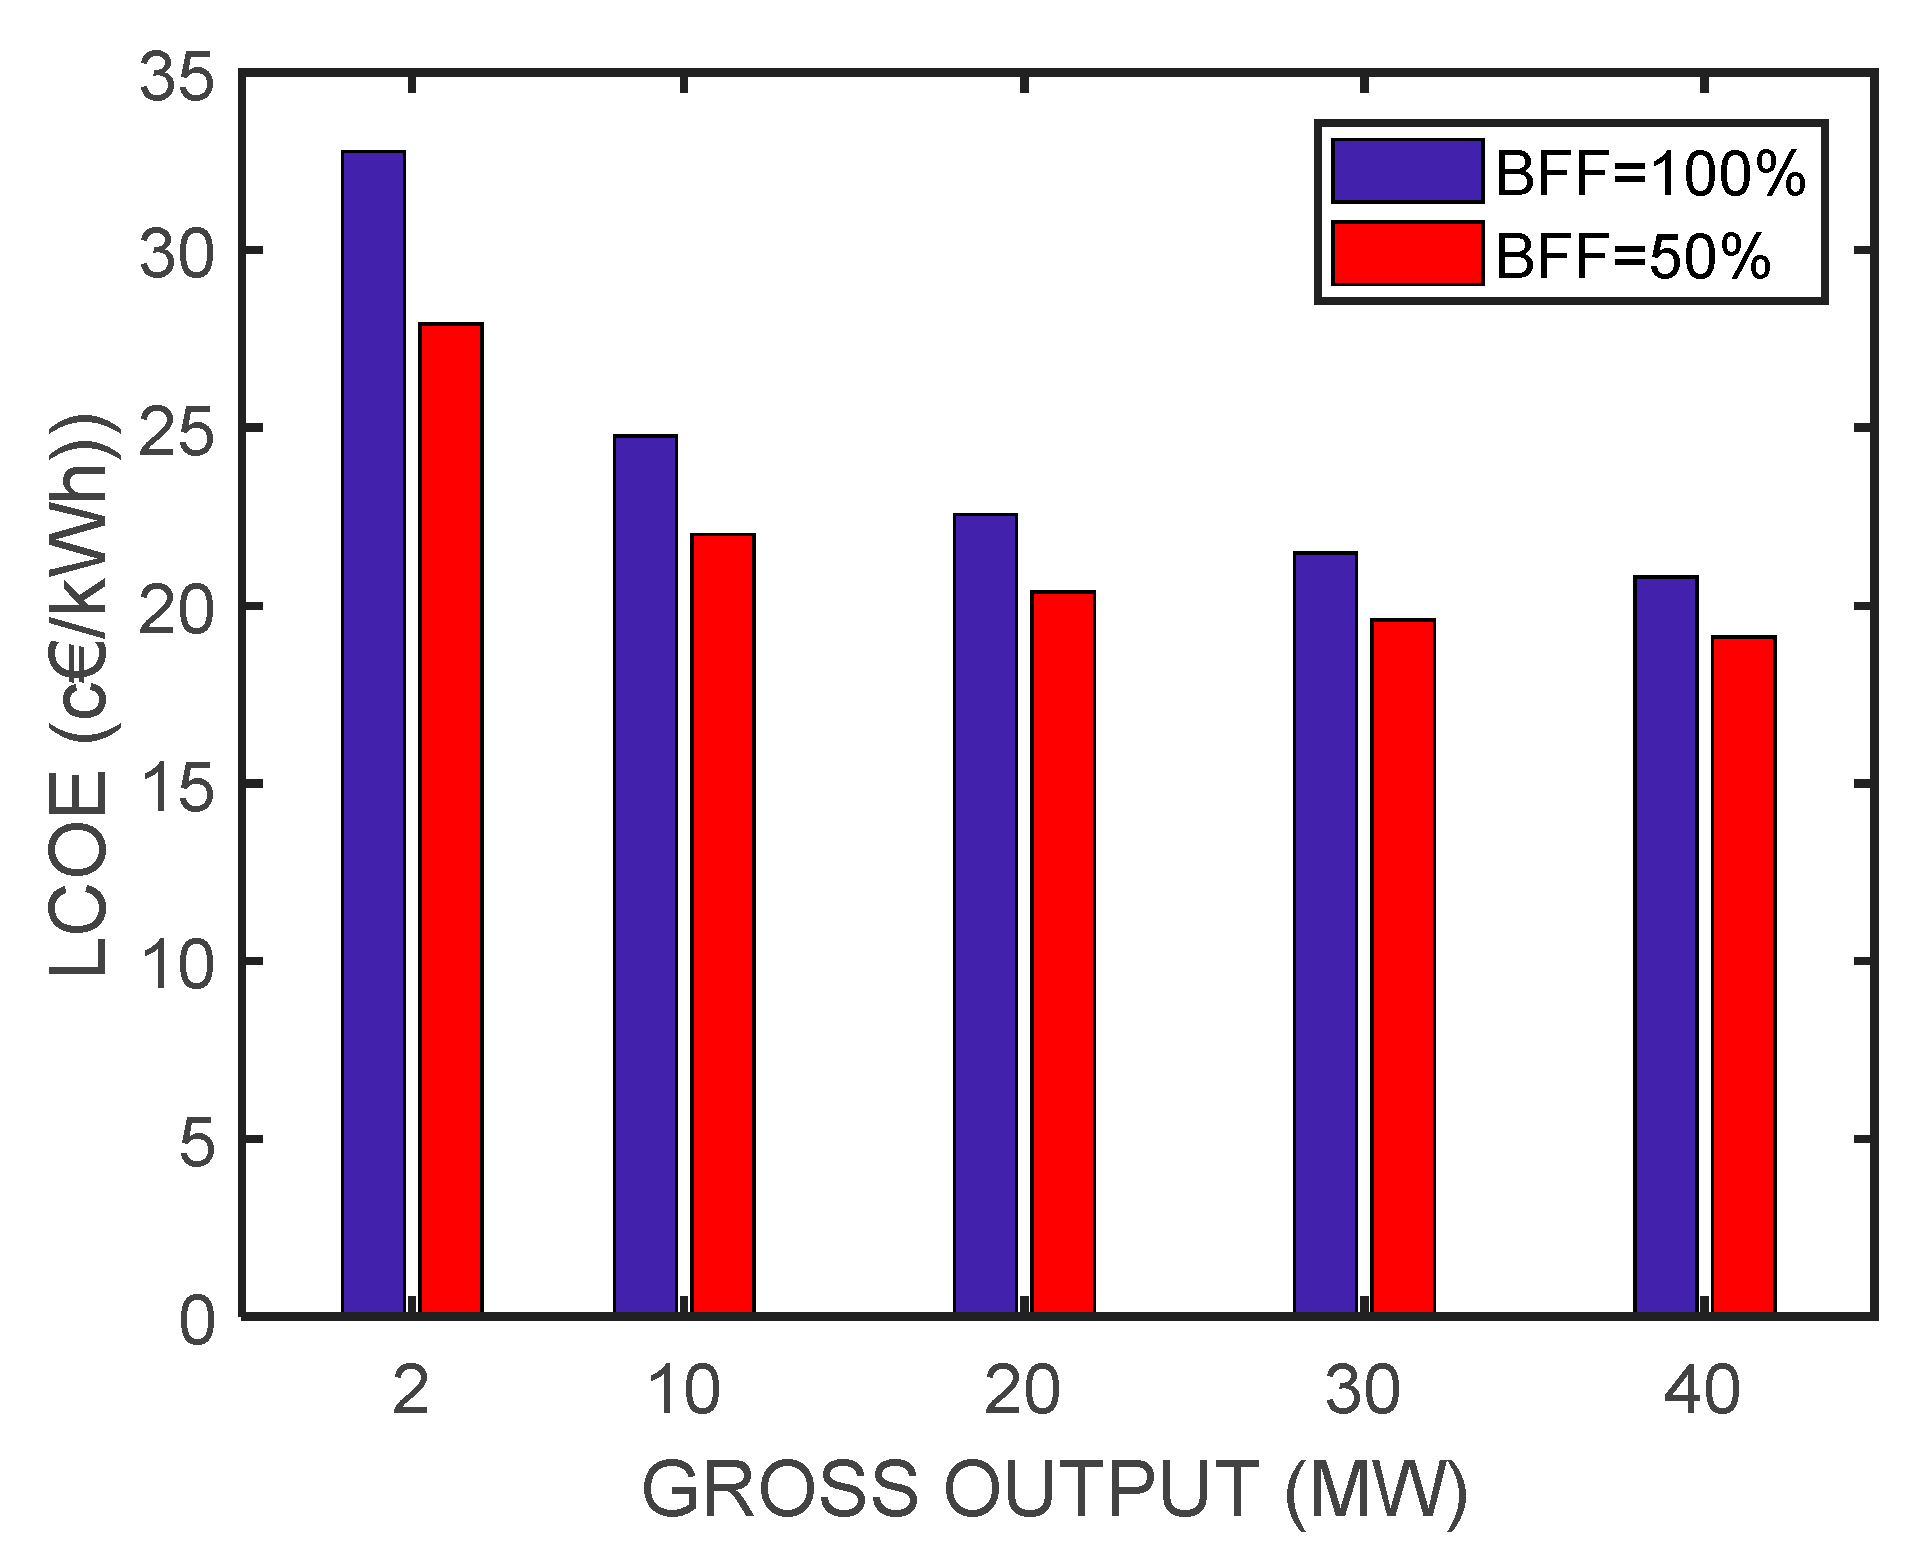
Consequently, it is concluded that the LCOE values obtained for a 2 MW plant are higher than the cEUR 23.8/kWh feed-in tariff applied in similar situations [47]. However, an increase in plant capacity has a positive impact on the corresponding LCOE results. Figure 14 shows the LCOE (cEUR/kWh) as a function of the gross power of the plant for a 50% biomass contribution limit and SM = 1.5. The obtained results demonstrated that increasing the plant capacity allowed for the minimization of the LCOE, reaching typical values for biomass plants. Specifically, it was determined that the aforementioned target value of cEUR 23.8/kWh was achieved with a plant size of 13.5 MW in the case of BFF = 100% and with 5.4 MW in the case of BFF = 50%. Lastly, it was necessary to compare the annual biomass consumption of the previous alternatives to the annual production within a 25 km radius of the plant. In the case of the 13.5 MW plant with BFF = 100% and SM = 1.5, approximately 16.9% of the biomass produced in the plant’s vicinity was utilized. On the other hand, for the 5.4 MW plant with BFF = 50% and SM = 1.5, the biomass consumption accounted for approximately 7.8% of the total annual production.
4. Conclusions
The present study constitutes a techno-economic analysis of a 2 MW CSP-biomass hybrid plant. The uniqueness of the analyzed plant lies in the fact that the thermal energy from the solar field, consisting of parabolic trough collectors, is complemented by biomass combustion through a mixed configuration (Figure 5). Thus, the mixed hybridization consists of both a series scheme (Boiler 1), aiming to improve the quality of generated steam, and a parallel scheme (Boiler 2), designed to absorb solar resource fluctuations.
This study highlights the attractiveness of CSP-biomass hybrid systems for dispatchable power generation from 100% renewable resources, especially in regions that, like the one analyzed, combine high levels of availability of both resources. In fact, in cases with BFF = 100%, the power generated by the steam turbine was completely independent of the available DNI value at any given moment (Figure 7).
Furthermore, the annual balance of consumed forest biomass by the proposed 2 MW hybrid power plant was compatible with the availability in the analyzed area. Specifically, the highest annual biomass consumption corresponded to the case with BFF = 100%, SM = 0.5, and no limit on biomass contribution, estimated at 15.8 kton/year, representing 10.8% of the annual production within a 25 km radius of the plant location (146 kton/year). Considering more realistic scenarios where biomass contribution was limited to 50%, the biomass consumed by the configuration with the lowest LCOE (BFF = 50% and SM = 1.5) was 4.2 kton/year, representing 2.9% of the available quantity within a 25 km radius.
In addition to the advantage mentioned regarding plant dispatchability, the proposed hybrid scheme improves profitability compared to traditional CSP plants. Therefore, the proposed mixed hybridization enhances the profitability of the plant by reducing the LCOE compared to the value corresponding to traditional CSP plants. It was observed that the most attractive scenarios in terms of minimizing the LCOE corresponded to situations where production was predominantly achieved through biomass combustion. In fact, for cases where biomass contribution was not limited, the LCOE of the hybrid plant tended to reach values similar to those of conventional biomass plants.
On the other hand, it was found that in contexts with limitations on biomass contribution, opting for the BFF = 50% configuration is more cost-effective (Figure 13). However, it was demonstrated that the existence of limits on biomass contribution negatively impacts the resulting LCOE. Considering the realistic scenario where biomass contribution was limited to 50%, an optimal configuration (SM = 1.5 and BFF = 50%) was identified where the LCOE reached a value of cEUR 27.93/kWh, which is very high compared to market values.
Based on the aforementioned results, the concept of CSP-biomass hybridization proposed in this study would only be economically viable in a context where, due to the use of 100% primary energy sources, there are no limits on biomass contribution and the remuneration for production equals or exceeds the obtained LCOE values. This is because the viability of such hybrid power generation systems should not be evaluated solely based on economic profitability criteria but should also be assessed for their potential to replace conventional fossil-fuel-based generation systems. In addition to the renewable nature of the production, the proposed scheme stands out for its ability to dispatch production, decoupling it from the available solar resources, which positively impacts the quality of the electrical system.
Finally, it should be noted that the considered plant size (2 MW gross) also contributed to the high LCOE values obtained. Due to the non-linearity of the costs comprising the necessary investment (CAPEX) for these types of plants, increasing the size of the installation positively impacted the LCOE. However, the plant size must be translated into an annual biomass consumption compatible with the production in the plant’s vicinity. It was determined that a target value of cEUR 23.8/kWh was achieved with a plant size of 13.5 MW in the case of BFF = 100% and with 5.4 MW in the case of BFF = 50%.
Author Contributions
Conceptualization, J.A.V.G. and M.T.G.; methodology, J.A.V.G.; software, M.T.G.; validation, J.A.V.G. and M.T.G.; formal analysis, J.A.V.G.; investigation, M.T.G.; resources, M.T.G.; data curation, J.A.V.G.; writing—original draft preparation, J.A.V.G.; writing—review and editing, M.T.G.; visualization, J.A.V.G.; supervision, M.T.G.; project administration, M.T.G.; funding acquisition, M.T.G. All authors have read and agreed to the published version of the manuscript.
Funding
This research is the result of a study in item INDUPYMES+ (ref. 0805_indupymes+_5_E and ref. 0526_indupymes_4_0_5_E), within the INTERREG EUROPE, and was backed by the European Commission. The authors are grateful for the support.
Institutional Review Board Statement
Not applicable.
Informed Consent Statement
Not applicable.
Data Availability Statement
Not applicable.
Acknowledgments
The authors would like to acknowledge “Agencia Andaluza de la Energía” for providing data on biomass in the region.
Conflicts of Interest
The authors declare no conflict of interest.
Nomenclature
| BFF | Biomass Fill Fraction |
| Annual Operation and Maintenance Costs | |
| CSP | Concentrating Solar Power |
| Discount Rate | |
| DNI | Direct Normal Irradiance |
| Annual Energy Production | |
| FEGT | Furnace Exit Gas Temperature |
| FWP | Feed Water Pump |
| GHG | Greenhouse Gas |
| Initial Investment | |
| LCC | Life Cycle Cost |
| LCOE | Levelized Cost of Energy |
| Project’s Lifetime Period | |
| NREL | National Renewable Energy Lab |
| NSRDB | National Solar Radiation Data Base |
| SM | Solar Multiple |
| SSG | Solar Steam Generator |
References
- United Nations Working Group on the Issue of Human Rights and Transnational Corporations and Other Business Enterprises; Note A/73/163 by the Secretary General; United Nations General Assembly: New York, NY, USA, 2018.
- Collins, M.; Knutti, R.; Arblaster, J.; Dufresne, J.L.; Fichefet, T.; Friedlingstein, P.; Gao, X.; Gutowski, W.J.; Johns, T.; Krinner, G.; et al. Long-Term Climate Change: Projections, Commitments and Irreversibility. In Climate Change 2013—The Physical Science Basis: Contribution of Working Group I to the Fifth Assessment Report of the Intergovernmental Panel on Climate Change; Cambridge University Press: Cambridge, UK, 2013; pp. 1029–1136. [Google Scholar]
- Ogunkunle, O.; Ahmed, N.A. A review of global current scenario of biodiesel adoption and combustion in vehicular diesel engines. Energy Rep. 2019, 5, 1560–1579. [Google Scholar] [CrossRef]
- Kost, C.; Mayer, J.N.; Thomsen, J.; Hartmann, N.; Senkpiel, C.; Philipps, S.; Nold, S.; Lude, S.; Saad, N.; Schlegl, T. Levelized Cost of Electricity-Renewable Energy Technologies; Fraunhofer: Munich, Germany, 2013; Available online: https://www.ise.fraunhofer.de/content/dam/ise/en/documents/publications/studies/EN2018_Fraunhofer-ISE_LCOE_Renewable_Energy_Technologies.pdf (accessed on 8 June 2023).
- Malagueta, D.; Szklo, A.; Soria, R.; Dutra, R.; Schaeffer, R.; Borba, B.S.M.C. Potential and impacts of Concentrated Solar Power (CSP) integration in the Brazilian electric power system. Renew. Energy 2014, 68, 223–235. [Google Scholar] [CrossRef]
- Hussain, C.I.; Norton, B.; Duffy, A. Comparison of hybridizing options for solar heat, biomass and heat storage for electricity generation in Spain. Energy Convers. Manag. 2020, 222, 113231. [Google Scholar] [CrossRef]
- Del Moral, A.; Petrakopoulou, F. Evaluation of the coupling of a hybrid power plant with a water generation system. Appl. Sci. 2019, 9, 4989. [Google Scholar] [CrossRef] [Green Version]
- Soria, R.; Portugal-Pereira, J.; Szklo, A.; Milani, R.; Schaeffer, R. Hybrid concentrated solar power (CSP)–biomass plants in a semiarid region: A strategy for CSP deployment in Brazil. Energy Policy 2015, 86, 57–72. [Google Scholar] [CrossRef]
- Morrone, P.; Algieri, A.; Castiglione, T. Hybridisation of biomass and concentrated solar power systems in transcritical organic Rankine cycles: A micro combined heat and power application. Energy Convers. Manag. 2019, 180, 757–768. [Google Scholar] [CrossRef]
- Turchi, C.S.; Ma, Z.; Erbes, M. Gas Turbine/Solar Parabolic Trough Hybrid Designs. In Proceedings of the ASME 2011 Turbo Expo: Turbine Technical Conference and Exposition. Volume 3: Controls, Diagnostics and Instrumentation; Education; Electric Power; Microturbines and Small Turbomachinery; Solar Brayton and Rankine Cycle, Vancouver, BC, Canada, 6–10 June 2011; ASME: Washington, DC, USA, 2011; pp. 989–996. [Google Scholar]
- Peterseim, J.H.; Hellwig, U.; Tadros, A.; White, S. Hybridisation optimization of concentrating solar thermal and biomass power generation facilities. Sol. Energy 2014, 99, 203–214. [Google Scholar] [CrossRef]
- Marchenko, O.; Solomin, S.; Shamanskiy, V.; Donskoy, I. Evaluation of the Effectiveness of Joint Use of Wood and Other Renewable Energy Sources in the Baikal Region. Appl. Sci. 2022, 12, 1254. [Google Scholar] [CrossRef]
- Bai, Z.; Liu, Q.; Lei, J.; Wang, X.; Sun, J.; Jin, H. Thermodynamic evaluation of a novel solar-biomass hybrid power generation system. Energy Convers. Manag. 2017, 142, 296–306. [Google Scholar] [CrossRef]
- Sterrer, R.; Schidler, S.; Schwandt, O.; Franz, P.; Hammerschmid, A. Theoretical analysis of the combination of CSP with a biomass CHP-plant using ORC-technology in Central Europe. Energy Procedia 2014, 49, 1218–1227. [Google Scholar] [CrossRef] [Green Version]
- Li, M.; Lenzen, M.; Yousefzadeh, M.; Ximenes, F.A. The roles of biomass and CSP in a 100% renewable electricity supply in Australia. Biomass Bioenergy 2020, 143, 105802. [Google Scholar] [CrossRef]
- El-Sattar, H.A.; Kamel, S.; Sultan, H.; Tostado-Véliz, M.; Eltamaly, A.M.; Jurado, F. Performance analysis of a stand-alone pv/wt/biomass/bat system in alrashda village in egypt. Appl. Sci. 2021, 11, 10191. [Google Scholar] [CrossRef]
- Hussain, C.I.; Norton, B.; Duffy, A. Technological assessment of different solar-biomass systems for hybrid power generation in Europe. Renew. Sustain. Energy Rev. 2017, 68, 1115–1129. [Google Scholar] [CrossRef] [Green Version]
- Jensen, A.R.; Sifnaios, I.; Perers, B.; Rothmann, J.H.; Mørch, S.D.; Jensen, P.V.; Dragsted, J.; Furbo, S. Demonstration of a concentrated solar power and biomass plant for combined heat and power. Energy Convers. Manag. 2022, 271, 116207. [Google Scholar] [CrossRef]
- Loth, E.; Qin, C.; Simpson, J.G.; Dykes, K. Why we must move beyond LCOE for renewable energy design. Adv. Appl. Energy 2022, 8, 100112. [Google Scholar] [CrossRef]
- Nissen, U.; Harfst, N. Shortcomings of the traditional “levelized cost of energy” [LCOE] for the determination of grid parity. Energy 2019, 171, 1009–1016. [Google Scholar] [CrossRef]
- Shen, W.; Chen, X.; Qiu, J.; Hayward, J.A.; Sayeef, S.; Osman, P.; Meng, K.; Dong, Z.Y. A comprehensive review of variable renewable energy levelized cost of electricity. Renew. Sustain. Energy Rev. 2020, 133, 110301. [Google Scholar] [CrossRef]
- Tian, Z.; Perers, B.; Furbo, S.; Fan, J. Thermo-economic optimization of a hybrid solar district heating plant with flat plate collectors and parabolic trough collectors in series. Energy Convers. Manag. 2018, 165, 92–101. [Google Scholar] [CrossRef] [Green Version]
- Tilahun, F.B.; Bhandari, R.; Mamo, M. Design optimization of a hybrid solar-biomass plant to sustainably supply energy to industry: Methodology and case study. Energy 2021, 220, 119736. [Google Scholar] [CrossRef]
- Joskow, P.L. Comparing the costs of intermittent and dispatchable electricity generating technologies. Am. Econ. Rev. 2011, 101, 238–241. [Google Scholar] [CrossRef] [Green Version]
- Reichenberg, L.; Hedenus, F.; Odenberger, M.; Johnsson, F. The marginal system LCOE of variable renewables—Evaluating high penetration levels of wind and solar in Europe. Energy 2018, 152, 914–924. [Google Scholar] [CrossRef]
- Milani, R.; Szklo, A.; Hoffmann, B.S. Hybridization of concentrated solar power with biomass gasification in Brazil’s semiarid region. Energy Convers. Manag. 2017, 143, 522–537. [Google Scholar] [CrossRef]
- Bai, Z.; Liu, Q.; Gong, L.; Lei, J. Investigation of a solar-biomass gasification system with the production of methanol and electricity: Thermodynamic, economic and off-design operation. Appl. Energy 2019, 243, 91–101. [Google Scholar] [CrossRef]
- Mapa de Radiación Global de Andalucía. Agencia Andaluza de la Energía, Junta de Andalucía. Available online: https://www.agenciaandaluzadelaenergia.es/Radiacion/vermapas.php (accessed on 9 June 2023).
- Agencia Andaluza de la Energía, Junta de Andalucía. La Biomasa en Andalucía. 2016. Available online: https://www.agenciaandaluzadelaenergia.es/biomasa/biomasa/init.do?prefix=/biomasa&name=potencial (accessed on 9 June 2023).
- Wilcox, S.M. National Solar Radiation Database 1991–2010 Update: User’s Manual (No. NREL/TP-5500-54824); National Renewable Energy Laboratory (NREL): Golden, CO, USA, 2012. [Google Scholar]
- Sengupta, M.; Xie, Y.; Lopez, A.; Habte, A.; Maclaurin, G.; Shelby, J. The national solar radiation data base (NSRDB). Renew. Sustain. Energy Rev. 2018, 89, 51–60. [Google Scholar] [CrossRef]
- Dominguez, J.; Marcos, M.J. Análisis de la producción potencial de energía con biomasa en la región de Andalucía (España) utilizando sistemas de información geográfica. Cybergeo Eur. J. Geogr. 2000. [Google Scholar] [CrossRef]
- Bellos, E.; Tzivanidis, C. Analytical expression of parabolic trough solar collector performance. Designs 2018, 2, 9. [Google Scholar] [CrossRef] [Green Version]
- Solutia Technical Bulletin 7239115C. Available online: https://www.therminol.com/products/Therminol-VP1 (accessed on 6 June 2023).
- Peterseim, J.H.; Tadros, A.; Hellwig, U.; White, S. Increasing the efficiency of parabolic trough plants using thermal oil through external superheating with biomass. Energy Convers. Manag. 2014, 77, 784–793. [Google Scholar] [CrossRef]
- Algieri, A.; Morrone, P. Thermo-economic investigation of solar-biomass hybrid cogeneration systems based on small-scale transcritical organic Rankine cycles. Appl. Therm. Eng. 2022, 210, 118312. [Google Scholar] [CrossRef]
- Kumar, B.; Raj, A.K.; Szepesi, G.; Szamosi, Z. A conspectus review on solar drying of wood: Regional and technical contrivances. J. Therm. Anal. Calorim. 2023, 2023, 1–25. [Google Scholar] [CrossRef]
- Talavera, D.L.; Pérez-Higueras, P.; Ruíz-Arias, J.A.; Fernández, E.F. Levelised cost of electricity in high concentrated photovoltaic grid connected systems: Spatial analysis of Spain. Appl. Energy 2015, 151, 49–59. [Google Scholar] [CrossRef]
- Idel, R. Levelized full system costs of electricity. Energy 2022, 259, 124905. [Google Scholar] [CrossRef]
- Peterseim, J.H.; White, S.; Tadros, A.; Hellwig, U. Concentrated solar power hybrid plants, which technologies are best suited for hybridisation? Renew. Energy 2013, 57, 520–532. [Google Scholar] [CrossRef]
- Bosch, J.; Staffell, I.; Hawkes, A.D. Global levelised cost of electricity from offshore wind. Energy 2019, 189, 116357. [Google Scholar] [CrossRef]
- System Advisor Model, Version 2022.11.21 (SAM 2022.11.21); National Renewable Energy Laboratory (NREL): Golden, CO, USA, 2022.
- Srinivas, T.; Reddy, B.V. Hybrid solar–biomass power plant without energy storage. Case Stud. Therm. Eng. 2014, 2, 75–81. [Google Scholar] [CrossRef] [Green Version]
- Kearney, D.; Herrmann, U.; Nava, P.; Kelly, B.; Mahoney, R.; Pacheco, J.; Cable, R.; Potrovitza, N.; Blake, D.; Price, H. Assessment of a molten salt heat transfer fluid in a parabolic trough solar field. J. Sol. Energy Eng. 2003, 125, 170–176. [Google Scholar] [CrossRef] [Green Version]
- Răboacă, M.S.; Badea, G.; Enache, A.; Filote, C.; Răsoi, G.; Rata, M.; Lavric, A.; Felseghi, R.A. Concentrating solar power technologies. Energies 2019, 12, 1048. [Google Scholar] [CrossRef] [Green Version]
- Pantaleo, A.M.; Camporeale, S.M.; Miliozzi, A.; Russo, V.; Shah, N.; Markides, C.N. Novel hybrid CSP-biomass CHP for flexible generation: Thermo-economic analysis and profitability assessment. Appl. Energy 2017, 204, 994–1006. [Google Scholar] [CrossRef]
- Oyekale, J.; Heberle, F.; Petrollese, M.; Brüggemann, D.; Cau, G. Biomass retrofit for existing solar organic Rankine cycle power plants: Conceptual hybridization strategy and techno-economic assessment. Energy Convers. Manag. 2019, 196, 831–845. [Google Scholar] [CrossRef]
Figure 1.
Average daily global horizontal irradiation (kWh/m2) [28].
Figure 1.
Average daily global horizontal irradiation (kWh/m2) [28].
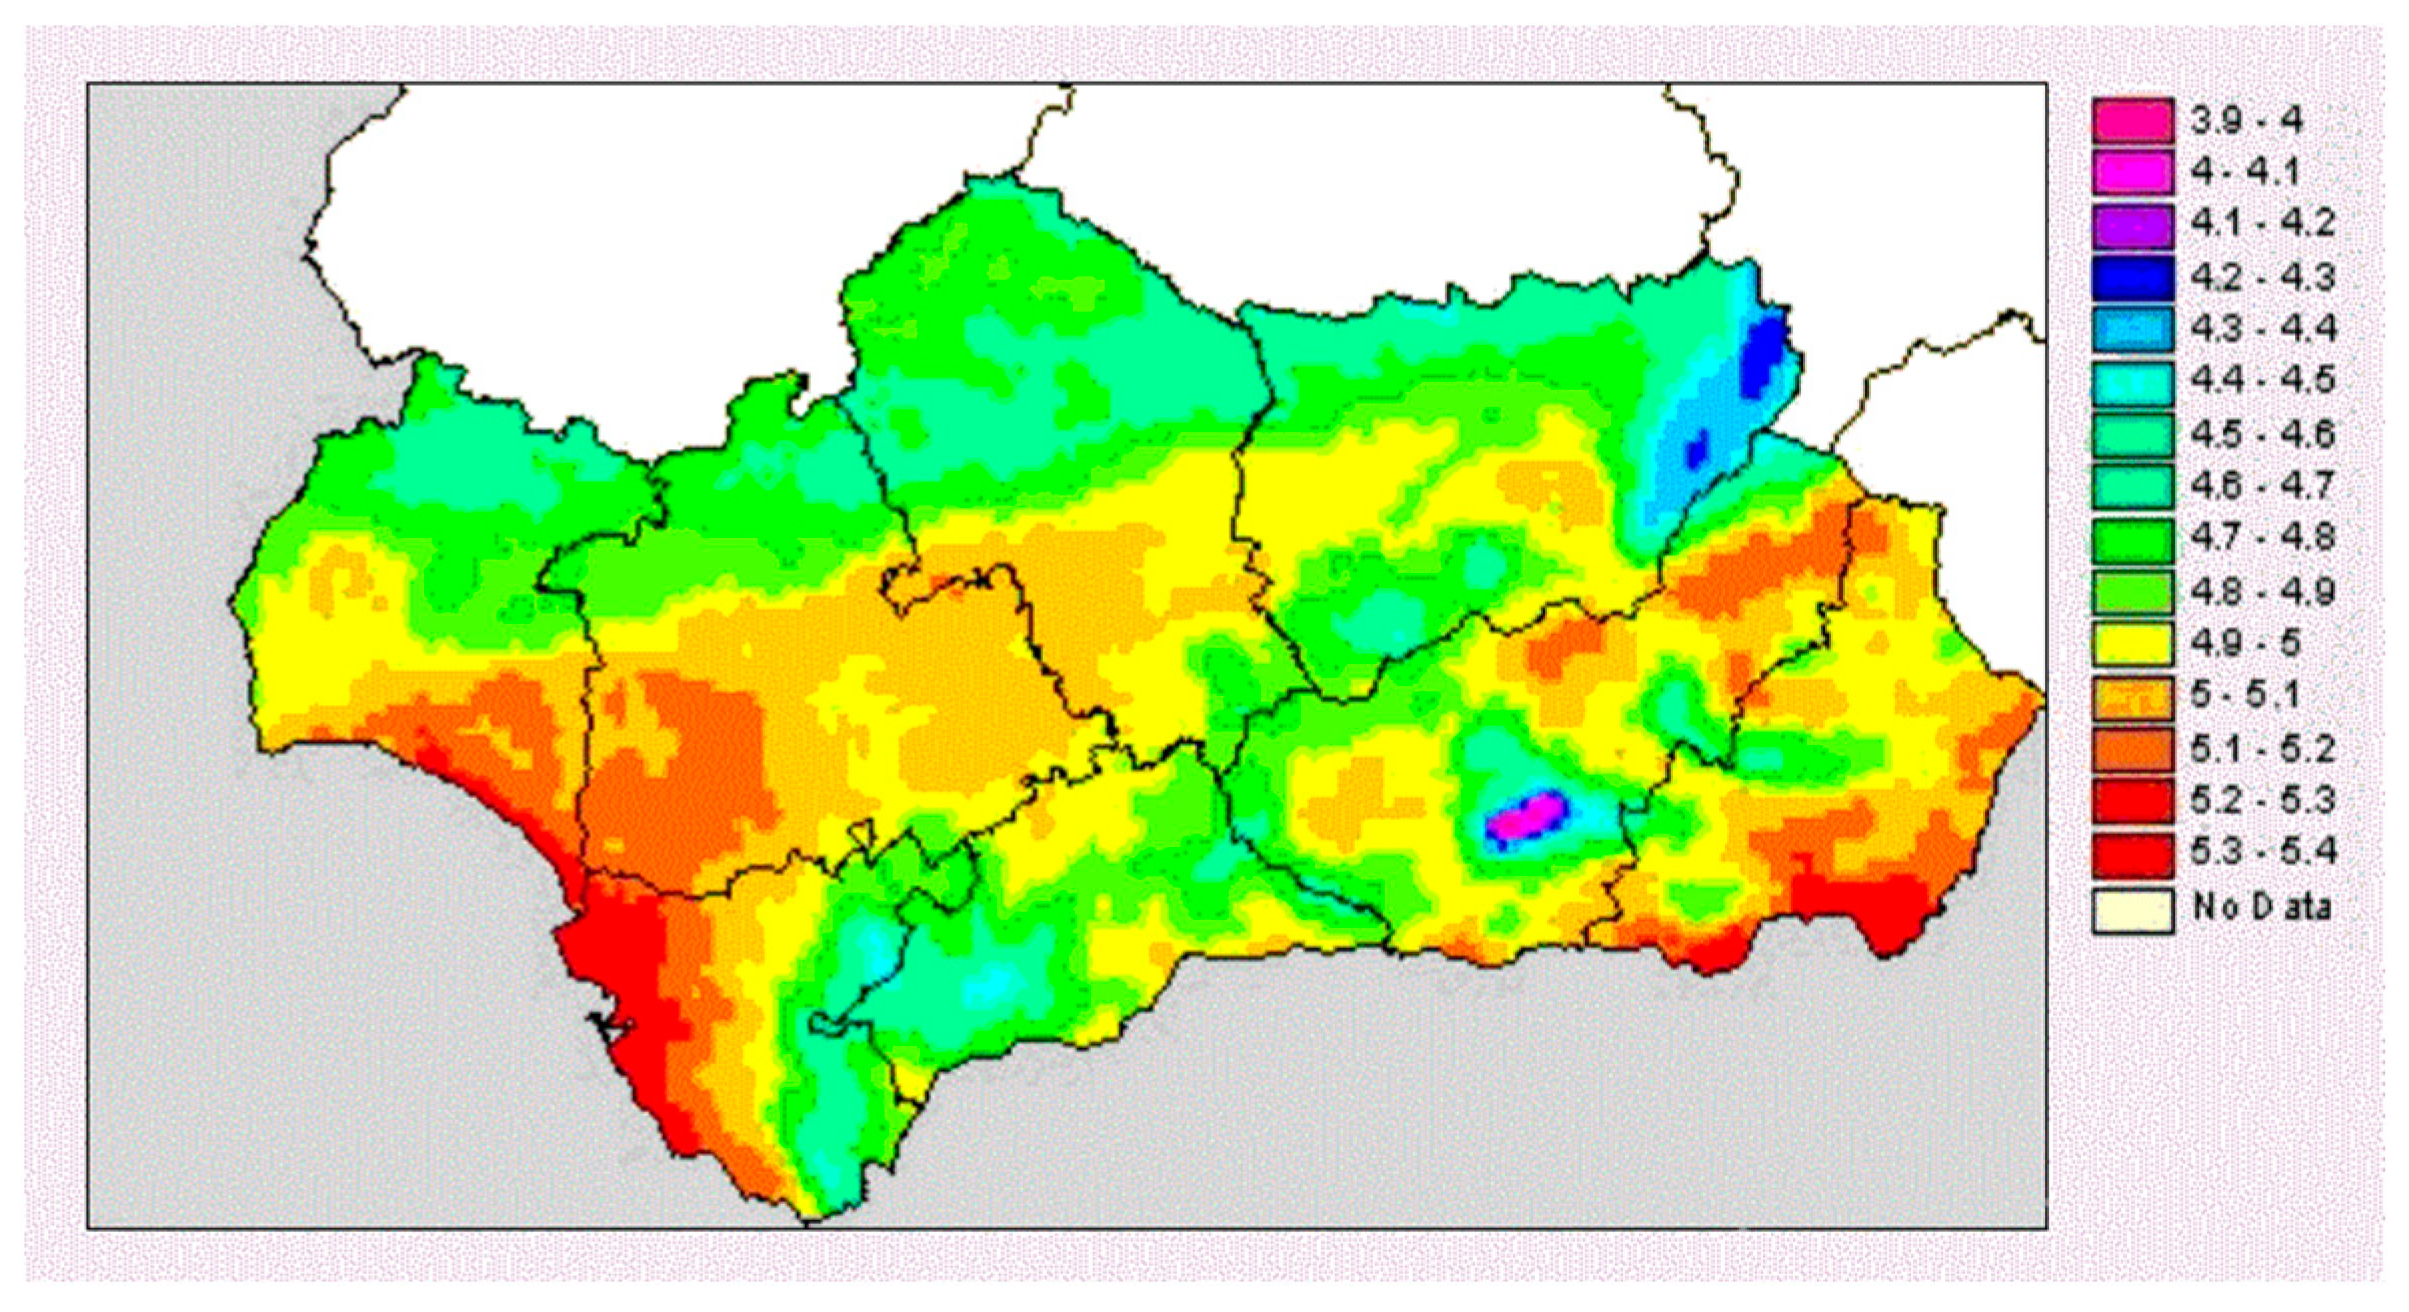
Figure 2.
Forest biomass production in Andalusia (green: pinus, orange: eucalyptus, brown: quercus) [29].
Figure 2.
Forest biomass production in Andalusia (green: pinus, orange: eucalyptus, brown: quercus) [29].

Figure 3.
Direct normal irradiance (DNI, W/m2) of the design year.
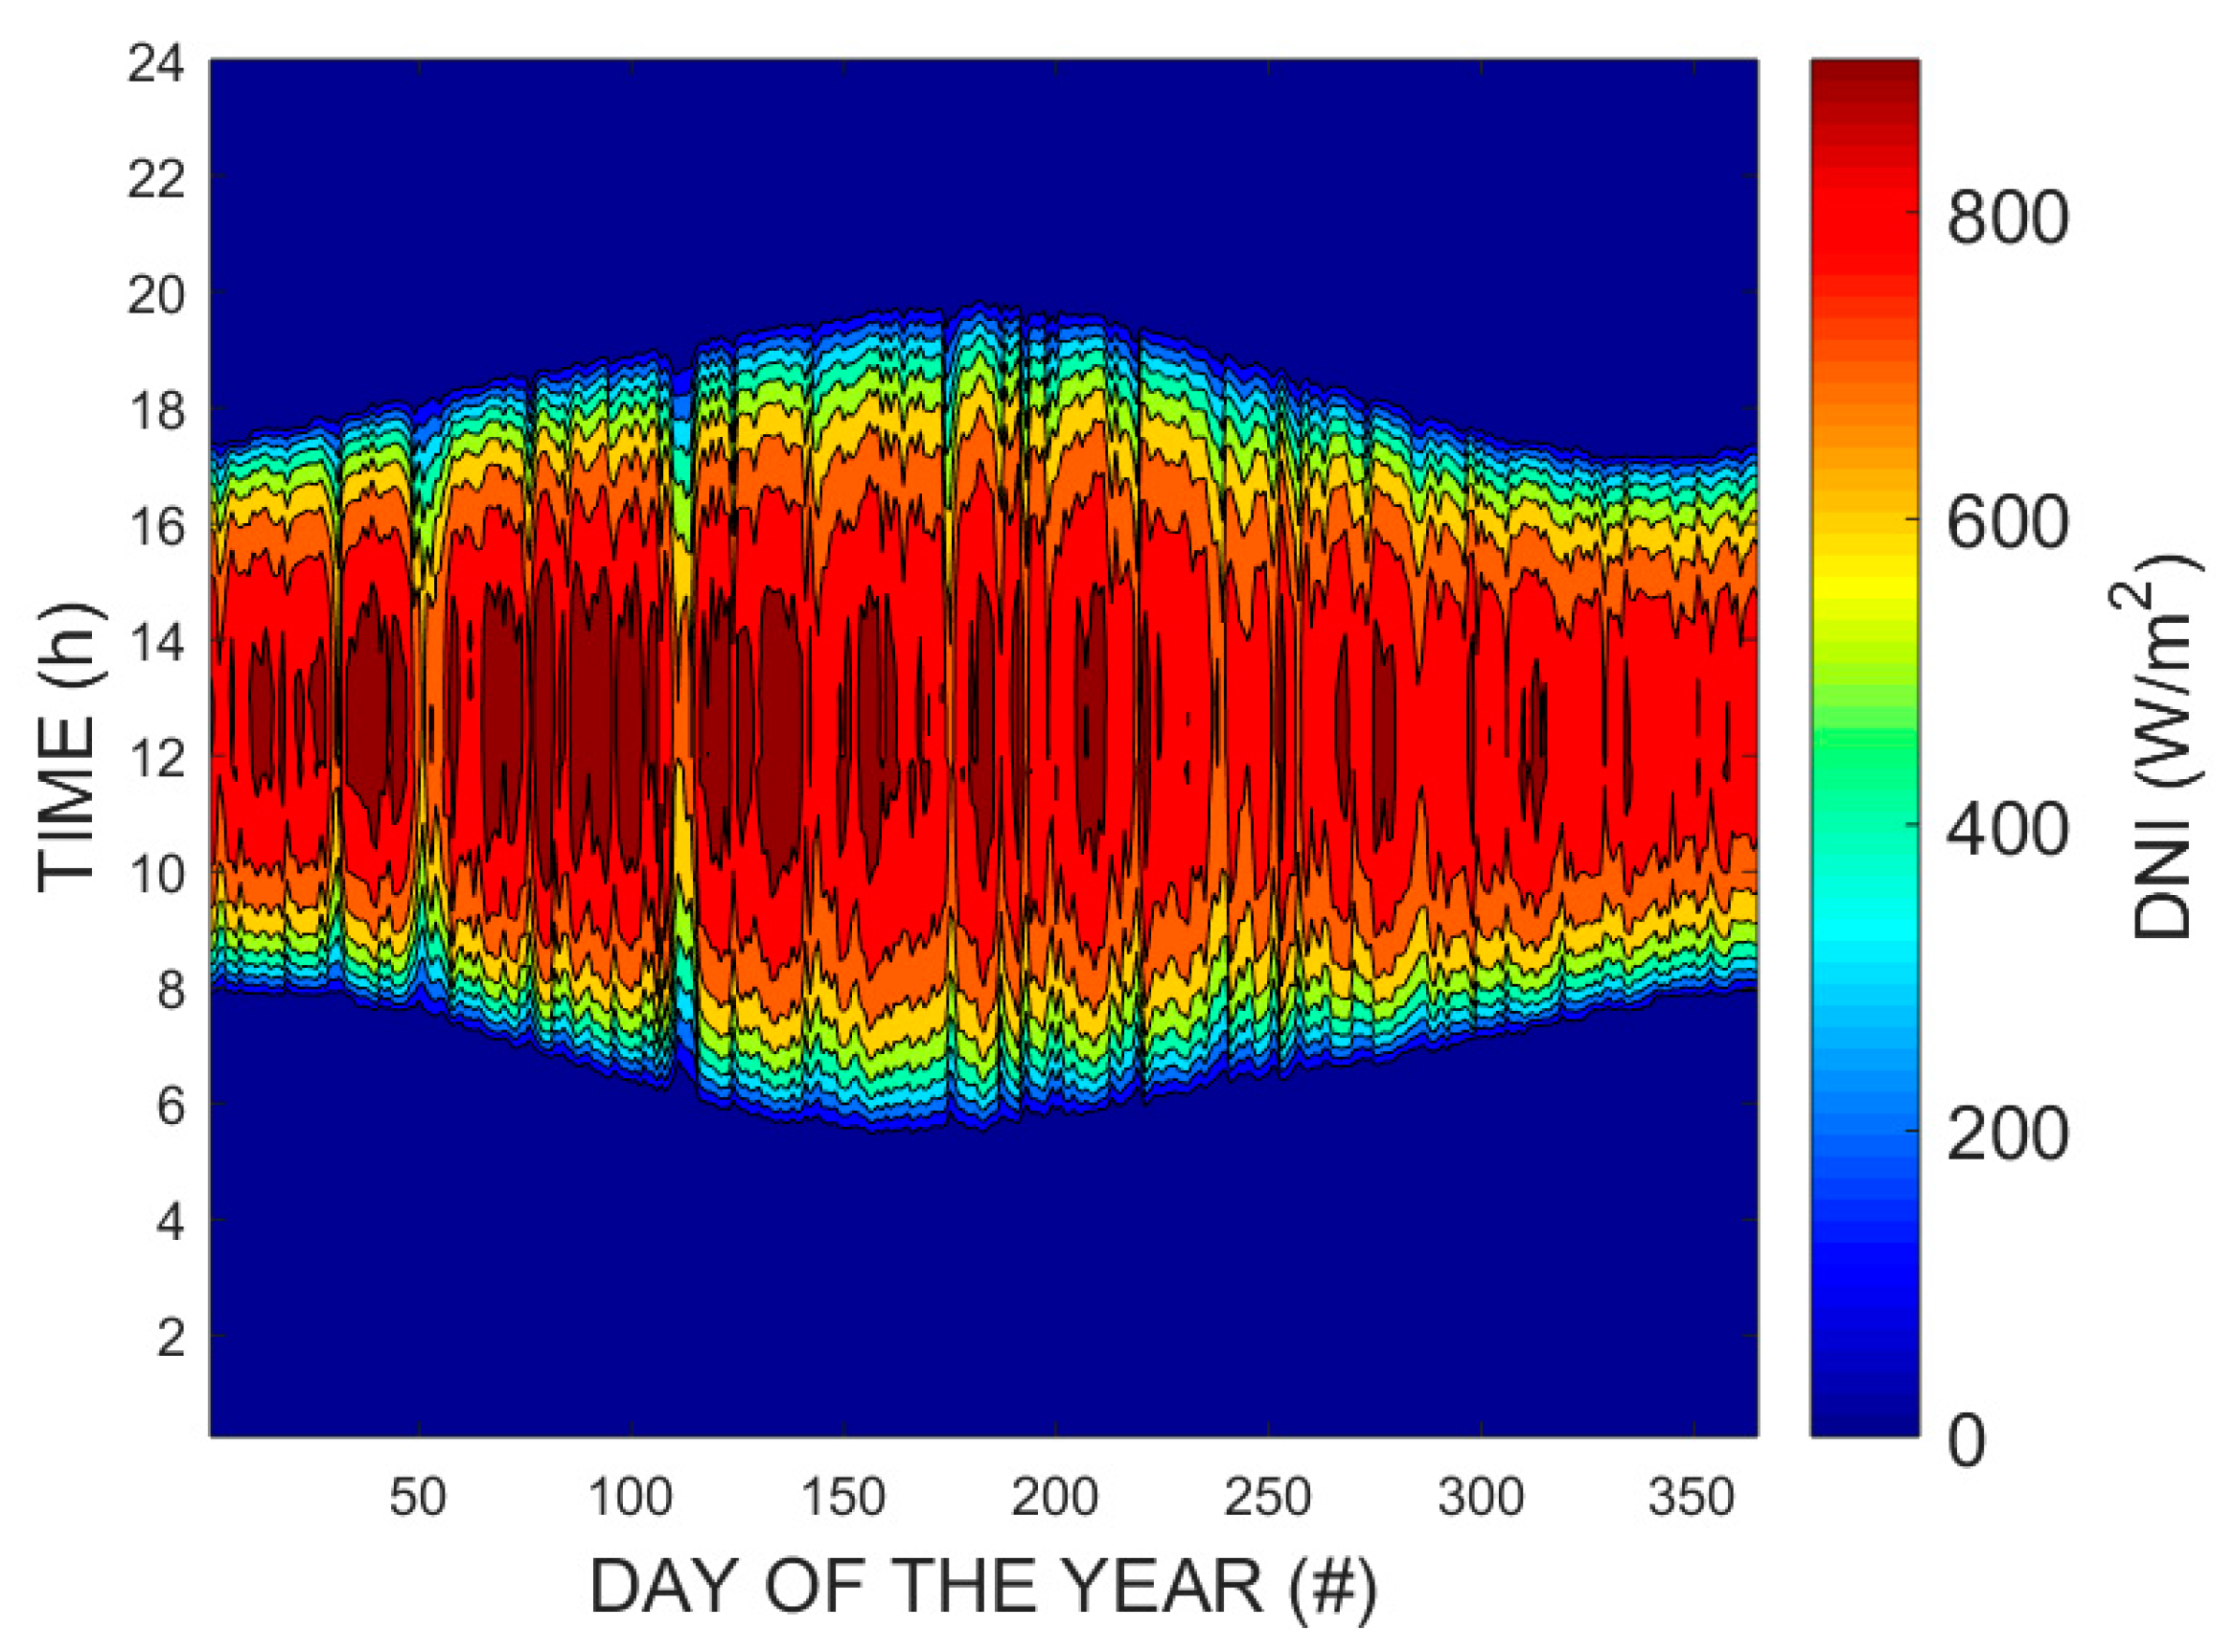
Figure 4.
Hourly evolution of direct normal irradiance (DNI, W/m2) for 4 representative days.
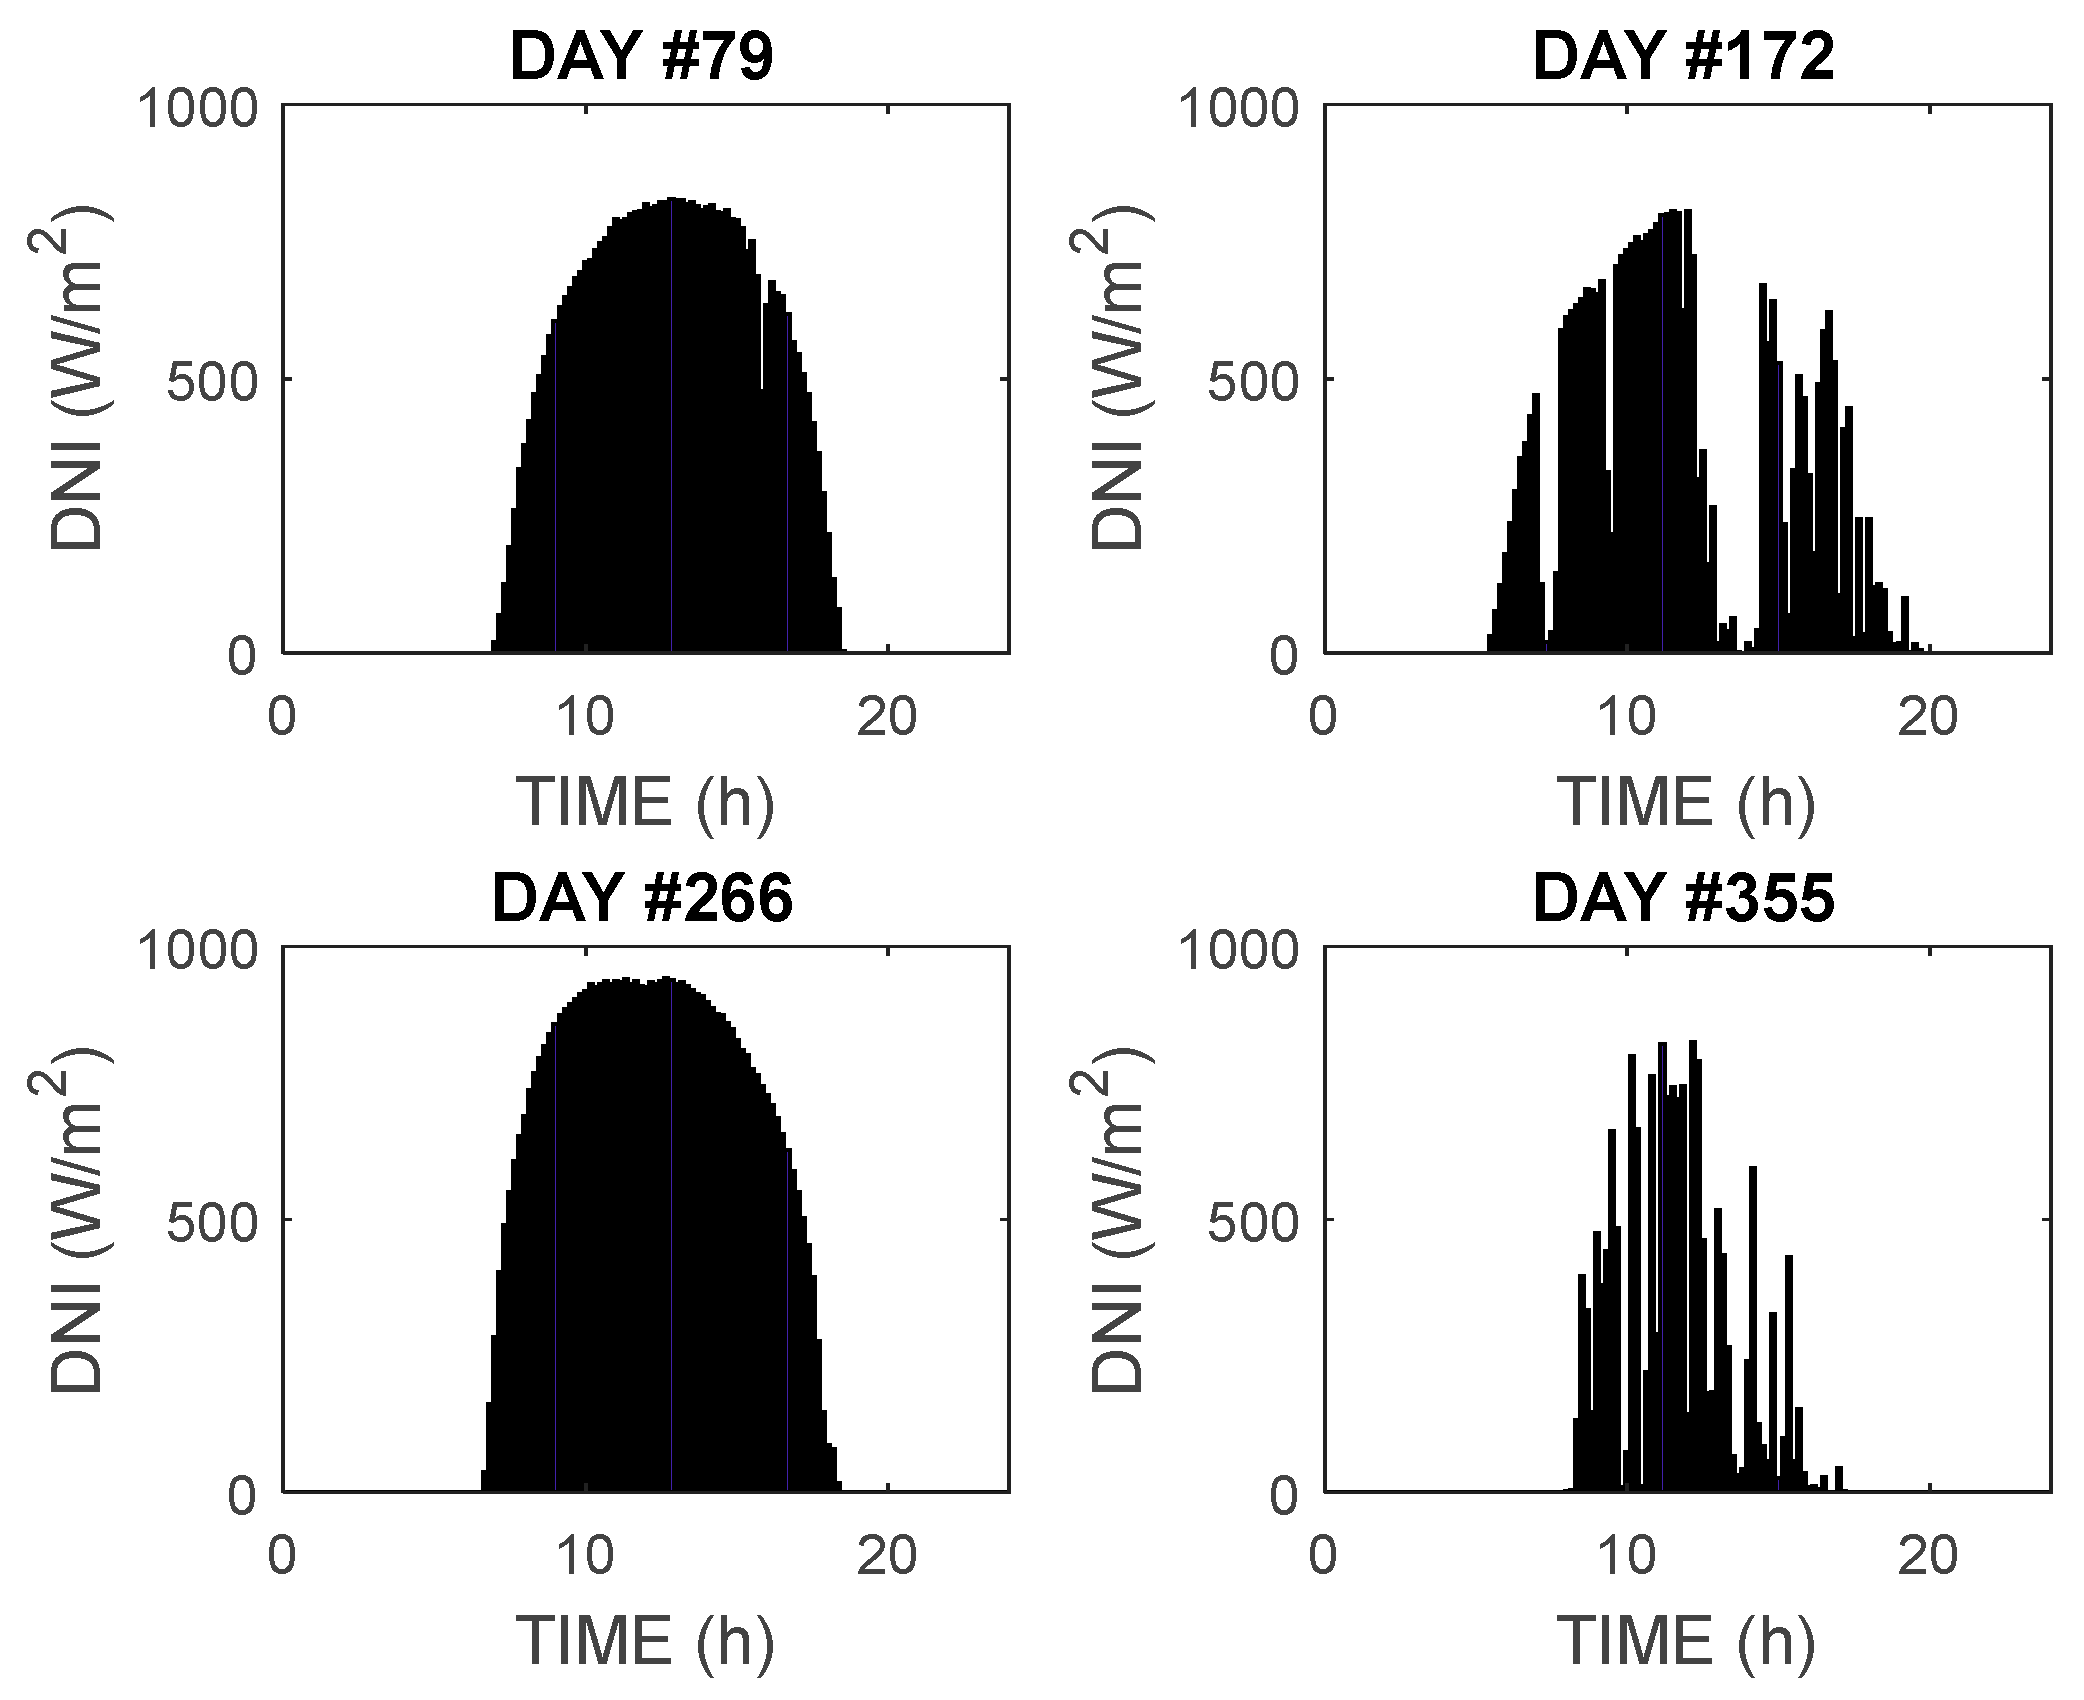
Figure 5.
Process diagram of the proposed power plant (water/steam side).
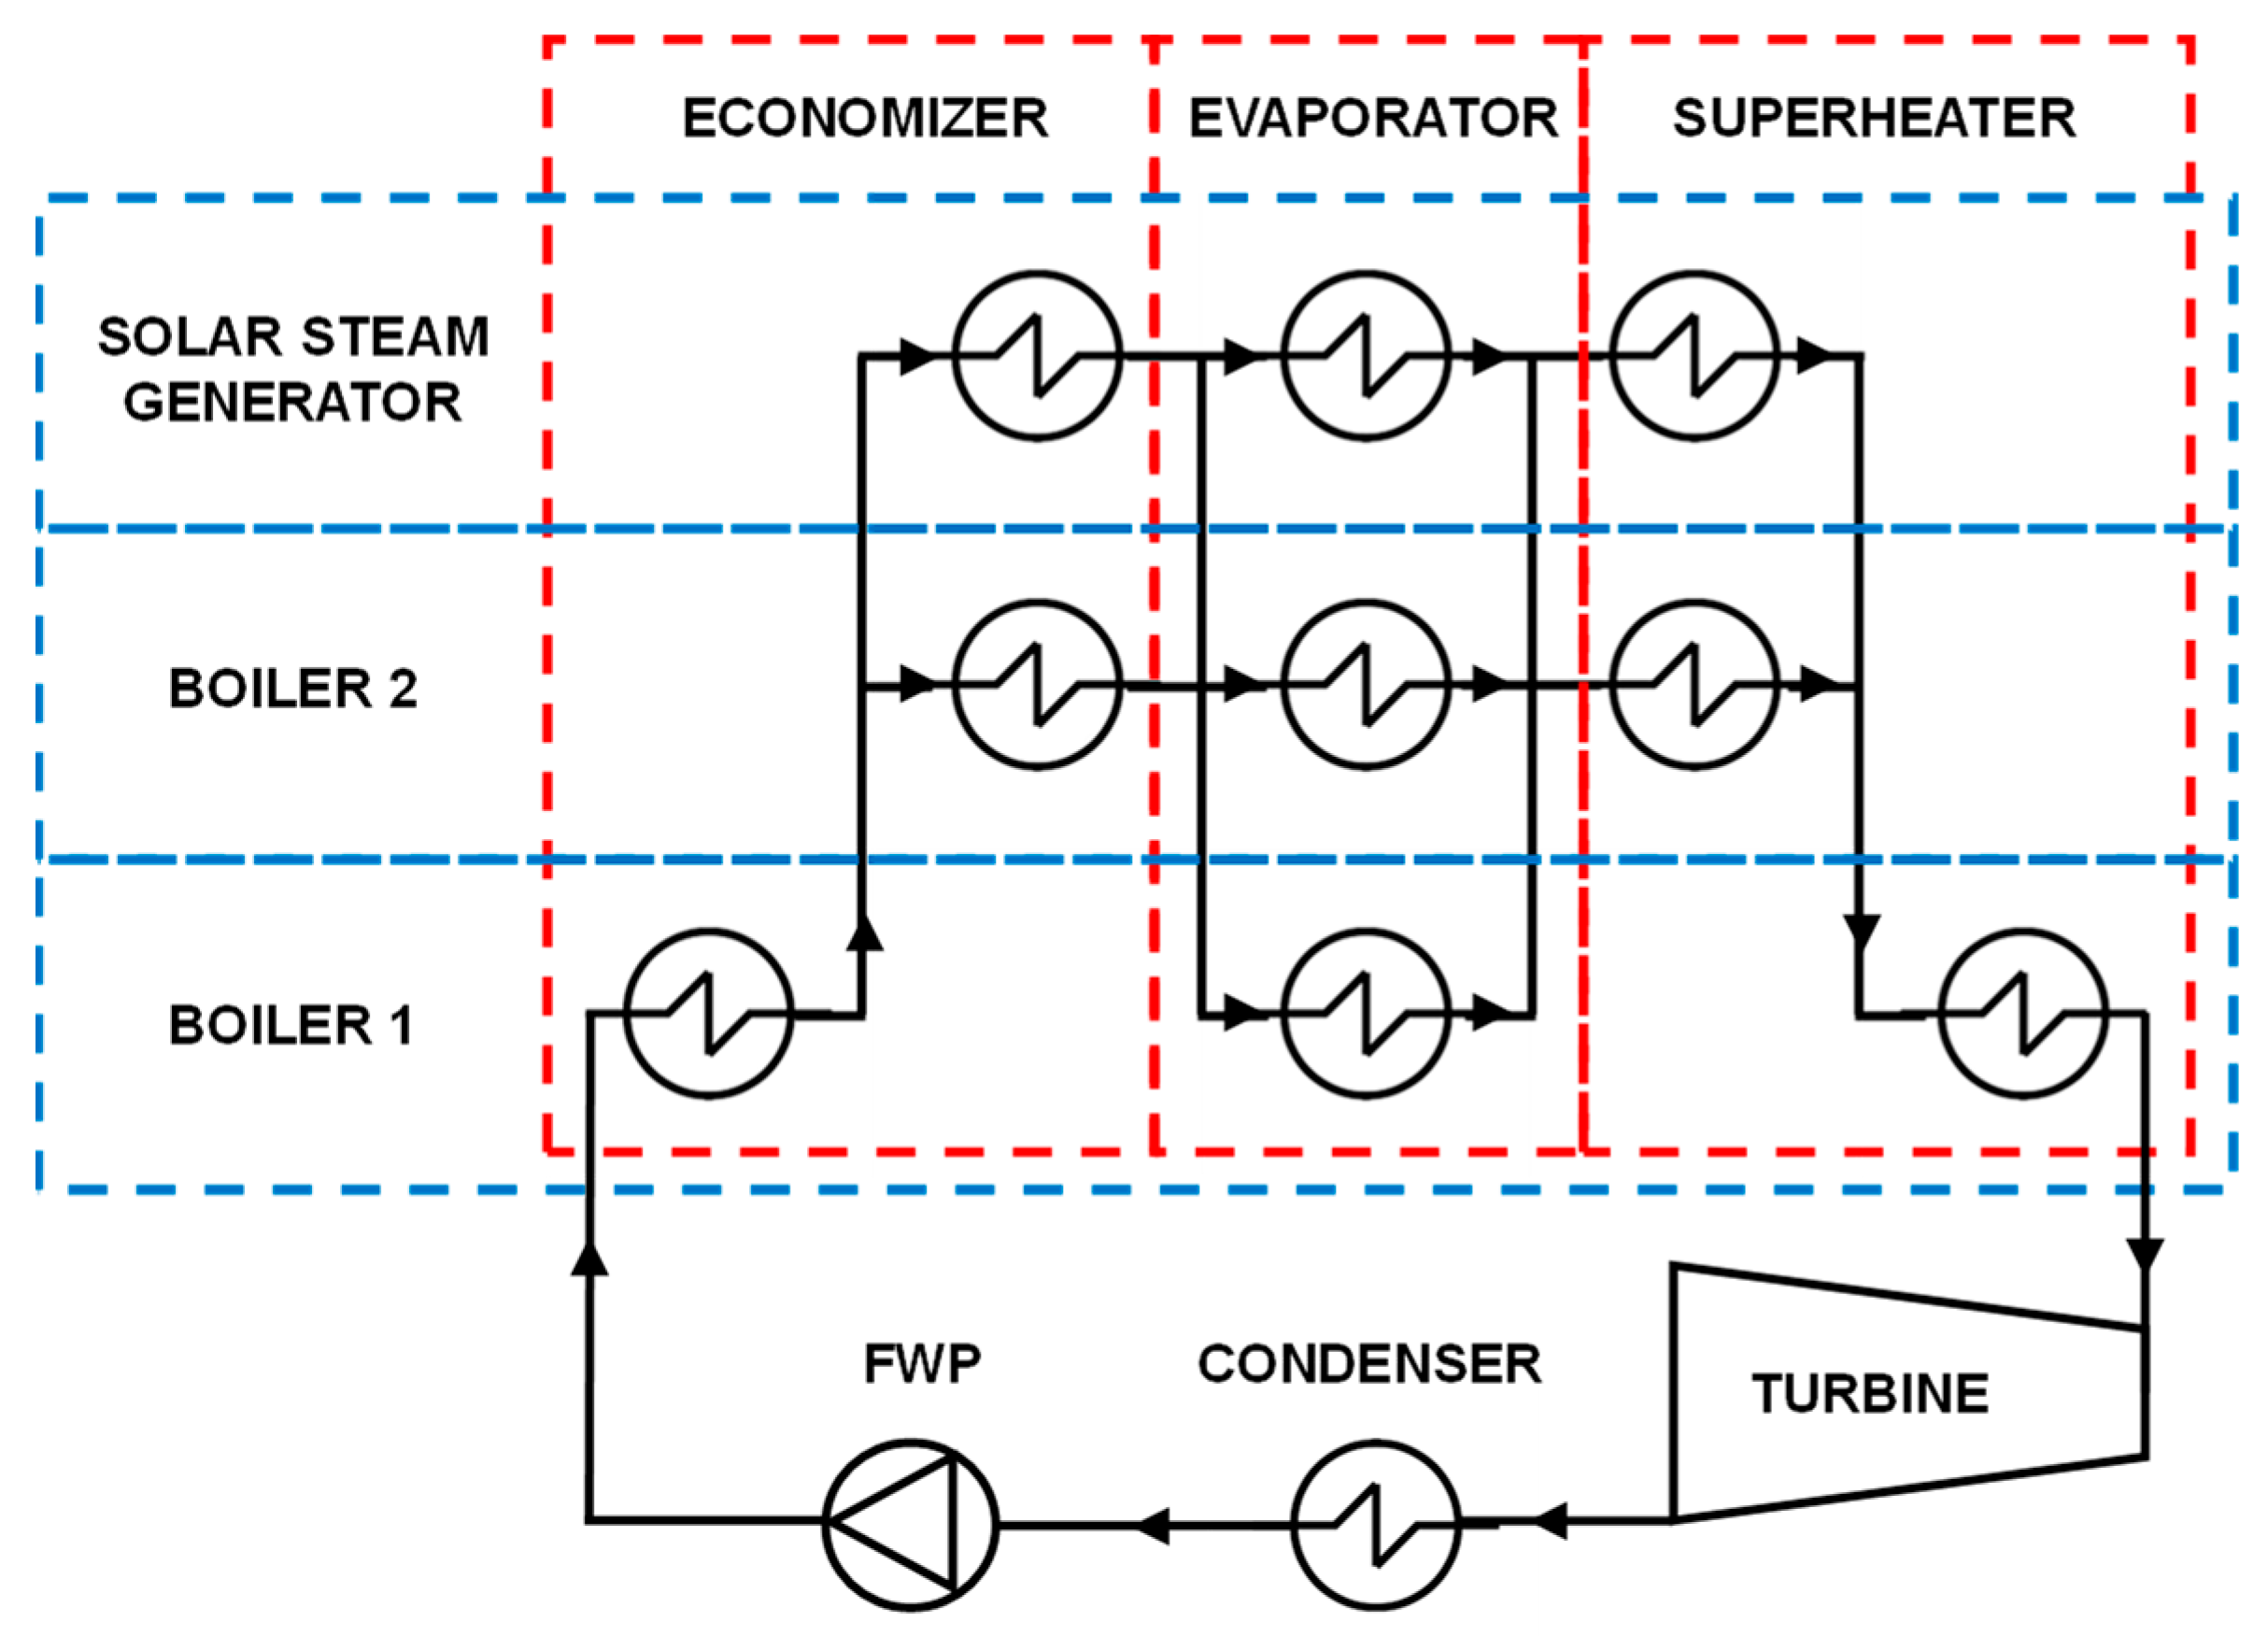
Figure 6.
Workflow corresponding to the applied methodology.
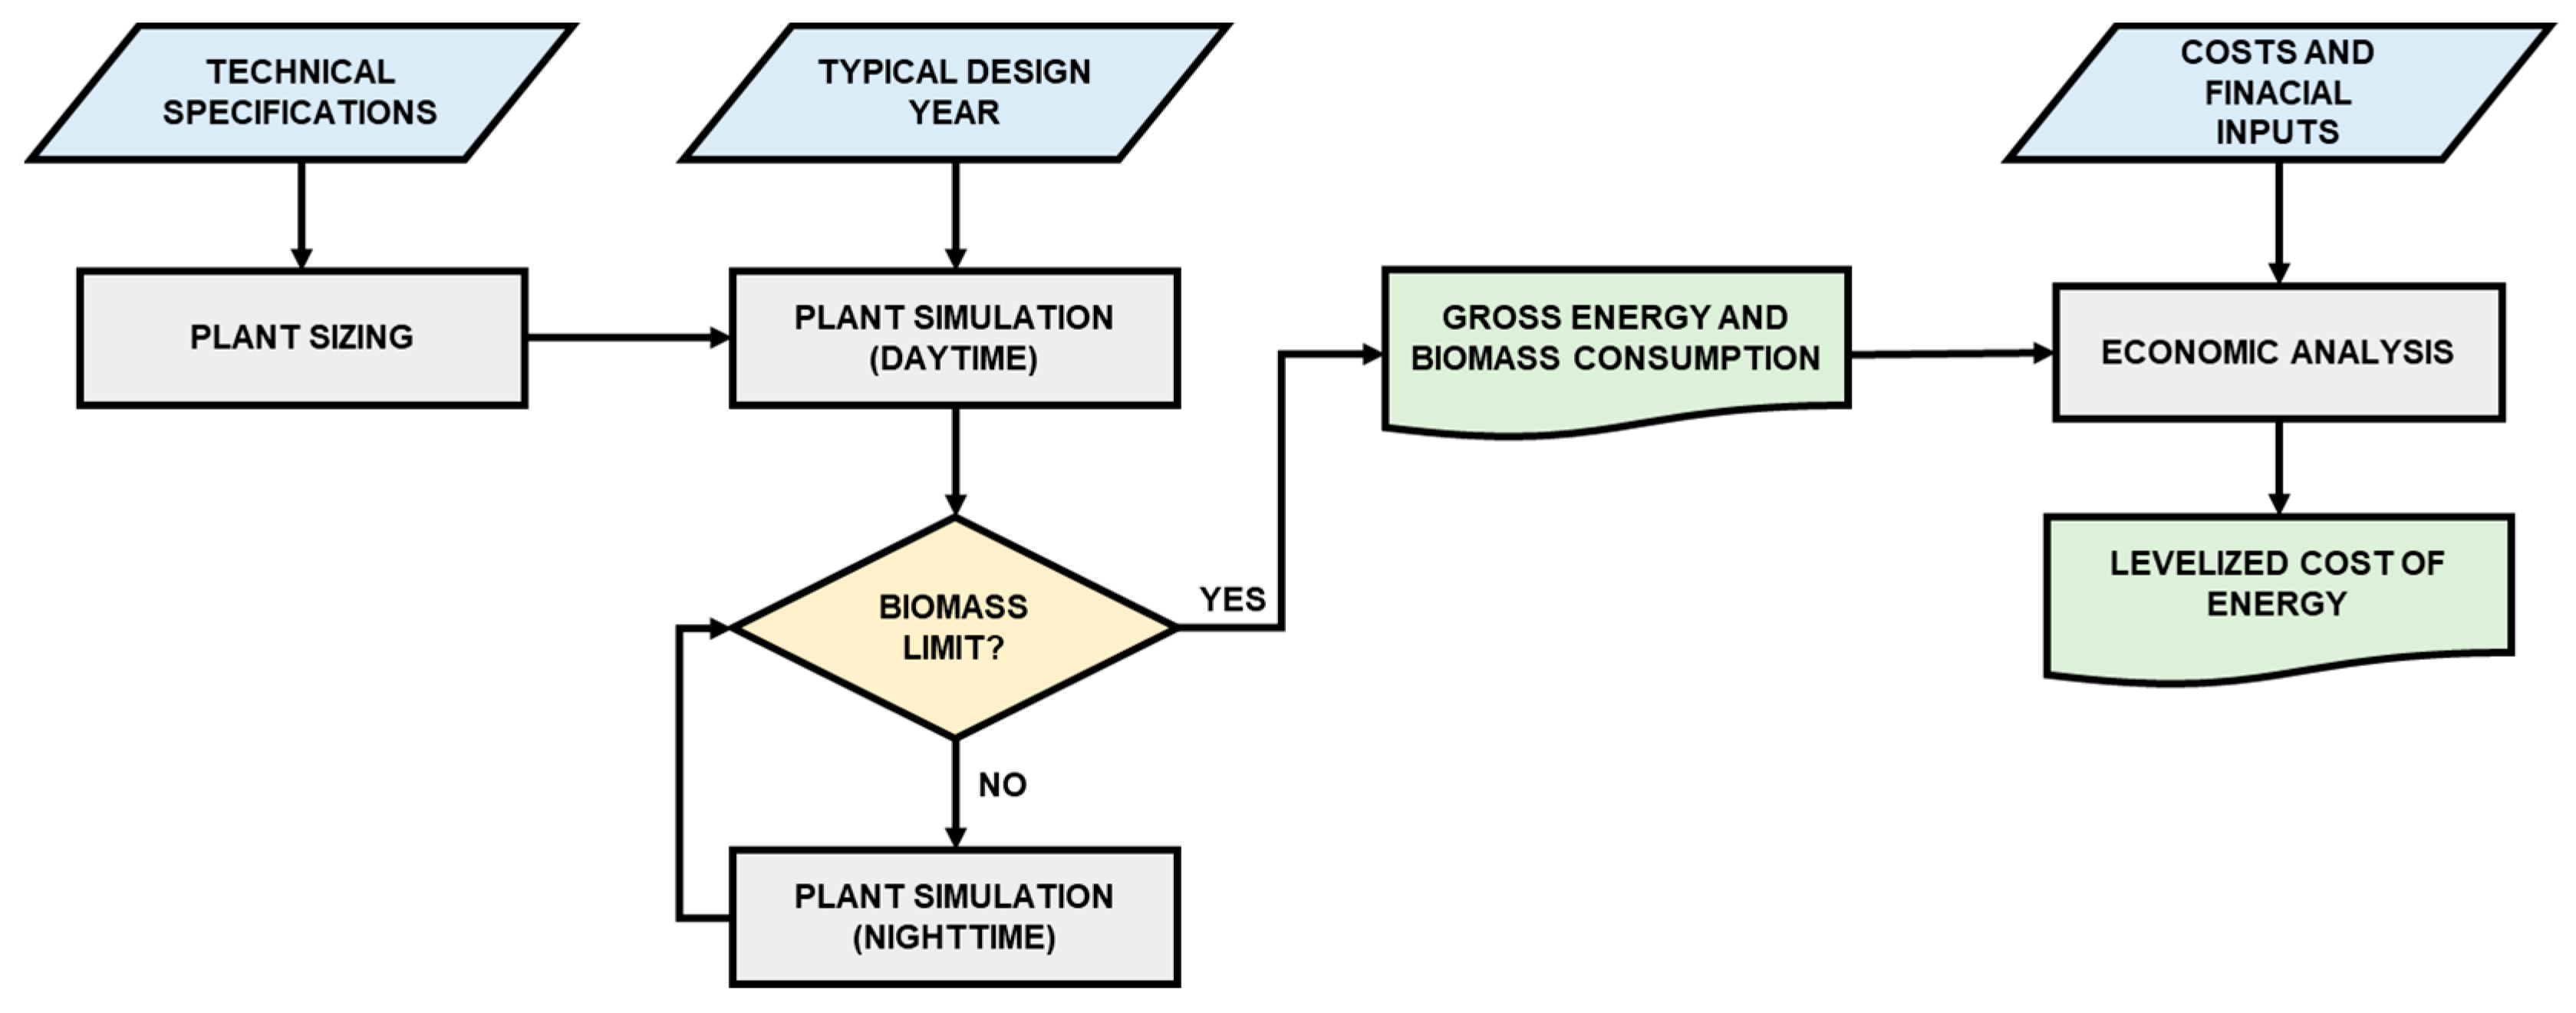
Figure 7.
Hourly evolution of biomass consumption (kg/s) and gross electric power generated (MW) for the four representative days (SM = 1, BFF = 100%).
Figure 7.
Hourly evolution of biomass consumption (kg/s) and gross electric power generated (MW) for the four representative days (SM = 1, BFF = 100%).
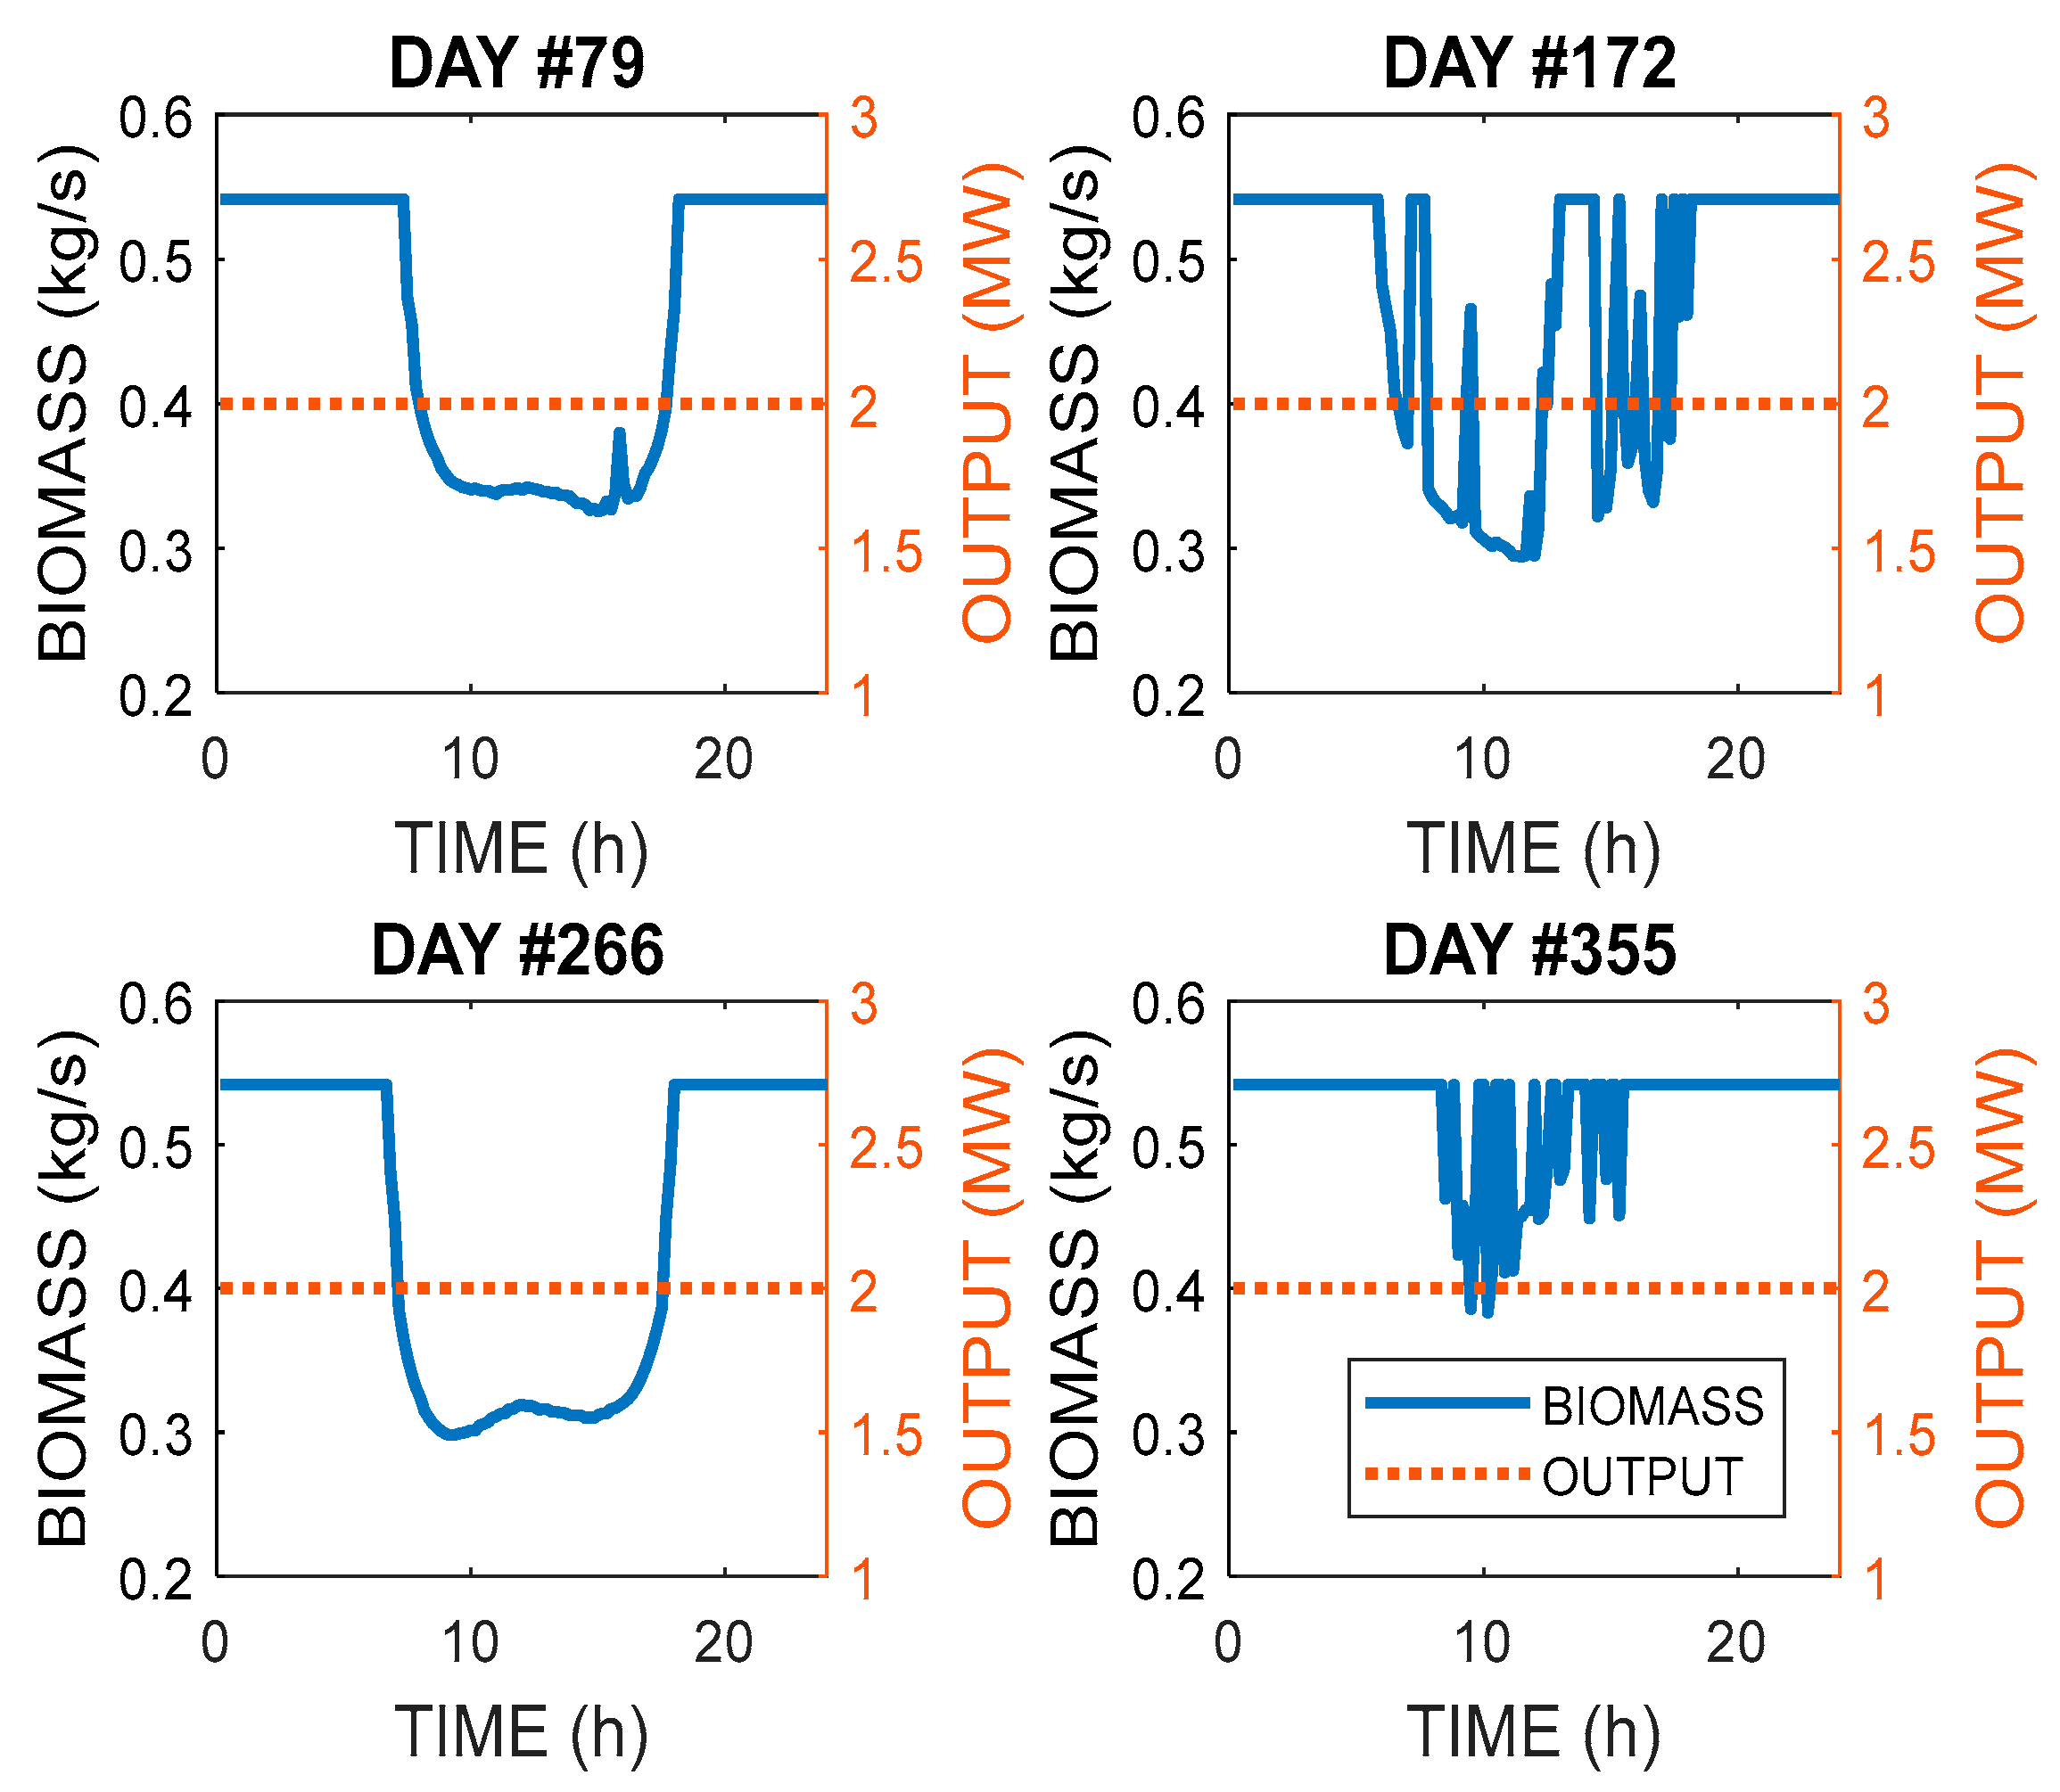
Figure 8.
Hourly evolution of biomass consumption (kg/s) and gross electric power generated (MW) for the four representative days (SM = 1, BFF = 50%).
Figure 8.
Hourly evolution of biomass consumption (kg/s) and gross electric power generated (MW) for the four representative days (SM = 1, BFF = 50%).
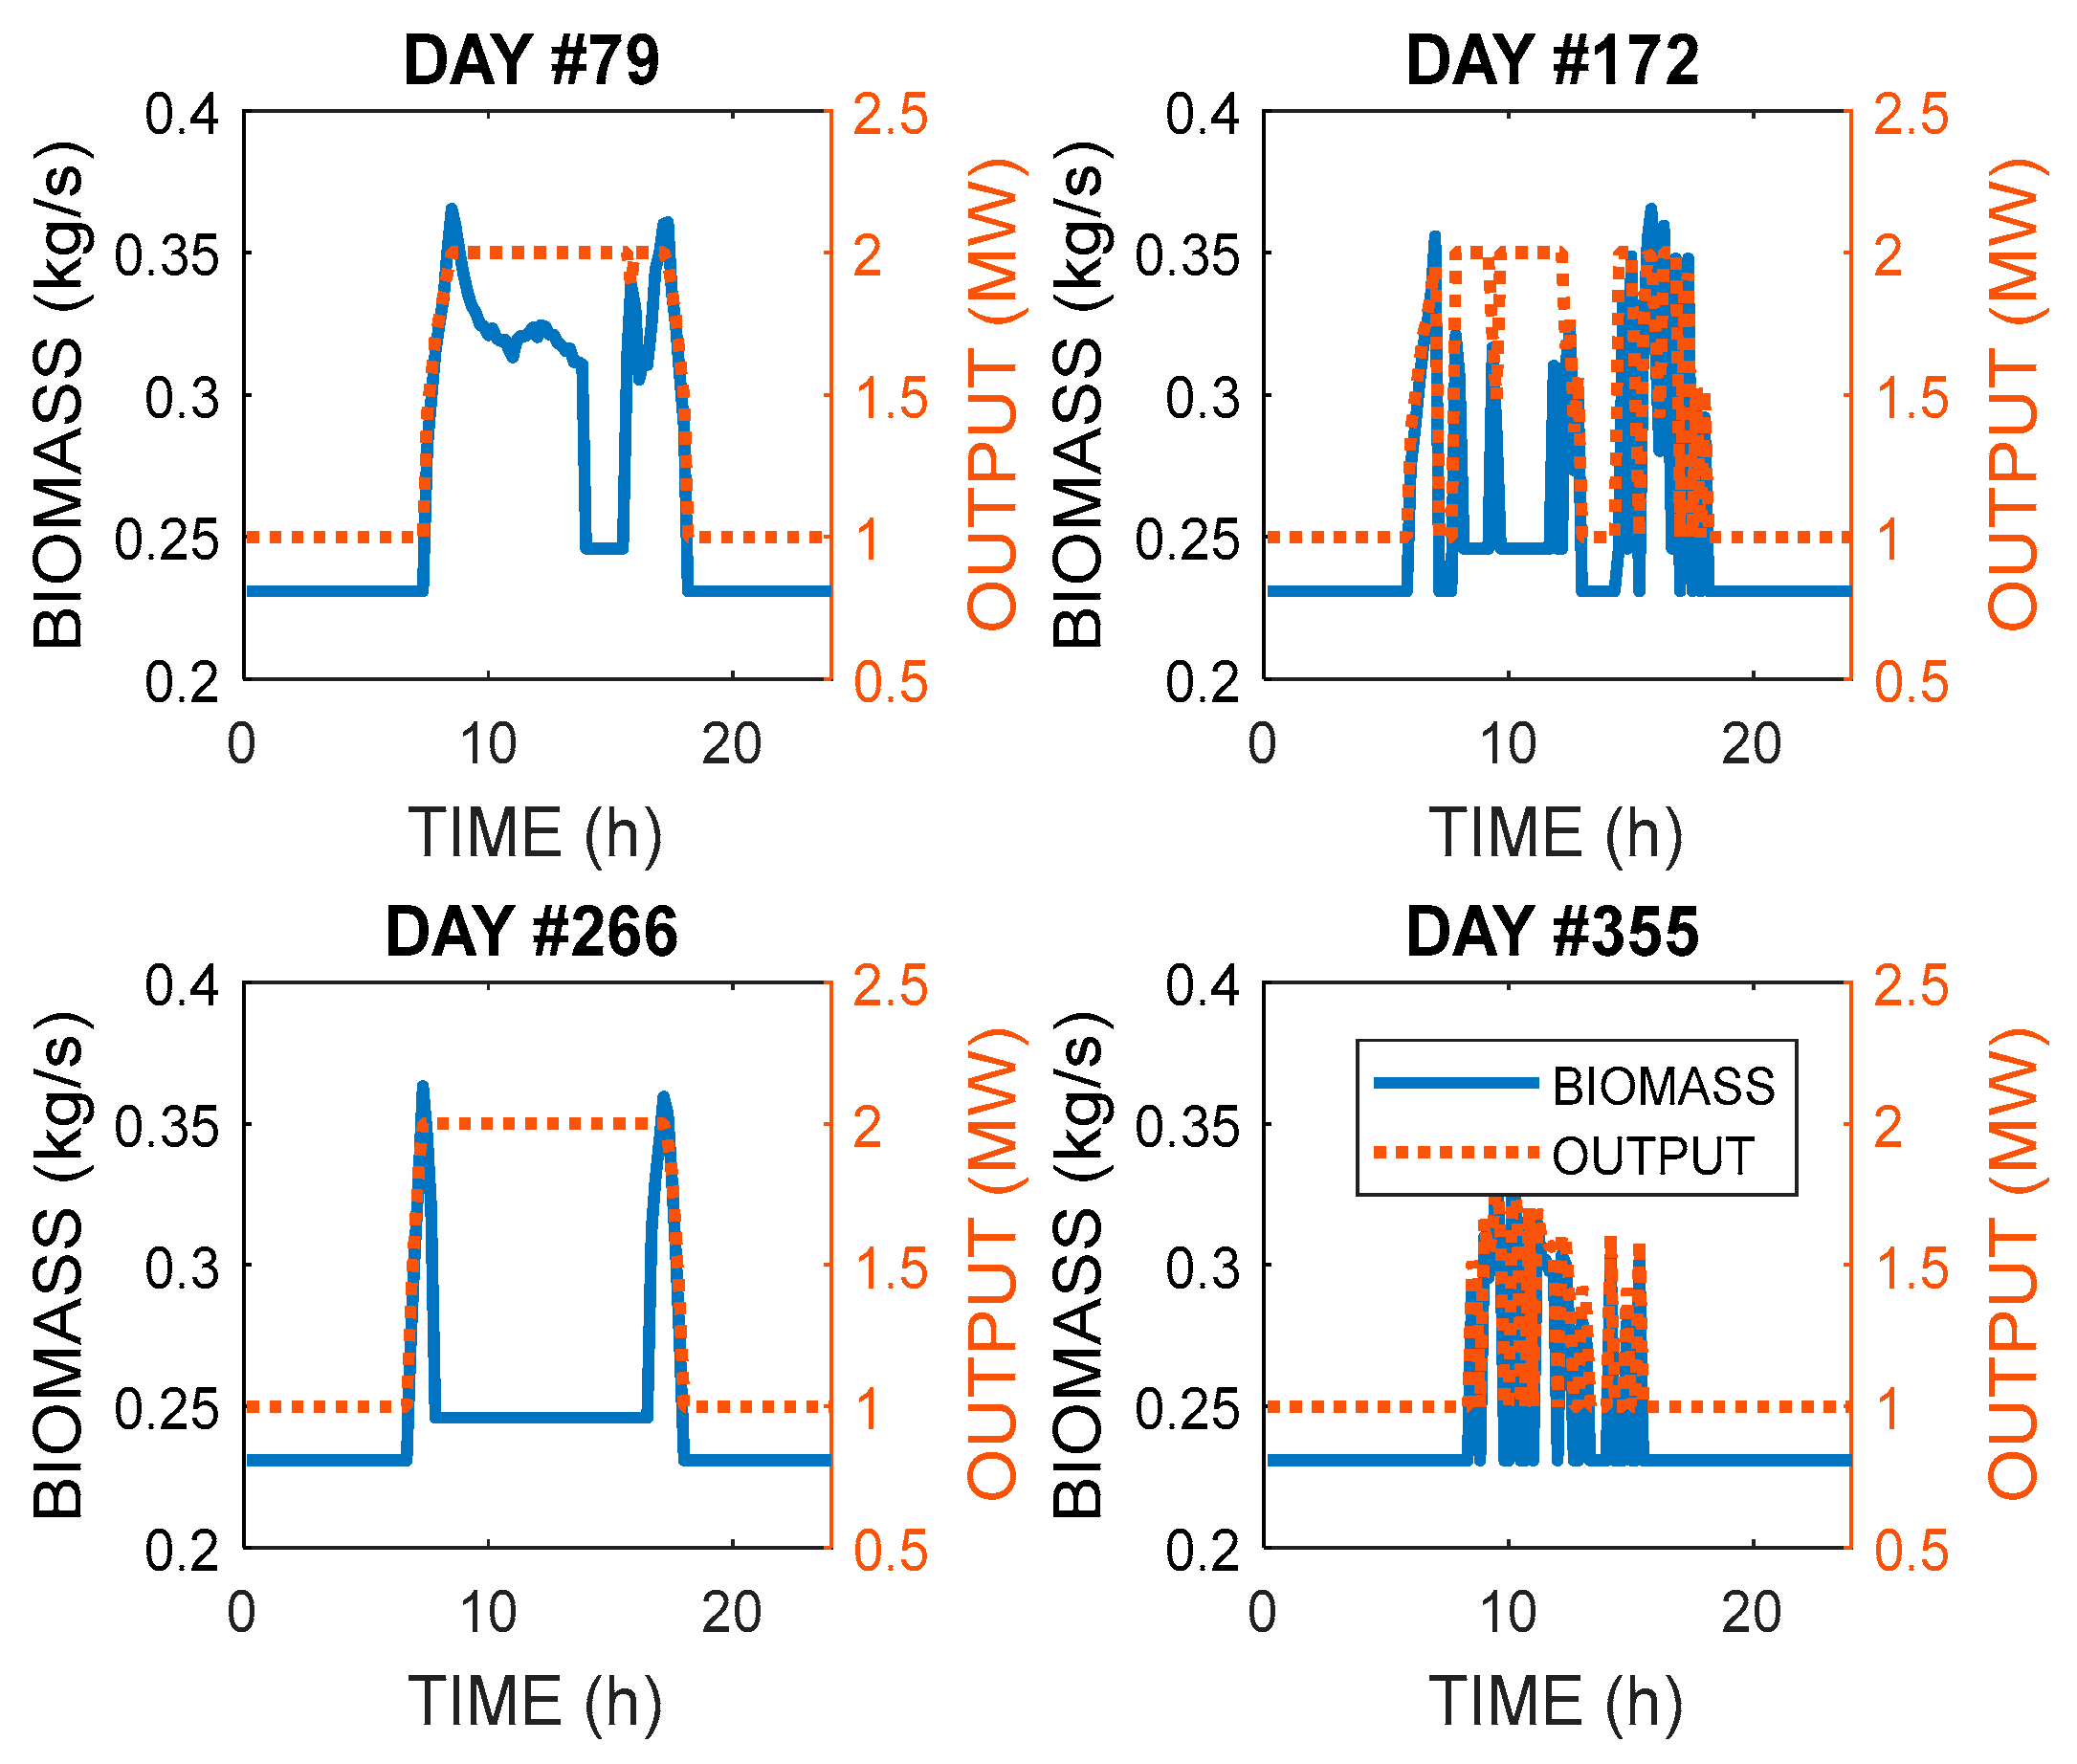
Figure 9.
Annual biomass consumption (kton/year) as a function of SM and biomass consumption limit for the two considered BFF values.
Figure 9.
Annual biomass consumption (kton/year) as a function of SM and biomass consumption limit for the two considered BFF values.
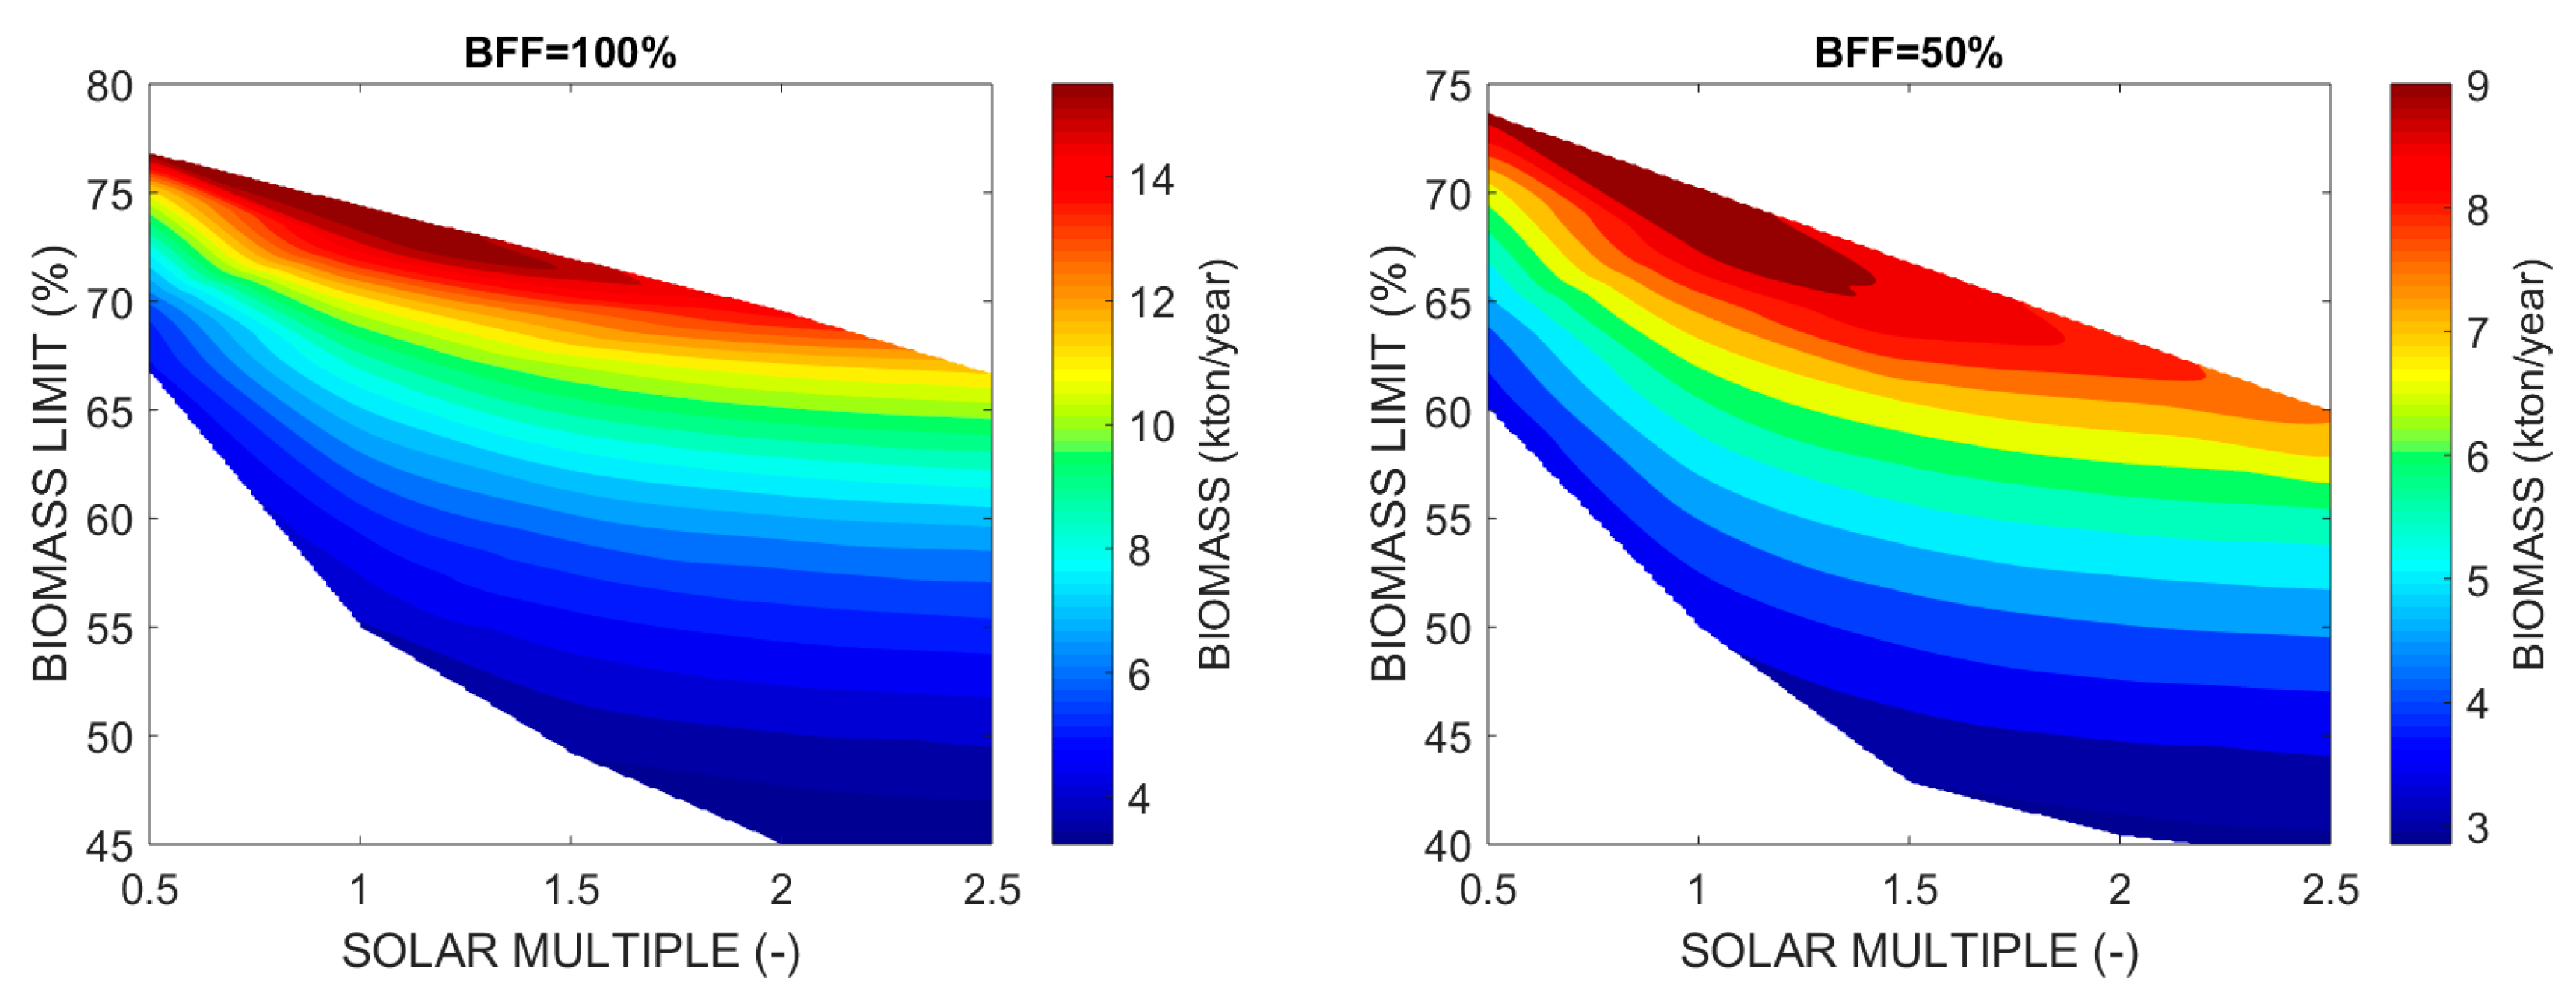
Figure 10.
Annual gross electric energy generated (GWh/year) as a function of SM and biomass consumption limit for the two considered BFF values.
Figure 10.
Annual gross electric energy generated (GWh/year) as a function of SM and biomass consumption limit for the two considered BFF values.
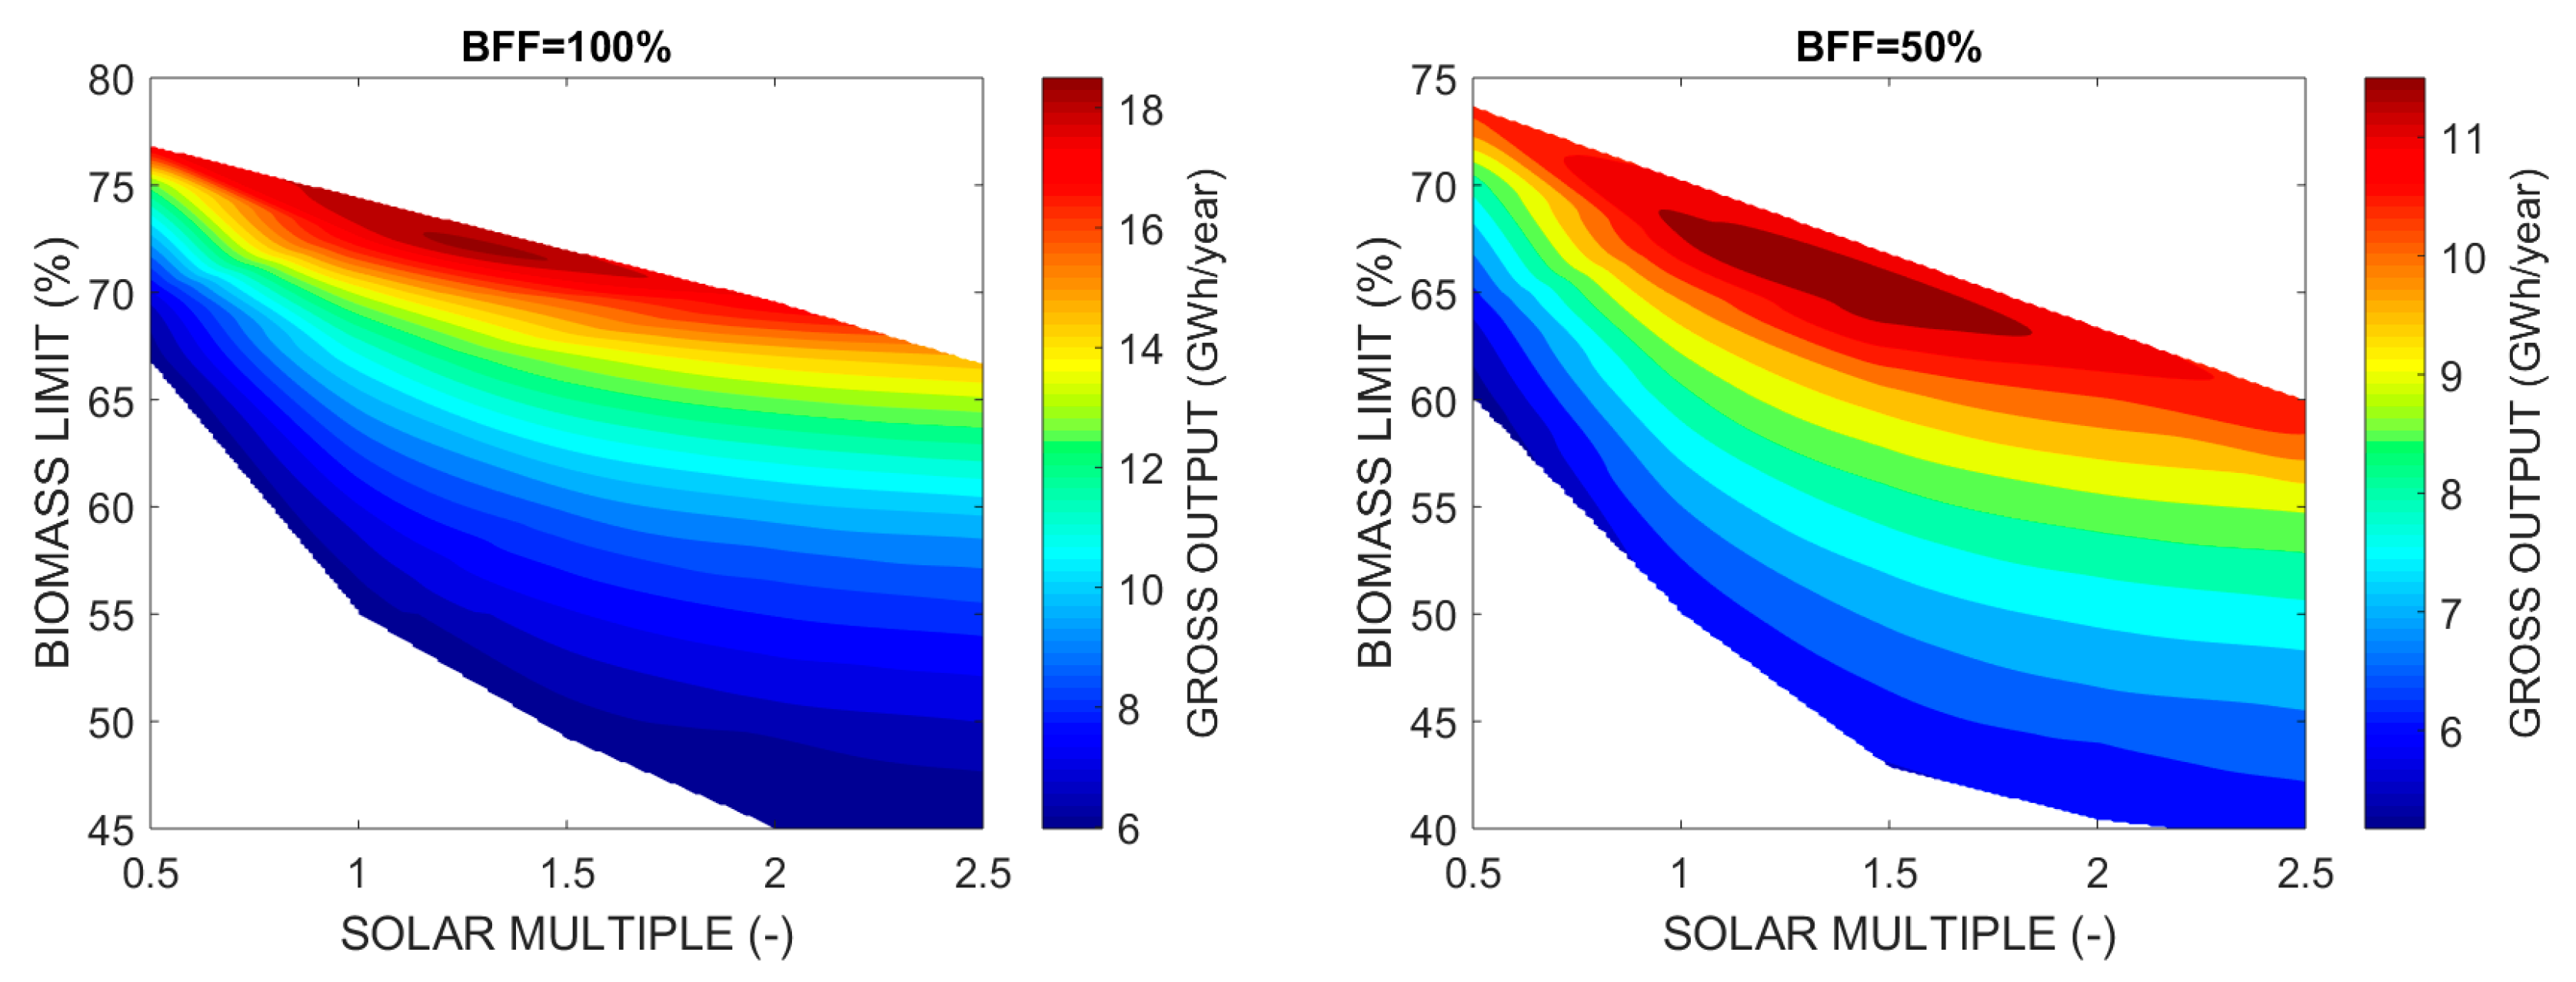
Figure 11.
LCOE (cEUR/kWh) as a function of SM and biomass consumption limit for the two considered values of BFF.
Figure 11.
LCOE (cEUR/kWh) as a function of SM and biomass consumption limit for the two considered values of BFF.

Figure 12.
LCOE (cEUR/kWh) (left) and biomass contribution (%) to annual electricity production as a function of SM for the case without biomass consumption limits for the two considered values of BFF.
Figure 12.
LCOE (cEUR/kWh) (left) and biomass contribution (%) to annual electricity production as a function of SM for the case without biomass consumption limits for the two considered values of BFF.
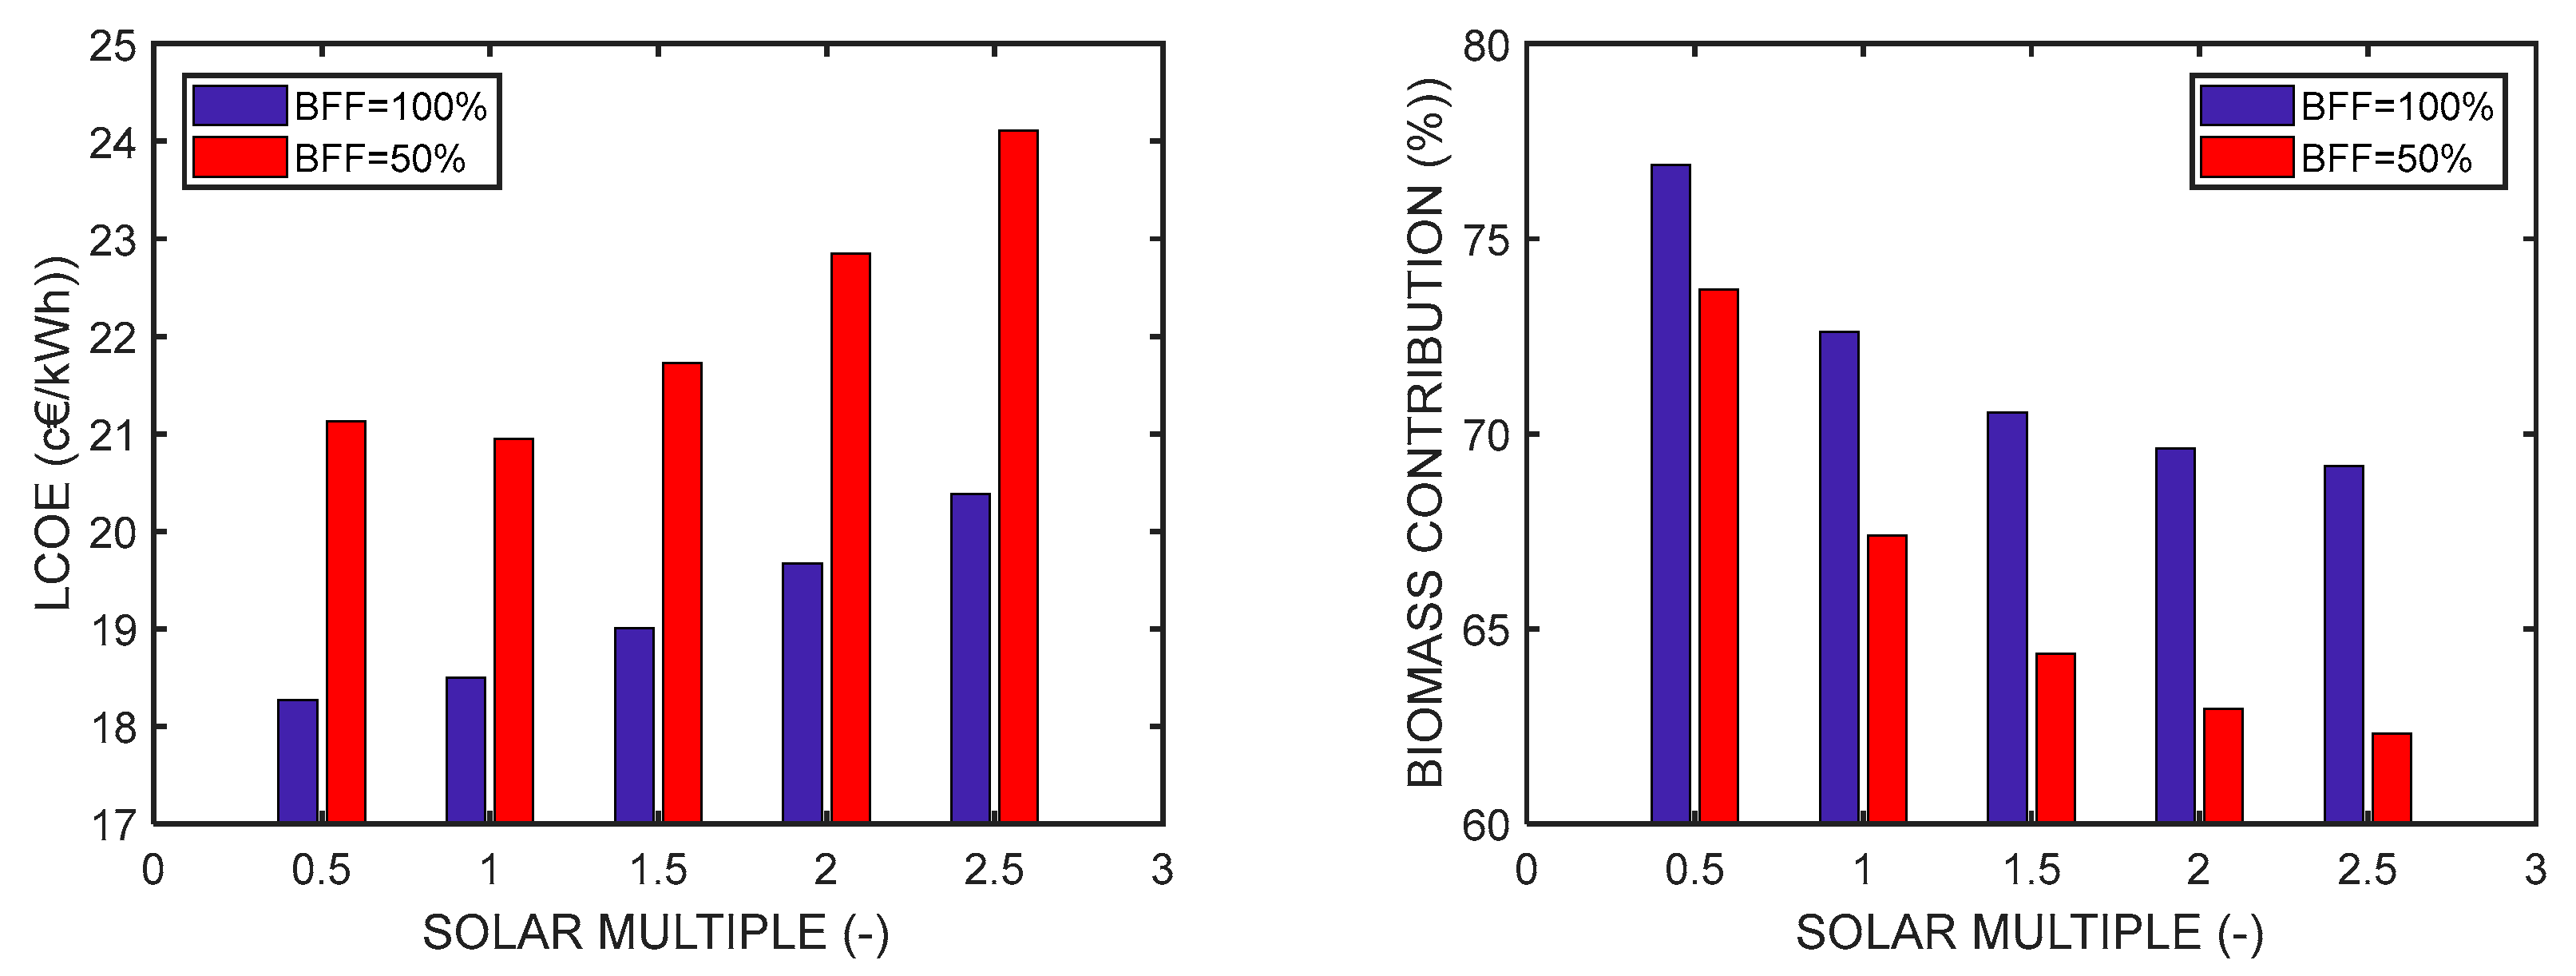
Figure 13.
LCOE (cEUR/kWh) as a function of SM for a 50% biomass contribution limit for the two considered values of BFF.
Figure 13.
LCOE (cEUR/kWh) as a function of SM for a 50% biomass contribution limit for the two considered values of BFF.
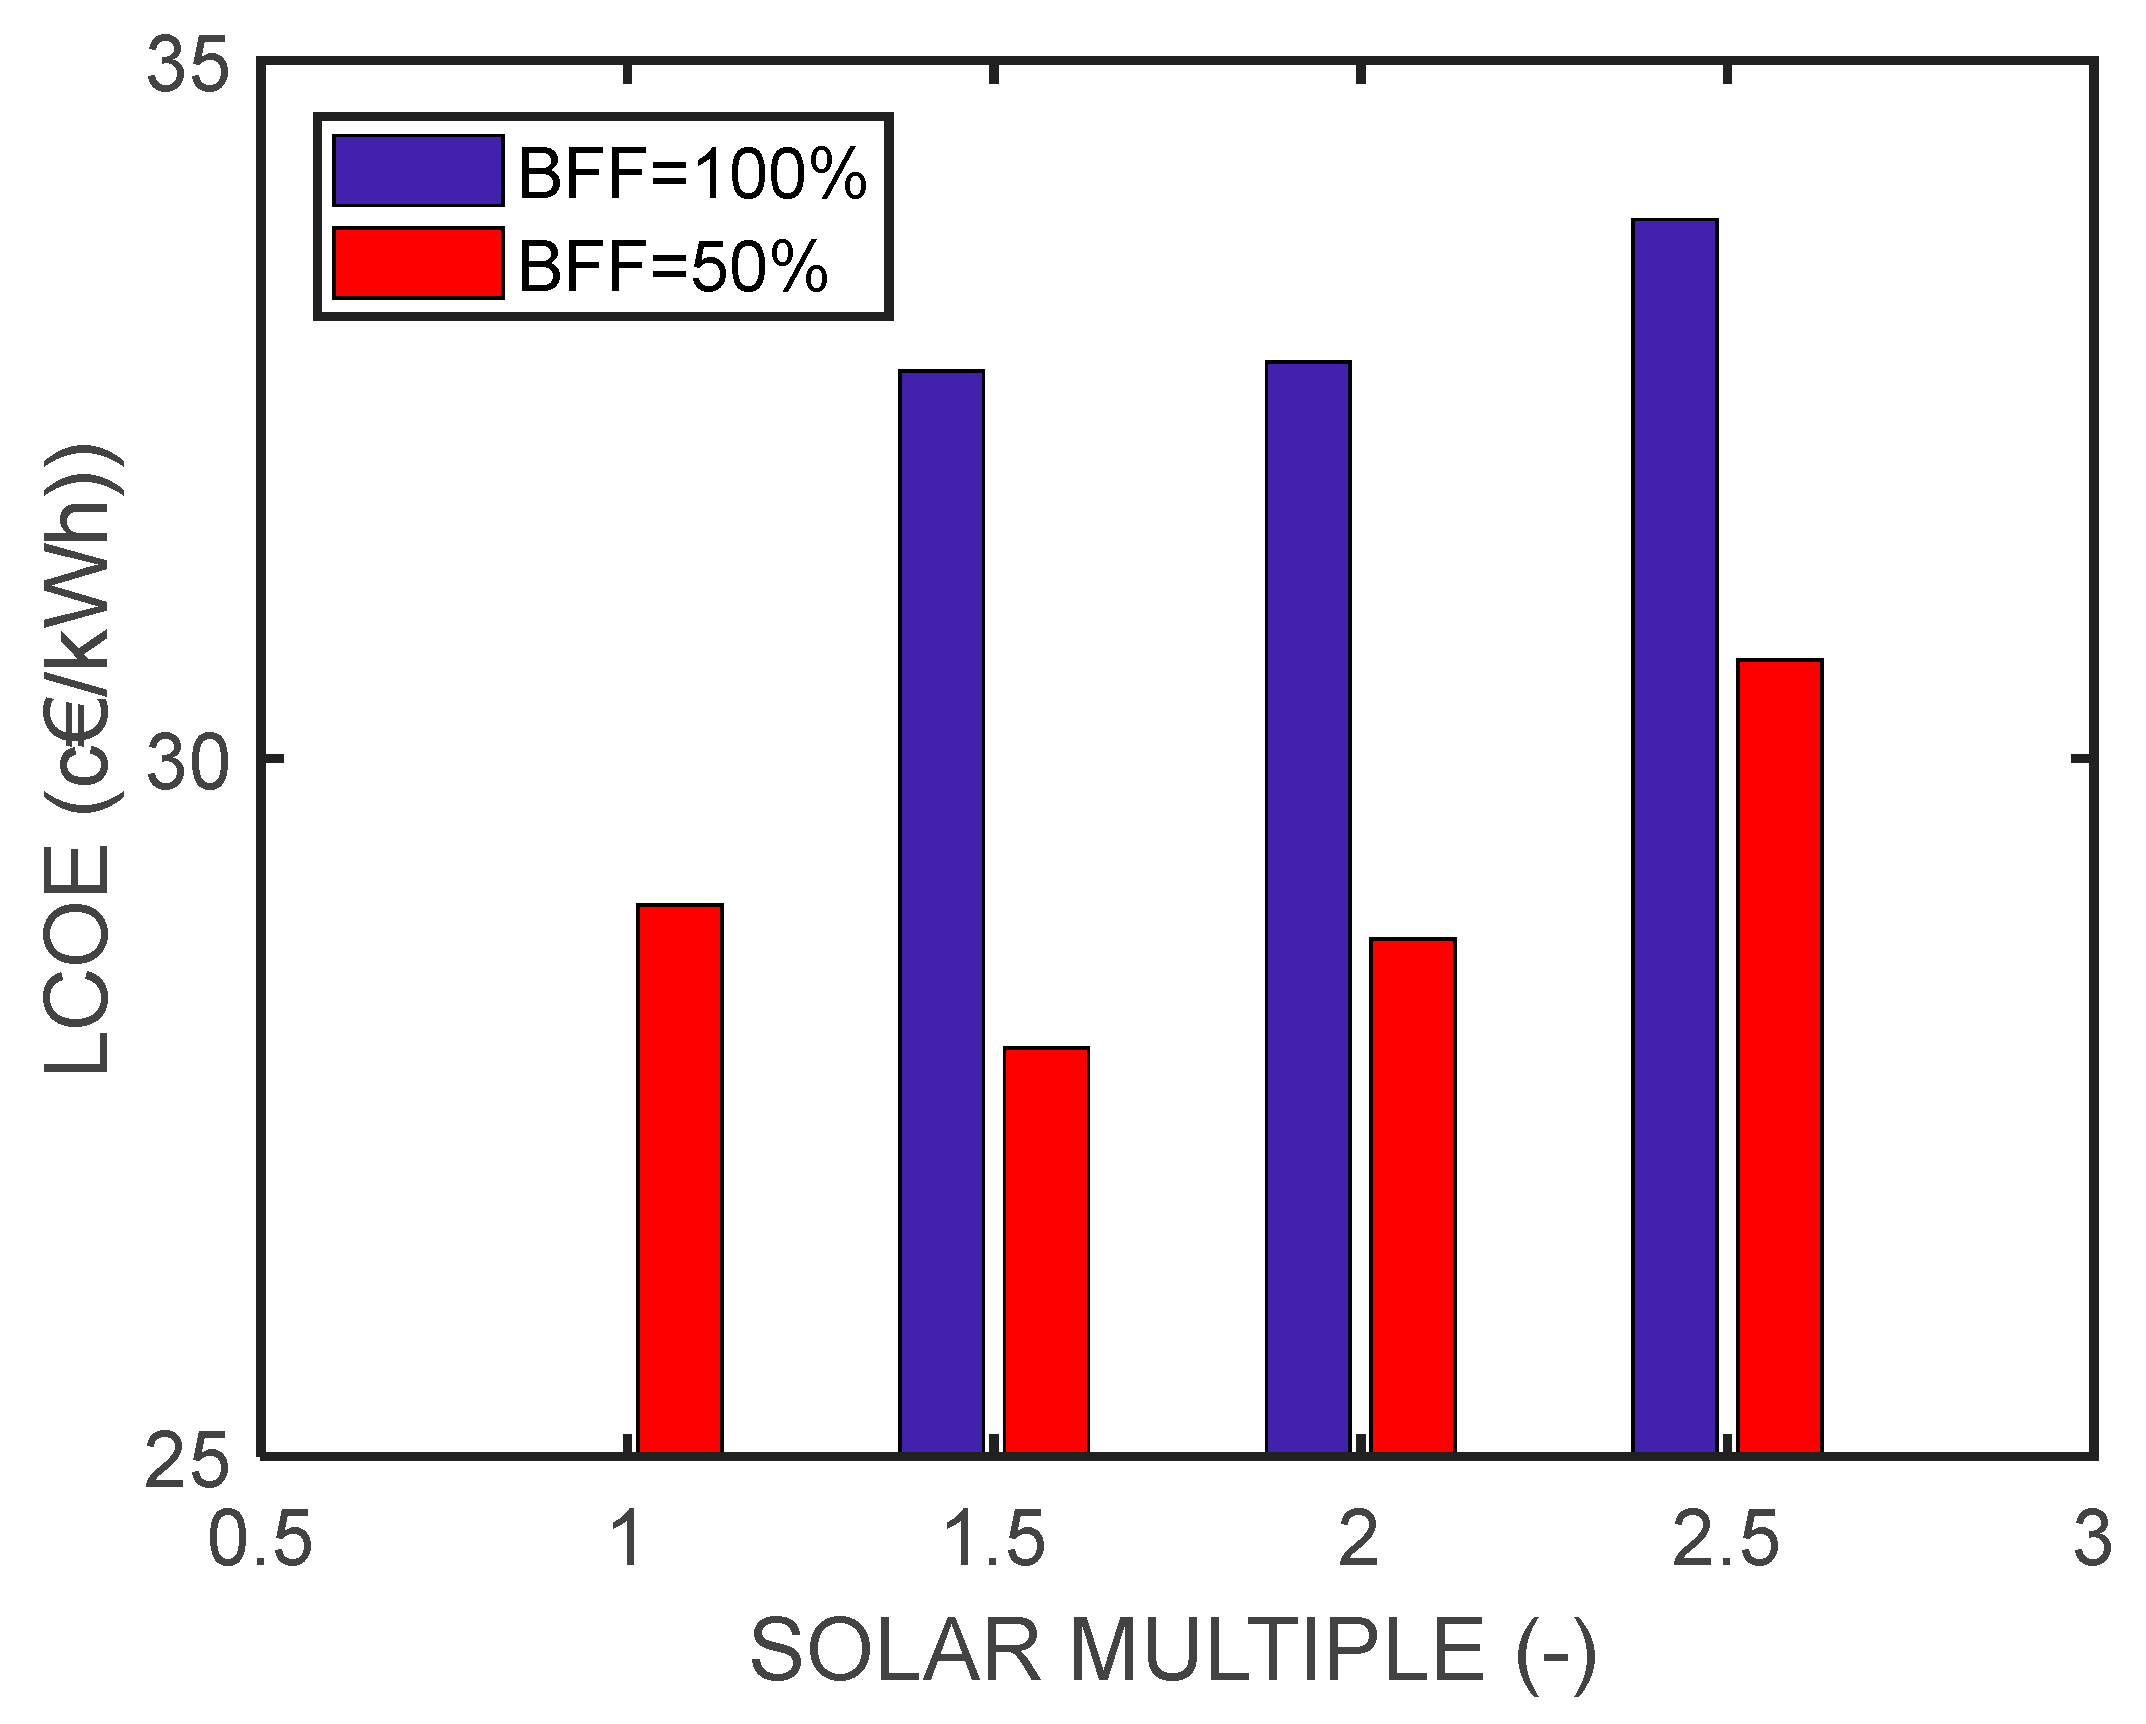
Figure 14.
LCOE (cEUR/kWh) as a function of gross output (MW) for a 50% biomass contribution limit for the two considered values of BFF (SM = 1.5).
Figure 14.
LCOE (cEUR/kWh) as a function of gross output (MW) for a 50% biomass contribution limit for the two considered values of BFF (SM = 1.5).

Table 1.
Main characteristics of the Rankine cycle.
| Parameter | Value | Units |
|---|---|---|
| Live steam temperature | 400 | °C |
| Live steam pressure | 41 | bar |
| Live steam flow rate | 2.8 | kg/s |
| Turbine isentropic efficiency | 0.85 | - |
| Condenser pressure | 0.1 | bar |
| Feedwater temperature | 105 | °C |
Table 2.
Main characteristics of the of the parabolic trough collectors.
| Parameter | Value | Units |
|---|---|---|
| Aperture width | 5.77 | m |
| Aperture area | 817.5 | m2 |
| Focal length | 1.71 | m |
| Absorber radius | 3.5 | cm |
| Concentration factor | 82.43 | - |
| Peak optical performance | 0.73 | - |
| Fouling factor | 0.90 | - |
Table 3.
Cost assumptions for economic analysis.
| Parameter | Value | Units |
|---|---|---|
| Site improvement | 30 | EUR/m2 |
| Solar field | 175 | EUR/m2 |
| HTF system | 75 | EUR/m2 |
| Biomass system | 1750 | EUR/kWe |
| Power cycle | 1100 | EUR/kWe |
| Balance of plant | 400 | EUR/kWe |
| Contingency | 10 | % |
| EPC cost | 10 | % |
| O&M fixed cost | 66 | EUR/(kW·yr) |
| O&M variable cost (excl. biomass) | 5 | EUR/MWh |
Table 4.
Financial and tax conditions.
| Parameter | Value | Units |
|---|---|---|
| Annual inflation rate | 2.5 | % |
| Income tax rate | 25.0 | % |
| Annual loan interest | 4.0 | % |
| Debt fraction | 70.0 | % |
| Plant life cycle | 30 | years |
Disclaimer/Publisher’s Note: The statements, opinions and data contained in all publications are solely those of the individual author(s) and contributor(s) and not of MDPI and/or the editor(s). MDPI and/or the editor(s) disclaim responsibility for any injury to people or property resulting from any ideas, methods, instructions or products referred to in the content. |
© 2023 by the authors. Licensee MDPI, Basel, Switzerland. This article is an open access article distributed under the terms and conditions of the Creative Commons Attribution (CC BY) license (https://creativecommons.org/licenses/by/4.0/).
Share and Cite
MDPI and ACS Style
Vélez Godiño, J.A.; Torres García, M. Techno-Economic Assessment of an Innovative Small-Scale Solar-Biomass Hybrid Power Plant. Appl. Sci. 2023, 13, 8179. https://doi.org/10.3390/app13148179
AMA Style
Vélez Godiño JA, Torres García M. Techno-Economic Assessment of an Innovative Small-Scale Solar-Biomass Hybrid Power Plant. Applied Sciences. 2023; 13(14):8179. https://doi.org/10.3390/app13148179
Chicago/Turabian StyleVélez Godiño, José Antonio, and Miguel Torres García. 2023. "Techno-Economic Assessment of an Innovative Small-Scale Solar-Biomass Hybrid Power Plant" Applied Sciences 13, no. 14: 8179. https://doi.org/10.3390/app13148179
Note that from the first issue of 2016, this journal uses article numbers instead of page numbers. See further details here.