
Pseudo-Coloring as an Effective Tool to Improve the Readability of Images Obtained in an Electromagnetic Infiltration Process
Department of Electromagnetic Compatibility, Military Communication Institute–State Research Institute, 05-130 Zegrze Poludniowe, Poland
*
Author to whom correspondence should be addressed.
Appl. Sci. 2023, 13(17), 9496; https://doi.org/10.3390/app13179496
Submission received: 16 June 2023
/
Revised: 6 August 2023
/
Accepted: 14 August 2023
/
Published: 22 August 2023
(This article belongs to the Special Issue Wireless Communication: Applications, Security and Reliability)
Abstract
:The article presents a method of improving the readability of images obtained in the process of electromagnetic infiltration for sources processing information in a visual form (texts, images). The method uses the so-called technique of pseudo-coloring. The proposed method is based on LUT tables using the exponential function mapping the signal level of the compromising emanations into a point of the RGB color space. The conducted analyses showed that the proposed function determining the coefficients of the LUT table is an effective tool in the process of improving the level of visual perception, i.e., it increases the perception of shapes and the ability to extract elements from the background. In image processing, LUT can be identified as a color map, i.e., a structure that reflects the gray shade of an image pixel into its color representation in the RGB color space. The proposed method assumes the use of exponential functions for this reflection. As an assessment of the effectiveness of the proposed methods of pseudo-coloring images, both a subjective assessment based on the visual perception of a group of observers and an analytical assessment, which was carried out by analyzing the contrast of the assessed images, were adopted. This allowed for the same assessment and usefulness of the proposed function in determining the RGB value in the process of pseudo-coloring of images obtained during electromagnetic infiltration. The obtained results confirmed that the proposed method significantly improves contrast parameter of images, which is also confirmed by the visual assessment of these images.
1. Introduction
Undoubtedly, the sense of sight is the most important human sense. It is estimated that 85% of the perception of information from the environment is made by visual observation. The perception of images, including their colors, by humans is a process that takes place in the brain [1,2]. Our eyes only detect electromagnetic radiation [3]. Additionally, the objects around us have no colors. They only reflect or absorb light waves of a certain frequency. Light is an electromagnetic wave, and an image, also colored, is a sensation evoked in the brain by nerve impulses generated in the retina of the eye.
Taking into account properties of human vision, a solution for coloring images obtained in the process of electromagnetic infiltration has been proposed. Such images are reproduced using a palette of shades of gray [4,5]. The recorded compromising emanations contain information about the processed data in a graphical form. There is no information about the colors used on the primary side. Hence, in many cases, the obtained images are poorly readable, and the perception of the data contained in them is very difficult.
It should be noted that the proposed image-coloring algorithm does not reproduce the actual colors of the data used by the user on the primary side. Coloring is primarily intended to improve their perception and thus increase the effectiveness of their analysis and perception of details that were not noticeable in the image in shades of gray [6,7].
The existing methods of pseudo-coloring images are based on ready-to-use color-mapping tables (Look-Up-Table, LUT), which were created for other types of imaging. The images reproduced from the compromising emanation signals have a different specificity, they are usually noisy, disturbed, and their fragments corresponding to the information contained in the source images are distorted (they reflect only the vertical edges of the objects contained in them). Ready-made color maps are therefore of limited use in this case. It seems that the LUTs based on the use of exponential functions proposed in the article may be more useful, especially in the case of allowing the observer to change their parameters. The use of modified LUTs as a method of filtering the reproduced images is the subject of further work.
An important problem related to the implementation of the proposed method is the strong variability of the conditions in which the generation and recording of compromising emanation signals takes place. They arise as one of many side-channel emissions related to the operation of various components of the tested device [8,9,10,11,12]. Even for different copies of the same type of equipment, they can differ significantly. Therefore, it can be difficult to prepare fixed color-mapping functions that are suitable for all cases. Therefore, it becomes necessary to allow the operator to change their parameters. This makes the final colorization results related to the operator’s action, his experience, and subjective feelings. One possible solution to this problem could be the use of artificial neural networks. However, adapting them to different measurement scenarios requires a significant increase in their complexity.
2. Methods of Pseudo-Coloring with the RGB Palette
The range of electromagnetic waves (visible light) detected by the human sense of sight includes waves with a length of about 380 nm to 770 nm. This entire range is called white light, resulting from the mixing of seven primary colors (Figure 1).
Light waves, after passing through the optical system of the eye, create a kind of image on the retina, the light-sensitive membrane located at the back of the eye. The retina consists of two types of receptors:
- rods: highly photosensitive, responsible for night vision, shape and movement detection;
- cones: less photosensitive, responsible for day vision, detecting details and colors.
There are about 100 million rods, and only 6 million cones and they are concentrated mainly in the macula. We owe color vision to cones. There are three types of cones in the human retina, each of which has a different spectral characteristic, i.e., a different sensitivity for each wavelength of light. These three types of cones (Figure 2) are denoted as S (maximum response for short waves), M (maximum response for medium waves), and L (maximum response for long waves) [1,2].
S cones have a maximum sensitivity for a wavelength of approx. 445 nm, which corresponds to the blue color (B). It is practically incapable of detecting wavelengths longer than 520 nm. M cones are “tuned” to wavelengths of 535 nm (green, G), and L cones to 575 nm, which in turn corresponds to yellow, although it is customary to assume red (R). The individual colors perceived by humans are created as a result of the interaction of nerve impulses produced by all three types of cones.
The signals produced by the cones pass through several layers of neurons in the retina and then via the optic nerves, first to the lateral geniculate nucleus (LGN) and finally to the occipital lobe of the brain. The LGN receives input from the three types of cones and produces three different output channels: one achromatic (brightness) channel summing the L (Red) and M (Green) cone outputs, and two chromatic channels which in turn subtract the L (Red) and M (Green) cone output pulses, or subtract the achromatic (Yellow) channel output and the S (Blue) cone output pulses (Figure 3). It is estimated that the ratio of the number of cones of each type is R:G:B = 40:20:1. It can be seen that the resultant sensitivity of the human eye is the lowest for the blue color.
The properties of the human eye related to the perception of colors are reflected in one of the color space models, the RGB model (Figure 4). In this model, for the 8-bit representation, the electrical signal defining the brightness of each of the three primary colors can have one of 256 levels (from 0 to 255). This means that 16,777,216 colors can be defined in the model.
The compromising emanations produced by the information display devices allow reconstruction of the data presented in them in the form of grayscale images [3,4,5,6]. Due to the very low levels of the measured signals, the accompanying noise and environmental disturbances, the reproduced images are of poor quality [7,8,9,10]. Very often it prevents data reading and analysis. However, these images may be subject to further processing, which allows us to obtain more information from the images by highlighting certain features [8,11,12,13], for this purpose, e.g., algorithms of coherent summation, edge detection, context filtering [14,15,16,17]. In each case, the obtained improvement in image quality enables easier perception of the data contained therein. However, this improvement is not always sufficient. In addition, it should be noted that the application of the above-mentioned image quality improvement algorithms still results in grayscale images or, in extreme cases (thresholding the pixel amplitude values), monochrome images.
In the case of the electromagnetic infiltration process, algorithms are commonly used to threshold, with one or two thresholds, the values of pixel amplitudes of the reconstructed image. In the case of images reproduced in the electromagnetic infiltration process containing typical text data, for which the pixel amplitude values significantly exceed the background pixel amplitude values, such algorithms can be effective (Figure 5). Most often, such an effect occurs for the emission source in the form of a Video Graphics Array (VGA) standard graphic path [18,19]. Obtained monochrome images allow to read characters. However, the high contrast of the image reproduced in black and white colors is tiring for the operator’s eyesight. It effect becomes important when a work with this type of images lasts for a long time.
Completely different effects are obtained in the case of images whose data structure is different. This applies primarily to photographs, images processed using graphic standards other than VGA, and images obtained in the process of examining the correlation of patterns with characters contained in the reproduced images (the brightest points of such an image inform about the occurrence of a character consistent with the pattern’s character) [3,4,10,20]. In such cases, the use of thresholding pixel amplitude values very often blurs the distinctive features of the contained data, which may determine their reading (Figure 6).
The information presented in the first section of the article indicates that the use of a color palette instead of shades of gray can significantly improve the perception of information. Additionally, the use of a color palette improves the speed of information assimilation, which is particularly important in the case of the electromagnetic infiltration process [21,22,23,24]. Colorization of images allows seeing data that a person may not pay attention to in an image appearing in a scale of shades of gray. In many cases of obtaining data using non-invasive methods and presenting them in the form of images, it is necessary to analyze them in detail. The use of combinations of different colors depends on the structure of graphic data, i.e., the diversity of pixel amplitude values that build these data.
Often, the ability to control the colors allows one to highlight interesting data or suppress data irrelevant from the point of view of the electromagnetic infiltration process. Therefore, we propose a new solution. The solution will provide options for pseudo-coloring images with the RGB color palette, which can be modified depending on the properties of the analyzed image. The aim of the proposed method is therefore:
- extraction of data invisible in the image reconstructed in shades of gray;
- colorization of images, which allows to increase the level of perception of data contained in these images (increase the level of readability).
The problem of improving the perception of images reproduced in grayscale is known [25,26,27,28]. This is evidenced by the use of pseudo-coloring techniques, for example in X-ray imaging [22,29]. Commercially available software for analysis of revealing emission signals, the so-called raster generators, have implemented image coloring algorithms. These generators provide four fixed color palettes, most often described as: “Gray”, “Hot”, “Hot back” and “Radar”. It is also possible to narrow down the color palette corresponding to the amplitude values of the image pixels. The pseudo-coloring algorithm implemented in this way has several disadvantages. First, narrowing the range of pixel amplitude values does not significantly improve the perception of the data. Secondly, the impossibility of changing the meaning of colors in the range of the respective ranges of pixel amplitudes in the area of a given palette makes it impossible to highlight important pixels. It should be noted that the mentioned raster generators are effective in the case of images containing already readable data, i.e., groups of pixels significantly different in amplitude value from the amplitudes of background pixels. In the case of data for which the pixel amplitude values are not much different from the background, the generators become inefficient.
The method proposed herein combines two algorithms for improving the perception of relevant data contained in the reproduced image. On the one hand, they perform pseudo-colorization of images (multi-level thresholding); on the other hand, by changing the parameters of the transformation function, i.e., LUT coefficients, they select the pixel amplitude values that are exposed from the background. The operator therefore has access to a larger number of parameters that can be freely controlled to achieve the desired effects. This means that the image subjected to the pseudo-coloring process with the methods described is characterized by a much higher level of perception.
3. Description of Pseudo-Coloring Method
The specific nature of the compromising emanation signals (spurious emission) causes the images reproduced from them to differ significantly from the images obtained from sources such as cameras, X-ray scanners, or tomographs. Due to the low SNR values, coherent summation and filtering are typical methods of improving their quality. The resulting image is also subjected to contrast-enhancement operations. However, they are still presented using a palette of shades of gray. The perception of such an image (detail distinguishability) may be difficult, especially in the case of small changes in the signal value (Weber–Fechner Law). Moreover, for the human eye, image blur strongly reduces the sensitivity to luminance contrast, but the sensitivity to chromatic contrast is not reduced. For this reason, a more effective method of improving the readability of the image created from compromising emanation signals is to manipulate its color rather than its contrast.
The approach proposed here consists of the conversion of images saved in the bitmap format, i.e., conversion from a one-dimensional color space (8-bit channel, grayscale color scale) to a three-dimensional space (24-bit channel), using the RGB color space (Figure 7). The 8-bit channel is associated with the 8-bit A/D converter used in the process of recording emission signals. Therefore, the software used for data visualization developed by the authors originally enabled the recording of the reproduced data in the form of grayscale images with an 8-bit depth.
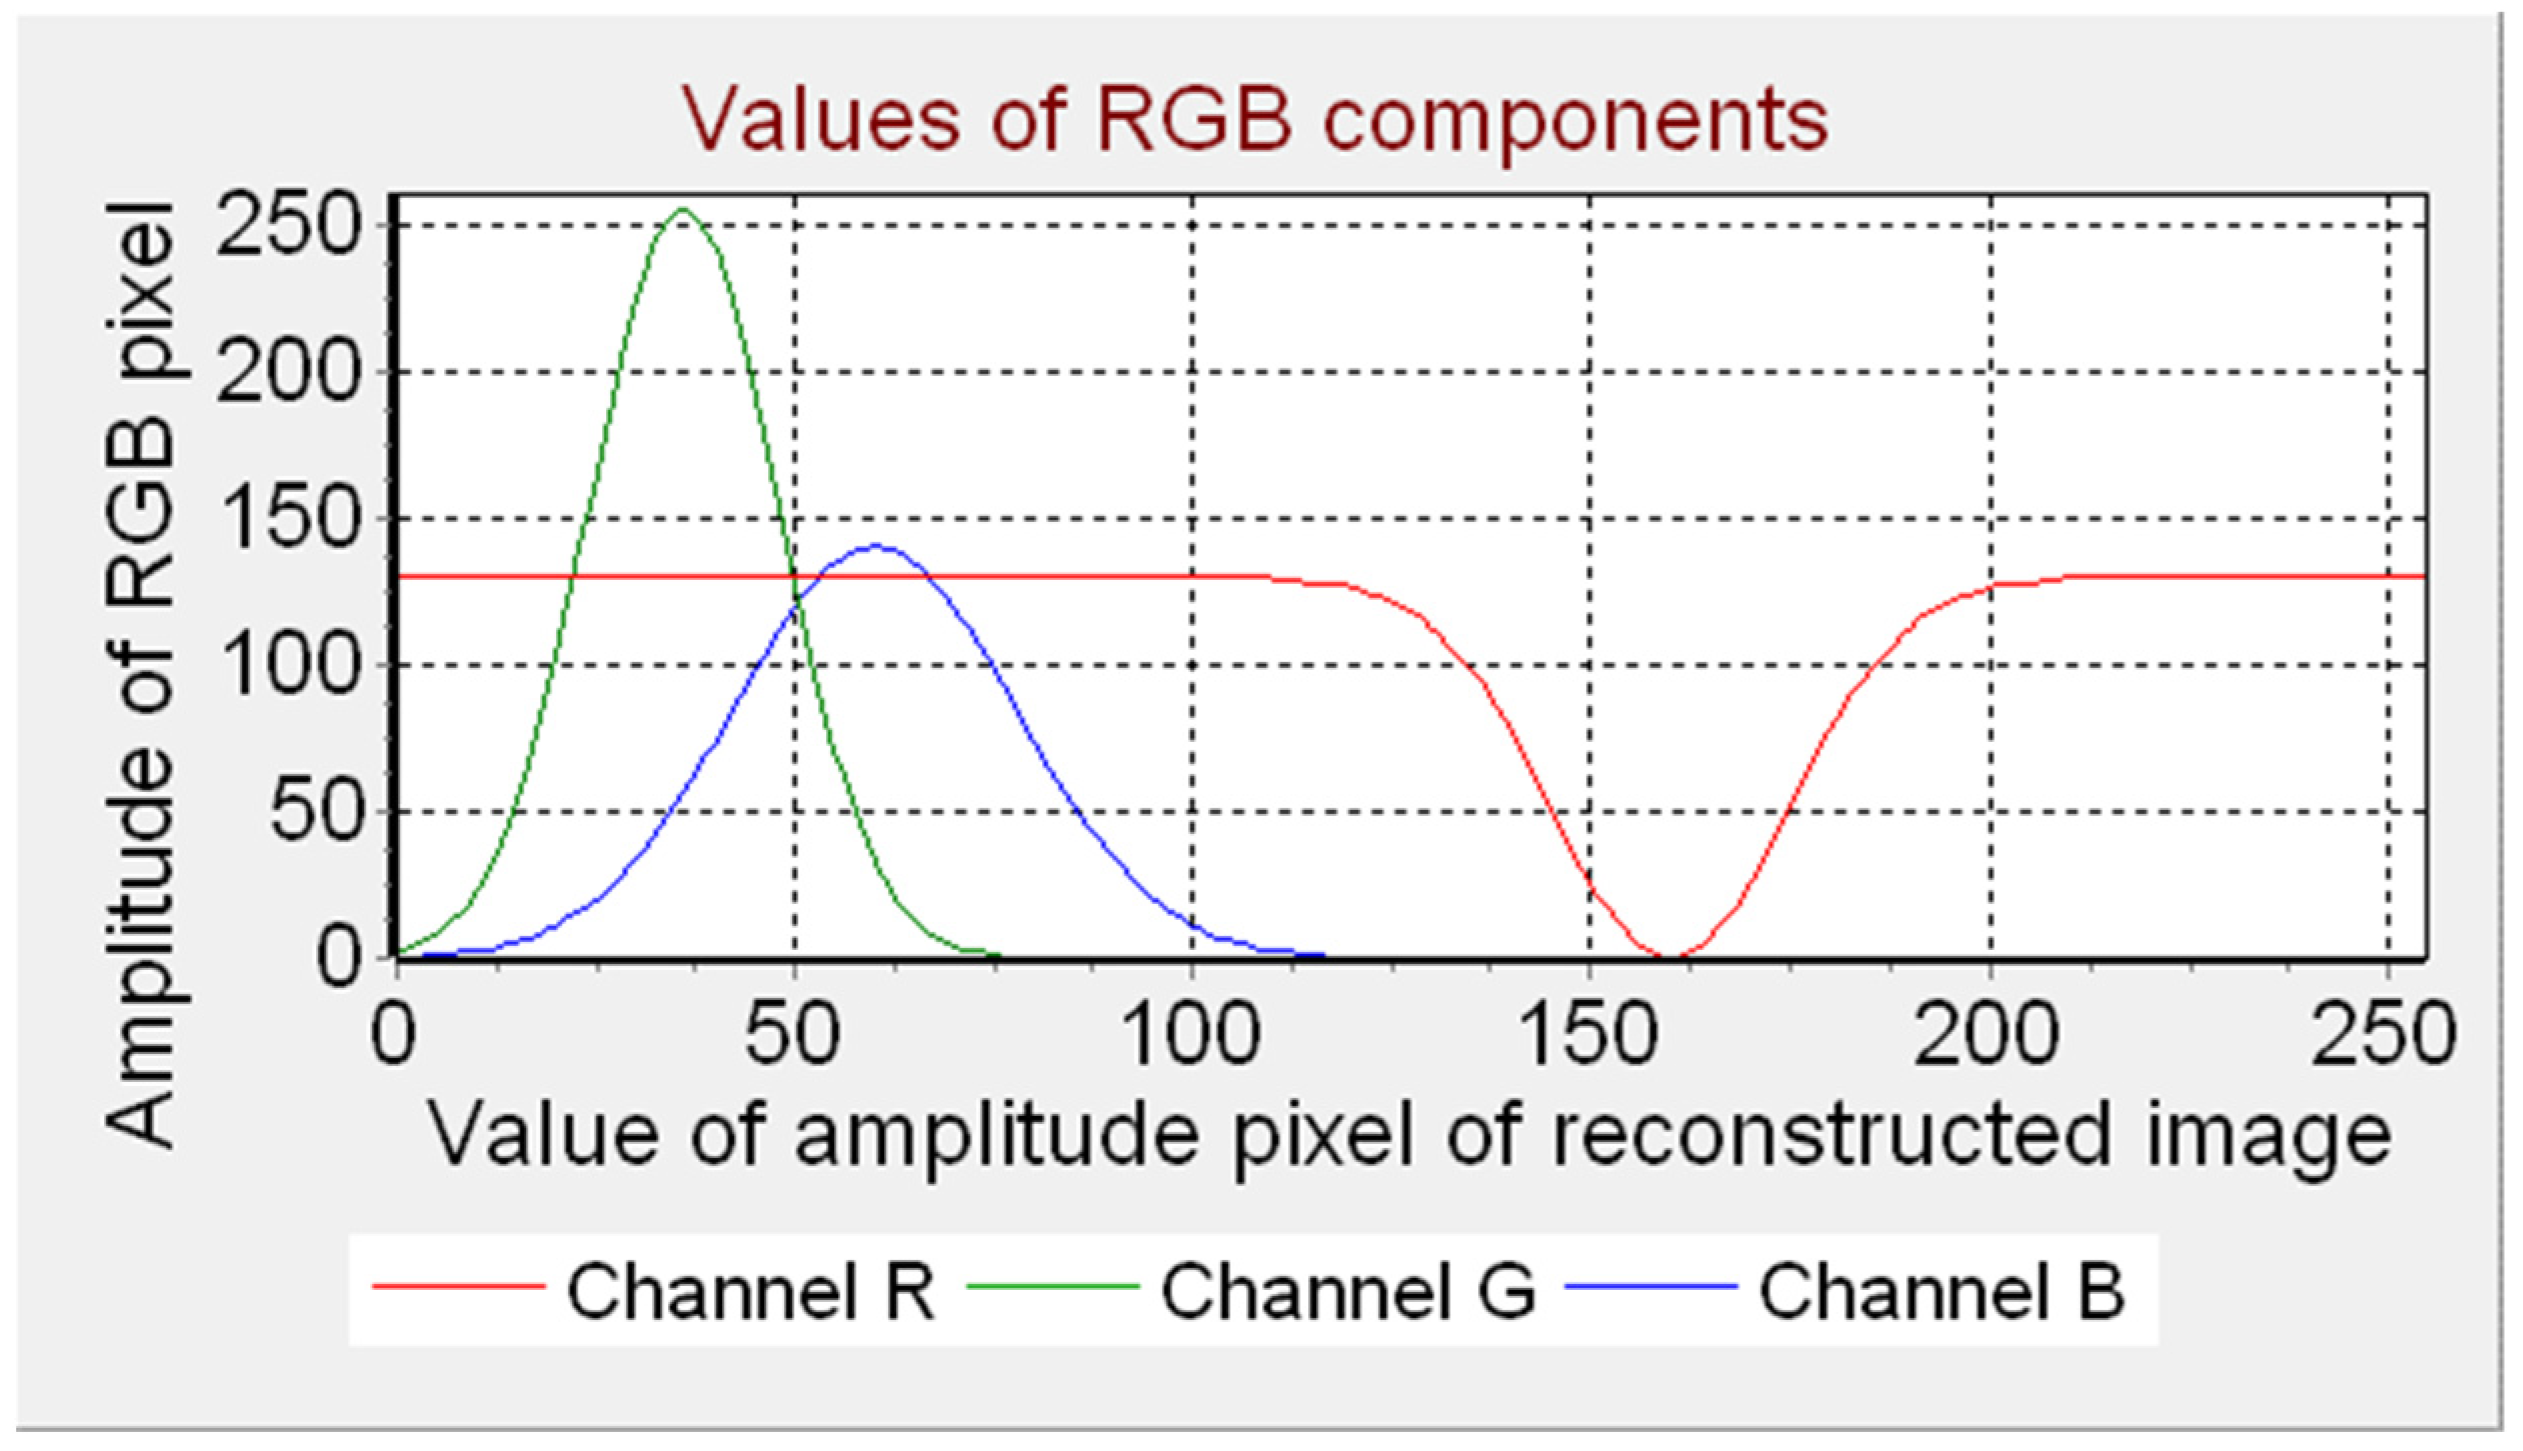
The method of multi-level thresholding of image pixel amplitudes for each RGB channel presented later in the article allows us to obtain a color image. The exponential function (Figure 8) was used to build the LUTs, which is described by Equation (1); the mathematical notation is presented for the R channel (other channels G and B are described analogously). The variables of the function are the width of the waveform characterized by the zeros and , the shift of the function waveform along the pixel amplitudes of the colored image, the maximum function (maximum value of the function waveform amplitude), which may be in the range , and the minimum function, which may be in the range . Changing these parameters (Figure 8) enables the construction of LUTs with different values for each RGB channel.
where:
—the width of the shape of the exponential function for the channel R defined as:
—value of for which the exponential function has a maximum in the range (it is the middle of the range ; and —corresponding minimum and maximum value of range of x in which the values of exponential function are higher or lower than ; —maximum or minimum value of the function set in the range ; —value of the function set in the range .
The shape of the analyzed function is not accidental. It is related to the form of characters contained in the reproduced images from the compromising emanations. The information diffusion channel, through which the radiated emission signal penetrates from the source to the receiver, has the features of a high-pass filter. On the receiving side, therefore, the vertical and diagonal edges of the graphic elements are identified. The values of observed changes in image pixel amplitudes depend on the sharpness of the original image. Windows uses an anti-aliasing algorithm to display graphics. This affects the blur effect of the reproduced edges of graphic characters. Hence the proposed form of the function, the course of which is to adjust to the properties of the displayed graphic signs on the receiving side.
The proposed function, by creating the LUT table values, performs the multi-level thresholding operation, which is important in the case of analyzing images containing other elements that make it difficult to recognize the information. An important issue is the selection of parameter values for the exponential function (Figure 8). This applies both to the width of the waveform , its shift along the axis of the pixel amplitudes of the reconstructed image as well as the maximum of the exponential function. An important parameter is also the minimum , which is the value of the exponential function outside of the range .
The need to protect classified information in NATO and EU countries has been regulated by law. Part of this protection is electromagnetic protection. It focuses on operations that minimize the possibility of using compromising emanation signals to breach the confidentiality of data processed in ICT systems. The effectiveness of the technical solutions used for this purpose is assessed in laboratory conditions, where the scientific staff measures not only the levels of electromagnetic emissions, but also does their classification. In the case of imaging devices, these activities are focused on an attempt to recreate the original image processed in the device under testing from side channel signals. The colorization method is intended to assist the operator in evaluating the reproduced images. Experience from other fields (e.g., medical imaging) shows that a color image attracts the observer’s attention more, and properly selected colors can increase its clarity and readability. The use of colors increases the distinguishability of image details, especially in areas corresponding to dark gray tones. Typical methods such as increasing the contrast or equalizing the histogram of an image reproduced in gray colors are not as effective. It should be remembered that the images reconstructed from the compromising emanation signals are usually of quite low quality, and the fragments responsible for the information content are only a small part of them (the edges of the original image objects). Therefore, a real scenario is the use of the method in the daily activities of research laboratories evaluating devices for the purposes of their certification (SDIP-27).
4. Conditions of Analyses
4.1. Primary Images
In order to present the effectiveness of the proposed method, the process of colorization of graphic data was carried out. The effects of the new approach were analyzed by visual and analytical methods. As sources of compromising emanations, allowing for the registration of signals used to reproduce the images subject to analysis (as in the case of the electromagnetic infiltration process), a computer with a VGA and High Definition Multimedia Interface (HDMI) graphics path, a projector operating in the HDMI standard and a Voice over Internet Protocol (VoIP) terminal display were used [5,7,8]. The images processed on the primary side were the images shown in Figure 9.
In the conducted pseudo-coloring analyses, images (Figure 10) reconstructed from compromising emanations for the above-described emission sources were used.
As mentioned, an important aspect of pseudo-coloring is the possibility of some kind of data filtering. The result of this filtering is to expose the sought data from the background and increase the level of their perception. The use of the pseudo-coloring algorithm presented in the article may allow for the suppression of less significant graphic data, which makes other considered data more legible. This property of the considered method of pseudo-coloring becomes extremely important in obtaining data and increasing the level of their perception.
As mentioned, LUTs built for each RGB channel based on the exponential function were used in the process of pseudo-coloring of the images. The coefficients of the LUT table were determined for the appropriate parameters , , and (Figure 11, examples of the function for RGB channels) of the considered function .
The first stage of the analysis of the obtained results was based on visual analysis. It consisted in assessing the quality and perceptibility of data, the form of which changed significantly after pseudo-coloring [30,31,32,33,34].
The images obtained in the pseudo-coloring process were compared with the images obtained as a result of coloring with the use of typical “Hot” and “Radar” color palettes (Figure 12).
Since the previously mentioned available raster generators make it possible to change each color palette by reducing the dynamics of color variability, three different palettes were used for each of the analyzed “Hot” and “Radar” palettes (Figure 13). Narrowing the range of variability of pixel amplitude values had a big impact on the form of the obtained images.
4.2. Objective Assessment-Contrast Analysis
For the purposes of evaluating images reconstructed on the basis of registered spurious emissions and subjected to the process of pseudo-coloring, we propose using one of the most frequently used image quality assessment parameters, i.e., image contrast [35]. The assessment of the contrast of colored images was made after re-converting them to a 1-dimensional space of shades of gray. This type of conversion is part of the transition from the RGB color space to the YUV, YCbCr, or CIE spaces. As part of mapping the image in these color spaces, as a result of appropriate mixing of the primary colors R, G, B, a channel representing its brightness is created, to which methods of analytical contrast determination can be applied. This kind of mixing of primary colors is imperfect, but still a representation of the processes described in Section 1, taking place in the human vision apparatus. It seems, therefore, that the evaluation of an image constructed in shades of gray in this way should also take into account the influence of its color on the impressions received by the observer.
The contrast value of the assessed images was determined in accordance with Equation (6):
where:
—column number of the reconstructed image; —number of columns of the reconstructed image ( 0, 1, 2, …, ); —row number (lines) of the reconstructed image; —number of rows (line) of the reconstructed image ( 0, 1, 2, …, ); —value of image pixel amplitude; —maximum value of image pixel amplitude.
The contrast assessment measure used, described by Equation (6), is based on the sum of the values of the differences between adjacent pixels of the image. Its value is therefore influenced by small differences between adjacent pixels. Contrast values were calculated for images reproduced in the color scale of shades of gray for 8-bit color depth and images after performing pseudo-coloring and applying image transformations from the RGB color space to the YUV (color encoding system where Y is a luminance component and U and V are chrominance components, U—blue projection, V—red projection), CIE (color space defined by the Commission Internationale de l’Eclairage), and PAL/SECAM (Phase Alternating Line/Séquentiel Couleur à Mémoire) spaces.
4.2.1. YUV Model
The first model of transformation of the RGB color space, which was used to determine the contrast and assess the effectiveness of pseudo-coloring, was the YUV color space model (Figure 14). The luminance channel Y was used. For this channel, the amplitude values for each pixel are obtained by mixing the primary colors of the pixel of the image saved in the RGB color space in accordance with Equation (11):
where: —component of YUV model.
As a result of the transformation, a matrix of Y-values was obtained, which allowed us to determine the contrast for the pseudo-colored image. The contrast values are to show the correctness of the choice of the color palette in accordance with the proposed method by obtaining higher values compared to the images subjected to coloring for the “Hot” and “Radar” palettes.
4.2.2. CIE RGB Model
The second model of RGB color transformation that was used to show the superiority of the proposed coloring algorithm over coloring using the “Hot” and “Radar” palettes was the CIE RGB model. The transformation is described by Equation (12):
in which is the component of the CIE RGB model.
4.2.3. PAL/SECAM RGB
Another model used in the conducted analyses was the PAL/SECAM RGB model described by Equation (13):
in which is the component of the PAL/SECAM RGB model.
4.3. Visual Assessment–Subjective Assessment
Color vision is in fact a sensation evoked in the brain by nerve impulses in the organ of vision. For this reason, assessments of the same image made by different observers may differ, even significantly. They may depend on age, gender, and health. Nevertheless, subjective assessments made by representative groups of observers are commonly accepted to assess the quality of television, computer, and printing images [30,31]. Therefore, this kind of assessment, albeit in a truncated form, has been included in this paper.
The visual assessment was based on a survey related to the assessment of images presented in Figure 15a,d,f, Figure 16a,d,f, and Figure 17a,d,f. The choice of images was related to their diversity in terms of data content (text, photo) and source processing (VoIP terminal display, HDMI graphics standard), which allow for a general assessment of the coloring algorithm used. The study involved women and men aged 20–63, with a total of 44 people. The survey participants had no previous experience analyzing and evaluating images reproduced from compromising emanation signals. Their task was to assess both the user-friendliness of the color palettes proposed for evaluation and the readability of the images created with their use. The obtained test results (Figure 18, Figure 19 and Figure 20) are presented in the form of graphs, which show the number of individual ratings from 1 to 7 for individual images.
5. Results of Application of Image Pseudo-Coloring
5.1. “Hot” and “Radar” Palette Colors
At the beginning of the analyses, the images presented in Figure 10 were colorized using typical color palettes available in the rasters discussed in Section 2. These palettes are named: “Hot I”, “Hot II”, “Hot III”, “Radar I”, “Radar II”, and “Radar III” (Figure 13a,d). In these cases, the modification of the LUT coefficients concerns only the narrowing of the range of pixel amplitude values for which the reconstructed image can be colored. Other modifications proposed herein (different width of the exponential function building the coefficients of the LUT and different position of on the axis of the pixel amplitudes of the original image, regardless of the color R, G, and B), in relation to the discussed rasters, are not available, which significantly reduces the effectiveness and practicality of using pseudo-coloring in the process of electromagnetic infiltration. The obtained results of using this type of image coloring for a full and limited range of changes in the amplitude values of the pixels that make up the image are shown in Figure 15 and Figure 16.
Figure 15.
The result of applying the pseudo-coloring algorithm to the images shown in: (a) Figure 10a, (b) Figure 10b, (c) Figure 10c, (d) Figure 10d, (e) Figure 10e, (f) Figure 10f, using the “Hot” color palette with the parameters of the exponential function specified in Table 1.

Figure 16.
The result of applying the pseudo-coloring algorithm to the images shown in: (a) Figure 10a, (b) Figure 10b, (c) Figure 10c, (d) Figure 10d, (e) Figure 10e, (f) Figure 10f, using the “Radar” color palette with the parameters of the exponential function specified in Table 2.

The use of typical commercial color palettes of raster generator solutions does not give the expected results in the form of highlighting the sought data and improving their perception. It is necessary, as presented at the beginning of the article, to propose a method that allows changing the parameters of the color palettes used. The process of determining the parameters of the exponential function is not a simple process and requires an individual approach to each analyzed image, as shown in Figure 15 and Figure 16. This is due to the fact that the structures of the reproduced images are not the same. Thus, the values of the amplitudes of the pixels building the sought data are not comparable. In addition, for each image the range of changes in these values is different, which results directly from the impact of Side Channel Attack on the form of the compromising emanations [36,37,38,39,40]. Hence, it is necessary to use pseudo-coloring algorithms, which can also act as filters, allowing for the selection of the data sought.
5.2. Dependence of the Color Palette on the Structure of the Image
Due to the aforementioned variety of structures of reproduced images, one universal form of the exponential function cannot be used to improve their perceptibility. For each image, it is necessary to determine the appropriate parameters , and . The initial assessment of the effectiveness of the proposed pseudo-coloring methods was based on visual analysis, which allowed to assess the perceptual abilities of the data contained in the reproduced images. Then, a mathematical analysis of the contrast ratio of the images obtained after applying the pseudo-coloring algorithm was carried out.
In order to show the need to use pseudo-coloring of the reproduced images in accordance with the adopted methodology for modifying the color palette depending on the properties of the analyzed image, color images (Figure 17) were compared with images obtained for unmodified color palettes (Figure 15 and Figure 16).
![Applsci 13 09496 g017a]()
![Applsci 13 09496 g017b]()
Figure 17.
Images after applying the pseudo-coloring algorithm, color palette, and waveforms of the function for each RGB channel corresponding to images in: (a) Figure 10a, (b) Figure 10b, (c) Figure 10c, (d) Figure 10d, (e) Figure 10e, (f) Figure 10f, for the parameters , and presented in Table 3.


6. Evaluation of the Effectiveness of Using the Pseudo-Coloring Method
6.1. Subjective Assessment-Visual Assessment
The visual assessment of images obtained by using the proposed pseudo-coloring method does not raise any doubts as to its effectiveness. Color images became clearer. They allow you to see more details that were not seen when using the “Hot” and “Radar” palettes. Additionally, the new images are friendlier to analyze. They do not force the user to strain their eyes more, and at the same time there is no noticeable human fatigue with the analysis of the received images, unlike the analysis of images in the form of reconstructed from compromising emanations (grayscale) or after using the “Hot” and “Radar” color palettes.
The results obtained in the survey are presented in Table 4 (Figure 18) for Figure 10b, Table 5 (Figure 19) for Figure 10d, and Table 6 (Figure 20) for Figure 10f.
The subjective assessment carried out shows a very large impact of individual human feelings on the assessment of images. At the same time, it depends on the type of the analyzed image. In each of the analyzed cases, the images obtained as a result of using the coloring algorithm proposed by the authors (“Own”) received the highest marks.
![Applsci 13 09496 g018]()
![Applsci 13 09496 g019]()
![Applsci 13 09496 g020]()
Figure 18.
Perceptual evaluation of images obtained in the process of pseudo-coloring the image from Figure 10a for the “Hot” and “Radar” palettes and proposed by the authors (“Own”): (a) women, (b) men, (c) women and men.
Figure 18.
Perceptual evaluation of images obtained in the process of pseudo-coloring the image from Figure 10a for the “Hot” and “Radar” palettes and proposed by the authors (“Own”): (a) women, (b) men, (c) women and men.

Figure 19.
Perceptual evaluation of images obtained in the process of pseudo-coloring the image in Figure 10d for the “Hot” and “Radar” palettes and the one proposed by the authors (“Own”): (a) women, (b) men, (c) women and men.
Figure 19.
Perceptual evaluation of images obtained in the process of pseudo-coloring the image in Figure 10d for the “Hot” and “Radar” palettes and the one proposed by the authors (“Own”): (a) women, (b) men, (c) women and men.

Figure 20.
Evaluation of the perceptibility of images obtained in the process of pseudo-coloring the image in Figure 10f for the “Hot” and “Radar” palettes and proposed by the authors (“Own”): (a) women, (b) men, (c) women and men.
Figure 20.
Evaluation of the perceptibility of images obtained in the process of pseudo-coloring the image in Figure 10f for the “Hot” and “Radar” palettes and proposed by the authors (“Own”): (a) women, (b) men, (c) women and men.

The exception is the image shown in Figure 10a, for which the rating from the “Men” group for the authors’ algorithm is slightly lower than the image obtained as a result of coloring with the “Radar III” palette.
Due to the small group of observers, the subjective assessment made as part of the survey conducted by the authors should be additionally supported by the objective (analytical) assessment proposed earlier.
6.2. Objective Assessment-Analytical Assessment
The R, G, and B channels correspond to the color values of the individual channels after pseudo-coloring the image using LUTs built on the basis of the exponential function. The obtained contrast values are presented in Table 7 and Figure 21, Figure 22 and Figure 23.
Visual evaluation of the obtained images after the pseudo-coloring process indicated a significant improvement in the perceptibility of the data contained in them. In addition, the RGB color scale images revealed graphical data that were hard to see or invisible (Figure 10b). The confirmation of subjective assessments are the contrast values calculated according to Equation (6). In this case, the contrast values for each image are much higher than for images subjected to pseudo-coloring using “Hot” or “Radar” palettes.
7. Conclusions
The article presents a method of colorization of images obtained in the process of electromagnetic infiltration. In the method for creating LUTs, an exponential function was proposed with parameters that make it possible to change the position of the function course on the axis of pixel amplitude values of the image subjected to colorization and to change its width. Appropriate selection of these parameters makes it possible to expose the appropriate values of the image pixel amplitudes, and thus to highlight the important data contained in the image. At the same time, the introduced colorization allows for the analysis of images without causing user fatigue. The presented method also can be used to analyze medical images for the presentation of poorly visible important elements.
The assessment of the effectiveness of the proposed method was based on visual analysis and contrast analysis of the resulting image. The contrast analysis uses a method based on the amplitude values of adjacent image pixels. Contrast values were calculated for the original images reconstructed in the color scale of shades of gray for 8-bit color depth and images after pseudo-coloring and transformation of the RGB color space into the YUV, CIE, and PAL/SECAM color space. The Y (luminance) channel was used for the calculations. Obtained results show that the proposed exponential function as an element of determination of RGB values is more effective than the typical color palettes “Hot” or “Radar”. Moreover, values of contrast calculated for three models of colors are more useful in the process of the electromagnetic infiltration.
An important solution of the proposed pseudo-coloring method is the possibility of shape selection of exponential function depending on the RGB channel. This means that the shape of the exponential function is a kind of filter that can enhance or attenuate the RGB components of the image.
Further work will focus on three main areas:
- the possibility of using the method in the automation of the image pseudo-coloring process, taking into account the maximization of image contrast;
- analysis of the possibility of using pseudo-coloring of images containing data from several sources of undesirable emissions in the field of data filtration from one source;
- proposals to use other functions (e.g., square or triangular) generating LUT values and comparing their effectiveness.
Author Contributions
Conceptualization, I.K. and A.P.; methodology, I.K. and A.P.; software, I.K.; validation, I.K. and A.P.; formal analysis, A.P.; investigation, I.K. and A.P.; writing—original draft preparation, I.K.; writing—review and editing, A.P.; visualization, I.K.; project administration, I.K. All authors have read and agreed to the published version of the manuscript.
Funding
This research received no external funding.
Institutional Review Board Statement
Not applicable.
Informed Consent Statement
Not applicable.
Data Availability Statement
Not applicable.
Conflicts of Interest
The authors declare no conflict of interest.
References
- MacDonald, L.W. Using color effectively in computer graphics. IEEE Comput. Graph. Appl. 1999, 19, 20–35. [Google Scholar] [CrossRef]
- Murch, G.M. Physiological principles for the effective use of color. IEEE Comput. Graph. Appl. 1984, 4, 48–55. [Google Scholar] [CrossRef]
- Kubiak, I. Influence of the Method of Colors on Levels of Electromagnetic Emissions from Video Standards. IEEE Trans. Electromagn. Compat. 2019, 61, 1129–1137. [Google Scholar] [CrossRef]
- Kubiak, I.; Przybysz, A.; Musial, S. Possibilities of electromagnetic penetration of displays of multifunction devices. Computers 2020, 9, 62. [Google Scholar] [CrossRef]
- Mahshid, Z.; Saeedeh, H.T.; Ayaz, G. Security limits for Electromagnetic Radiation from CRT Display. In Proceedings of the Second International Conference on Computer and Electrical Engineering, Dubai, United Arab Emirates, 28–30 January 2009; pp. 452–456. [Google Scholar]
- Mao, J.; Liu, P.; Liu, J.; Shi, S. Identification of Multi-Dimensional Electromagnetic Information Leakage Using CNN. IEEE Access 2019, 7, 145714–145724. [Google Scholar] [CrossRef]
- Song, T.L.; Jong-Gwan, Y. Study of jamming countermeasure for electromagnetically leaked digital video signals. In Proceedings of the IEEE International Symposium on Electromagnetic Compatibility, Gothenburg, Sweden, 1–4 September 2014. [Google Scholar] [CrossRef]
- Zhang, N.; Lu, Y.; Cui, Q.; Wang, Y. Investigation of unintentional video emanations from a VGA connector in the desktop Computers. IEEE Trans. Electromagn. Compat. 2017, 59, 1826–1834. [Google Scholar] [CrossRef]
- Chen, Y.; Huang, K.; Zhou, Y.; Ma, K.; Jin, H.; Xu, X. Physical Layer Key Generation Scheme through Scrambling the Correlated Eavesdropping Channel. IEEE Access 2020, 8, 48982–48990. [Google Scholar] [CrossRef]
- Aydın, H. TEMPEST Attacks and Cybersecurity. Int. J. Eng. Technol. 2019, 5, 100–104. [Google Scholar]
- Guri, M.; Elovici, Y. Exfiltration of information from air-gapped machines using monitor’s LED indicator. In Proceedings of the 2014 IEEE Joint Intelligence and Security Informatics Conference, Washington, DC, USA, 24–26 September 2014; pp. 264–267. [Google Scholar]
- Kuhn, M.G. Electromagnetic eavesdropping risks of at-panel displays. In Proceedings of the 4th Workshop on Privacy Enhancing Technologies, Toronto, ON, Canada, 26–28 May 2004; pp. 88–105. [Google Scholar]
- Kuhn, M.G. Compromising Emanations: Eavesdropping Risks of Computer Displays; University of Cambridge Computer Laboratory: Cambridge, UK, 2003. [Google Scholar]
- Husien Amer, G.M.; Abushaala, A.M. Edge detection methods. In Proceedings of the 2nd World Symposium on Web Applications and Networking (WSWAN), Sousse, Tunisia, 21–23 March 2015. [Google Scholar] [CrossRef]
- Liu, J.-J.; Hou, Q.; Liu, Z.-A.; Cheng, M.-M. PoolNet+: Exploring the Potential of Pooling for Salient Object Detection. IEEE Trans. Pattern Anal. Mach. Intell. 2023, 45, 887–904. [Google Scholar] [CrossRef]
- Zohaib, H.; Chunyan, W. Edge detection using histogram equalization and multi-filtering process. In Proceedings of the IEEE International Symposium of Circuits and Systems (ISCAS), Rio de Janeiro, Brazil, 15–18 May 2011. [Google Scholar] [CrossRef]
- Zhongshui, Q.; Jianwei, W. A color YUV image edge detection method based on histogram equalization transformation. In Proceedings of the Sixth International Conference on Natural Computation, Yantai, China, 10–12 August 2010. [Google Scholar] [CrossRef]
- Maxwell, M.; Funlade, S.; Lauder, D. Unintentional Compromising Electromagnetic Emanations from IT Equipment: A Concept Map of Domain Knowledge. Procedia Comput. Sci. 2022, 200, 1432–1441. [Google Scholar]
- Boitan, A.; Kubiak, I.; Halunga, S.; Przybysz, A.; Stańczak, A. Method of colors and secure fonts in aspect of source shaping of valuable emissions from projector in electromagnetic eavesdropping process. Symmetry 2020, 12, 1908. [Google Scholar] [CrossRef]
- Kubiak, I.; Loughry, J. LED Arrays of Laser Printers as Valuable Sources of Electromagnetic Waves for Acquisition of Graphic Data. Electronics 2019, 8, 1078. [Google Scholar] [CrossRef]
- Xiaodong, Z.; Chunhua, Z.; Song, L. A perceptive uniform pseudo-color coding method of SAR images. In Proceedings of the CIE International Conference on Radar, Shanghai, China, 16–19 October 2006. [Google Scholar]
- Shi, X.Q.; Sallstrom, P.; Welander, U. A Color Coding Method for Radiographic Images. Image Vis. Comput. 2002, 20, 761–767. [Google Scholar] [CrossRef]
- Fan, J.; Aref, W.G.; Hacid, M. An improved automatic isotropic color edge detection technique. Pattern Recognit. Lett. 2001, 22, 1419–1429. [Google Scholar] [CrossRef]
- Czerwinski, R.N.; Jones, D.L.; O’Brien, W.D. Detection of Lines and Boundaries in Speckle Images—Application to Medical Ultrasound. IEEE Trans. Med. Imaging 1999, 18, 126–136. [Google Scholar] [CrossRef] [PubMed]
- Kuo-Liang, C.; Yan-Cheng, L.; Ching-Sheng, W. Effective Content-Aware Chroma Reconstruction Method for Screen Content Images. IEEE Trans. Image Process. 2019, 28, 1108–1117. [Google Scholar] [CrossRef]
- Kuo-Liang, C.; Tsu-Chun, H.; Chi-Chao, H. Joint Chroma Subsampling and Distortion-Minimization-Based Luma Modification for RGB Color Images with Application. IEEE Trans. Image Process. 2017, 26, 4626–4638. [Google Scholar] [CrossRef]
- Wenhui, W.; Wang, A.; Liu, C. Variational Single Nighttime Image Haze Removal with a Gray Haze-Line Prior. IEEE Trans. Image Process. 2022, 31, 1349–1363. [Google Scholar] [CrossRef]
- Soo-Chang, P.; Jian-Jiun, D. Reversible Integer Color Transform. IEEE Trans. Image Process. 2007, 16, 1686–1691. [Google Scholar] [CrossRef]
- Abidi, B.; Zheng, Y.; Gribok, A.; Abidi, M. Screener Evaluation of Pseudo-Colored Single Energy X-ray Luggage Images. In Proceedings of the 2005 IEEE Computer Society Conference on Computer Vision and Pattern Recognition (CVPR’05), San Diego, CA, USA, 21–23 September 2005. [Google Scholar]
- Wang, Z.; Bovik, A.C.; Sheikh, H.R.; Simoncelli, E.P. Image quality assessment: From error measurement to structural similarity. IEEE Trans. Image Process. 2004, 13, 600–612. [Google Scholar] [CrossRef]
- Zhang, L.; Zhang, L.; Mou, X.; Zhang, D. FSIM: A feature similarity index for image quality assessment. IEEE Trans. Image Process. 2011, 20, 2378–2386. [Google Scholar] [CrossRef] [PubMed]
- Faming, F.; Wang, T.; Wang, Y.; Zeng, T.; Zhang, G. Variational Single Image Dehazing for Enhanced Visualization. IEEE Trans. Multimed. 2020, 22, 2537–2550. [Google Scholar] [CrossRef]
- Panetta, K.; Gao, C.; Agaian, S. No Reference Color Image Contrast and Quality Measures. IEEE Trans. Consum. Electron. 2013, 59, 643–651. [Google Scholar] [CrossRef]
- Kim, M.; Song, K.S.; Kang, M.G. No-Reference Contrast Measurement for Color Images Based on Visual Stimulus. IEEE Access 2018, 6, 23678–23687. [Google Scholar] [CrossRef]
- Bal, A. Comparison of selected contrast evaluation methods of grey level images. PAK 2010, 56, 501–503. [Google Scholar]
- Tanaka, H. Information leakage via electromagnetic emanations and evaluation of tempest countermeasures. In Proceedings of the 3rd International Conference Information Systems Security, New Delhi, India, 16–20 December 2007; pp. 167–179. [Google Scholar]
- Hayashi, Y.-I.; Homma, N.; Watanabe, T.; Price, W.O.; Radasky, W.A. Introduction to the special section on electromagnetic information security. IEEE Trans. Electromagn. Compat. 2013, 55, 539–546. [Google Scholar] [CrossRef]
- Kubiak, I.; Przybysz, A. Fourier and Chirp-Z Transforms in the Estimation Values Process of Horizontal and Vertical Synchronization Frequencies of Graphic Displays. Appl. Sci. 2022, 12, 5281. [Google Scholar] [CrossRef]
- Liu, N.; Zhang, N.; Shao, L.; Han, J. Learning Selective Mutual Attention and Contrast for RGB-D Saliency Detection. IEEE Trans. Pattern Anal. Mach. Intell. 2023, 44, 9026–9042. [Google Scholar] [CrossRef]
- Kubiak, I. The Influence of the Structure of Useful Signal on the Efficacy of Sensitive Emission of Laser Printers. Measurement 2018, 119, 63–74. [Google Scholar] [CrossRef]
Figure 1.
Basic colors.

Figure 2.
The relative sensitivity of the cones of the human eye.

Figure 3.
The method of formation of input channels for LGN.

Figure 4.
Reproduction of the primary colors of white light using the three components of the RGB model.
Figure 4.
Reproduction of the primary colors of white light using the three components of the RGB model.

Figure 5.
Example of (a) an image containing text data reconstructed in electromagnetic infiltration and (b) the same image subjected to pixel amplitude thresholding (pixel amplitude value threshold of 66).
Figure 5.
Example of (a) an image containing text data reconstructed in electromagnetic infiltration and (b) the same image subjected to pixel amplitude thresholding (pixel amplitude value threshold of 66).

Figure 6.
Examples of correlation images created in the process of searching for given patterns in the reconstructed image; correlation images (a,c), the corresponding images obtained as a result of thresholding pixel amplitude values (b,d).
Figure 6.
Examples of correlation images created in the process of searching for given patterns in the reconstructed image; correlation images (a,c), the corresponding images obtained as a result of thresholding pixel amplitude values (b,d).

Figure 7.
Pseudo-coloring process.

Figure 8.
An example of the course of the exponential function with the basic parameters of the function: (a) , , or (b) .
Figure 8.
An example of the course of the exponential function with the basic parameters of the function: (a) , , or (b) .

Figure 9.
Images processed on the primary side, which are the source of compromising emanations: (a) Arial font characters and numbers, (b) Times New Roman letters and numbers, (c) truck image, (d) “Lena” image, (e) the word “protection” in Arial font, and (f) a photo of the inside of an anechoic chamber.

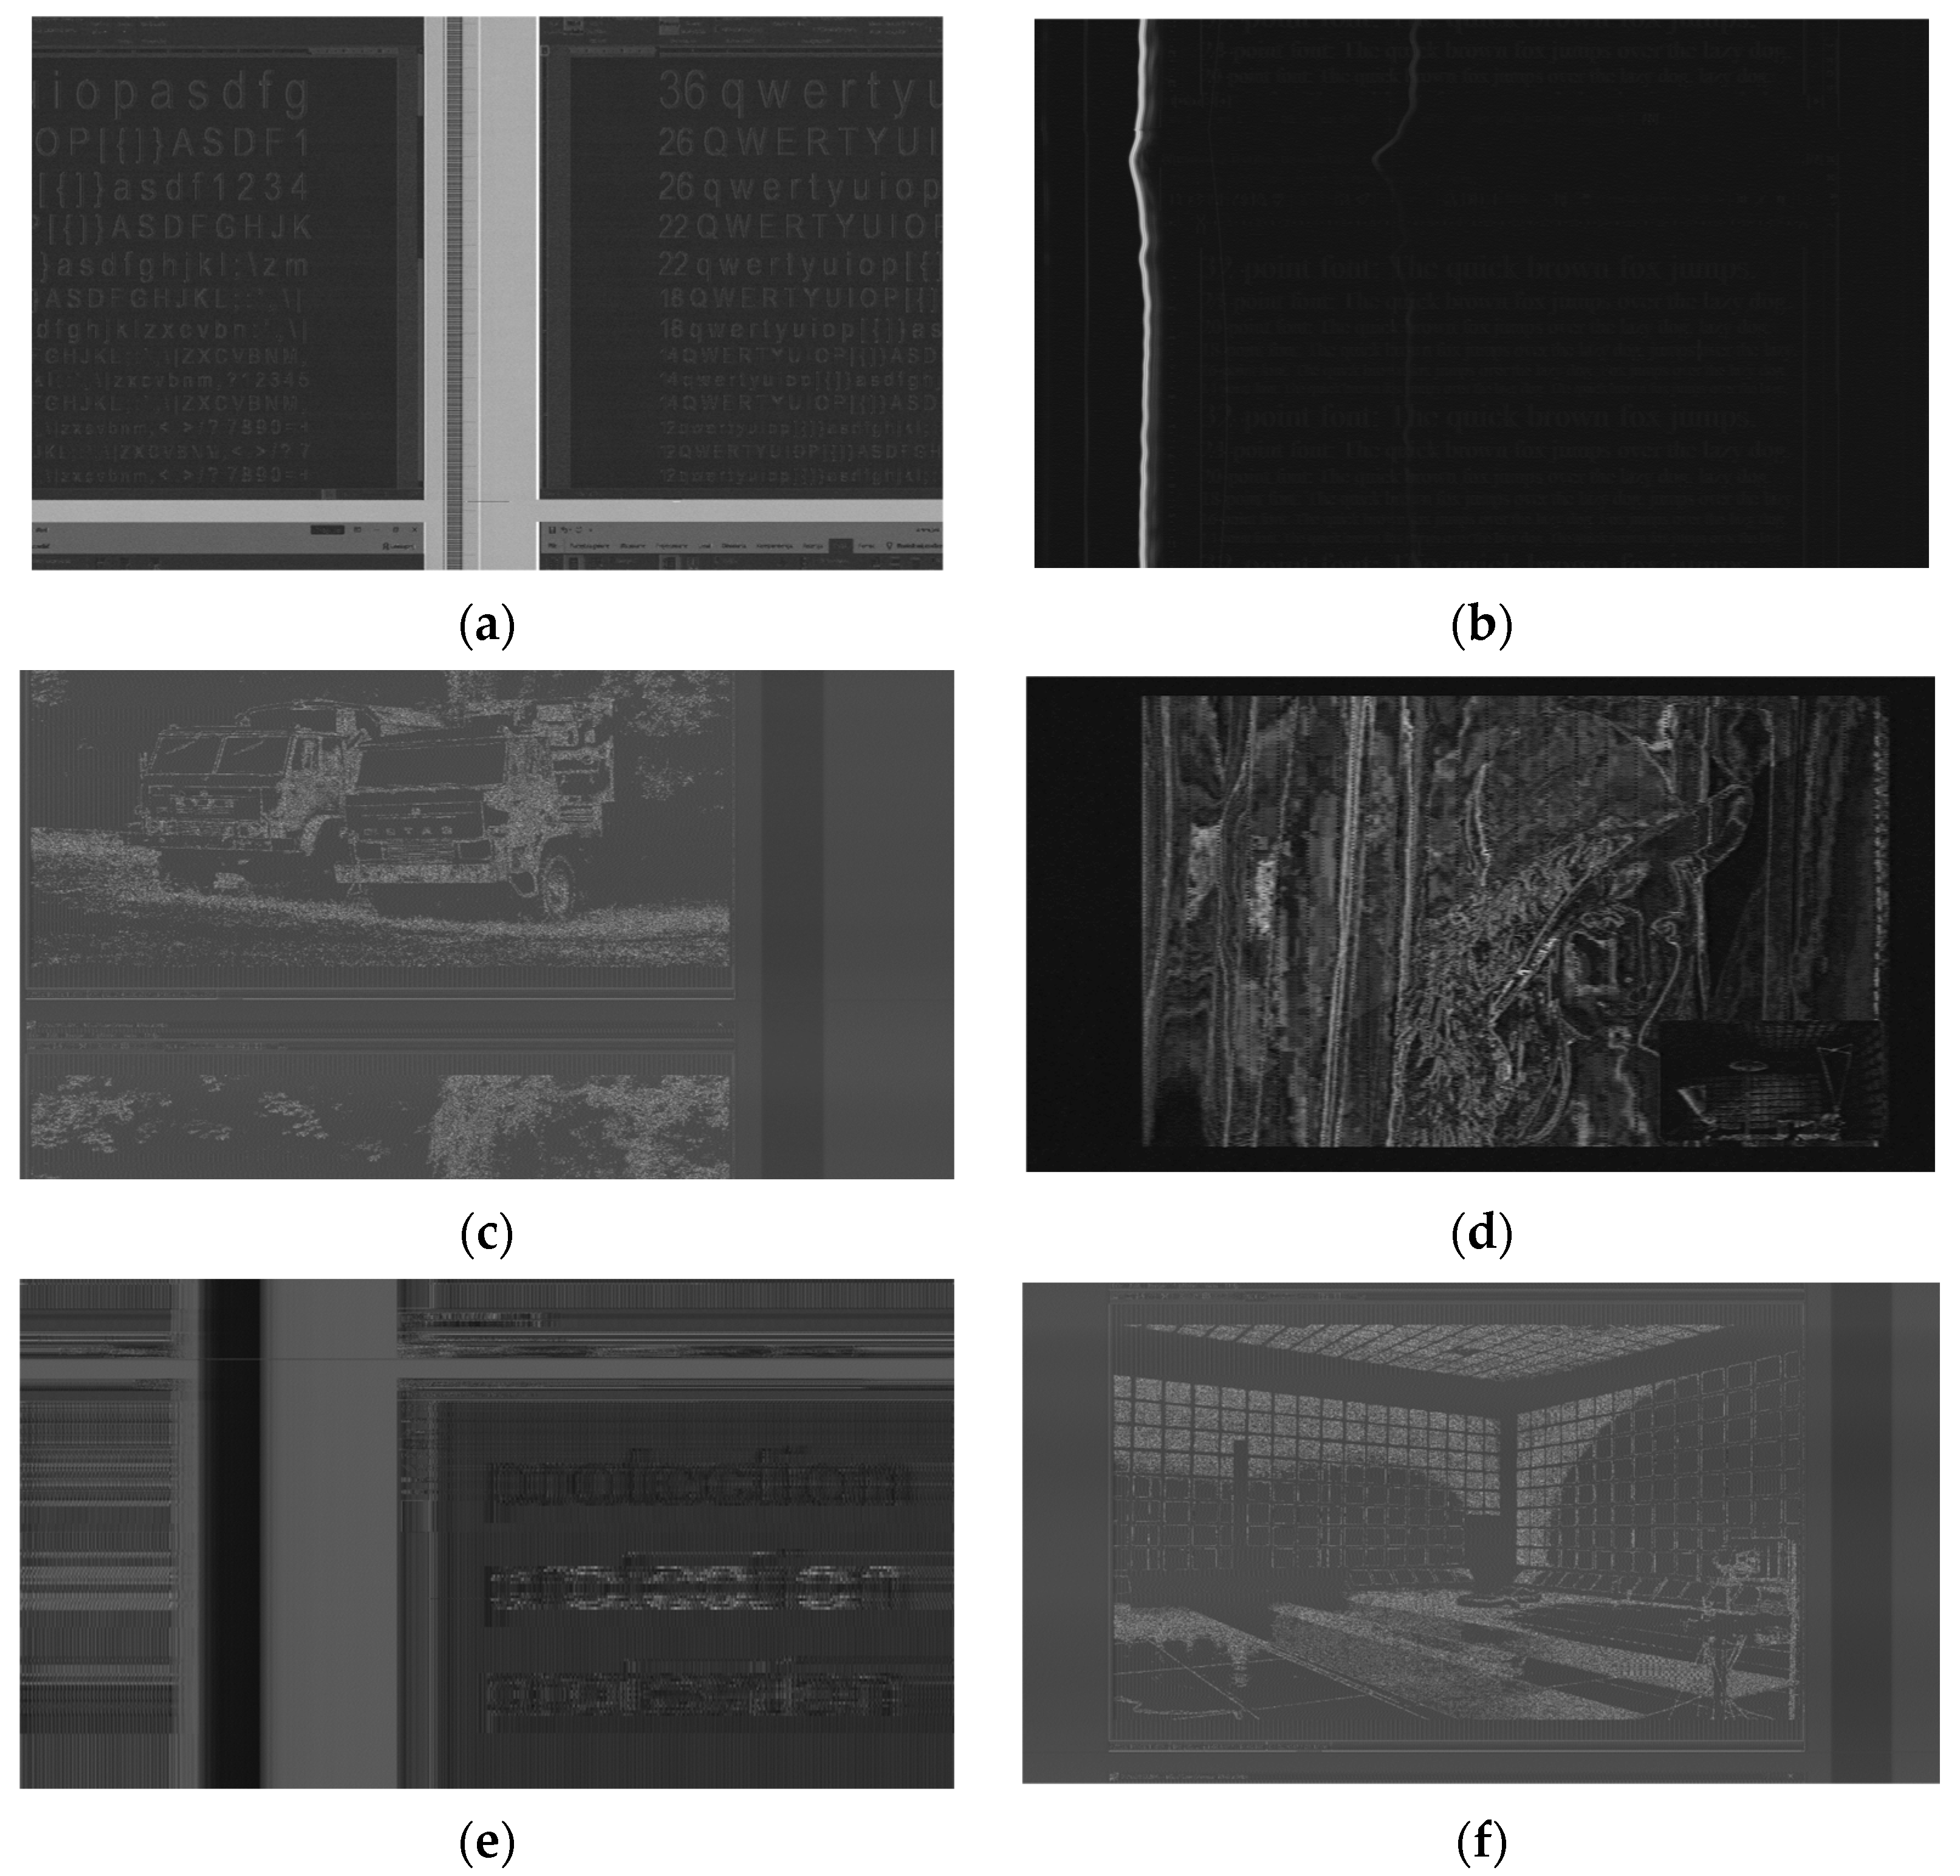
Figure 10.
Examples of analyzed images reconstructed on the basis of registered compromising emanations subjected to the pseudo-coloring process: (a) Acer projector, cooperating computer set 1280 × 1024/60, HDMI graphics standard, reception frequency of the compromising emanations , receiver bandwidth , letters and numbers in Arial font; (b) computer set, 1024 × 768/60, VGA graphics standard, reception frequency of the compromising emanations , receiver band , letters and numbers in Times New Roman font; (c) computer set, standard, 1280 × 1024/60, graphic HDMI, reception frequency of the compromising emanations , receiver band , photo of trucks; (d) VoIP terminal display, reception frequency of the compromising emanations , receiver band , photo showing the “Lena” image; (e) computer set, 1024 × 768/60, HDMI graphics standard, reception frequency of the compromising emanations , receiver band , the word “protection” in Arial font; (f) computer set, standard, 1280 × 1024/60, graphic HDMI, reception frequency of the compromising emanations , receiver band , photo showing the inside of an anechoic chamber.

Figure 11.
Example of exponential function waveforms for RGB channels for different parameters of the function described by relation (1), R channel: , , , , kanał G: , , , , channel B: , , , .
Figure 11.
Example of exponential function waveforms for RGB channels for different parameters of the function described by relation (1), R channel: , , , , kanał G: , , , , channel B: , , , .

Figure 12.
Typical color palettes used in commercial rasters: (a) “Hot I”, (b) “Radar II”.

Figure 13.
Narrowing the range of color variation for the analyzed color palettes: (a) “Hot II”, (b) “Hot III”, (c) “Radar II”, (d) “Radar III”.
Figure 13.
Narrowing the range of color variation for the analyzed color palettes: (a) “Hot II”, (b) “Hot III”, (c) “Radar II”, (d) “Radar III”.

Figure 14.
The process of obtaining images for which the contrast value is calculated according to Equation (6).
Figure 14.
The process of obtaining images for which the contrast value is calculated according to Equation (6).

Figure 21.
Course of normalized contrast values for the YUV model.

Figure 22.
Course of normalized contrast values for the CIE RGB model.

Figure 23.
Course of normalized contrast values for the PAL/SECAM model.


Table 1.
Parameter values of the exponential function for the “Hot” color palette.
| Color Palette | ||||||||||||
|---|---|---|---|---|---|---|---|---|---|---|---|---|
| I | 255 | 128 | 0 | 500 | 500 | 500 | 255 | 255 | 255 | 0 | 0 | 0 |
| II | 168 | 84 | 0 | 330 | 330 | 330 | 255 | 255 | 255 | 0 | 0 | 0 |
| III | 84 | 42 | 0 | 166 | 166 | 166 | 255 | 255 | 255 | 0 | 0 | 0 |
Table 2.
Parameter values of the exponential function for the “Radar” color palette.
| Color Palette | ||||||||||||
|---|---|---|---|---|---|---|---|---|---|---|---|---|
| I | 255 | 150 | 210 | 190 | 390 | 270 | 255 | 255 | 255 | 0 | 0 | 0 |
| II | 168 | 100 | 140 | 125 | 256 | 178 | 255 | 255 | 255 | 0 | 0 | 0 |
| III | 84 | 50 | 70 | 62 | 128 | 90 | 255 | 255 | 255 | 0 | 0 | 0 |
Table 3.
Parameter values of the exponential function for the “Own” color palette.
| Image | Function | |||||||||||
|---|---|---|---|---|---|---|---|---|---|---|---|---|
| Figure 17a | 72 | 70 | 12 | 70 | 80 | 90 | 255 | 255 | 255 | 0 | 0 | 0 |
| Figure 17b | 150 | 26 | 90 | 250 | 14 | 140 | 255 | 255 | 255 | 0 | 0 | 0 |
| Figure 17c | 130 | 120 | 22 | 120 | 146 | 124 | 255 | 255 | 255 | 0 | 0 | 0 |
| Figure 17d | 104 | 96 | 94 | 100 | 110 | 62 | 255 | 255 | 255 | 0 | 0 | 0 |
| Figure 17e | 97 | 30 | 20 | 90 | 46 | 90 | 255 | 255 | 255 | 0 | 0 | 0 |
| Figure 17f | 130 | 120 | 50 | 96 | 130 | 100 | 255 | 255 | 255 | 0 | 0 | 0 |
Table 4.
The results of the survey regarding Figure 10b.
Table 4.
The results of the survey regarding Figure 10b.
| Assessment | Hot III | Radar III | Hot II | Radar II | Hot I | Radar I | Own |
|---|---|---|---|---|---|---|---|
| Women | |||||||
| 1 | 7 | 3 | 4 | 7 | 1 | 1 | 0 |
| 2 | 2 | 6 | 7 | 3 | 1 | 1 | 3 |
| 3 | 2 | 7 | 6 | 4 | 4 | 0 | 0 |
| 4 | 0 | 1 | 1 | 3 | 4 | 10 | 4 |
| 5 | 4 | 5 | 3 | 5 | 3 | 1 | 2 |
| 6 | 6 | 1 | 0 | 1 | 6 | 6 | 3 |
| 7 | 2 | 0 | 2 | 0 | 4 | 4 | 11 |
| Men | |||||||
| 1 | 12 | 1 | 4 | 2 | 1 | 1 | 0 |
| 2 | 1 | 4 | 5 | 1 | 5 | 2 | 3 |
| 3 | 1 | 3 | 4 | 2 | 3 | 5 | 3 |
| 4 | 1 | 1 | 0 | 6 | 0 | 7 | 6 |
| 5 | 0 | 1 | 3 | 8 | 7 | 1 | 1 |
| 6 | 4 | 3 | 3 | 1 | 3 | 5 | 2 |
| 7 | 2 | 8 | 2 | 1 | 2 | 0 | 6 |
| Women and men | |||||||
| 1 | 19 | 4 | 8 | 9 | 2 | 2 | 0 |
| 2 | 3 | 10 | 12 | 4 | 6 | 3 | 6 |
| 3 | 3 | 10 | 10 | 6 | 7 | 5 | 3 |
| 4 | 1 | 2 | 1 | 9 | 4 | 17 | 10 |
| 5 | 4 | 6 | 6 | 13 | 10 | 2 | 3 |
| 6 | 10 | 4 | 3 | 2 | 9 | 11 | 5 |
| 7 | 4 | 8 | 4 | 1 | 6 | 4 | 17 |
Table 5.
The results of the survey regarding Figure 10d.
Table 5.
The results of the survey regarding Figure 10d.
| Assessment | Hot III | Radar III | Hot II | Radar II | Hot I | Radar I | Own |
|---|---|---|---|---|---|---|---|
| Women | |||||||
| 1 | 0 | 2 | 2 | 6 | 9 | 4 | 0 |
| 2 | 20 | 3 | 0 | 0 | 0 | 0 | 0 |
| 3 | 0 | 6 | 6 | 10 | 0 | 1 | 0 |
| 4 | 0 | 0 | 0 | 0 | 7 | 14 | 2 |
| 5 | 1 | 8 | 11 | 2 | 1 | 0 | 0 |
| 6 | 2 | 4 | 3 | 4 | 5 | 4 | 1 |
| 7 | 0 | 0 | 1 | 1 | 1 | 0 | 20 |
| Men | |||||||
| 1 | 0 | 5 | 0 | 4 | 5 | 6 | 0 |
| 2 | 16 | 1 | 1 | 0 | 0 | 2 | 0 |
| 3 | 0 | 4 | 5 | 8 | 2 | 1 | 0 |
| 4 | 1 | 0 | 0 | 1 | 9 | 8 | 1 |
| 5 | 1 | 2 | 12 | 3 | 1 | 0 | 1 |
| 6 | 1 | 8 | 2 | 4 | 2 | 3 | 0 |
| 7 | 1 | 0 | 0 | 0 | 1 | 0 | 18 |
| Women and men | |||||||
| 1 | 0 | 7 | 2 | 10 | 14 | 10 | 0 |
| 2 | 36 | 4 | 2 | 0 | 0 | 2 | 0 |
| 3 | 0 | 10 | 11 | 18 | 2 | 2 | 0 |
| 4 | 1 | 0 | 0 | 1 | 16 | 22 | 3 |
| 5 | 2 | 10 | 23 | 5 | 2 | 0 | 1 |
| 6 | 3 | 12 | 4 | 8 | 7 | 7 | 1 |
| 7 | 1 | 0 | 1 | 1 | 2 | 0 | 38 |
Table 6.
The results of the survey regarding Figure 10f.
Table 6.
The results of the survey regarding Figure 10f.
| Assessment | Hot III | Radar III | Hot II | Radar II | Hot I | Radar I | Own |
|---|---|---|---|---|---|---|---|
| Women | |||||||
| 1 | 0 | 2 | 6 | 2 | 6 | 2 | 1 |
| 2 | 5 | 10 | 2 | 2 | 0 | 0 | 0 |
| 3 | 11 | 6 | 0 | 1 | 1 | 0 | 0 |
| 4 | 2 | 0 | 4 | 8 | 5 | 0 | 0 |
| 5 | 1 | 1 | 7 | 6 | 4 | 0 | 0 |
| 6 | 0 | 0 | 0 | 0 | 3 | 13 | 3 |
| 7 | 0 | 0 | 0 | 0 | 0 | 4 | 15 |
| Men | |||||||
| 1 | 0 | 0 | 3 | 3 | 11 | 5 | 2 |
| 2 | 6 | 14 | 1 | 2 | 0 | 0 | 1 |
| 3 | 17 | 6 | 1 | 0 | 0 | 0 | 0 |
| 4 | 1 | 1 | 7 | 12 | 3 | 0 | 0 |
| 5 | 0 | 3 | 12 | 6 | 3 | 0 | 0 |
| 6 | 0 | 0 | 0 | 1 | 4 | 12 | 7 |
| 7 | 0 | 0 | 0 | 0 | 3 | 7 | 14 |
| Women and men | |||||||
| 1 | 0 | 2 | 9 | 5 | 17 | 7 | 3 |
| 2 | 11 | 24 | 3 | 4 | 0 | 0 | 1 |
| 3 | 28 | 12 | 1 | 1 | 1 | 0 | 0 |
| 4 | 3 | 1 | 11 | 20 | 8 | 0 | 0 |
| 5 | 1 | 4 | 19 | 12 | 7 | 0 | 0 |
| 6 | 0 | 0 | 0 | 1 | 7 | 25 | 10 |
| 7 | 0 | 0 | 0 | 0 | 3 | 11 | 29 |
Table 7.
Values of contrasts for images after applying the pseudo-coloring process, calculated according to relationship (4).
Table 7.
Values of contrasts for images after applying the pseudo-coloring process, calculated according to relationship (4).
| Palette | Hot | Radar | Own | |||||
|---|---|---|---|---|---|---|---|---|
| Image | I | II | III | I | II | III | ||
| Figure 10a | YUV | 0.0026512 | 0.0046064 | 0.0081283 | 0.0036653 | 0.0116501 | 0.0140982 | 0.0497592 |
| CIE | 0.0063892 | 0.0117433 | 0.0249793 | 0.0065622 | 0.0196473 | 0.0098841 | 0.0926253 | |
| PAL/SECAM | 0.0042081 | 0.0076994 | 0.0167582 | 0.0051512 | 0.0155024 | 0.0117261 | 0.0708973 | |
| Figure 10b | YUV | 0.0001632 | 0.0004136 | 0.0005915 | 0.0001939 | 0.0004218 | 0.0021342 | 0.0586026 |
| CIE | 0.0004163 | 0.0010312 | 0.0012912 | 0.0003012 | 0.0005783 | 0.0036233 | 0.1073866 | |
| PAL/SECAM | 0.0002643 | 0.0006762 | 0.0008860 | 0.0002453 | 0.0004874 | 0.0028314 | 0.0834581 | |
| Figure 10c | YUV | 0.0053963 | 0.0035169 | 0.0256489 | 0.0217748 | 0.0237056 | 0.0261622 | 0.0633578 |
| CIE | 0.0123991 | 0.0132530 | 0.0287953 | 0.0376571 | 0.0223081 | 0.0090442 | 0.1292737 | |
| PAL/SECAM | 0.0082621 | 0.0082091 | 0.0259111 | 0.0300141 | 0.0231631 | 0.0141883 | 0.0949992 | |
| Figure 10d | YUV | 0.0360124 | 0.0485077 | 0.0812492 | 0.0553886 | 0.1386344 | 0.2628971 | 0.5413292 |
| CIE | 0.0878611 | 0.1155711 | 0.2158331 | 0.1005231 | 0.2269552 | 0.2313213 | 0.6057037 | |
| PAL/SECAM | 0.0582031 | 0.0760741 | 0.1510181 | 0.0778012 | 0.1834874 | 0.2443833 | 0.5698482 | |
| Figure 10e | YUV | 0.0057972 | 0.0056191 | 0.0208911 | 0.0107352 | 0.0241296 | 0.0339188 | 0.0468369 |
| CIE | 0.0143161 | 0.0127981 | 0.0542322 | 0.0200633 | 0.0401144 | 0.0147353 | 0.0605910 | |
| PAL/SECAM | 0.0094181 | 0.0084561 | 0.0371692 | 0.0153462 | 0.0323634 | 0.0218213 | 0.0530182 | |
| Figure 10f | YUV | 0.0049566 | 0.0035506 | 0.0456015 | 0.0209014 | 0.0226503 | 0.0206359 | 0.0612465 |
| CIE | 0.0112421 | 0.013662 | 0.0603922 | 0.0357751 | 0.0196924 | 0.0070372 | 0.1363647 | |
| PAL/SECAM | 0.0074881 | 0.0083671 | 0.0513624 | 0.0286464 | 0.0211414 | 0.0111823 | 0.0968642 | |
Disclaimer/Publisher’s Note: The statements, opinions and data contained in all publications are solely those of the individual author(s) and contributor(s) and not of MDPI and/or the editor(s). MDPI and/or the editor(s) disclaim responsibility for any injury to people or property resulting from any ideas, methods, instructions or products referred to in the content. |
© 2023 by the authors. Licensee MDPI, Basel, Switzerland. This article is an open access article distributed under the terms and conditions of the Creative Commons Attribution (CC BY) license (https://creativecommons.org/licenses/by/4.0/).
Share and Cite
MDPI and ACS Style
Kubiak, I.; Przybysz, A. Pseudo-Coloring as an Effective Tool to Improve the Readability of Images Obtained in an Electromagnetic Infiltration Process. Appl. Sci. 2023, 13, 9496. https://doi.org/10.3390/app13179496
AMA Style
Kubiak I, Przybysz A. Pseudo-Coloring as an Effective Tool to Improve the Readability of Images Obtained in an Electromagnetic Infiltration Process. Applied Sciences. 2023; 13(17):9496. https://doi.org/10.3390/app13179496
Chicago/Turabian StyleKubiak, Ireneusz, and Artur Przybysz. 2023. "Pseudo-Coloring as an Effective Tool to Improve the Readability of Images Obtained in an Electromagnetic Infiltration Process" Applied Sciences 13, no. 17: 9496. https://doi.org/10.3390/app13179496
Note that from the first issue of 2016, this journal uses article numbers instead of page numbers. See further details here.