Abstract
Current methods for sleep stage detection rely on sensors to collect physiological data. These methods are inaccurate and take up considerable medical resources. Thus, in this study, we propose a Taguchi-based multiscale convolutional compensatory fuzzy neural network (T-MCCFNN) model to automatically detect and classify sleep stages. In the proposed T-MCCFNN model, multiscale convolution kernels extract features of the input electroencephalogram signal and a compensatory fuzzy neural network is used in place of a traditional fully connected network as a classifier to improve the convergence rate during learning and to reduce the number of model parameters required. Due to the complexity of general deep learning networks, trial and error methods are often used to determine their parameters. However, this method is very time-consuming. Therefore, this study uses the Taguchi method instead, where the optimal parameter combination is identified over a minimal number of experiments. We use the Sleep-EDF database to evaluate the proposed model. The results indicate that the proposed T-MCCFNN sleep stage classification accuracy is 85.3%, which is superior to methods proposed by other scholars.
1. Introduction
According to Maslow’s hierarchy of needs, human beings can only fulfill higher-order needs if basic ones are fulfilled [1], and sleep is a key physiological need. In general, good sleep contributes to physical and mental health and emotional stability [2]. Conversely, a lack of sleep can cause health problems, such as cardiovascular disease [3], hypertension [4], and stroke [5].
Researchers have used several methods to improve the automated detection of sleep quality and stage, including polysomnography (PSG), where the individual’s physiological data are recorded. PSG records biological signals through several mechanisms, including electrocardiography, electromyography (EMG), electrooculography (EOG), and electroencephalogram (EEG), with EEG being the most widely used method in the field. Experts require complete and well-defined criteria to conduct sleep stage research. Rechtschaffen and Kales (R&K) proposed criteria for reporting sleep data [6], and although these criteria have not been rigorously validated [7], the American Academy of Sleep Medicine (AASM) improved upon the foundational work of R&K [8], making R&K’s criteria a standard in the medical community. AASM classifies EEG sleep stages through 30-s interval frequency sample recordings. These sleep stages are divided into Wake (W), rapid eye movement (REM), and non-rapid eye movement (NREM). NREM is subdivided into NREM1, NREM2, NREM3, and NREM4 stages that correspond to the shallowest to deepest stages of sleep, respectively. NREM3 and NREM4 have no obvious differences, and they are thus often collectively referred to as slow-wave sleep or deep sleep.
Although scholars have developed a relatively complete sleep stage classification, PSG records are rich with data, and experts have different approaches to signal evaluation [9]. Manual sleep stage classification by experts from PSG records is time-consuming, labor-intensive, and inconsistent, and thus, not a feasible solution. Therefore, automatic sleep stage classification is required.
Many scholars have developed automatic sleep stage classification systems based on machine learning. Machine learning typically involves feature extraction and classification. Phan et al. [10] extracted features from single-channel EEG signals and used the k nearest neighbor algorithm with the Mahalanobis distance for classification. The method performs well in addressing four types of sleep stage problems. Liang et al. [11] extracted 13 features from EEG, EOG, and EMG readings and used fuzzy vector quantization and a genetic algorithm to improve the resolution of a hidden Markov model (HMM). Fraiwan et al. [12] used Hilbert–Huang transform to extract features from the input EEG signal, random forest for classification, Choi-Williams distribution, and continuous wavelet transform. Khalighi et al. [13] used six EEG channels, two EOG channels, and maximal overlap discrete wavelet transformation for feature extraction. They also used a support vector machine to classify the selected features.
Although machine learning methods can solve sleep stage classification problems, feature extraction is performed independently from classification, and thus, is reliant on experts. Deep learning technology, which has been widely used in the medical field for the diagnosis of health problems such as breast cancer [14], epilepsy [15], or arrhythmia [16], can solve several machine learning problems. Deep learning techniques eliminate the need for manual feature extraction. During model training, features are automatically generated according to signals. Khan et al. [17] employed a dilated convolutional neural network and multi-headed attention mechanism for feature extraction. Ishaq et al. [18] extracted features using time series-based Temporal Convolutional Neural (TCN). Other scholars have employed deep learning-based models for sleep stage detection as well. Kanwal et al. [19] used a Fourier transform to convert the original one-dimensional EEG signal into the input data of a convolutional neural network (CNN) in the form of a two-dimensional image. Huang et al. [20] developed a neural network architecture that combined a one-dimensional CNN and HMM. The neural network architecture performed well on Fpz-Cz and Pz-Oz EEG channels. Toma and Choi [21] used the Fpz-Cz channel’s EEG and EOG signals as input for the CNN and a recurrent neural network hybrid model. They evaluated the performance of the model in the Sleep-EDF dataset [22].
Although scholars have used deep learning to solve sleep stage classification problems, their experiments have typically involved the use of a fully connected network (FCN) as a model classifier. FCN, an artificial neural network, relies on non-physically interpretable weight updates through backpropagation. To address this problem, many scholars have introduced fuzzy theory into neural networks (i.e., ANFIS [23] and IT2FNN [24]). FNNs combine neural network architecture with fuzzy logic. They have the neural networks’ parameter learning ability and fuzzy theory’s capability for human-like thinking. FNN can be divided into Mamdani-type FNN [25] and Takagi-Sugeno-Kang (TSK)-type FNN [26]. TSK-type FNNs have better performance than the Mamdani-type FNN [26]. Zhang and Kandel [27] proposed compensatory fuzzy sets to improve the convergence speed and performance of FNNs.
Because deep learning model architectural parameters are obtained through training results (which may rely on academic experience or trial and error), obtaining them can be a time-consuming and costly process. In the field of engineering, Taguchi’s method [28] is often used to improve parameter optimization: it requires minimal experimentation to produce optimal parameters and improve system performance.
In this study, we proposed a Taguchi-based multiscale convolutional compensatory FNN (T-MCCFNN) for the automatic detection and classification of sleep stages, which assists doctors in obtaining patient’s sleep information and identifying sleep problems, such as insomnia. In the proposed T-MCCFNN model, multiscale convolution kernels were used to extract features of the input EEG signal and a compensatory FNN was used as a classifier. Since the parameters of the general deep learning network are not easy to determine, the Taguchi method is used to find the optimal parameter combination with a small number of experiments.
2. Materials and Methods
This section presents the proposed sleep stage detection method. Section 2.1 introduces the proposed T-MCCFNN model. The T-MCCFNN model was employed to classify the EEG signals recorded from the Fpz-Cz channel into five distinct sleep stages: W, REM, N1, N2, and N3. Section 2.2 introduces our use of the Taguchi method to optimize the T-MCCFNN parameters through a minimal number of experiments.
2.1. Proposed T-MCCFNN Model
The proposed T-MCCFNN model includes two parts: a convolutional neural network and a TSK-type compensatory fuzzy neural network. The convolutional neural network uses convolution kernels with different ratios to obtain feature signals of different scales from the input EEG signal. A TSK-type compensatory fuzzy neural network adopts TSK-type fuzzy rules, and increases the convergence speed of network training by compensatory fuzzy sets. The architecture of the T-MCCFNN model is shown in Figure 1, where C and T represent the compensatory operation and the TSK-type fuzzy rule, respectively. The T-MCCFNN model includes a convolutional layer, a max pool layer, a concatenate layer, a global maximum pooling layer, a fuzzified layer, a compensatory rule layer, and an output layer. In the T-MCCFNN model, the operations of each layer are as follows:
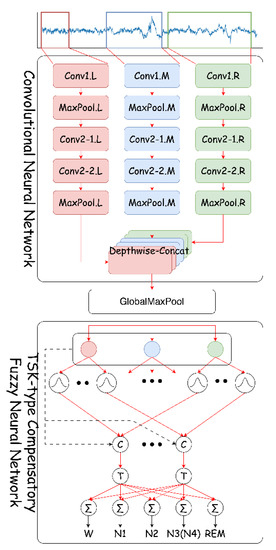
Figure 1.
Architecture of the proposed T-MCCFNN model.
2.1.1. Convolutional Layer
The convolutional layer performs convolution operations. It extracts features from the EEG signal by sliding the convolution kernel. The operation of the convolutional layer is as follows:
where is the output of the convolutional layer, is the input signal, is the convolution operator, is the weight of the convolution kernel, is the size of the convolution kernel, and is the movement pace of the convolution kernel.
2.1.2. Max Pooling Layer
Max pooling layers reduce the output feature maps of convolutional layers, thereby helping the model learn abstract features to improve generalizability. The operation of the maximum pooling layer is as follows:
where f is the index value of the feature map, i is the index of the value in the feature map, mp is the max pooling, is the output of the maximum pooling layer, is the maximum value operator, and is the pooling kernel size.
2.1.3. Concatenate Layer
The concatenate layer concatenates output feature maps from differing sizes along the channel axis of the input features as follows:
where is the output of the concatenate layer, is the concatenation operator, and is the size of the input feature map.
2.1.4. Global Max Pool Layer
To reduce feature maps from the concatenate layers, we used a global max pooling layer to perform the maximum operation on each feature map. The operation of the global max pooling layer is as follows:
where is the output of the local maximum pooling layer.
2.1.5. Fuzzified Layer
In the fuzzified layer, the input data is fuzzified. Fuzzy if–then rules with compensation are used and are expressed as follows:
where is a fuzzy set, is the degree of compensation , is the number of rules, and is the TSK-type fuzzy rule weight. In this study’s method, the Gaussian membership function is used as a fuzzy set , which is defined as follows:
where is the output of the fuzzy layer, is the exponentiation operation, and and represent the mean and standard deviation, respectively, of the fuzzy set .
2.1.6. Compensatory Rule Layer
The compensatory rule layer performs a fuzzy AND operation on the degree of membership obtained from the previous layer operation. We used the product operation to obtain the firing strength fuzzy rule. Additionally, we incorporated a compensatory operation into the rule layer. The compensatory rule layer is governed by the following equation.
2.1.7. Output Layer
The output layer uses the center of gravity method to obtain the T-MCCFNN model output. The output layer is operated according to the following equation:
2.2. Taguchi Method
The Taguchi method is a widely used method in engineering. This method generates an orthogonal array (OA) using control factor selection, level selection, and statistical principles. OA is a high-efficiency technology that improves the effectiveness of experiments and thus reduces the need for extensive experimentation. After the OA experiment was completed, the results were converted to a signal-to-noise (S/N) ratio and used to determine the optimal control factors for improving system stability. In this experiment, we used the Taguchi method to solve the problem of hyperparameters in the neural network.
We found, through previous research experience, that features extracted by the convolutional layer exert a considerable influence on classification results. Therefore, we chose Conv1_filters, Conv1_kernel_size, Conv1_strides, Conv2_filters, Conv2_kernel_size, and Conv2_strides as control factors in our experiments. To improve the diversity of convolutional layers in feature extraction, we used multiscale convolution branches for feature extraction. When more branches are used as control factors, the required number of experiments increases. Therefore, this study used a scale factor to adjust the convolution kernel size of the remaining two branches. Table 1 lists each control factor and its level.

Table 1.
Each control factor and its level.
This experiment used an OA of L27() (as shown in Table 2) based on the seven control factors and three levels (shown in Table 1). The contribution of each control factor and level were calculated after the experiment was completed. An S/N ratio (where larger ratios are preferable) was adopted for evaluation. The S/N ratio is calculated as follows:
where is the number of experiments, represents the accuracy rate obtained in the i-th time, and represents the S/N ratio and its unit in db.
Table 2.
L27() orthogonal array.
3. Experimental Results
We evaluated the proposed T-MCCFNN model on the Sleep-EDF database. We also discussed the Taguchi experiment’s proposed T-MCCFNN model results for comparison and analysis. Finally, we compared the results with other state-of-the-art methods.
3.1. Dataset
This study used the publicly available Sleep-EDF database [22], which was labeled and verified by experts. The database analyzed the sleep data of 20 individuals (10 men and 10 women) between the ages of 25 and 34 years old. The PSG signals in the data set include a horizontal EOG signal, a chin EMG signal, and two EEG signals: the Fpz-Cz channel and the Pz-Cz channel. This experiment adopted the Fpz-Cz location channel (Figure 2). These signals were sampled at a rate of 100 Hz and segmented into 30-s intervals for a total of 3000 sampling points. In addition, the signals in the data set are not scaled or preprocessed. They were then classified into six categories according to R&K’s classification standards: W, N1, N2, N3, N4, and REM. They represent different levels of the patient’s depth of sleep. The amount of data for W, N1, N2, N3, and REM are 8285, 2804, 17,799, 5703, and 7717, respectively. To meet the classification standards of AASM, this experiment combined the two sleep stages of N3 and N4. These recordings included a total of 42,308 signals divided into training data and testing data at a ratio of 7:3.
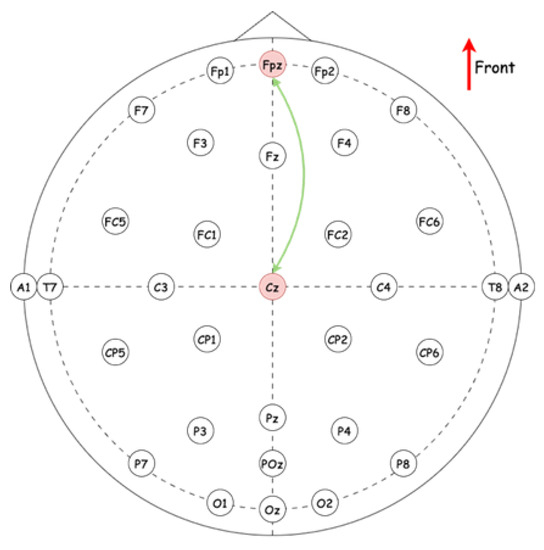
Figure 2.
Fpz-Cz channel location.
3.2. Taguchi Experimental Results
The proposed T-MCCFNN model included a CNN and TSK-type compensatory FNN. The CNN, which used the scale factor to adjust the convolution kernel size of the two remaining convolutional branches, comprised three convolutional layers and two maximum pooling layers. The TSK-type compensatory FNN comprised a fuzzy layer, a compensatory rule layer, and an output layer. The initial parameters of the proposed T-MCCFNN model are depicted in Table 3. The model architecture included many tunable hyperparameters. The Taguchi method was used to find the optimal parameter combination through the use of L27(37), as shown in Table 2. The subsequently generated OA reduced the number of experiments required. In our Taguchi experiment, we selected Adam as our optimizer, a learning rate of 0.001, a batch size of 256, and 50 training epochs. To improve the stability of the Taguchi experiment, we conducted ten experiments for each set of parameter combinations and calculated the average. The results of OA are shown in Table 4.
Table 3.
Initial parameters of the proposed T-MCCFNN model.
Table 4.
Experimental results of OA.
The S/N ratio of each control factor was calculated and used to analyze the contributions of each parameter to model performance. As shown in Table 5, the optimal parameter combinations of Conv1_filters (A), Conv1_kernel_size (B), Conv1_strides(C), Scale (D), Conv2_filters (E), Conv2_kernel_size (F), and Conv2_strides (G) values were 64, 50, 4, 4, 256, 9, and 1, respectively. The control factors with the highest contribution to the model performance were Conv2_strides (G), Conv2_filters (E), and Connv1_strides (C). Thus, changes in stride size tended to affect the performance of the T-MCCFNN model. Figure 3 depicts the main effects on the S/N ratio. In particular, a smaller stride size was associated with a higher S/N ratio for both Conv1_strides (C) and Conv2_strides (G).
Table 5.
S/N ratios of varying parameter combinations.
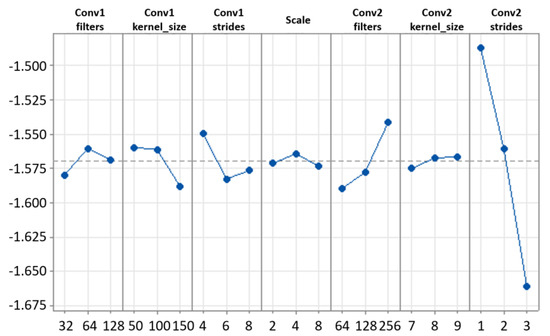
Figure 3.
S/N ratio response graph.
3.3. Model Evaluation
This study used performance metrics of accuracy, precision, recall, and F1-score, which are defined as follows:
where , , , and are the numbers of true positives, false positives, true negatives, and false negatives, respectively.
Figure 4a shows the MCCFNN confusion matrix. Although the model performed poorly in predicting N1, it performed well in predicting W, N2, N3, and REM in terms of accuracy. Figure 4b indicates that the use of T-MCCFNN parameter optimization in the Taguchi experiment yielded improvements in the model’s predictions of W, N3, and REM by 3.02%, 2.98%, and 8.54%, respectively, in terms of accuracy.
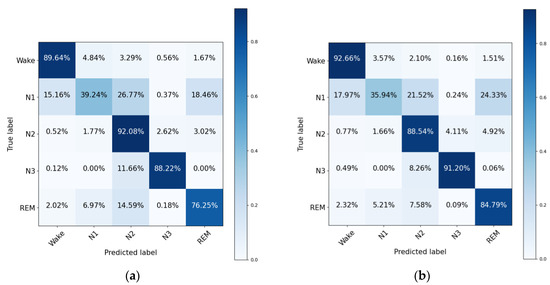
Figure 4.
Confusion matrix of (a) MCCFNN and (b) T-MCCFNN.
The comparison results of the proposed T-MCCFNN with other FNNs are shown in Table 6. In Table 6, MCCNN uses a multi-scale convolution kernel and a fully connected network. A Mamdani-type MCFNN and TSK-type MCFNN use a multi-scale convolution kernel and Mamdani-type and TSK-type FNNs. In Table 6, the accuracy of MCCFNN with TSK-type is 84.4%, which is better than 84.1% of Mamdani-type MCCFNN. After parameter optimization through the Taguchi experiment, T-MCCFNN can increase the accuracy by 0.9% compared to TSK-type MCCFNN, and it is better than other FNNs and fully connected network models. In Table 6, the standard deviation of the accuracy of the proposed T-MCCFNN is 0.0321, which means that the proposed T-MCCFNN model has good robustness and universality in terms of accuracy.
Table 6.
Comparison of results of the proposed T-MCCFNN with other fuzzy neural networks.
In order to verify that the compensatory FNN has a better convergence speed, this study uses MCCFNN to compare it with MCFNN without the compensatory fuzzy set. It can be observed from Figure 5 that MCCFNN tends to converge after nearly 15 epochs. However, MCFNN slowly converges at 25 epochs. The experimental results indicate that the MCCFNN with the compensatory fuzzy set has a better convergence speed than the MCFNN without the compensatory fuzzy set.
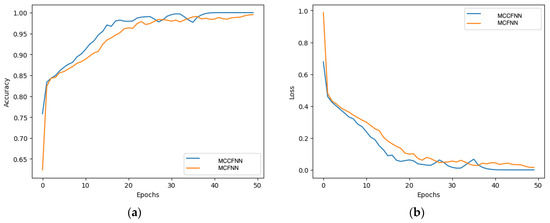
Figure 5.
Comparison of learning curves of MCCFNN and MCFNN. (a) Accuracy (b) Cross-entropy.
In this paper, we use cross-entropy as the loss function, which is defined as follows:
where represents cross-entropy; and represent our model’s prediction and ground truth.
In addition, this study compares the performance of the multi-scale convolution kernel (T-MCCFNN) and the single-scale convolution kernel (T-SSCFNN), as shown in Table 7. In Table 7, the accuracy, recall, precision, and F1-score of T-MCCFNN with multi-scale convolution kernels have higher performance than T-SSCFNN with single-scale convolution kernels. In particular, there is a 1.1% increase in the accuracy of T-MCCFNN.
Table 7.
Performance comparison of the multi-scale and the single-scale convolution kernel.
Table 8 illustrates the comparison of T-MCCFNN with other deep learning methods. Supratak et al. [29] proposed the DeepSleepNet network architecture. This architecture uses a two-branched convolutional layer to extract features from the raw EEG signal, and a two-layer bi-directional long short-term memory (Bi-LSTM) as a classifier. Fiorillo et al. [30] improved the architecture of DeepSleepNet and proposed a DeepSleepNet-lite network architecture. This architecture discards Bi-LSTM, but uses a general fully connected network as the output. Phan et al. [31] proposed that the XSleepNet network architecture is different from [29] and [30]. This architecture uses the original signal and the time-frequency signal as dual inputs to obtain the characteristics of the time-domain signal and the frequency-domain signal. Eldele et al. [32] proposed the multi-resolution convolutional neural network (MRCNN). The architecture of MRCNN introduces an attention mechanism, enabling it to adaptively focus on important information in the signal. Zhou et al. [33] proposed a lightweight LightSleepNet network architecture. This architecture uses a spectrogram as the signal input, and proposes two modules, the concatenation of max-pooling2D and average-pooling2D module and the multi-convolution block module, to extract various features from the spectrogram.
Table 8.
Comparison results of various deep learning methods.
Compared with various deep learning methods, the accuracy and F1-score of the proposed T-MCCFNN are 85.3% and 85.3%, respectively, and both are superior to other deep learning network methods. In Table 8, although the N1 and REM of the per-class F1-score in Phan et al. [31] are 52.9% and 85.4%, respectively, which are better than the proposed method; the W, N2, and N3 of the per-class F1-score in the proposed T-MCCFNN are 92.7%, 88.5%, and 91.2%, respectively, which are better than the method of Phan et al. [31]. Overall, the accuracy and F1-score of the proposed T-MCCFNN are superior to other deep learning network methods.
4. Conclusions
In this study, a T-MCCFNN was proposed for the automatic classification of sleep stage detection. In this study, the Sleep-EDF database was used to verify the performance of the proposed model. The experimental results indicate that the accuracy and F1-score of the proposed T-MCCFNN in sleep stage classification are 85.3% and 85.3%, respectively, which is better than the methods proposed by other methods. In addition, we have also shown that the compensatory FNN has a better convergence speed than the general FNN, and the model with multi-scale convolution kernels has better accuracy, recall, precision, and F1-score than the model with single-scale convolution kernels. The major contributions of this study were as follows:
- Multiscale convolution kernels in the T-MCCFNN model were used to extract input EEG signal features.
- A compensatory FNN was used in place of the traditional FCN classifier to improve the learning convergence speed and reduce model parameters.
- The Taguchi method was used to find the optimal parameter combination through minimal experimentation.
- The experimental results indicate that the accuracy, recall, precision, and F1-score of the proposed T-MCCFNN in sleep stage classification were 85.3%, 83.3%, 87.3%, and 85.3%, respectively, which is superior to the scores of the methods proposed by other scholars.
To detect the patient’s sleep quality in real time, the proposed T-MCCFNN model will be deployed into the Field-Programmable Gate Array (FPGA) in future work. Because FPGA is known for its excellent performance and low power consumption, it is very suitable to be embedded in wearable devices to assist doctors in instantly assessing patients’ sleep quality.
Author Contributions
Conceptualization, C.-J.L. (Cheng-Jian Lin) and X.-Q.L.; Methodology, C.-J.L. (Chun-Jung Lin) and C.-J.L. (Cheng-Jian Lin); Software, C.-J.L. (Chun-Jung Lin) and X.-Q.L.; Validation, C.-J.L. (Chun-Jung Lin); Data curation, X.-Q.L.; Writing—original draft, C.-J.L. (Cheng-Jian Lin). All authors have read and agreed to the published version of the manuscript.
Funding
This research was funded by the Ministry of Science and Technology of the Republic of China, grant number NSTC 112-2221-E-167-026.
Institutional Review Board Statement
Not applicable.
Informed Consent Statement
Not applicable.
Data Availability Statement
The authors confirm that the data supporting the findings of this study are available within the paper.
Conflicts of Interest
The authors declare no conflict of interest.
References
- Maslow, A. A Theory of Human Motivation. Psychol. Rev. 1943, 50, 370–396. [Google Scholar] [CrossRef]
- Pilcher, J.; Ginter, D.; Sadowsky, B. Sleep Quality Versus Sleep Quantity: Relationships Between Sleep and Measures of Health Well-Being and Sleepiness in College Students. J. Psychosom. Res. 1997, 6, 583–596. [Google Scholar] [CrossRef] [PubMed]
- Schwartz, S.; Anderson, W.M.; Cole, S.R.; Cornoni-Huntley, J.; Hays, J.C.; Blazer, D. Insomnia and Heart Disease: A Review of Epidemiologic Studies. J. Psychosom. Res. 1999, 4, 313–333. [Google Scholar] [CrossRef] [PubMed]
- Bruno, R.M.; Palagini, L.; Gemignani, A.; Virdis, A.; Giulio, A.D.; Ghiadoni, L.; Riemann, D.; Taddei, S. Poor Sleep Quality and Resistant Hypertension. Sleep Med. 2013, 11, 1157–1163. [Google Scholar] [CrossRef]
- Wallace, D.M.; Ramos, A.R.; Rundek, T. Sleep Disorders and Stroke. Int. J. Stroke 2012, 3, 231–242. [Google Scholar] [CrossRef]
- Rechtschaffen, A.; Kales, A. A Manual of Standardized Terminology, Techniques and Scoring System for Sleep Stages of Human Subjects. Clin. Neurophysiol. 1969, 2, 246–247. [Google Scholar]
- Himanena, S.L.; Hasan, J. Limitations of Rechtschaffen and Kales. Sleep Med. Rev. 2004, 2, 149–167. [Google Scholar] [CrossRef]
- Iber, C. The AASM Manual for the Scoring of Sleep and Associated Events: Rules Terminology and Technical Specifications; American Academy of Sleep Medicine: Westchester, IL, USA, 2007. [Google Scholar]
- Alickovic, E.; Subasi, A. Ensemble SVM Method for Automatic Sleep Stage Classification. IEEE Instrum. Meas. 2018, 6, 1258–1265. [Google Scholar] [CrossRef]
- Phan, H.; Do, Q.; Do, T.L.; Vu, D.L. Metric Learning for Automatic Sleep Stage Classification. In Proceedings of the 35th Annual International Conference of the IEEE EMBS, Osaka, Japan, 3–7 July 2013; pp. 5025–5028. [Google Scholar]
- Liang, S.F.; Chen, C.F.; Zeng, J.H.; Pan, S.T. Application of Genetic Algorithm and Fuzzy Vector Quantization on EEG-Based Automatic Sleep Staging by Using Hidden Markov Model. In Proceedings of the 2014 International Conference on Machine Learning and Cybernetics, Lanzhou, China, 13–16 July 2014; pp. 567–572. [Google Scholar]
- Fraiwan, L.; Lweesy, K.; Khasawneh, N.; Wenz, H.; Dickhaus, H. Automated Sleep Stage Identification System Based on Time-Frequency Analysis of A Single EEG Channel and Random Forest Classifier. Comput. Methods Programs Biomed. 2012, 1, 10–19. [Google Scholar] [CrossRef]
- Khalighi, S.; Sousa, T.; Oliveira, D.; Pires, G.; Nunes, U. Efficient Feature Selection for Sleep Staging Based on Maximal Overlap Discrete Wavelet Transform and SVM. In Proceedings of the 2011 Annual International Conference of the IEEE Engineering in Medicine and Biology Society, Boston, MA, USA, 30 August–3 September 2011; pp. 3306–3309. [Google Scholar]
- Wang, Z.; Li, M.; Wang, H.; Jiang, H.; Yao, Y.; Zhang, H.; Xin, J. Breast Cancer Detection Using Extreme Learning Machine Based on Feature Fusion with CNN Deep Features. IEEE Access 2019, 7, 105146–105158. [Google Scholar] [CrossRef]
- Sun, M.; Wang, F.; Min, T.; Zang, T.; Wang, Y. Prediction for High Risk Clinical Symptoms of Epilepsy Based on Deep Learning Algorithm. IEEE Access 2018, 6, 77596–77605. [Google Scholar] [CrossRef]
- Hammad, M.; Iliyasu, A.M.; Subasi, A.; Ho, E.S.L.; El-Latif, A.A.A. A Multitier Deep Learning Model for Arrhythmia Detection. IEEE Trans. Instrum. Meas. 2021, 70, 3033072. [Google Scholar] [CrossRef]
- Khan, M.; Saddik, A.E.; Alotaibi, F.S.; Pham, N.T. AAD-Net: Advanced end-to-end signal processing system for human emotion detection & recognition using attention-based deep echo state network. Knowl.-Based Syst. 2023, 270, 110525. [Google Scholar]
- Ishaq, M.; Khan, M.; Kwon, S. TC-Net: A Modest & Lightweight Emotion Recognition System Using Temporal Convolution Network. Comput. Syst. Sci. Eng. 2023, 46, 3355–3369. [Google Scholar]
- Kanwal, S.; Uzair, M.; Ullah, H.; Khan, S.D.; Ullah, M.; Cheikh, F.A. An image based prediction model for sleep stage identification. In Proceedings of the 2019 IEEE International Conference on Image Processing (ICIP), Taipei, Taiwan, 22–25 September 2019; pp. 1366–1370. [Google Scholar]
- Huang, J.; Ren, L.; Zhou, X.; Yan, K. An Improved Neural Network Based on SENet for Sleep Stage Classification. IEEE J. Biomed. Health Informat. 2022, 10, 4948–4956. [Google Scholar] [CrossRef]
- Toma, T.I.; Choi, S. An End-to-End Convolutional Recurrent Neural Network with Multi-Source Data Fusion for Sleep Stage Classification. In Proceedings of the 2023 International Conference on Artificial Intelligence in Information and Communication (ICAIIC), Bali, Indonesia, 20–23 February 2023; pp. 564–569. [Google Scholar]
- Kemp, B.; Zwinderman, A.H.; Tuk, B.; Kamphuisen, H.A.C.; Oberye, J.J.L. Analysis of A Sleep-Dependent Neuronal Feedback Loop: The Slow-Wave Microcontinuity of The EEG. IEEE Trans. Biomed. Eng. 2000, 9, 1185–1194. [Google Scholar] [CrossRef]
- Jang, J.S.R. ANFIS: Adaptive-Network-Based Fuzzy Inference System. IEEE Trans. Syst. Man Cybern. 1993, 3, 665–685. [Google Scholar] [CrossRef]
- Limei, W.; Zongxue, Z.; Xiaoying, L. The IT2FNN Synchronous Control for H-Type Gantry Stage Driven by Dual Linear Motors. In Proceedings of the 2017 29th Chinese Control And Decision Conference (CCDC), Chongqing, China, 28–30 May 2017; pp. 4716–4721. [Google Scholar]
- Mamdani, E.H.; Assilian, S. An Experiment in Linguistic Synthesis with A Fuzzy Logic Controller. Int. J. Man-Mach. Stud. 1975, 1, 1–13. [Google Scholar] [CrossRef]
- Takagi, T.; Sugeno, M. Fuzzy Identification of Systems and Its Applications to Modeling and Control. IEEE Trans. Syst. Man Cybern. 1985, 1, 116–132. [Google Scholar] [CrossRef]
- Zhang, Y.Q.; Kandel, A. Compensatory Neurofuzzy Systems with Fast Learning Algorithms. IEEE Trans. Neural Netw. 1998, 1, 83–105. [Google Scholar] [CrossRef]
- Karna, S.K.; Sahai, R. An Overview on Taguchi Method. Int. J. Eng. Math. Sci. 2012, 1, 1–7. [Google Scholar]
- Supratak, A.; Dong, H.; Wu, C.; Guo, Y. DeepSleepNet: A Model for Automatic Sleep Stage Scoring Based on Raw Single-Channel EEG. IEEE Trans. Neural Syst. Rehabil. Eng. 2017, 11, 1998–2008. [Google Scholar] [CrossRef] [PubMed]
- Fiorillo, L.; Favaro, P.; Faraci, F.D. DeepSleepNet-Lite: A Simplified Automatic Sleep Stage Scoring Model with Uncertainty Estimates. IEEE Trans. Neural Syst. Rehabil. Eng. 2021, 29, 2076–2085. [Google Scholar] [CrossRef] [PubMed]
- Phan, H.; Chén, O.Y.; Tran, M.C.; Koch, P.; Mertins, A.; Vos, M.D. XSleepNet: Multi-View Sequential Model for Automatic Sleep Staging. IEEE Trans. Pattern Anal. Mach. Intell. 2022, 9, 5903–5915. [Google Scholar] [CrossRef] [PubMed]
- Eldele, E.; Chen, Z.; Liu, C.; Wu, M.; Kwoh, C.-K.; Li, X.; Guan, C. An Attention-Based Deep Learning Approach for Sleep Stage Classification with Single-Channel EEG. IEEE Trans. Neural Syst. Rehabil. Eng. 2021, 29, 809–818. [Google Scholar] [CrossRef] [PubMed]
- Zhou, D.; Xu, Q.; Wang, J.; Zhang, J.; Hu, G.; Kettunen, L.; Chang, Z.; Cong, F. LightSleepNet: A Lightweight Deep Model for Rapid Sleep Stage Classification with Spectrograms. In Proceedings of the 2021 43rd Annual International Conference of the IEEE Engineering in Medicine & Biology Society (EMBC), Mexico City, Mexico, 1–5 November 2021; pp. 43–46. [Google Scholar]
Disclaimer/Publisher’s Note: The statements, opinions and data contained in all publications are solely those of the individual author(s) and contributor(s) and not of MDPI and/or the editor(s). MDPI and/or the editor(s) disclaim responsibility for any injury to people or property resulting from any ideas, methods, instructions or products referred to in the content. |
© 2023 by the authors. Licensee MDPI, Basel, Switzerland. This article is an open access article distributed under the terms and conditions of the Creative Commons Attribution (CC BY) license (https://creativecommons.org/licenses/by/4.0/).