
Experimental Study on Properties of Syngas, Tar, and Biochar Derived from Different Gasification Methods

State Key Laboratory of Multiphase Flow in Power Engineering, School of Energy and Power Engineering, Xi’an Jiaotong University, Xi’an 710049, China
*
Author to whom correspondence should be addressed.
Appl. Sci. 2023, 13(20), 11490; https://doi.org/10.3390/app132011490
Submission received: 13 September 2023
/
Revised: 11 October 2023
/
Accepted: 18 October 2023
/
Published: 20 October 2023
(This article belongs to the Topic Advances in Renewable Energy Technologies and Systems Solutions)
Abstract
:Biomass gasification technology is a clean and renewable energy utilization approach. Understanding the evolution of gasification product properties is crucial to achieving carbon neutrality goals. A fixed-bed reactor is employed for the biomass gasification with CO2 in this study. Various methodologies have been conducted to characterize the syngas, tar, and biochar produced from the electric gasification (EG) and microwave gasification (MG) of oak and corn stalk samples at different temperatures. When gasifying the same biomass at the same temperature, the syngas yield of MG is generally 3–7% higher than that of EG, and the difference increases with decreasing temperature. The biochar yield of MG is 3–6% higher than that of EG. EG produces more tar at 600–800 °C. The yield of syngas increases as the gasification temperature rises from 600 to 1000 °C, but that of tar and biochar falls. The syngas mainly comprises H2, CH4, CO, and CO2. MG produces 8–15% higher CO content and 2.5–3.5% higher H2 content than EG. This is due to different heating mechanisms. The net calorific value of syngas increases with temperature, reaching a maximum of 11.61 MJ m−3 at 1000 °C for syngas from corn stalk MG. When the temperature rises from 600 to 1000 °C, more primary tars are converted into polycyclic aromatic hydrocarbons (PAHs). At 900 °C, corn stalk biochar from MG has a maximum specific total pore volume (0.62 cm3 g−1), surface area (525.87 m2 g−1), and average pore diameter (4.18 nm). The intensities of the characteristic peaks of biochar functional groups decrease gradually. The heating method has little effect on the types of functional groups.
1. Introduction
Energy shortage and air pollution are two severe problems worldwide in recent years. Non-renewable energy resources and fossil-based fuels currently fulfill over 80% of the energy demand [1]. The overconsumption of fossil fuels is accompanied by a great degree of CO2 emission. Much evidence demonstrated that CO2 emission contributes to the greenhouse effect, which could be one of the reasons for global climate change.
Compared with conventional fossil fuels, the renewable energy resources could provide sustainable energy in the future due to their extensive reserves, low emissions, and renewability [1,2,3]. Biomass is a carbon-neutral energy source [4]. Biomass resources are abundant and have been extensively studied to offer sustainable and environmentally friendly energy and fuels for future applications [5,6,7]. Employing different heating methods and catalysts during the biomass gasification could effectively increase the syngas yield and reduce the generation of harmful tars. Microwave heating could improve the syngas yield, reduce the hazardous product formation, and minimize the emission pollutants [8,9,10,11]. Additionally, microwave gasification produces biochar with a richer microporous structure, which could be employed for atmospheric carbon capture, storage, and climate change mitigation [12]. Physical, biochemical, and thermochemical conversions comprise most biomass conversions and utilization techniques [13]. Biomass thermochemical conversion technology is extensively employed. This technology has emerged as a prominent area of focus in biomass energy research [14]. The predominant thermochemical conversion methodologies commonly employed for biomass are combustion, pyrolysis, and gasification [15,16]. Biomass gasification technology is widely regarded as a highly promising approach due to its versatility in accommodating diverse biomass feedstocks, as well as its superior efficiency and reduced environmental impact [14,17]. Gasification is the process of converting hydrocarbons in biomass into high-grade syngas using gasification agents such as air, oxygen, and carbon dioxide. Biomass gasification with CO2 has the advantage of reducing the atmospheric CO2 emissions and converting CO2 in the environment into CO. CO2 gasification technology is important for the waste gasification and converting low-quality fuels into high-quality syngas.
Biomass gasification with CO2 consists of four stages, including drying, pyrolysis, oxidation, and reduction. At 105–300 °C, the water (extrinsic and intrinsic) in the biomass gradually releases out, yielding the dry material and water vapor. When the gasification temperature reaches 300 °C, the volatile matter in the biomass begins to release. At 400 °C, the biomass releases about 70% of the volatile matter. During the pyrolysis stage, the products are CO2, CH4, H2, CO, tar, a few hydrocarbons, and semi-coke. The temperature range of pyrolysis is about 300 to 600 °C.
The products of the biomass pyrolysis stage occur with the agent to produce H2O, CO2, and CO. A large amount of heat is generated along with the oxidation reaction. The main reactions in the oxidation stage are as follows:
At 700–900 °C, the oxidized products of the previous stage continue to undergo a reduction, producing small molecules of combustible gases such as CH4, H2, and CO, which is a heat-absorbing reaction.
The oxidation and reduction phases are both referred to as biomass gasification. The liquid-phase tar generated from the biomass gasification also undergoes further reforming and cracking to produce some small molecule components. In addition, CO2 could react with the tar produced, as shown in Equation (11), promoting its cracking to yield H2 and CO. Moreover, the tar can be directly cracked to release H2, as shown in (12).
Syngas could replace some fossil fuels for power and heat generation. However, char and undesired tar are produced along with the syngas. Tar is a fluid combination of dense and viscous heavy aromatics. Tar could lead to a reduction in the calorific value of the syngas, slagging and corrosion of the heating surfaces, and catalyst deactivation [18,19,20,21,22,23,24]. In addition, numerous studies have provided evidence regarding the capacity of biochar to sequester carbon, soil fertility enhancement and stabilization, and wastewater and gas adsorption [25,26,27,28,29].
The properties of the products obtained via different heating methods vary considerably. Electric and microwave heating have been studied [30,31,32]. In contrast to electric heating methods, which rely on the conduction of heat from the surface to the core of a material through the temperature gradients, microwave heating operates by converting electromagnetic energy directly into heat at the molecular level [33]. The utilization of microwave heating demonstrates a rapid heating rate and the advantages of volumetric and uniform heat distribution. Many studies have reported that secondary cracking reactions are promoted in microwave pyrolysis [34,35]. More syngas and less tar are produced for microwave gasification than other conventional gasification under the comparable conditions [34,36,37,38]. Syngas from gasification could be applied in heat and power production and as feedstock for the synthesis of fuels. Tar could be highly toxic to the atmosphere and the environment. These characteristics contribute to reducing potentially harmful product formation and mitigating emission pollutants, thereby establishing the technique as environmentally sustainable [8,9,10,11]. Some researchers have already conducted gasification experiments using electric heating methods on biomass in fixed-bed systems [39,40,41]. Furthermore, many articles have been published regarding microwave pyrolysis on biomass, focusing on analyzing syngas and biochar properties [11,42,43,44,45,46,47,48]. There have been notable advancements in the utilization of microwave heating compared to conventional heating methods, and significant strides have been made in the field of biomass pyrolysis. There remains a lack of research about the application of microwave technology in biomass gasification. In previous studies on the MG of biomass, the components of syngas and tar were mostly characterized, but few articles were reported about the properties of biochar. Less work compares EG and MG at the same time. In this study, syngas, tar, and biochar properties are characterized in detail through the experimental study of two different biomass samples under EG and MG. Compared with EG, MG has obvious advantages in producing syngas and microporous biochar. This study provides effective data support for the practical application of biomass gasification.
In this study, electric and microwave heating gasification experiments with CO2 are conducted on corn stalk and oak in a fixed-bed reactor. Gasification of biomass with CO2 can effectively reduce the emission of CO2. The effects of the gasification method and temperature on the properties of three-phase products are investigated. Gas chromatography (GC) is employed to detect the components and calorific value of the syngas. Gas chromatography–mass spectrometry (GC-MS) is employed to characterize the components of the tar. Fourier transform infrared spectrometer (FTIR) and X-ray photoelectron spectroscopy (XPS) are applied to study the evolution of the functional groups and the content of the elements on the surface of the biochar, respectively. The analysis of the surface morphology and pore structure of the biochar is conducted via Scanning Electron Microscopy coupled with Energy Dispersive Spectrometer (SEM-EDS) and a specific surface area analyzer based on the BET method. The results indicate that the microwave gasification could produce more syngas to compensate for the energy shortages. The biochar obtained from the microwave gasification is an attractive absorbent for CO2 capture due to its microporous nature.
2. Experimental Section
2.1. Raw Material
The biomass samples employed in this study are corn stalk (herbaceous biomass from the rural areas of Xi’an, Shaanxi Province, China) and white oak (woody biomass from Europe). The biomass is crushed into powder using a crusher and sieved to 100–250 μm. The proximate and ultimate analyses of the biomass are listed in Table 1. The ash content of oak (32.65%) is much higher than that of corn stalk (8.80%). The fixed carbon content of corn stalk (17.49%) is relatively lower. The contents of volatile matter in oak and corn stalk are both higher than 50%. The carbon content of corn stalk (40.34%) is higher. The ash compositions are listed in Table 2. Corn stalk and oak mainly comprise cellulose, hemicellulose, and lignin. Cellulose is a linear polymer of cellulose diose monomer, and the monomer is composed of two β-glucopyranose units. In contrast, the precursors of lignin are three hydroxycinnamyl alcohols, which consist of benzene rings [49]. Table 3 shows the chemical content of biomass samples.
2.2. Experimental System and Procedure
The gasification experiment for biomass is conducted in a fixed-bed reactor. Figure 1 shows a schematic diagram of the experimental system, which consists of four parts, including agent supply, biomass gasification, tar separation, and gas collection. CO2 is supplied to the gasification system at a flow rate of 250 mL min−1 through a pressure-reducing valve from a gas cylinder. The gasification system consists of the EG system and the MG system. The main part of the EG system is the electrically heated tube furnace (SZGL-1200, Jvjing, Shanghai, China). It consists of a quartz tube reactor with an inner diameter of 50 mm, a thermocouple, and a quartz hanging basket. The length of the heating part is 410 mm, and 1200 °C is the maximum heating temperature. The microwave heating gasification system mainly comprises a microwave gasification stove (CY-PY1100C-S, Changyi, Hunan, China). Inside is a quartz furnace tube with a length of 750 mm and a wall thickness of 3 mm. The length of the microwave heating section is 150 mm. The gas collection system consists of gas-washing bottles and a gas collection bag. The gaseous products are removed from the reactor via gas flow. The condensable constituents are initially rapidly cooled and isolated within a cold-water bath, subsequently absorbed using gas-washing bottles containing chromatographically pure isopropanol and desiccated silicone. Before the experiment, the valve of the CO2 cylinder is opened after checking the gas tightness of the device, and CO2 of 150 mL min−1 goes through the quartz tube for 30 min to remove air from tube. The gasification temperature is set to a predetermined temperature (600–1000 °C) on the temperature controller of the electric heating furnace or microwave heating furnace. When the predetermined temperature is reached, the CO2 valve is opened with 250 mL min−1. The gasification experiments are performed for 25 min. After the quartz tube is cooled to room temperature, the biochar samples are removed and weighed. An analytically pure ethanol solution is chosen to dilute the concentrated tar samples at a volume ratio of 1:100 to obtain the test samples. Anhydrous sodium sulfate is applied to remove any water that may be present in the tar sample. After standing, the concentrate is further concentrated through rotary evaporation and filtered. A 45 µm organic needle filter (with a disposable syringe) is employed to prevent contamination of the column by impurities. Then, the solution to be measured is filled into a 1.5 mL injection bottle and sent to the gas chromatography–mass spectrometry (GC-MS) instrument for the detection and analysis of the test results. The water bath is heated to about 95 °C in the rotary evaporator. The isopropanol is evaporated by the heat and condensed by the cold to achieve separation from the tar. The weight method determines the mass of liquid products collected in the gas-washing bottles. At the same time, the gas component analysis is applied to obtain the mass of the main gas products. The gasification process is carried out at temperatures ranging from 600 to 1000 °C and lasts 25 min. All the gasification experiments are repeated in triplicate to ascertain repeatability.
2.3. Products Analysis
GC (2014, Shimazu Corporation, Kyoto, Japan) and GC-MS (Trace ISQ, Thermo Fisher, Waltham, MA, USA) are employed to analyze the gaseous and liquid products derived from the biomass gasification. The temperature of the inlet is 260 °C. The initial temperature of the furnace is 50 °C, and the furnace is kept on for 5 min, then increased to 300 °C at a rate of 5 °C min−1, and kept on for 10 min. The shunt ratio is 9:1. The carrier gas is helium at a carrier gas rate of 1.0 mL min−1. The surface morphology and pore structure of biochar samples are examined via SEM-EDS (SU3500, Hitachi, Kyoto, Japan). XPS (Thermo Fisher ESCALAB Xi+, Waltham, MA, USA) and FTIR (Nicolet 6700, Thermo Fisher, Waltham, MA, USA) are employed to detect the surface groups, elemental composition, and surface functional groups of biomass samples. The instrument scans waves of 400–4000 cm−1 with a resolution of 4 cm−1 and a scan count of 32. Additionally, a specific surface area analyzer (V-Sorb2800P, Guoyi, Beijing, China) applies the BET technique to examine the specific surface area, pore volume, and average pore diameter of biochar samples. N2 adsorption at a temperature of 77 K is employed in the study.
3. Results and Discussion
3.1. Analysis of Gasification Product Components
Figure 2 illustrates the effects of gasification temperatures and two heating methods on the mass yields of syngas, tar, and biochar derived from oak and corn stalk gasification. As the gasification temperature increases from 600 to 1000 °C, the syngas yield increases while the tar and biochar yields decrease. The increase in the gasification temperature enhances the pyrolysis and oxidation reactions during the process. This leads to higher consumption of solid raw materials converted into volatile gases. Furthermore, higher temperatures promote the processes of tar cracking and reforming.
Figure 2 shows that MG produces less biochar at the same temperature as EG, but it is more efficient in producing syngas. Some studies have obtained similar results [34,36,37,38]. Since the biochar could absorb the microwave energy, which would cause a higher temperature of biochar, promoting the MG process. The self-gasification reaction between biochar and CO2 during MG could decrease the biochar yield. Additionally, microwave heating is more efficient and uniform [27,40]. The occurrence of hot spots (sparks) enhance the production of gas-phase products [51]. EG generates higher tar yields than MG at lower temperatures, while MG becomes more favorable for tar production at higher temperatures. MG is influenced by the dielectric properties of the material being heated. Biomass samples could generate gaseous tar during MG, which subsequently undergoes volatilization from the biomass. This volatilization creates a temperature gradient between the material surface and the heating zone. Consequently, a greater amount of tar condenses within the quartz tube compared to electric heating methods.
3.2. Analysis of Gaseous Products
The distribution of syngas content is depicted in Figure 3 and Figure 4. The syngas mainly comprises H2, CO, CH4, and CO2. With the increase in gasification temperature, the CO and H2 concentrations increase gradually, while the CH4 and CO2 concentrations decrease. The percentages of CO and H2 increase from 17.2% and 7.9% to 48.7% and 16.9%, respectively. Conversely, the percentages of CO2 and CH4 decrease from 55.55% and 15.37% to 28.6% and 5.8% (Figure 3b). The Boudouard reaction (6) is limited when the gasification temperature is low. CO2 dominates syngas. The higher temperature will facilitate this reaction, increasing the content of CO. Additionally, a higher temperature promotes the expansion of the pore structure of biochar, increasing CO2 reactivity with char and promoting CO production. The methane reforming reaction (10) decreases the CH4 concentration and increases the H2 concentration. In addition, CO2 could react with the tar produced, as shown in Equation (11), promoting its cracking to yield H2 and CO. Moreover, the tar can be directly fractured to release H2, as shown in (12).
Figure 4a shows the syngas components from corn stalk MG. As the gasification temperature increases from 600 to 1000 °C, the volume fraction of CO increases from 27.3% to 61.8%, while that of CO2 decreases from 47.8% to 21.9%. The syngas content of EG is shown in Figure 4b. The volume fraction of CO increases from 27.9% to 50.8%, while the volume fraction of CO2 decreases from 55.1% to 23.3%. MG produces more CO than EG at the same temperature. Char particles can absorb the microwave energy, resulting in a higher temperature than the surroundings during MG [36]. Under the same heating conditions and temperature, the gaseous products of corn stalk gasification contain less CO2 than those of oak gasification. Oak is a hardwood, and the specific surface area and pore volume of oak char are lower than those of corn stalk char. The porous structure of the materials promotes the char self-gasification reaction.
The net calorific value of syngas is calculated from the relative content of syngas through Equation (5). As shown in Figure 5, the net calorific value of syngas increases with temperature. At 1000 °C, the highest net calorific values of syngas derived from oak gasification are 10.60 and 9.45 MJ m−3 (Figure 5a), while the highest net calorific values of syngas generated from corn stalk gasification are 11.61 and 10.06 MJ m−3 (Figure 5b). As the gasification temperature increases, the content of CO and H2 in the syngas components gradually increases. The net calorific value of syngas generated from MG is higher than that from EG at the same temperature.
Carbon conversion (ηc, %), which is defined as the percentage of carbon in biomass converted into carbon in the gaseous fuel, is employed to characterize biomass conversion in reaction activity under CO2 gasification. Where Gg is the volume of the produced gas (dry basis) per unit mass of biomass (standard condition), C% represents the mass fraction of carbon in the chemical composition of biomass, and CO, CO2, and CH4 are the molar fractions of the product gases. Ac denotes the atomic weight of carbon (12 g mol−1), and Vm represents the molar volume at standard conditions (22.4 L mol−1). Table 4 shows the carbon conversion from feedstock.
3.3. Analysis of Liquid-Phase Products
Common compounds of tar are further identified via GC-MS. Table 5 and Table 6 present the names and relative contents of partial tar components at various temperatures. Tables S1 and S2 in the Supplementary Materials present more detailed information on tar components. Tar primarily consists of benzene ring compounds, polycyclic aromatic hydrocarbons, and certain aliphatic hydrocarbons. As the gasification temperature increases, most of the primary tar undergoes conversion. Currently, PAHs are increasing while the concentration of tar, consisting of compounds with branched chains or heteroatoms, gradually declines due to ring condensation [52]. During biomass gasification, microwave influence on solid-phase reactions causes variations in tar composition and quantity at the same gasification temperature. These reactions include the decomposition of cellulose and lignin and the Boudouard reaction taking place on the biomass surface.
The tar obtained from biomass gasification has a complex composition, as shown via GC-MS analysis. Therefore, the compounds in the tar are classified into five groups, designated as Tx, based on the number of benzene rings in each compound. T1 to T3 represent tar fractions comprising one to three benzene rings. T4 indicates that the tar fraction consists of four or more benzene rings. The remaining products, including hydrocarbons and heterocyclic compounds (excluding benzene rings), are classified as T0.
As shown in Figure 6, the increasing gasification temperature gradually decreases the amount of T1 tar but has less impact on T2 tar. Furthermore, the contents of T3 and T4 tars are increasing significantly. Additionally, the concentration of T0 tar initially increases and then decreases. The T1 content of corn stalk MG decreases from 47.7% to 18.2% as the temperature increases from 600 to 1000 °C, representing a decrease of 29.5%. Additionally, the contents of T2, T3, and T4 increase from 15.6%, 1%, and 0.9% to 26.3%, 24.3%, and 21.5%, indicating an increase of 10.7%, 23.4%, and 20.6%. The T0 tar exhibits a decline in content, ranging from a peak of 40.7% at 700 °C to a nadir of 9.6% at 1000 °C (Figure 6a). The yield of T1 tar decreases from 38.2% to 17.3% when the temperature increases from 600 to 1000 °C. Additionally, the contents of T2, T3, and T4 increase from 16.2%, 0.8%, and 0.5% to 26.3%, 19.3%, and 18.2%, respectively. The content of T0 tar shows a similar pattern, with a peak of 47.5% at 700 °C (Figure 6b). It is worth noting that the increases observed in MG are higher than those in EG. This study shows that MG produces tars with more benzene rings than EG. The tar components derived from oak gasification are identical to those from the corn stalk and are unaffected by the heating methods. Alkali and alkaline earth metals (AAEMs), such as K, Na, Ca, and Mg, extensively occur in the biomass growth process and significantly affect the biomass gasification process. AAEMs could promote the secondary reaction of tar and affect the polycondensation conversion of tar. AAEMs improve the release of specific T1 compounds and enhance the content and species of T1 compounds in tar. AAEMs could also inhibit the release of T2–T4 compounds. According to Ren et al. [53], AAEMs promote the generation of fracture decomposition of long-chain alkanes during the gasification process.
3.4. Characterization of Biochar
3.4.1. SEM-EDS Analysis
Figure 7 and Figure 8 show the microstructures and morphologies of the biochar obtained via SEM. Figure 7a–c show the SEM images of oak chars derived from MG under different temperatures, which are 600, 800, and 1000 °C. The EDS analysis is shown in Table 7. The biochar exhibits a fibrous structure at 600 °C. The higher concentrations of C, O, Ca, and Mg elements suggest that calcium and magnesium carbonates are the primary compounds found in this area (Figure 7a). At 800 °C, the fibrous biochar disintegrates, creating a small amount of granular biochar. A decline in the concentration of element C is observed, while an increase occurs in the content of element Si (Figure 7b). This indicates that the biochar consists mainly of silicate with a small amount of carbonate. At 1000 °C, the fibrous nature of biochar disappears. Instead, a noticeable increase in the granular biochar structure is observed. With the increasing temperature during MG, the amount of carbon decreases from 31.67% to 3.42%, indicating a higher involvement of carbon in the gasification reaction. Figure 7d–f show the SEM images of oak chars derived from EG gasification. At 600 °C, the biochar shows the emergence of rod-shaped formations, but no discernible pores are present. At 800 °C, the biochar shows a lack of visible fibrous formations, but an increase in microscopic fibrous structures is observed, along with the emergence of distinct pore structures. At 1000 °C, the oak char shows a significant increase in pore quantity, resulting in a marked degradation of its fibrous structure. Under the same temperature, MG yields more small particles with an extensive pore structure. Therefore, it can be anticipated that the biochar from MG will have a more complex pore structure and a lower carbon content.
This study investigates the alterations in the microscopic morphology of corn stalk chars under various gasification temperatures and heating methods, employing identical assays. Figure 8a–c show the SEM images of corn stalk chars derived from MG under different temperatures, which are 600, 800, and 1000 °C. The EDS analysis is shown in Table 8. At 600 °C, corn stalk chars have larger particles and a more fibrous structure. At 800 °C, the char surface shows fewer large lumpy particles and tubular structures but an increase in microporous structures. The formation of micropores increases as the gasification temperature rises due to the Boudouard reactions. The pore structure of the corn stalk char decreases significantly at 1000 °C. This indicates that the char could melt and deform, while the pores would shrink and even close at a higher temperature. Figure 8d–f show the SEM images of corn stalk chars derived from EG. The corn stalk char retains its tube bundle shape at 600 °C. Microporous structures are more prevalent in biochar at 800 °C. The pore structure of biochar is significantly disrupted at 1000 °C.
At the same temperature, biochar obtained from MG has a higher concentration of mesopores and macropores, leading to a more diverse pore structure. As the temperature rises, the C element content decreases, while the Si element content experiences a constant increase. The content of the O element remains relatively stable. Biochar produced from MG has more pores due to the uniform release of the volatile matter across the whole particle [54]. CO2 has a bigger surface area in contact with the biochar. Consequently, more Boudouard reactions occur, leading to carbon consumption on the biochar surface. Therefore, the surface of EG char contains a higher carbon content than the surface of MG char.
3.4.2. BET Analysis
As the gasification temperature increases, the physical characteristics of the biochar surface undergo corresponding alterations. Table 9 displays the data for the specific surface area, pore volume, and average pore diameter of oak char and corn stalk char obtained from the two gasification methods. The specific surface area, pore volume, and average pore diameter of oak char exhibit initial growth followed by a decline during MG from 600 to 1000 °C. The highest specific surface area and total pore volume are both observed at 800 °C, with the values of 485.02 m2 g−1 and 0.48 cm3 g−1, respectively. The average pore diameter reaches its maximum at 900 °C, measuring 4.38 nm. Biomass primarily comprises lignin, cellulose, and hemicellulose [55]. Organic compounds with carboxyl, hydroxyl, and carbonyl groups could react with the gasification agent differently at high temperatures. Cellulose and hemicellulose have higher O/C ratios than lignin, so they are gasified faster than lignin, producing more CO and less H2 [56]. These reactions may involve the breaking of C=O bonds and C-H bonds and the release of water vapor. Thus, the char generates a portion of structurally undeveloped pores, changing the average pore size [55,57,58]. Additionally, during biomass gasification, the carbon on the outer and inner surfaces within the pores interacts with CO2, forming more pores. When the gasification temperature surpasses a specific limit, the pre-existing micropores break down, resulting in a substantial increase in the pore size or even the rupture of the pore wall. As a result, the number of micropores decreases while the number of mesopores and macropores increase. Hence, when the oak chars are heated above 800 °C, a decrease occurs in both specific surface area and pore volume, and an increase appears in pore diameter. The surface area and pore volume of char from oak EG follow a pattern of initial increase and subsequent decrease, with lower values than before. The highest specific surface area and total pore volume of the corn stalk char from MG are achieved at 800 °C, measuring 525.87 m2 g−1 and 0.62 cm3 g−1, respectively. The maximum average pore diameter of 4.18 nm is obtained at 900 °C. The highest specific surface area, total pore volume, and average pore diameter from corn stalk EG are achieved at 900 °C, measuring 502.52 m2 g−1, 0.51 cm3 g−1, and 3.53 cm3 g−1, respectively.
Microwave heating makes the internal temperature of biomass higher than the external one, which is more conducive to the formation of a rich microporous structure of biomass. Generally, the biochar from MG exhibits a greater specific surface area and total pore volume than biomass char derived from EG. The results obtained are consistent with the previous articles [59,60].
3.4.3. FTIR Analysis
The chemical functional groups of oak char are obtained via FTIR analysis, as shown in Figure 9. The oak char exhibits distinct peaks at various wavenumbers, indicating specific vibrational intervals. These include 2980–2800 cm−1, corresponding to the stretching vibrations of C-H bonds in functional groups such as -CH3 and -CH2-. Additionally, stretching vibrations of carbonyl groups are observed at 1750–1500 cm−1 [61]. The vibrational intervals of 1500–1200 cm−1 indicate the presence of C-O-C and C-H in-plane vibrations. Furthermore, the stretching vibrations of -OH groups are detected at 1200–1000 cm−1. Finally, the vibrations related to the bending of the C-H bonds out of the plane are detected within the range of 1000–650 cm−1. The FTIR curves of the same biomass are consistent across different heating methods, indicating that the heating methods do not impact the surface functional groups of biomass charcoal. As the gasification temperature increases, the strengths of the characteristic peaks of the functional groups on the surface of the two samples gradually diminish. This observation indicates that the high temperature led to the breakdown of functional groups on the surface of the biomass chars.
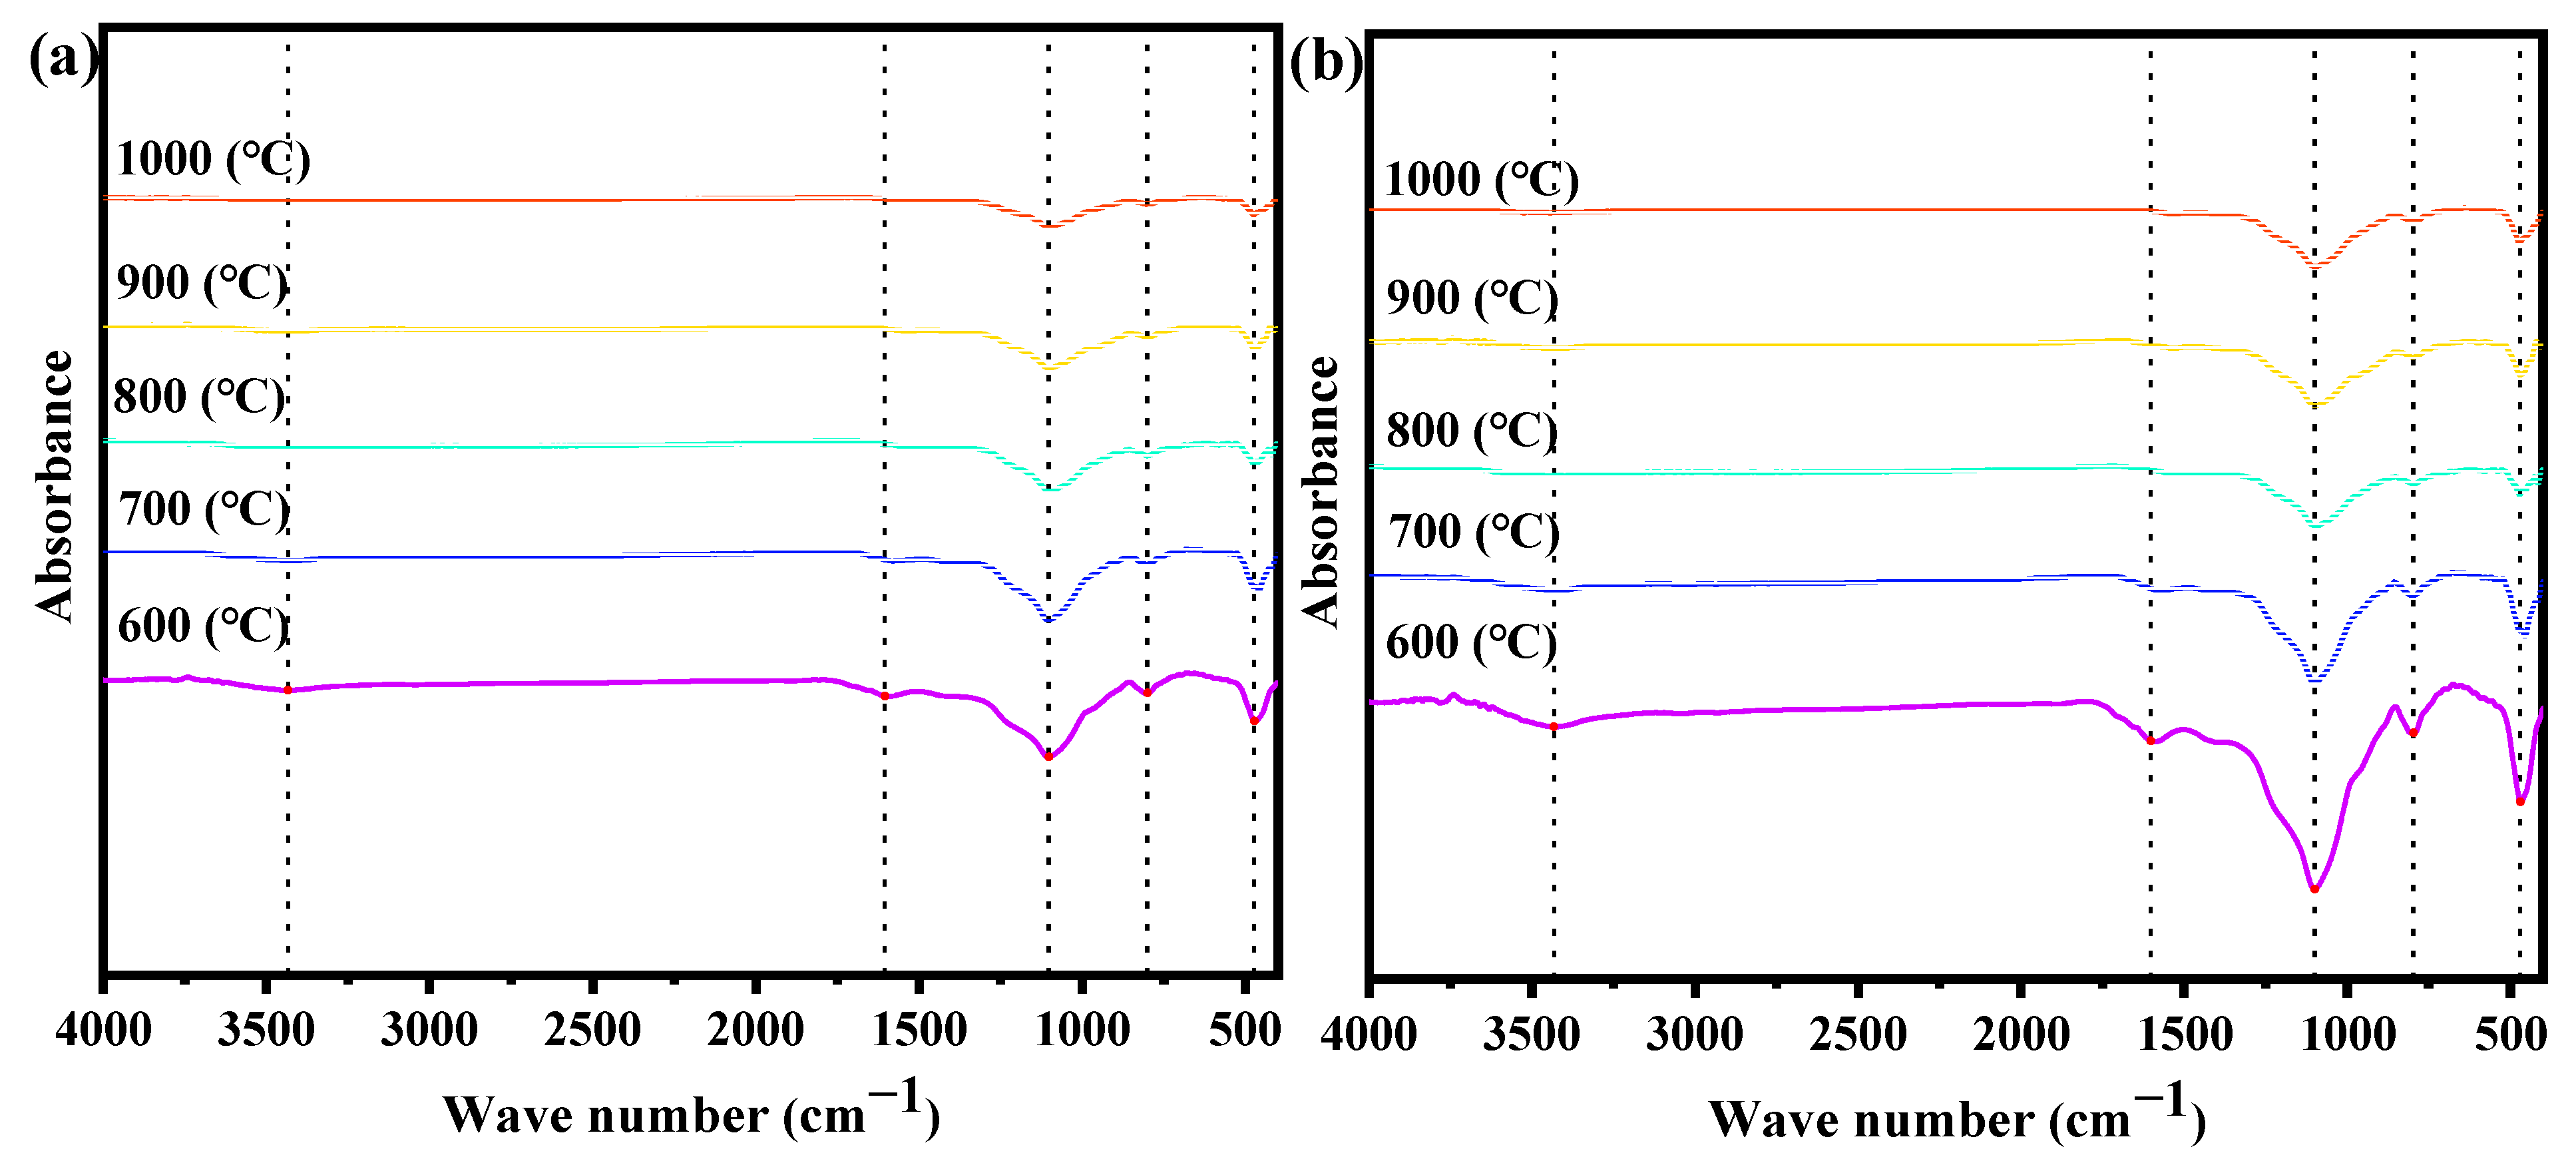
As shown in Figure 10, the characteristic peaks in corn stalks have distinct locations from those in oak char. Specifically, the absorption characteristic peaks are identified at 1600–1800 cm−1, corresponding to the C=C vibrational intervals of aromatic or thick aromatic rings. Also, 1200–1000 cm−1 peaks represent the telescopic vibrational intervals of -OH groups. Furthermore, two peaks are detected at 1000–450 cm−1, specifically at 797 and 469 cm−1, corresponding to the C-H vibrational intervals of different aliphatic groups in corn stalk char. The absorption peaks of each functional group of biomass char from MG exhibit a lower intensity than that from EG. The gap between the two heating methods gradually decreases as the temperature increases. The evidence suggests that MG is more beneficial than EG at lower temperatures.
4. Conclusions
In this study, a gasification experiment is conducted on corn stalks and oak in a fixed-bed system to characterize the gasification products of biomass. The effects of heating method and gasification temperature on the properties of the gasification products are mainly investigated. The main conclusions are as follows:
- As the gasification temperature increases, the yield of biochar and tar decreases significantly, while the syngas yield experiences a substantial increase. MG produces more syngas and less biochar than EG. Compared to EG, MG of biomass is a better method to be applied to produce the combustible gases to replace the fossil fuels;
- The syngas mainly comprises H2, CH4, CO, and CO2. When the gasification temperature increases from 600 to 1000 °C, the contents of CO and H2 increase, while the contents of CH4 and CO2 decrease. EG produces more CO and less CO2 at the same temperature as MG. Higher gasification temperatures facilitate an increase in the calorific value of the syngas. At 1000 °C, the highest net calorific values of syngas generated from corn stalk and oak MG are 11.61 and 10.60 MJ m−3;
- The tar mainly comprises the benzene ring compounds, the polycyclic aromatic hydrocarbons, and certain aliphatic hydrocarbons. When the gasification temperature increases, more primary tars are converted into PAHs. The yield of T0 tar initially increases and then decreases, while T4 tar continuously increases. MG produces tars with more benzene rings than EG. Employing only CO2 as the gasification agent produces more tar in this study. For subsequent biomass gasification studies, a certain percentage of O2 could be added to the gasification agent to crack some tar;
- MG produces biochar with a richer microporous structure than EG. The biochar from MG has a higher specific surface area, pore volume, and average pore diameter than EG. The specific surface area of biochar from corn stalk MG reaches a maximum value of 525.87 m2 g−1 at 900 °C. The intensity of the characteristic peaks of functional groups on the surface of biochar decreases with increasing gasification temperature. Biochar in a microporous structure obtained via EG would be a promising absorbent during industry.
Supplementary Materials
The following supporting information can be downloaded at: https://www.mdpi.com/article/10.3390/app132011490/s1, Table S1: GC-MS results of oak tar derived from MG and EG; Table S2: GC-MS results of corn stalk tar derived from MG and EG.
Author Contributions
Conceptualization, Y.Y., X.J. and L.D.; Data curation, Y.Y. and X.J.; Investigation, Y.Y., X.J. and L.D.; Resources, Y.Y. and X.J.; Supervision, L.D.; Writing—original draft, Y.Y.; Writing—review and editing, L.D. All authors have read and agreed to the published version of the manuscript.
Funding
This research was funded by [the Huaneng Group Science and Technology Project] grant number [HNKJ21-H42].
Institutional Review Board Statement
Not applicable.
Informed Consent Statement
Not applicable.
Data Availability Statement
The data that support the findings of this study are available from the corresponding author.
Acknowledgments
The authors also thank the staff at the Instrument Analysis Center of Xi’an Jiaotong University for their assistance with the sample analysis.
Conflicts of Interest
The authors declare no conflict of interest.
Nomenclature/Abbreviations
| Nomenclature | |
| carbon conversion/% | |
| volume of the produced gas per unit mass of biomass/L g−1 | |
| atomic weight of carbon/g mol−1 | |
| molar volume at standard conditions/L mol−1 | |
| Abbreviations | |
| electric gasification | |
| microwave gasification | |
| gas chromatography | |
| gas chromatography–mass spectrometry | |
| Fourier transform infrared spectrometer | |
| X-ray photoelectron spectroscopy | |
| scanning electron microscopy | |
| energy dispersive spectrometer | |
| polycyclic aromatic hydrocarbons | |
| alkali and alkaline earth metals |
References
- Global Energy Review 2021; IEA: Paris, France, 2021. Available online: http://www.iea.org/reports/global-energy-review-2021 (accessed on 17 August 2022).
- Alonso, D.M.; Wettstein, S.G.; Dumesic, J.A. Bimetallic catalysts for upgrading of biomass to fuels and chemicals. Chem. Soc. Rev. 2012, 41, 8075–8098. [Google Scholar] [CrossRef] [PubMed]
- Kılıç Depren, S.; Kartal, M.T.; Çoban Çelikdemir, N.; Depren, Ö. Energy consumption and environmental degradation nexus: A systematic review and meta-analysis of fossil fuel and renewable energy consumption. Ecol. Inform. 2022, 70, 101747. [Google Scholar] [CrossRef]
- McKendry, P. Energy production from biomass (part 2): Conversion technologies. Bioresour. Technol. 2002, 83, 47–54. [Google Scholar] [CrossRef] [PubMed]
- Richardson, Y.; Blin, J.; Julbe, A. A short overview on purification and conditioning of syngas produced by biomass gasification: Catalytic strategies, process intensification and new concepts. Prog. Energy Combust. Sci. 2012, 38, 765–781. [Google Scholar] [CrossRef]
- Halder, P. Perceptions of energy production from forest biomass among school students in Finland: Directions for the future bioenergy policies. Renew. Energy 2014, 68, 372–377. [Google Scholar] [CrossRef]
- Uris, M.; Linares, J.I.; Arenas, E. Techno-economic feasibility assessment of a biomass cogeneration plant based on an Organic Rankine Cycle. Renew. Energy 2014, 66, 707–713. [Google Scholar] [CrossRef]
- Xie, Q.; Borges, F.C.; Cheng, Y.; Wan, Y.; Li, Y.; Lin, X.; Liu, Y.; Hussain, F.; Chen, P.; Ruan, R. Fast microwave-assisted catalytic gasification of biomass for syngas production and tar removal. Bioresour. Technol. 2014, 156, 291–296. [Google Scholar] [CrossRef]
- Yu, Y.; Yu, J.; Sun, B.; Yan, Z. Influence of catalyst types on the microwave-induced pyrolysis of sewage sludge. J. Anal. Appl. Pyrolysis 2014, 106, 86–91. [Google Scholar] [CrossRef]
- Zhang, B.; Zhong, Z.; Chen, P.; Ruan, R. Microwave-assisted catalytic fast pyrolysis of biomass for bio-oil production using chemical vapor deposition modified HZSM-5 catalyst. Bioresour. Technol. 2015, 197, 79–84. [Google Scholar] [CrossRef]
- Zhu, L.; Lei, H.; Wang, L.; Yadavalli, G.; Zhang, X.; Wei, Y.; Liu, Y.; Yan, D.; Chen, S.; Ahring, B. Biochar of corn stover: Microwave-assisted pyrolysis condition induced changes in surface functional groups and characteristics. J. Anal. Appl. Pyrolysis 2015, 115, 149–156. [Google Scholar] [CrossRef]
- Purakayastha, T.J.; Bera, T.; Bhaduri, D.; Sarkar, B.; Mandal, S.; Wade, P.; Kumari, S.; Biswas, S.; Menon, M.; Pathak, H.; et al. A review on biochar modulated soil condition improvements and nutrient dynamics concerning crop yields: Pathways to climate change mitigation and global food security. Chemosphere 2019, 227, 345–365. [Google Scholar] [CrossRef]
- Jin, X.; Zhang, K.; Jiang, J.; Zhu, Z.; Deng, L.; Che, D. Catalytic conversion of toluene by biochar modified with KMnO4. Fuel 2023, 332, 126237. [Google Scholar] [CrossRef]
- Chan, Y.H.; Cheah, K.W.; How, B.S.; Loy, A.C.M.; Shahbaz, M.; Singh, H.K.G.; Yusuf, N.R.; Shuhaili, A.F.A.; Yusup, S.; Ghani, W.A.W.A.K.; et al. An overview of biomass thermochemical conversion technologies in Malaysia. Sci. Total Environ. 2019, 680, 105–123. [Google Scholar] [CrossRef] [PubMed]
- Liu, M.; He, Q.; Bai, J.; Yu, J.; Kong, L.; Bai, Z.; Li, H.; He, C.; Cao, X.; Ge, Z.; et al. Char reactivity and kinetics based on the dynamic char structure during gasification by CO2. Fuel Process. Technol. 2021, 211, 106583. [Google Scholar] [CrossRef]
- Pinto, F.; André, R.N.; Carolino, C.; Miranda, M. Hot treatment and upgrading of syngas obtained by co-gasification of coal and wastes. Fuel Process. Technol. 2014, 126, 19–29. [Google Scholar] [CrossRef]
- Molino, A.; Chianese, S.; Musmarra, D. Biomass gasification technology: The state of the art overview. J. Energy Chem. 2016, 25, 10–25. [Google Scholar] [CrossRef]
- Gilbe, C.; Öhman, M.; Lindström, E.; Boström, D.; Backman, R.; Samuelsson, R.; Burvall, J. Slagging Characteristics during Residential Combustion of Biomass Pellets. Energy Fuels 2008, 22, 3536–3543. [Google Scholar] [CrossRef]
- Su, F.; Sun, S.; Zhao, Y.; Li, L. Studies on mechanism of biomass air gasification. J. Harbin Inst. Technol. 2006, 11, 1898–1902. [Google Scholar] [CrossRef]
- Heidenreich, S.; Foscolo, P.U. New concepts in biomass gasification. Prog. Energy Combust. Sci. 2015, 46, 72–95. [Google Scholar] [CrossRef]
- Sikarwar, V.S.; Zhao, M.; Clough, P.; Yao, J.; Zhong, X.; Memon, M.Z.; Shah, N.; Anthony, E.J.; Fennell, P.S. An overview of advances in biomass gasification. Energy Environ. Sci. 2016, 9, 2939–2977. [Google Scholar] [CrossRef]
- Karatas, H.; Akgun, F. Experimental results of gasification of walnut shell and pistachio shell in a bubbling fluidized bed gasifier under air and steam atmospheres. Fuel 2018, 214, 285–292. [Google Scholar] [CrossRef]
- Jin, X.; Ye, J.; Deng, L.; Che, D. Condensation Behaviors of Potassium during Biomass Combustion. Energy Fuels 2017, 31, 2951–2958. [Google Scholar] [CrossRef]
- Xu, D.; Yang, L.; Ding, K.; Zhang, Y.; Gao, W.; Huang, Y.; Sun, H.; Hu, X.; Syed-Hassan, S.S.A.; Zhang, S.; et al. Mini-Review on Char Catalysts for Tar Reforming during Biomass Gasification: The Importance of Char Structure. Energy Fuels 2020, 34, 1219–1229. [Google Scholar] [CrossRef]
- Spokas, K.A.; Cantrell, K.B.; Novak, J.M.; Archer, D.W.; Ippolito, J.A.; Collins, H.P.; Boateng, A.A.; Lima, I.M.; Lamb, M.C.; McAloon, A.J.; et al. Biochar: A Synthesis of Its Agronomic Impact beyond Carbon Sequestration. J. Environ. Qual. 2012, 41, 973–989. [Google Scholar] [CrossRef]
- Hov, S.; Paniagua, P.; Sætre, C.; Long, M.; Cornelissen, G.; Ritter, S. Stabilisation of Soft Clay, Quick Clay and Peat by Industrial By-Products and Biochars. Appl. Sci. 2023, 13, 9048. [Google Scholar] [CrossRef]
- Fellet, G.; Conte, P.; Marchiol, L. Biochar Effects on Ce Leaching and Plant Uptake in Lepidium sativum L. Grown on a Ceria Nanoparticle Spiked Soil. Appl. Sci. 2023, 13, 6846. [Google Scholar] [CrossRef]
- Wijitkosum, S.; Jiwnok, P. Elemental Composition of Biochar Obtained from Agricultural Waste for Soil Amendment and Carbon Sequestration. Appl. Sci. 2019, 9, 3980. [Google Scholar] [CrossRef]
- Saletnik, B.; Zaguła, G.; Bajcar, M.; Tarapatskyy, M.; Bobula, G.; Puchalski, C. Biochar as a Multifunctional Component of the Environment—A Review. Appl. Sci. 2019, 9, 1139. [Google Scholar] [CrossRef]
- Lahijani, P.; Zainal, Z.A.; Mohamed, A.R.; Mohammadi, M. Microwave-enhanced CO2 gasification of oil palm shell char. Bioresour. Technol. 2014, 158, 193–200. [Google Scholar] [CrossRef]
- Mašek, O.; Budarin, V.; Gronnow, M.; Crombie, K.; Brownsort, P.; Fitzpatrick, E.; Hurst, P. Microwave and slow pyrolysis biochar—Comparison of physical and functional properties. J. Anal. Appl. Pyrolysis 2013, 100, 41–48. [Google Scholar] [CrossRef]
- Wu, C.; Budarin, V.L.; Gronnow, M.J.; De Bruyn, M.; Onwudili, J.A.; Clark, J.H.; Williams, P.T. Conventional and microwave-assisted pyrolysis of biomass under different heating rates. J. Anal. Appl. Pyrolysis 2014, 107, 276–283. [Google Scholar] [CrossRef]
- Sobhy, A.; Chaouki, J. Microwave-assisted biorefinery. Chem. Eng. Trans. 2010, 19, 25–29. [Google Scholar] [CrossRef]
- Domínguez, A.; Menéndez, J.A.; Fernández, Y.; Pis, J.J.; Nabais, J.M.V.; Carrott, P.J.M.; Carrott, M.M.L.R. Conventional and microwave induced pyrolysis of coffee hulls for the production of a hydrogen rich fuel gas. J. Anal. Appl. Pyrolysis 2007, 79, 128–135. [Google Scholar] [CrossRef]
- Domínguez, A.; Menéndez, J.A.; Inguanzo, M.; Pís, J.J. Production of bio-fuels by high temperature pyrolysis of sewage sludge using conventional and microwave heating. Bioresour. Technol. 2006, 97, 1185–1193. [Google Scholar] [CrossRef] [PubMed]
- Wang, X.-H.; Chen, H.-P.; Ding, X.-J.; Yang, H.-P.; Zhang, S.-H.; Shen, Y.-Q. Properties of gas and char from microwave pyrolysis of pine sawdust. BioResources 2009, 4, 946–959. [Google Scholar] [CrossRef]
- Zhao, X.; Zhang, J.; Song, Z.; Liu, H.; Li, L.; Ma, C. Microwave pyrolysis of straw bale and energy balance analysis. J. Anal. Appl. Pyrolysis 2011, 92, 43–49. [Google Scholar] [CrossRef]
- Huang, Y.F.; Kuan, W.H.; Lo, S.L.; Lin, C.F. Hydrogen-rich fuel gas from rice straw via microwave-induced pyrolysis. Bioresour. Technol. 2010, 101, 1968–1973. [Google Scholar] [CrossRef] [PubMed]
- Sharma, P.K.; Sharma, A.K.; Pulla, R.H.; Sahoo, P.K. Performance analysis of a medium-scale downdraft gasifier using Lantana camera biomass as feeding material. Energy Sources Part Recovery Util. Environ. Eff. 2020, 1–15. [Google Scholar] [CrossRef]
- Gutiérrez, J.; Rubio-Clemente, A.; Pérez, J.F. Effect of main solid biomass commodities of patula pine on biochar properties produced under gasification conditions. Ind. Crops Prod. 2021, 160, 113123. [Google Scholar] [CrossRef]
- Liu, Z.; Zhang, F.; Liu, H.; Ba, F.; Yan, S.; Hu, J. Pyrolysis/gasification of pine sawdust biomass briquettes under carbon dioxide atmosphere: Study on carbon dioxide reduction (utilization) and biochar briquettes physicochemical properties. Bioresour. Technol. 2018, 249, 983–991. [Google Scholar] [CrossRef]
- Ren, S.; Lei, H.; Wang, L.; Bu, Q.; Chen, S.; Wu, J.; Julson, J.; Ruan, R. Biofuel production and kinetics analysis for microwave pyrolysis of Douglas fir sawdust pellet. J. Anal. Appl. Pyrolysis 2012, 94, 163–169. [Google Scholar] [CrossRef]
- Du, J.; Liu, P.; Liu, Z.; Sun, D.; Tao, C. Fast pyrolysis of biomass for bio-oil with ionic liquid and microwave irradiation. J. Fuel Chem. Technol. 2010, 38, 554–559. [Google Scholar] [CrossRef]
- Zhao, X.; Wang, M.; Liu, H.; Li, L.; Ma, C.; Song, Z. A microwave reactor for characterization of pyrolyzed biomass. Bioresour. Technol. 2012, 104, 673–678. [Google Scholar] [CrossRef] [PubMed]
- Salema, A.A.; Ani, F.N. Microwave-assisted pyrolysis of oil palm shell biomass using an overhead stirrer. J. Anal. Appl. Pyrolysis 2012, 96, 162–172. [Google Scholar] [CrossRef]
- Salema, A.A.; Ani, F.N. Microwave induced pyrolysis of oil palm biomass. Bioresour. Technol. 2011, 102, 3388–3395. [Google Scholar] [CrossRef]
- Zhao, X.; Song, Z.; Liu, H.; Li, Z.; Li, L.; Ma, C. Microwave pyrolysis of corn stalk bale: A promising method for direct utilization of large-sized biomass and syngas production. J. Anal. Appl. Pyrolysis 2010, 89, 87–94. [Google Scholar] [CrossRef]
- Wan, Y.; Chen, P.; Zhang, B.; Yang, C.; Liu, Y.; Lin, X.; Ruan, R. Microwave-assisted pyrolysis of biomass: Catalysts to improve product selectivity. J. Anal. Appl. Pyrolysis 2009, 86, 161–167. [Google Scholar] [CrossRef]
- Collard, F.-X.; Blin, J. A review on pyrolysis of biomass constituents: Mechanisms and composition of the products obtained from the conversion of cellulose, hemicelluloses and lignin. Renew. Sustain. Energy Rev. 2014, 38, 594–608. [Google Scholar] [CrossRef]
- GB/T 30725-2014; Determination of Ash Composition in Solid Biofuels. China National Coal Association: Beijing, China, 2014.
- Menéndez, J.A.; Arenillas, A.; Fidalgo, B.; Fernández, Y.; Zubizarreta, L.; Calvo, E.G.; Bermúdez, J.M. Microwave heating processes involving carbon materials. Fuel Process. Technol. 2010, 91, 1–8. [Google Scholar] [CrossRef]
- Li, J.; Dai, J.; Liu, G.; Zhang, H.; Gao, Z.; Fu, J.; He, Y.; Huang, Y. Biochar from microwave pyrolysis of biomass: A review. Biomass Bioenergy 2016, 94, 228–244. [Google Scholar] [CrossRef]
- Ren, J.; Yang, K.; Li, Y.; Bai, Y.; Jiang, J.; Huang, X.; Deng, L.; Che, D. Catalytic gasification of large particle-size biomass with loaded AAEMs under oxygen-steam atmosphere. Fuel 2024, 357, 130019. [Google Scholar] [CrossRef]
- Yagmur, E.; Ozmak, M.; Aktas, Z. A novel method for production of activated carbon from waste tea by chemical activation with microwave energy. Fuel 2008, 87, 3278–3285. [Google Scholar] [CrossRef]
- Hanaoka, T.; Inoue, S.; Uno, S.; Ogi, T.; Minowa, T. Effect of woody biomass components on air-steam gasification. Biomass Bioenergy 2005, 28, 69–76. [Google Scholar] [CrossRef]
- Yu, J.; Guo, Q.; Gong, Y.; Ding, L.; Wang, J.; Yu, G. A review of the effects of alkali and alkaline earth metal species on biomass gasification. Fuel Process. Technol. 2021, 214, 106723. [Google Scholar] [CrossRef]
- Tian, T.; Li, Q.; He, R.; Tan, Z.; Zhang, Y. Effects of biochemical composition on hydrogen production by biomass gasification. Int. J. Hydrogen Energy 2017, 42, 19723–19732. [Google Scholar] [CrossRef]
- López-González, D.; Fernandez-Lopez, M.; Valverde, J.L.; Sanchez-Silva, L. Gasification of lignocellulosic biomass char obtained from pyrolysis: Kinetic and evolved gas analyses. Energy 2014, 71, 456–467. [Google Scholar] [CrossRef]
- Menéndez, J.A.; Domínguez, A.; Fernández, Y.; Pis, J.J. Evidence of Self-Gasification during the Microwave-Induced Pyrolysis of Coffee Hulls. Energy Fuels 2007, 21, 373–378. [Google Scholar] [CrossRef]
- Luque, R.; Menéndez, J.A.; Arenillas, A.; Cot, J. Microwave-assisted pyrolysis of biomass feedstocks: The way forward? Energy Environ. Sci 2012, 5, 5481–5488. [Google Scholar] [CrossRef]
- Elnour, A.Y.; Alghyamah, A.A.; Shaikh, H.M.; Poulose, A.M.; Al-Zahrani, S.M.; Anis, A.; Al-Wabel, M.I. Effect of Pyrolysis Temperature on Biochar Microstructural Evolution, Physicochemical Characteristics, and Its Influence on Biochar/Polypropylene Composites. Appl. Sci. 2019, 9, 1149. [Google Scholar] [CrossRef]
Figure 1.
Schematic diagram of electric and microwave heating gasification system.

Figure 2.
Yield of gasified products from oak (a) and corn stalk (b) via MG and EG.
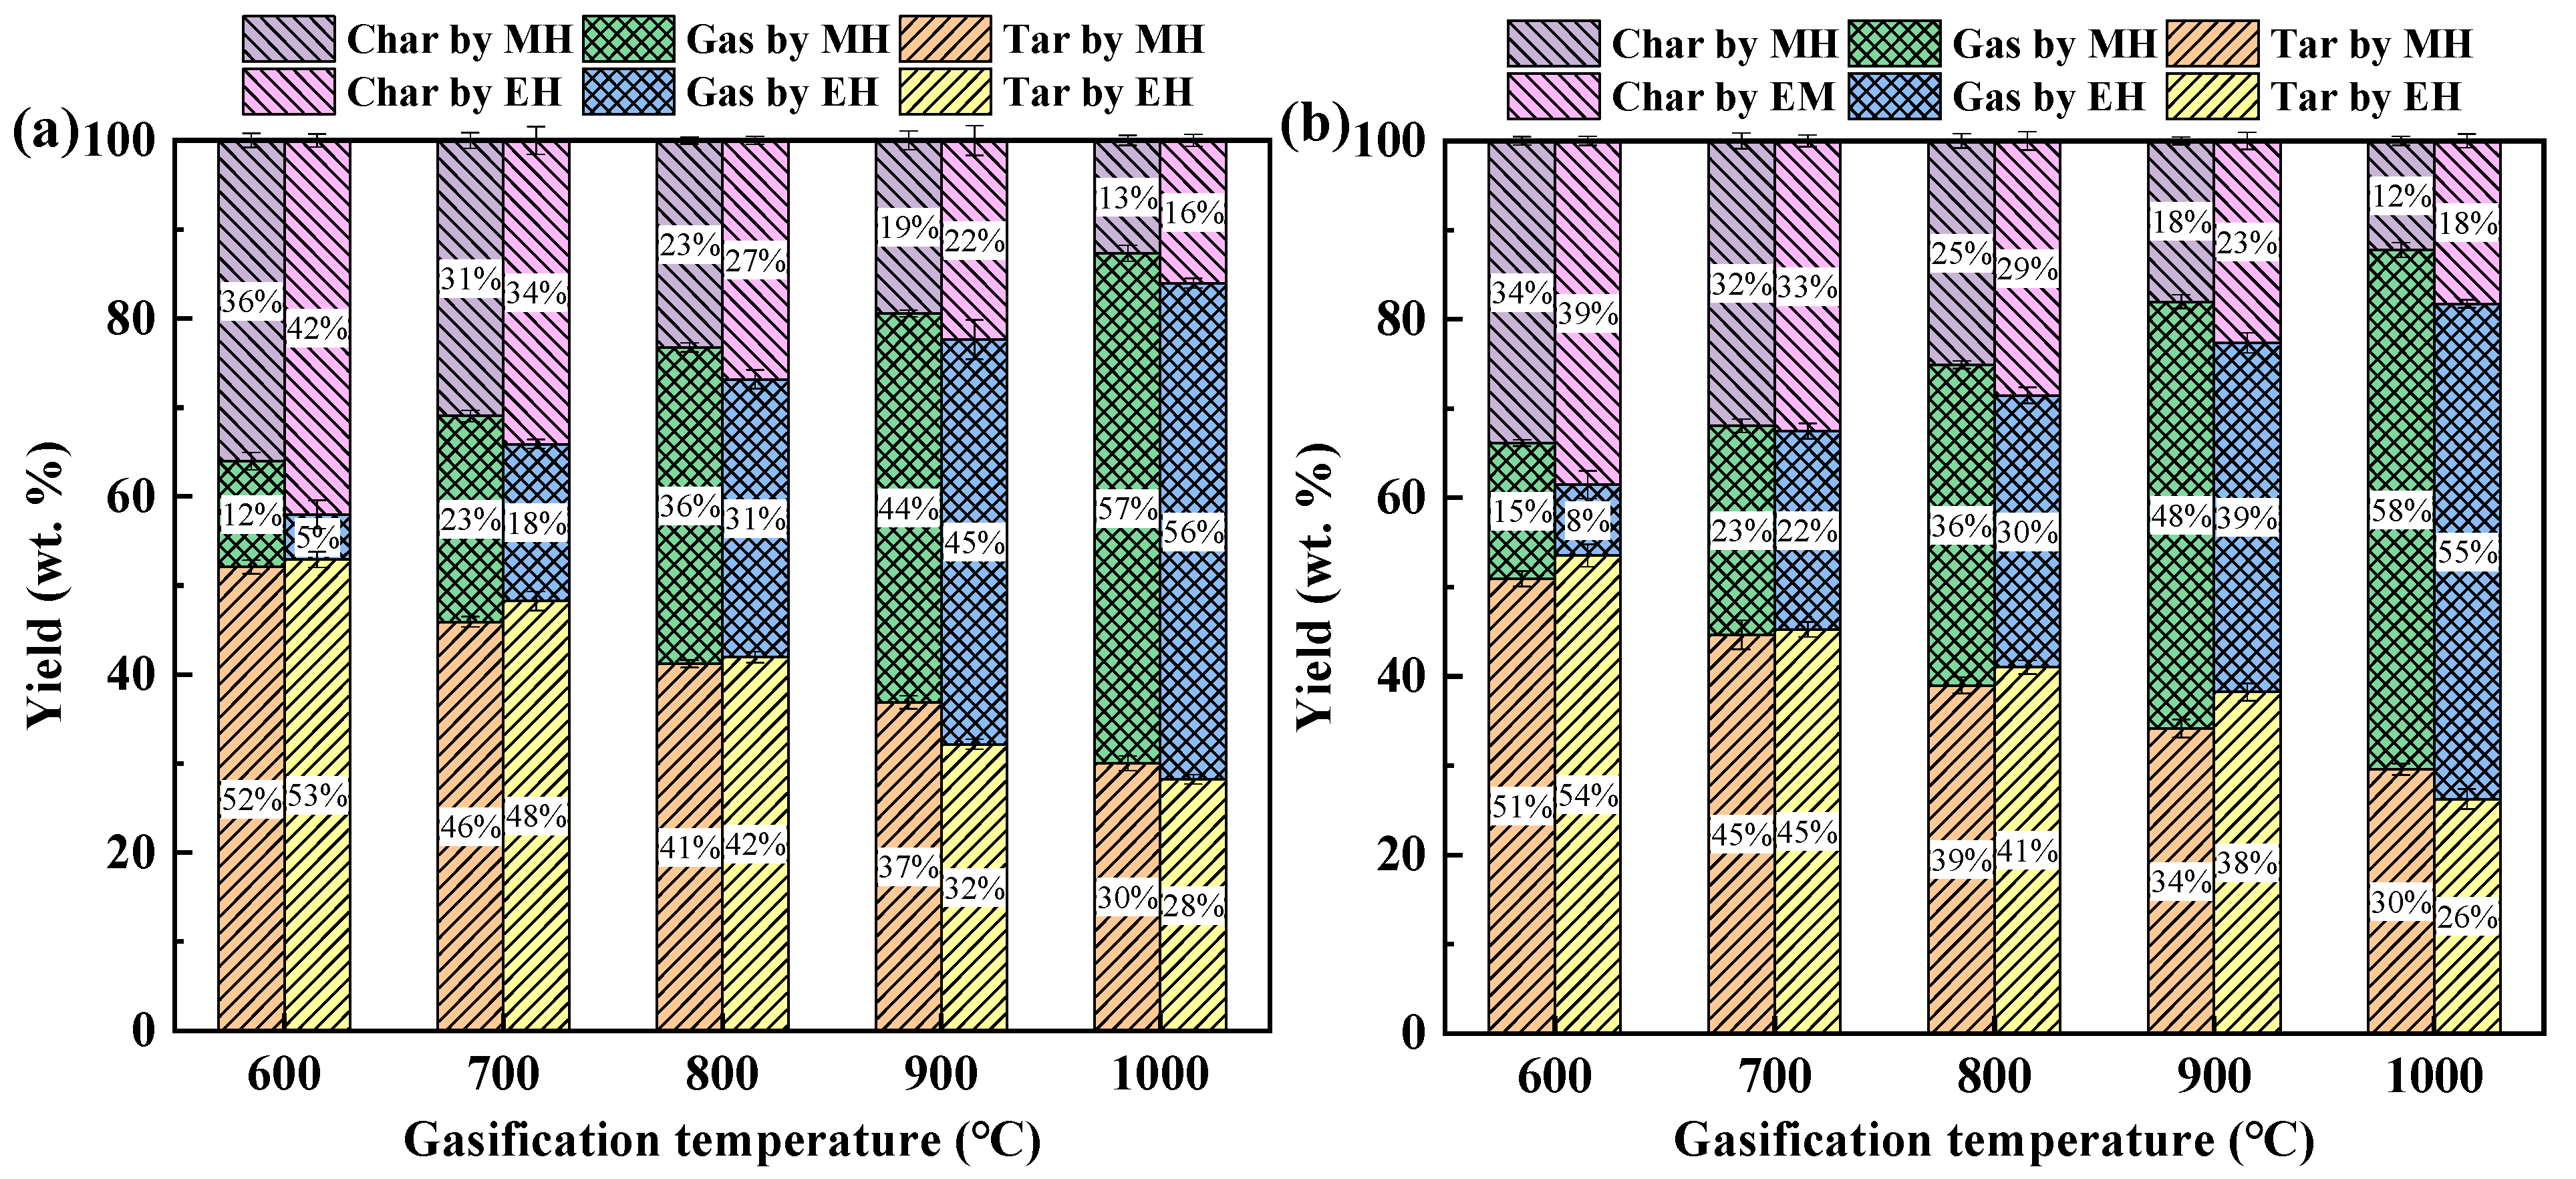
Figure 3.
Main gas components obtained from corn stalk MG (a) and EG (b) at different temperatures.

Figure 4.
Main gas components obtained from oak MG (a) and EG (b) at different temperatures.
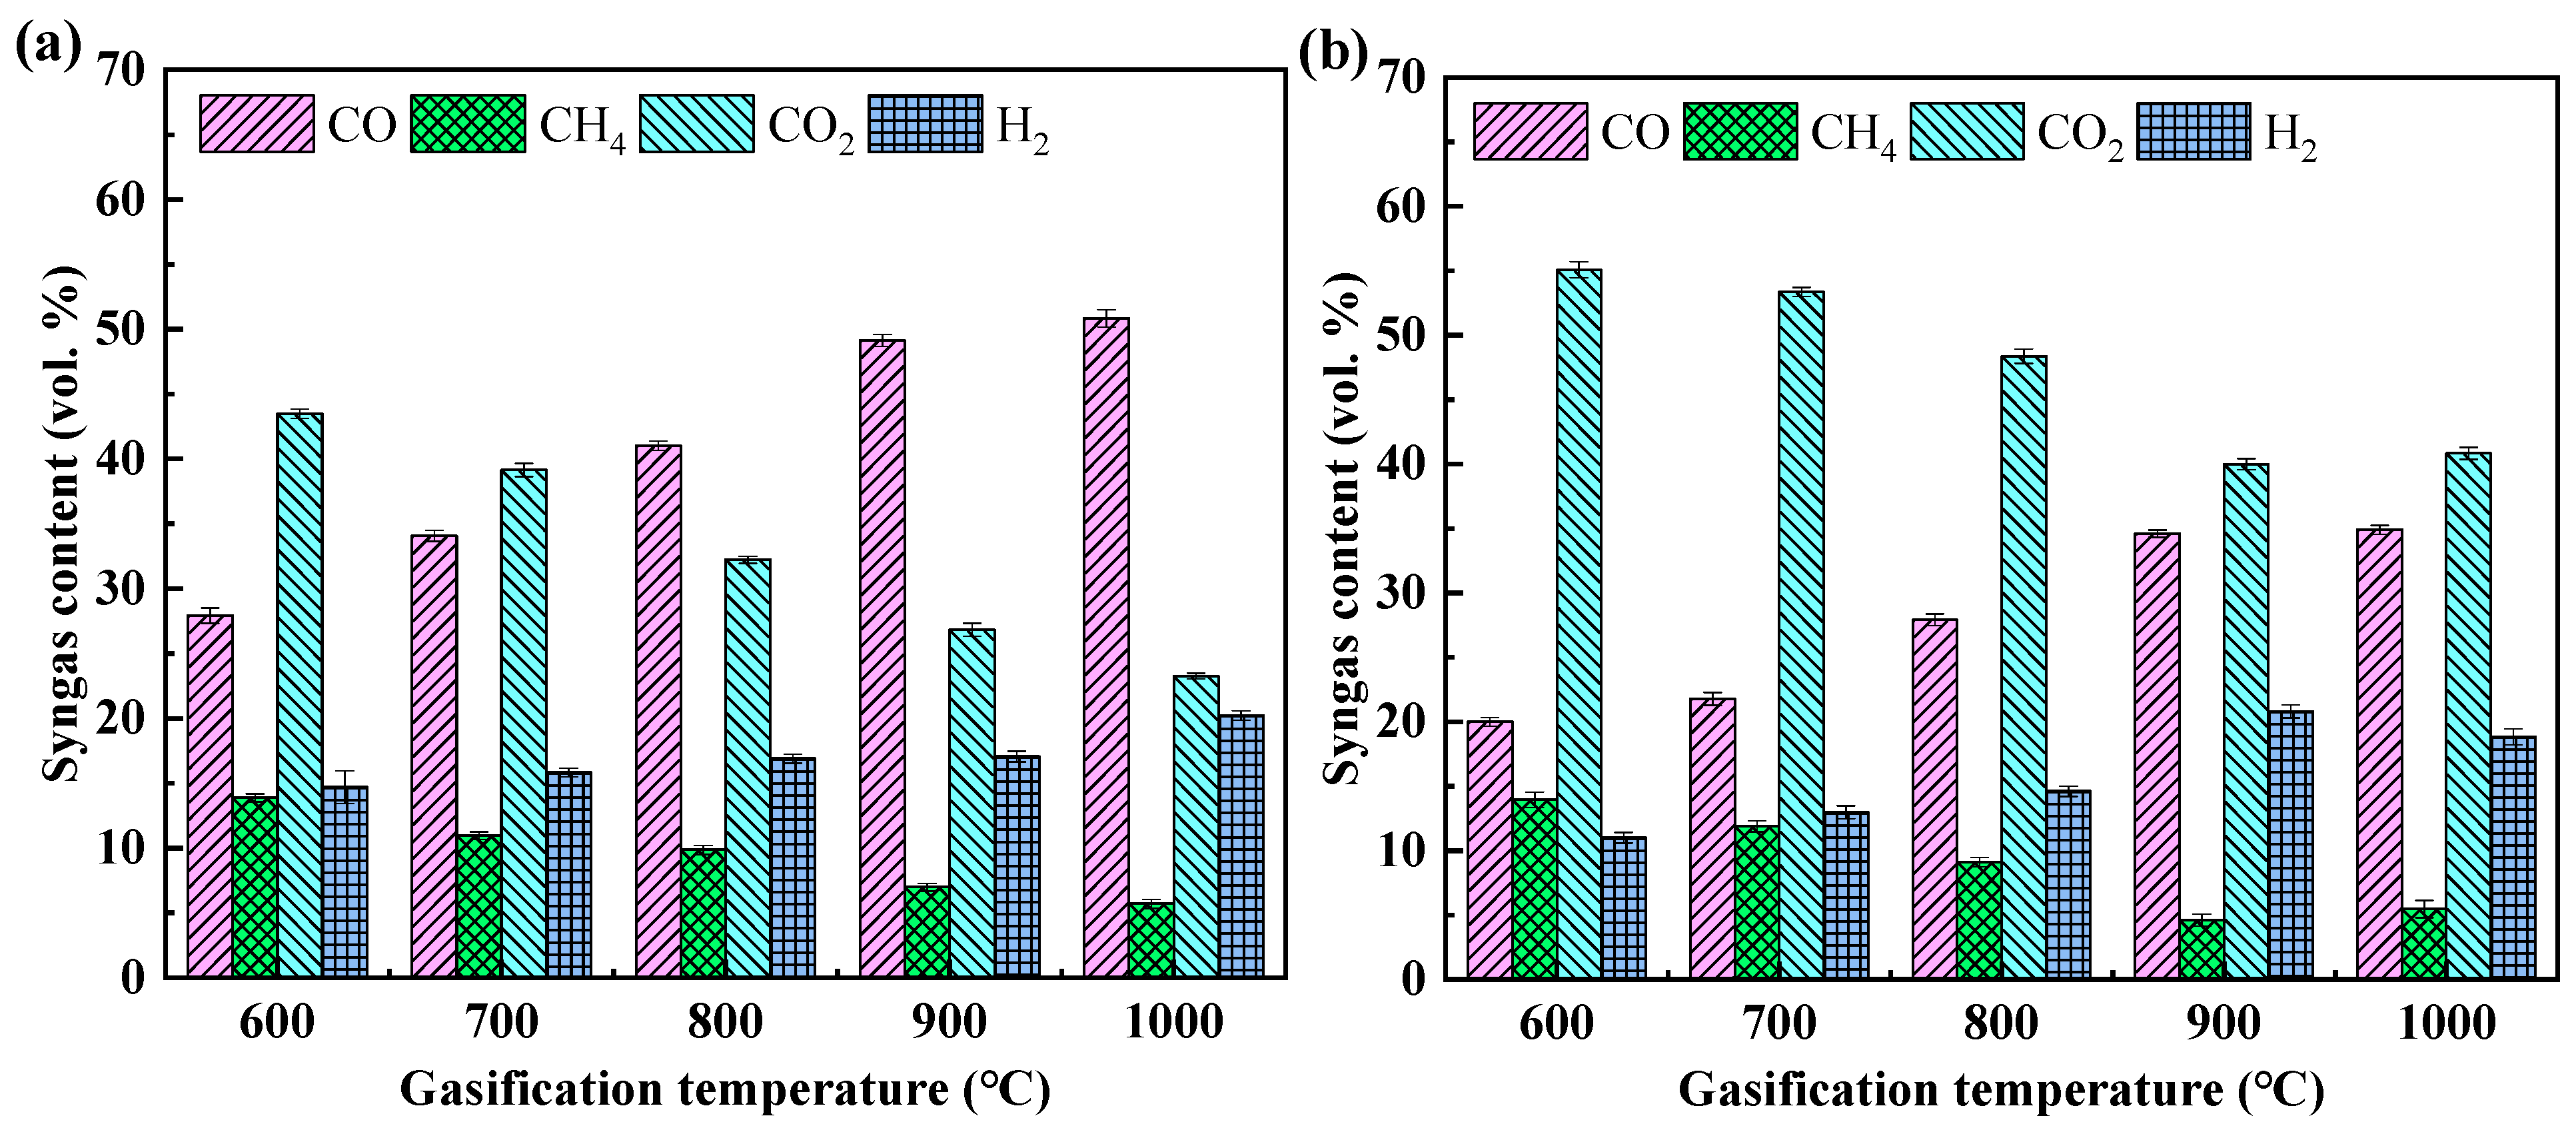
Figure 5.
Net calorific values of oak (a) and corn stalk (b) gas derived from MG and EG.
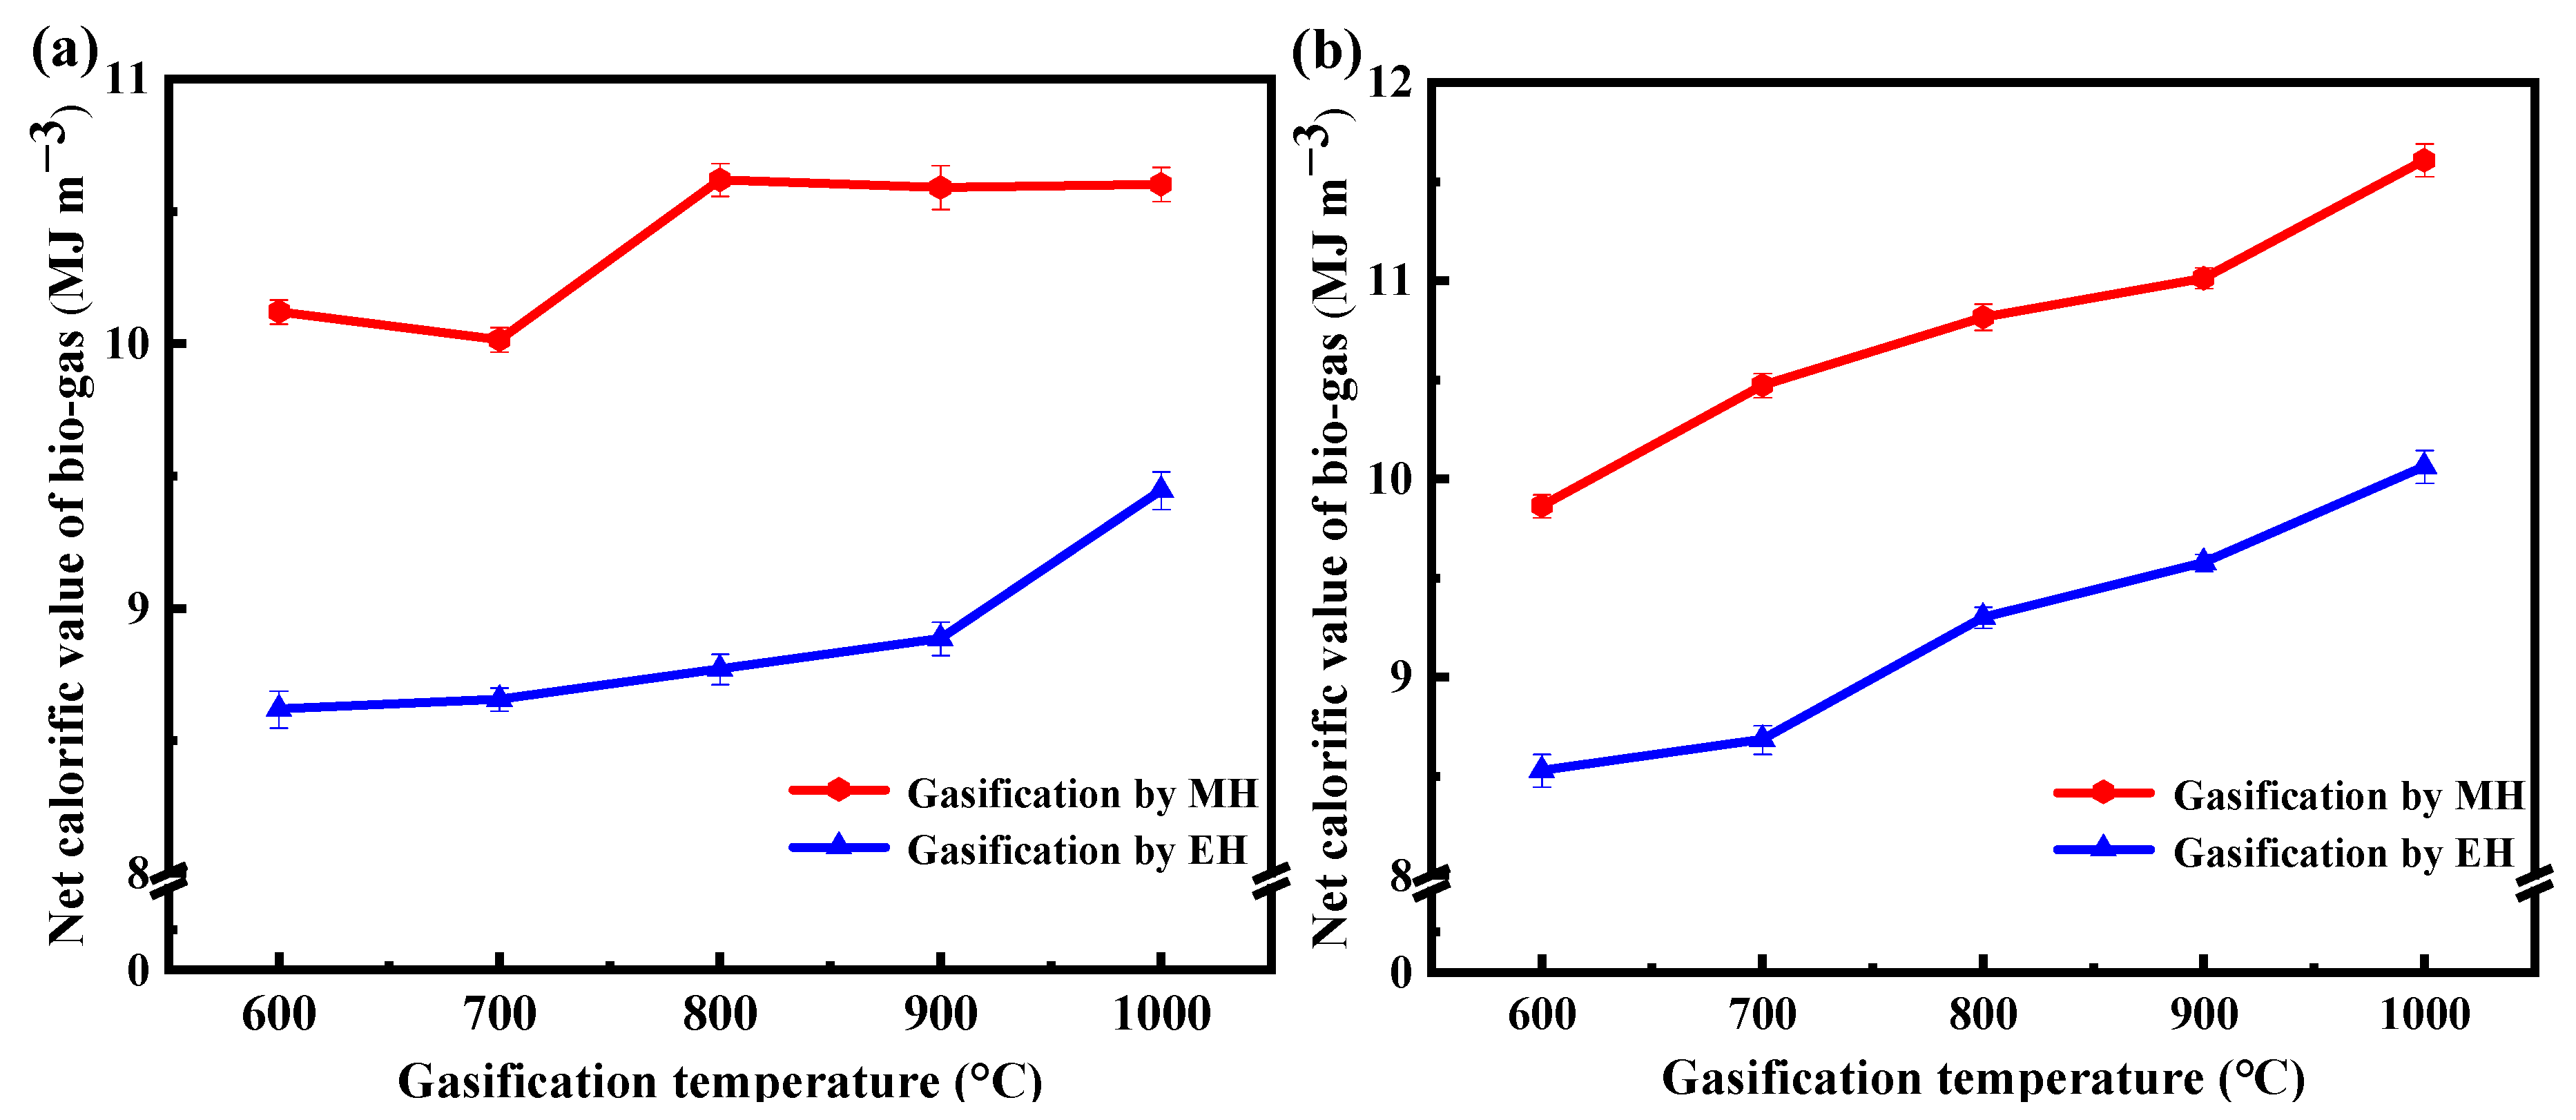
Figure 6.
Tar component distribution from corn stalk (a) and oak (b) gasification.
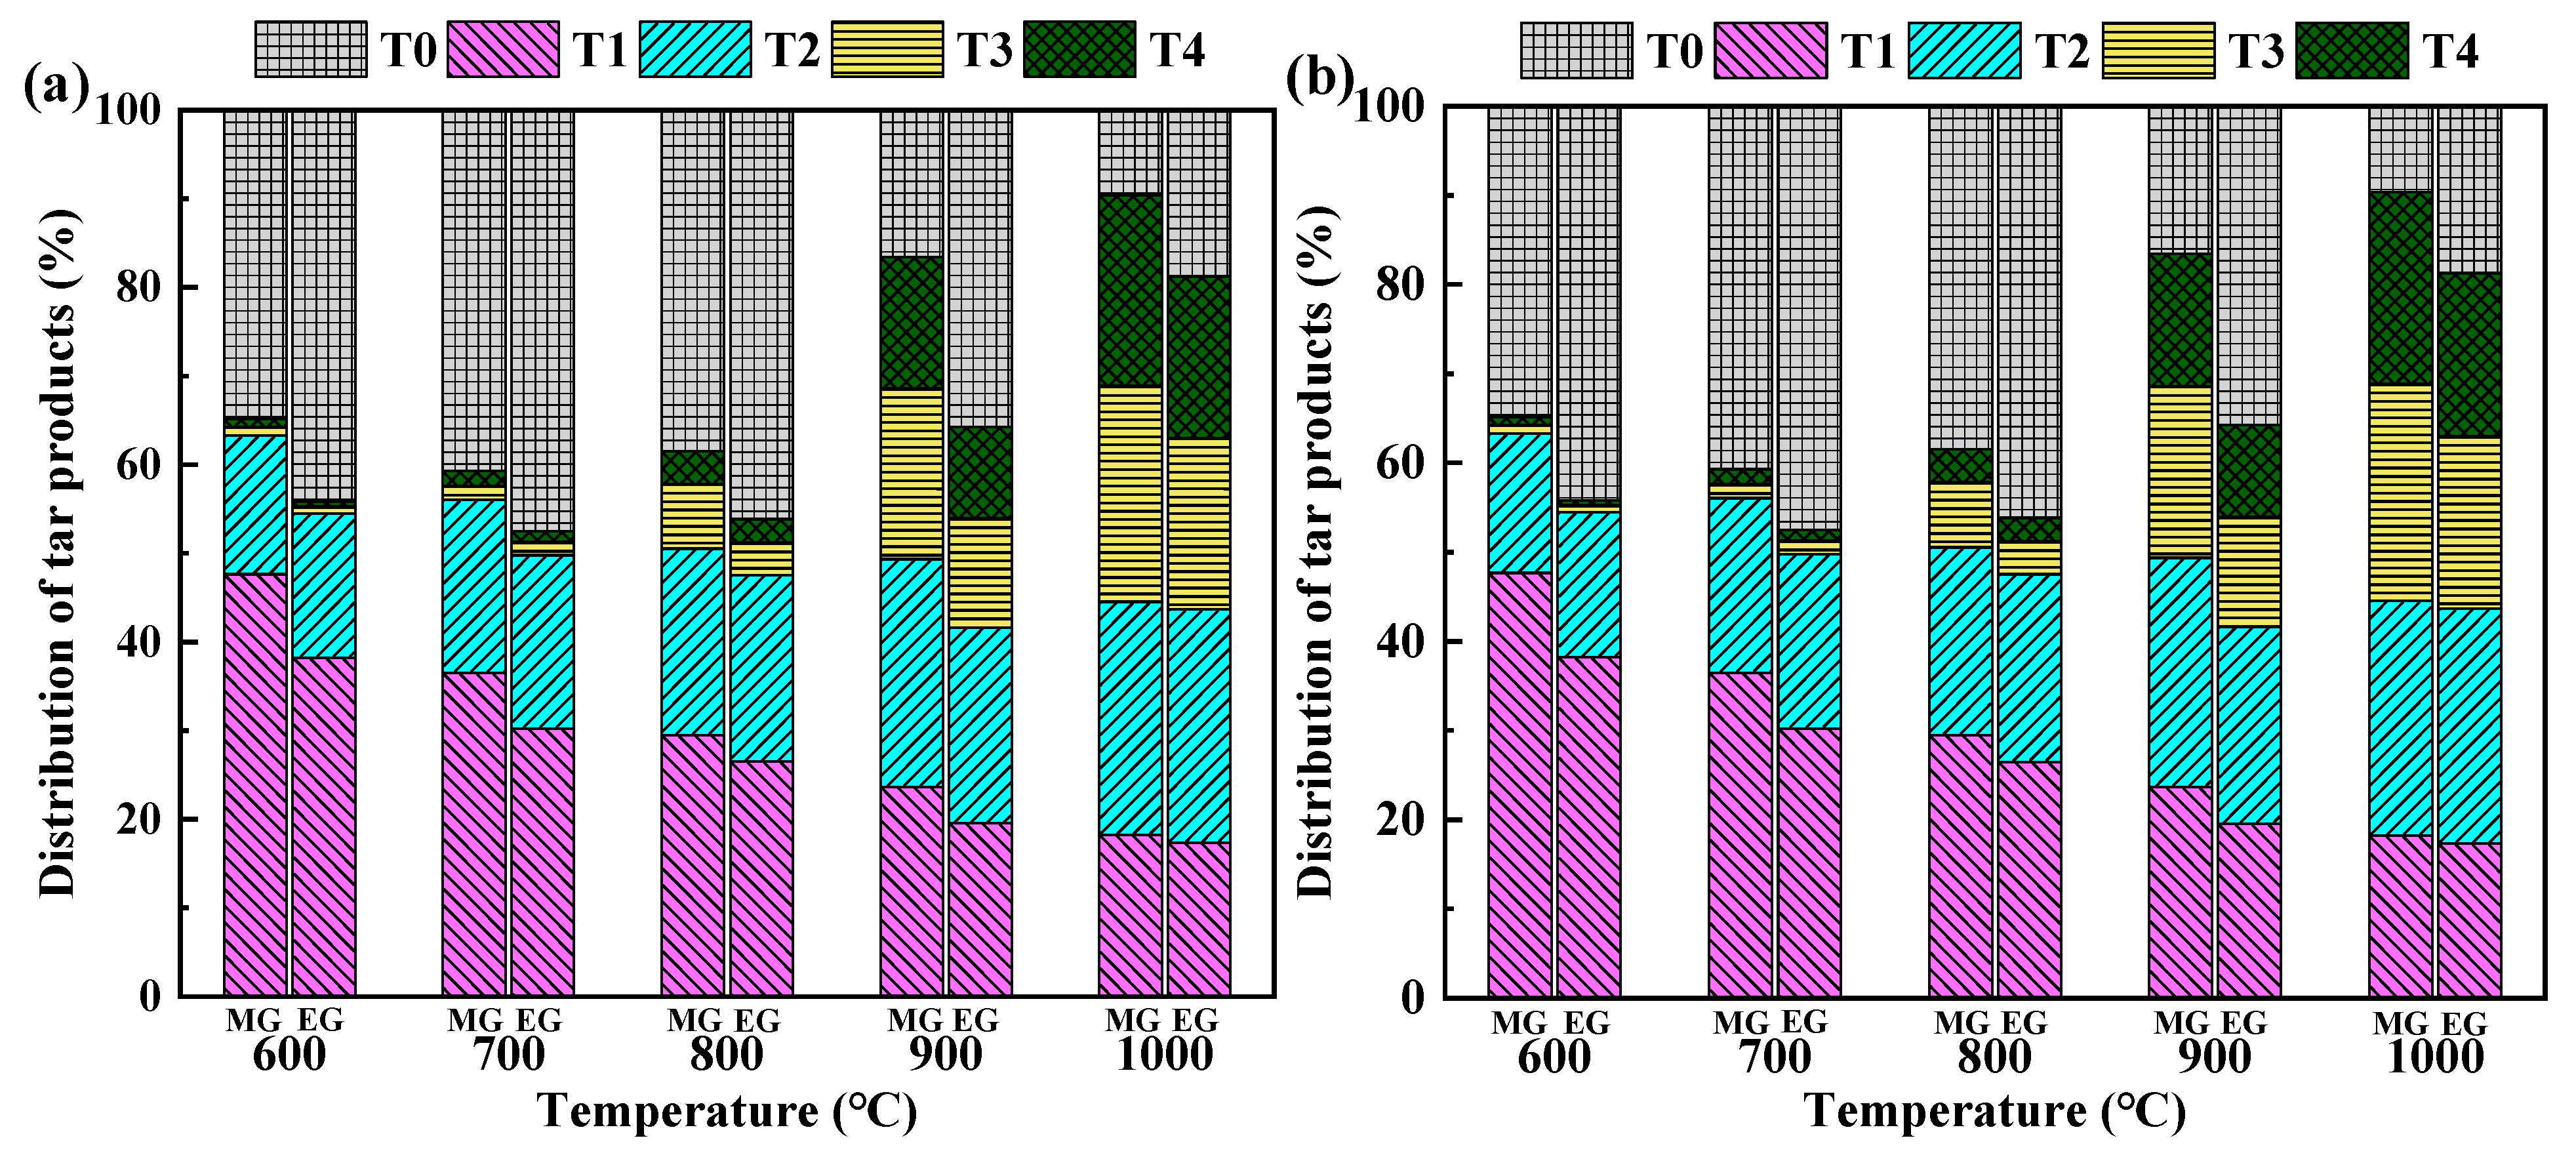
Figure 7.
SEM images of oak chars derived from MG and EG under different temperatures: (a) 600 °C MG, (b) 800 °C MG, (c) 1000 °C MG, (d) 600 °C EG, (e) 800 °C EG, and (f) 1000 °C EG.
Figure 7.
SEM images of oak chars derived from MG and EG under different temperatures: (a) 600 °C MG, (b) 800 °C MG, (c) 1000 °C MG, (d) 600 °C EG, (e) 800 °C EG, and (f) 1000 °C EG.
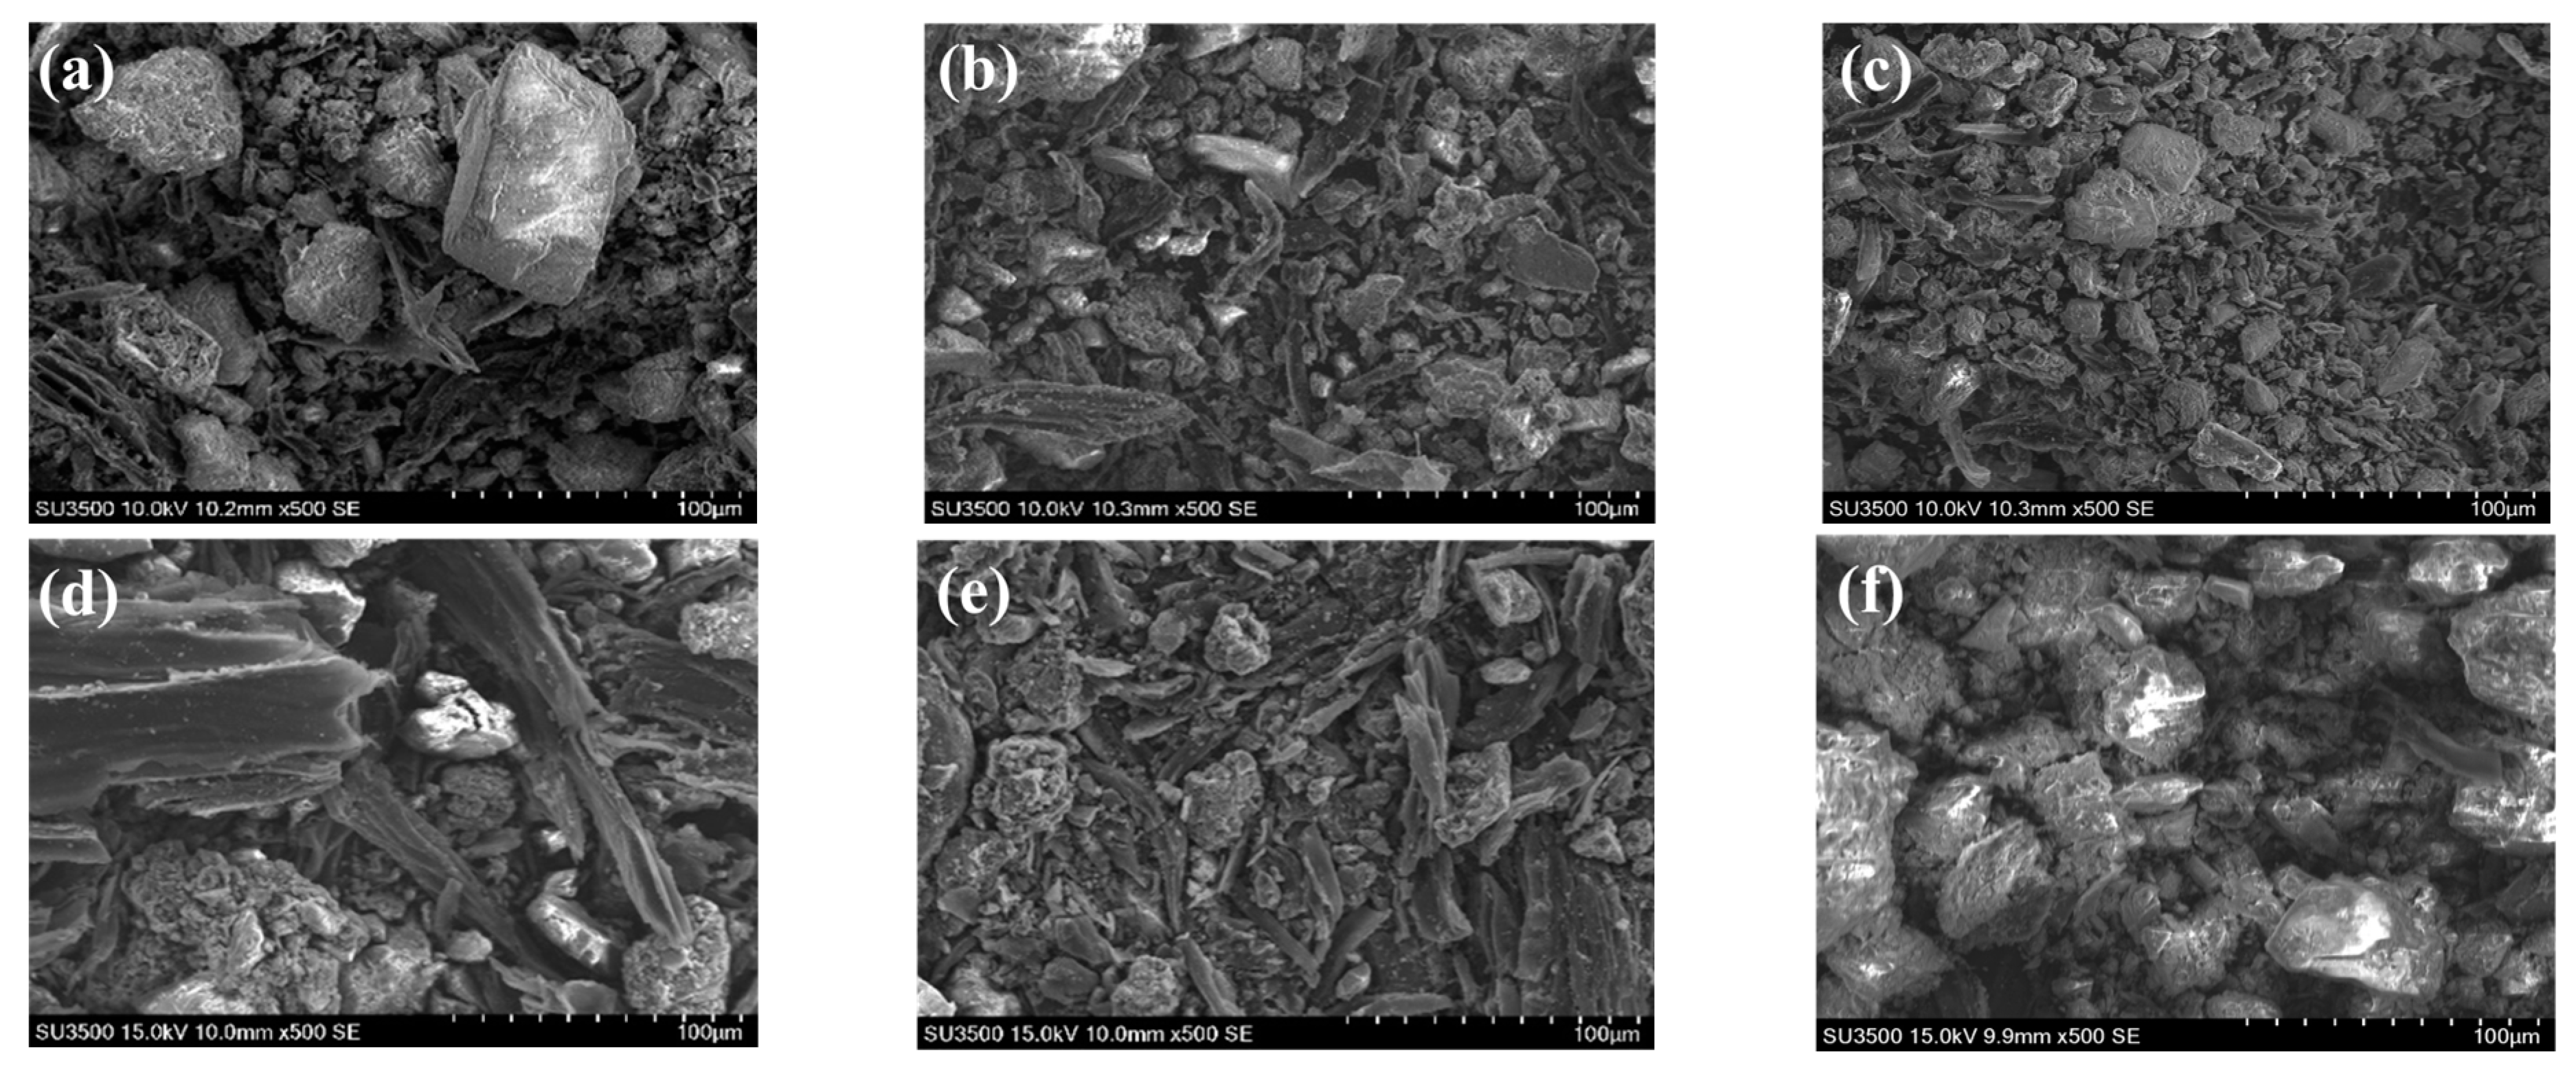
Figure 8.
SEM images of corn stalk chars derived from MG and EG under different temperatures: (a) 600 °C MG, (b) 800 °C MG, (c) 1000 °C MG, (d) 600 °C EG, (e) 800 °C EG, and (f) 1000 °C EG.
Figure 8.
SEM images of corn stalk chars derived from MG and EG under different temperatures: (a) 600 °C MG, (b) 800 °C MG, (c) 1000 °C MG, (d) 600 °C EG, (e) 800 °C EG, and (f) 1000 °C EG.

Figure 9.
FTIR characterization of oak chars derived from MG (a) and EG (b).
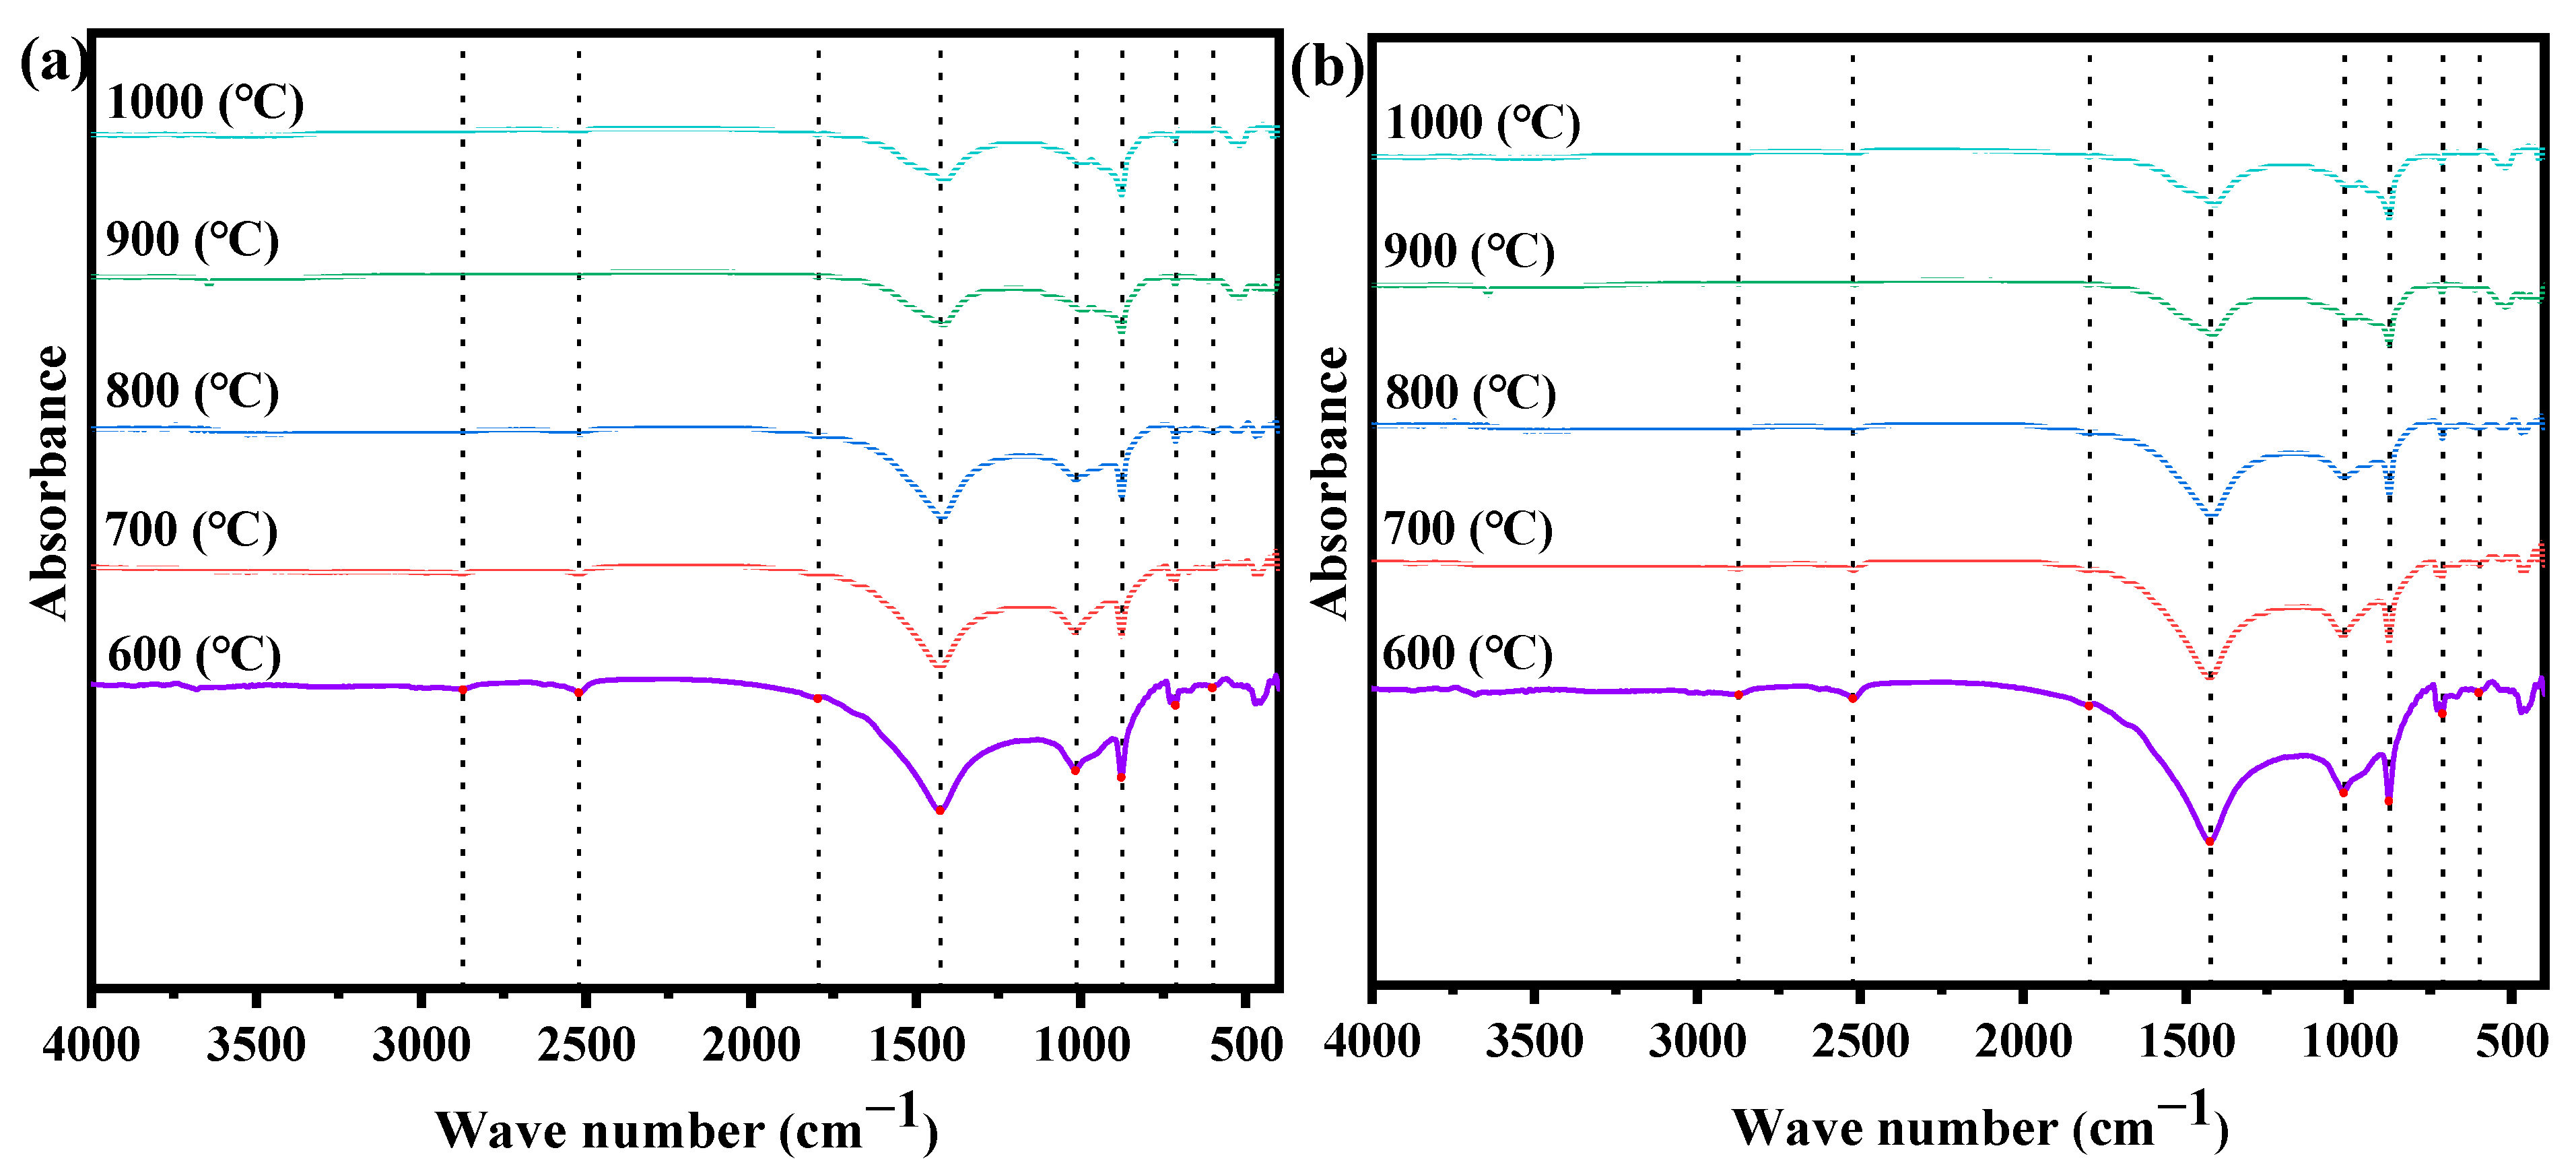
Figure 10.
FTIR characterization of corn stalk chars derived from MG (a) and EG (b).

Table 1.
Proximate and ultimate analyses of biomass samples (wt.%, ad).
| Samples | Proximate Analysis | Ultimate Analysis | |||||||
|---|---|---|---|---|---|---|---|---|---|
| w (FC) | w (V) | w (A) | w (M) | w (C) | w (H) | w (O) | w (N) | w (S) | |
| Oak | 9.43 | 56.54 | 32.65 | 1.38 | 29.60 | 3.01 | 32.84 | 0.48 | 0.04 |
| Corn stalk | 17.49 | 64.19 | 8.80 | 9.52 | 40.34 | 4.63 | 35.36 | 1.17 | 0.18 |
Table 2.
Ash composition analyses of oak and corn stalk (wt.%).
| Compounds of Inorganics | Analysis Standard | Oak | Corn Stalk | |
|---|---|---|---|---|
| Ash analysis | Fe2O3 | GB/T 30725-2014 [50] | 3.87 | 3.67 |
| Al2O3 | 6.17 | 7.69 | ||
| CaO | 20.58 | 18.43 | ||
| MgO | 0.01 | 4.07 | ||
| SiO2 | 36.14 | 46.14 | ||
| TiO2 | 0.37 | 0.50 | ||
| SO3 | 1.45 | 1.65 | ||
| K2O | 0.05 | 5.09 | ||
| Na2O | 0.05 | 2.35 | ||
| P2O5 | 0.95 | 1.49 | ||
| MnO2 | 0.02 | 0.49 |
Table 3.
Cellulose, hemicellulose, and lignin content of biomass samples.
| Samples | Cellulose | Hemicellulose | Lignin |
|---|---|---|---|
| Corn stalk | 36.5% | 34.9% | 18.8% |
| Oak | 44.9% | 21.5% | 29.3% |
Table 4.
Carbon conversion from feedstock (ηc, %).
| Name | Carbon Conversion (ηc, %) | ||||
|---|---|---|---|---|---|
| 600 °C | 700 °C | 800 °C | 900 °C | 1000 °C | |
| CS MG | 63.62 | 69.85 | 73.26 | 80.37 | 72.76 |
| CS EG | 57.13 | 61.35 | 68.56 | 72.65 | 79.78 |
| O MG | 72.68 | 75.27 | 77.69 | 78.13 | 83.18 |
| O EG | 63.26 | 66.92 | 69.97 | 78.56 | 80.53 |
Table 5.
GC-MS results of oak tar derived from MG and EG.
| Compound Name | Relative Content (%) at Different Gasification Heating Temperatures (°C) | |||||||||
|---|---|---|---|---|---|---|---|---|---|---|
| 600 °C | 700 °C | 800 °C | 900 °C | 1000 °C | ||||||
| MG | EG | MG | EG | MG | EG | MG | EG | MG | EG | |
| Ethylbenzene | 2.24 | 3.03 | 2.53 | 2.55 | - | 1.21 | - | 1.33 | 1.72 | - |
| 1-Cyclohexene, 1-ethynyl- | 3.46 | 8.43 | 3.74 | 3.24 | 2.46 | 1.34 | - | 2.64 | 1.5 | 1.20 |
| Styrene | 3.87 | 10.59 | 5.15 | 7.10 | 4.75 | 9.25 | - | 9.34 | 3.22 | 8.16 |
| Benzene | - | 2.09 | - | 1.02 | 1.46 | 3.24 | 2.46 | 1.11 | - | 2.85 |
| 3-Methylphenylacetylene | 5.84 | 1.72 | 8.35 | 2.15 | 7.67 | 0.92 | 2.01 | 0.31 | 5.86 | - |
| Biphenylene | 2.35 | 6.31 | - | 4.25 | 1.28 | 2.89 | 2.08 | - | 2.14 | 1.62 |
| Hematoporphyrin | 2.02 | 1.02 | - | 3.24 | 1.52 | 1.11 | - | 4.07 | - | 1.28 |
| Rhodopin | - | 5.19 | - | 1.38 | 1.67 | 3.76 | 1.92 | 5.44 | - | 3.20 |
| 2-Pentanone | 3.06 | 4.14 | - | 2.56 | 4.97 | - | 7.15 | 1.48 | - | 1.50 |
Table 6.
GC-MS results of corn stalk tar derived from MG and EG.
| Compound Name | Relative Content (%) at Different Gasification Heating Temperatures (°C) | |||||||||
|---|---|---|---|---|---|---|---|---|---|---|
| 600 °C | 700 °C | 800 °C | 900 °C | 1000 °C | ||||||
| MG | EG | MG | EG | MG | EG | MG | EG | MG | EG | |
| Phenylephrine | - | - | 0.85 | 1.25 | - | 1.82 | 3.73 | 3.73 | - | - |
| Biphenyl | 1.73 | - | 1.36 | - | 1.68 | 1.58 | 2.52 | 2.01 | - | 2.58 |
| Biphenylene | - | - | 1.68 | - | 8.11 | 2.11 | 4.34 | 4.34 | 5.23 | 5.23 |
| Hematoporphyrin | 0.52 | 3.03 | - | 3.03 | 0.25 | 2.55 | - | 1.21 | 2.33 | 1.33 |
| Tricarbonyl | 4.62 | 1.25 | 2.58 | 1.25 | 4.52 | - | - | 2.58 | 0.48 | 1.52 |
| 3′H-Cycloprop (1,2)-5-coolest-1-en-3-one | 1.44 | 1.44 | 8.43 | 8.43 | 3.24 | 3.24 | 1.34 | 1.34 | 2.64 | 2.64 |
| Hexadecanamide | 2.02 | 2.02 | 2.25 | 2.25 | 2.15 | 2.15 | 3.7 | 3.7 | 1.79 | 1.79 |
| 2-Pentanone | 5.19 | 5.19 | - | - | 1.92 | 1.92 | 1.86 | 1.86 | 1.98 | 1.98 |
| Toluene | 4.21 | 4.21 | 2.09 | 2.09 | 1.02 | 1.02 | 3.24 | 3.24 | 1.11 | 1.32 |
| Furfural | - | - | 3.43 | 3.43 | 3.66 | 3.66 | 4.95 | 4.95 | 4.42 | 4.42 |
| 1,2,4,5-Tetrazine | 3.17 | 3.17 | 1.72 | 1.72 | 2.10 | 2.15 | 0.9 | 1.20 | 0.32 | 2.38 |
| Methoxystyrene | 1.01 | - | - | 1.85 | 0.54 | 0.54 | 2.40 | - | - | 1.66 |
Table 7.
SEM-EDS analysis of oak chars derived from MG and EG.
| EDS | Content (wt.%) | ||||||
|---|---|---|---|---|---|---|---|
| w (C) | w (O) | w (Mg) | w (Ca) | w (K) | w (Al) | w (Si) | |
| Spot 1 | 31.67 | 22.05 | 15.04 | 29.35 | - | - | 1.89 |
| Spot 2 | 7.58 | 22.04 | 17.63 | 22.19 | - | - | 24.62 |
| Spot 3 | 3.42 | 30.98 | 16.44 | 36.63 | - | 1.00 | 11.53 |
| Spot 4 | 58.45 | 23.64. | 4.36 | 9.42 | 0.49 | 0.39 | 3.25 |
| Spot 5 | 15.07 | 47.74 | 2.89 | 0.93 | 5.87 | 10.26 | 17.25 |
| Spot 6 | 4.93 | 35.60 | 5.40 | 48.90 | - | 0.91 | 4.27 |
Table 8.
SEM-EDS analysis of corn stalk chars derived from MG and EG.
| EDS | Content (wt.%) | ||||||
|---|---|---|---|---|---|---|---|
| w (C) | w (O) | w (Mg) | w (Ca) | w (K) | w (Si) | w (P) | |
| Spot 1 | 28.04 | 23.60 | 4.18 | - | 14.03 | 20.60 | 9.55 |
| Spot 2 | 8.02 | 39.10 | - | - | 1.36 | 51.52 | - |
| Spot 3 | 4.12 | 34.68 | - | - | - | 61.21 | - |
| Spot 4 | 39.79 | 33.54 | 0.39 | 0.31 | 1.68 | 23.73 | 0.06 |
| Spot 5 | 23.39 | 40.74 | - | - | 1.07 | 34.80 | - |
| Spot 6 | 4.65 | 50.27 | - | - | 0.3 | 44.78 | - |
Table 9.
Specific surface area, total pore volume, and average pore size of oak and corn stalk chars derived from EG and MG.
Table 9.
Specific surface area, total pore volume, and average pore size of oak and corn stalk chars derived from EG and MG.
| Name | BET (m2 g−1) | Total Pure Volume (cm3 g−1) | Average Pore Diameter (nm) | |||
|---|---|---|---|---|---|---|
| Samples | Oak Chars | Corn Stalk Chars | Oak Chars | Corn Stalk Chars | Oak Chars | Corn Stalk Chars |
| MG (°C) | ||||||
| 600 | 289.54 ± 9.22 | 452.25 ± 10.25 | 0.32 ± 0.06 | 0.32 ± 0.04 | 3.52 ± 0.19 | 3.92 ± 0.21 |
| 700 | 355.52 ± 7.21 | 481.25 ± 6.82 | 0.45 ± 0.03 | 0.42 ± 0.03 | 3.82 ± 0.28 | 4.03 ± 0.15 |
| 800 | 485.02 ± 7.35 | 512.32 ± 11.21 | 0.48 ± 0.04 | 0.52 ± 0.03 | 4.35 ± 0.30 | 4.18 ± 0.32 |
| 900 | 426.52 ± 5.29 | 525.87 ± 8.22 | 0.46 ± 0.02 | 0.62 ± 0.02 | 4.38 ± 0.42 | 4.23 ± 0.22 |
| 1000 | 385.25 ± 9.47 | 489.58 ± 7.56 | 0.42 ± 0.05 | 0.45 ± 0.04 | 4.25 ± 0.25 | 4.20 ± 0.45 |
| EG (°C) | ||||||
| 600 | 264.54 ± 11.25 | 312.25 ± 8.54 | 0.21 ± 0.03 | 0.18 ± 0.02 | 3.12 ± 0.41 | 3.65 ± 0.35 |
| 700 | 306.52 ± 6.74 | 408.26 ± 7.20 | 0.34 ± 0.04 | 0.26 ± 0.05 | 3.43 ± 0.36 | 2.59 ± 0.33 |
| 800 | 368.96 ± 8.96 | 481.31 ± 12.35 | 0.39 ± 0.04 | 0.38 ± 0.03 | 4.16 ± 0.33 | 3.21 ± 0.41 |
| 900 | 326.62 ± 10.11 | 502.52 ± 9.57 | 0.37 ± 0.06 | 0.51 ± 0.04 | 4.22 ± 0.27 | 3.53 ± 0.25 |
| 1000 | 225.25 ± 6.52 | 423.45 ± 10.52 | 0.25 ± 0.05 | 0.35 ± 0.05 | 4.24 ± 0.25 | 3.22 ± 0.37 |
Disclaimer/Publisher’s Note: The statements, opinions and data contained in all publications are solely those of the individual author(s) and contributor(s) and not of MDPI and/or the editor(s). MDPI and/or the editor(s) disclaim responsibility for any injury to people or property resulting from any ideas, methods, instructions or products referred to in the content. |
© 2023 by the authors. Licensee MDPI, Basel, Switzerland. This article is an open access article distributed under the terms and conditions of the Creative Commons Attribution (CC BY) license (https://creativecommons.org/licenses/by/4.0/).
Share and Cite
MDPI and ACS Style
Yue, Y.; Jin, X.; Deng, L. Experimental Study on Properties of Syngas, Tar, and Biochar Derived from Different Gasification Methods. Appl. Sci. 2023, 13, 11490. https://doi.org/10.3390/app132011490
AMA Style
Yue Y, Jin X, Deng L. Experimental Study on Properties of Syngas, Tar, and Biochar Derived from Different Gasification Methods. Applied Sciences. 2023; 13(20):11490. https://doi.org/10.3390/app132011490
Chicago/Turabian StyleYue, Yang, Xiaoling Jin, and Lei Deng. 2023. "Experimental Study on Properties of Syngas, Tar, and Biochar Derived from Different Gasification Methods" Applied Sciences 13, no. 20: 11490. https://doi.org/10.3390/app132011490
Note that from the first issue of 2016, this journal uses article numbers instead of page numbers. See further details here.