
Evaluating the Ileal and Cecal Microbiota Composition of a 1940 Heritage Genetic Line and a 2016 Commercial Line of white Leghorns Fed Representative Diets from 1940 to 2016
 , ,
, ,
Abstract
:1. Introduction
2. Materials and Methods
2.1. Bird Management and Diet
2.2. Ileum and Cecal Sample Collection
Microbiome Analysis: 16S rDNA Sequencing
2.3. Statistical and Bioinformatics Analysis
3. Results
3.1. Alpha Diversity
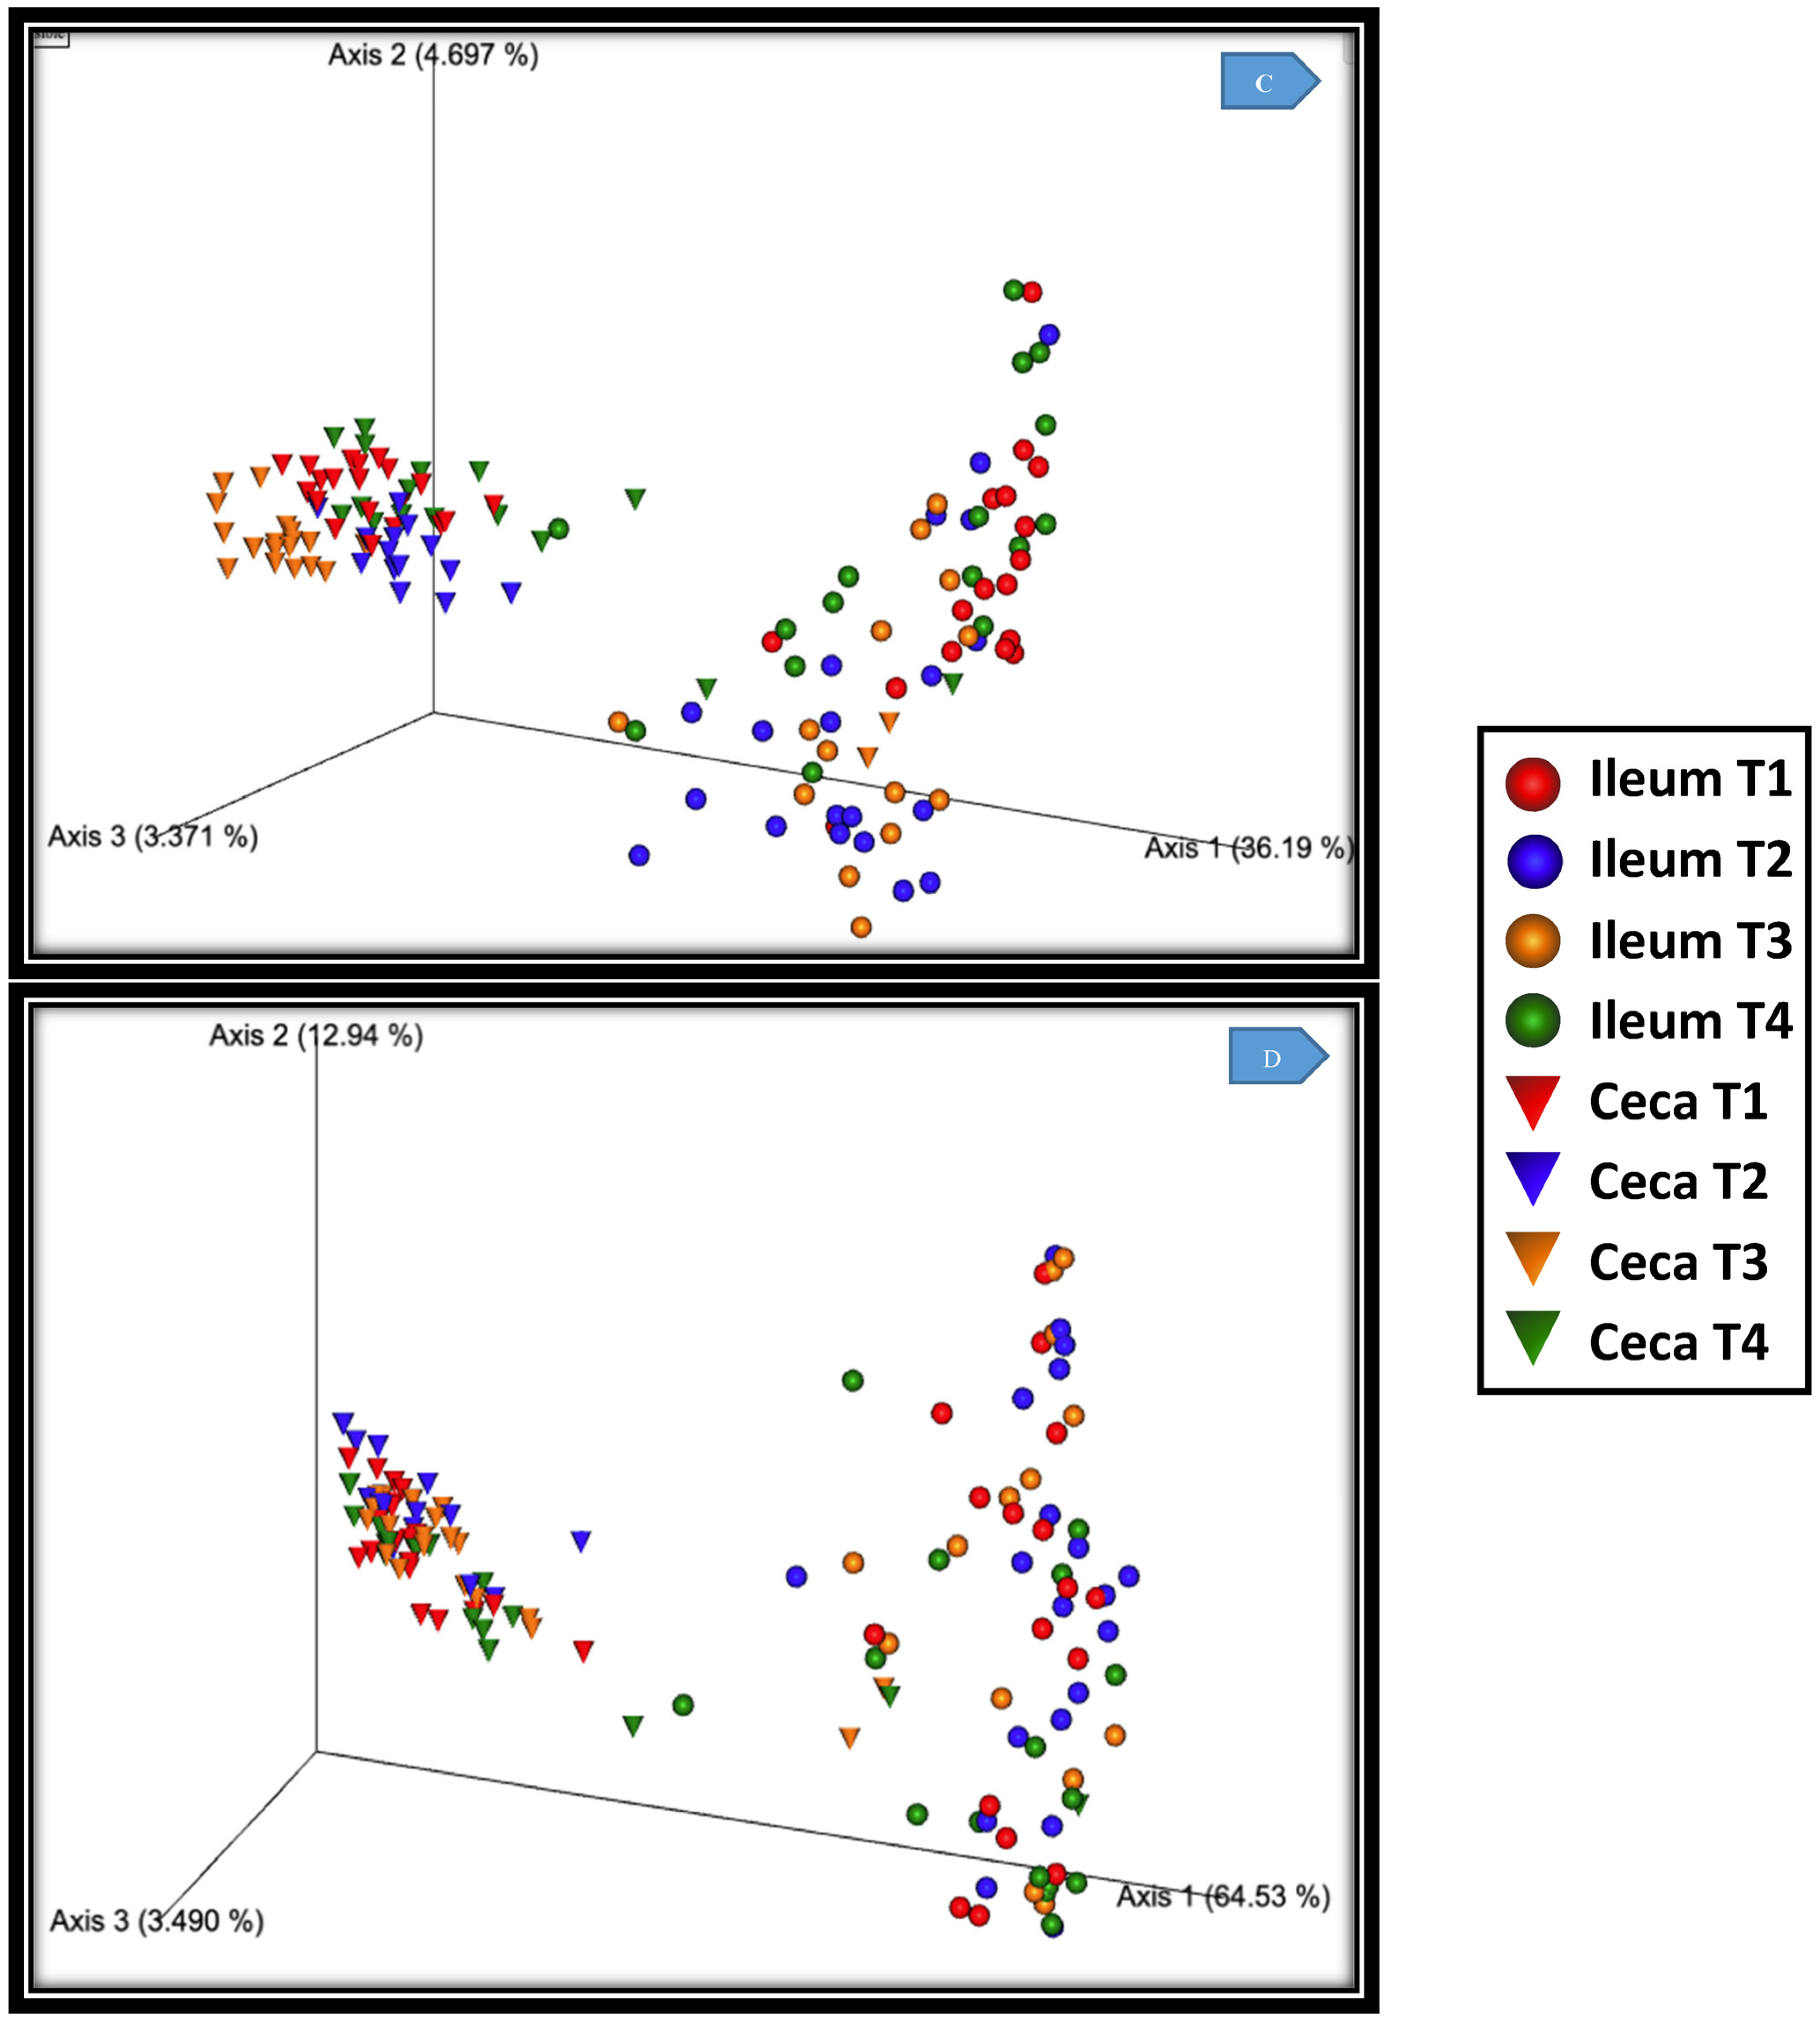
3.2. Beta Diversity
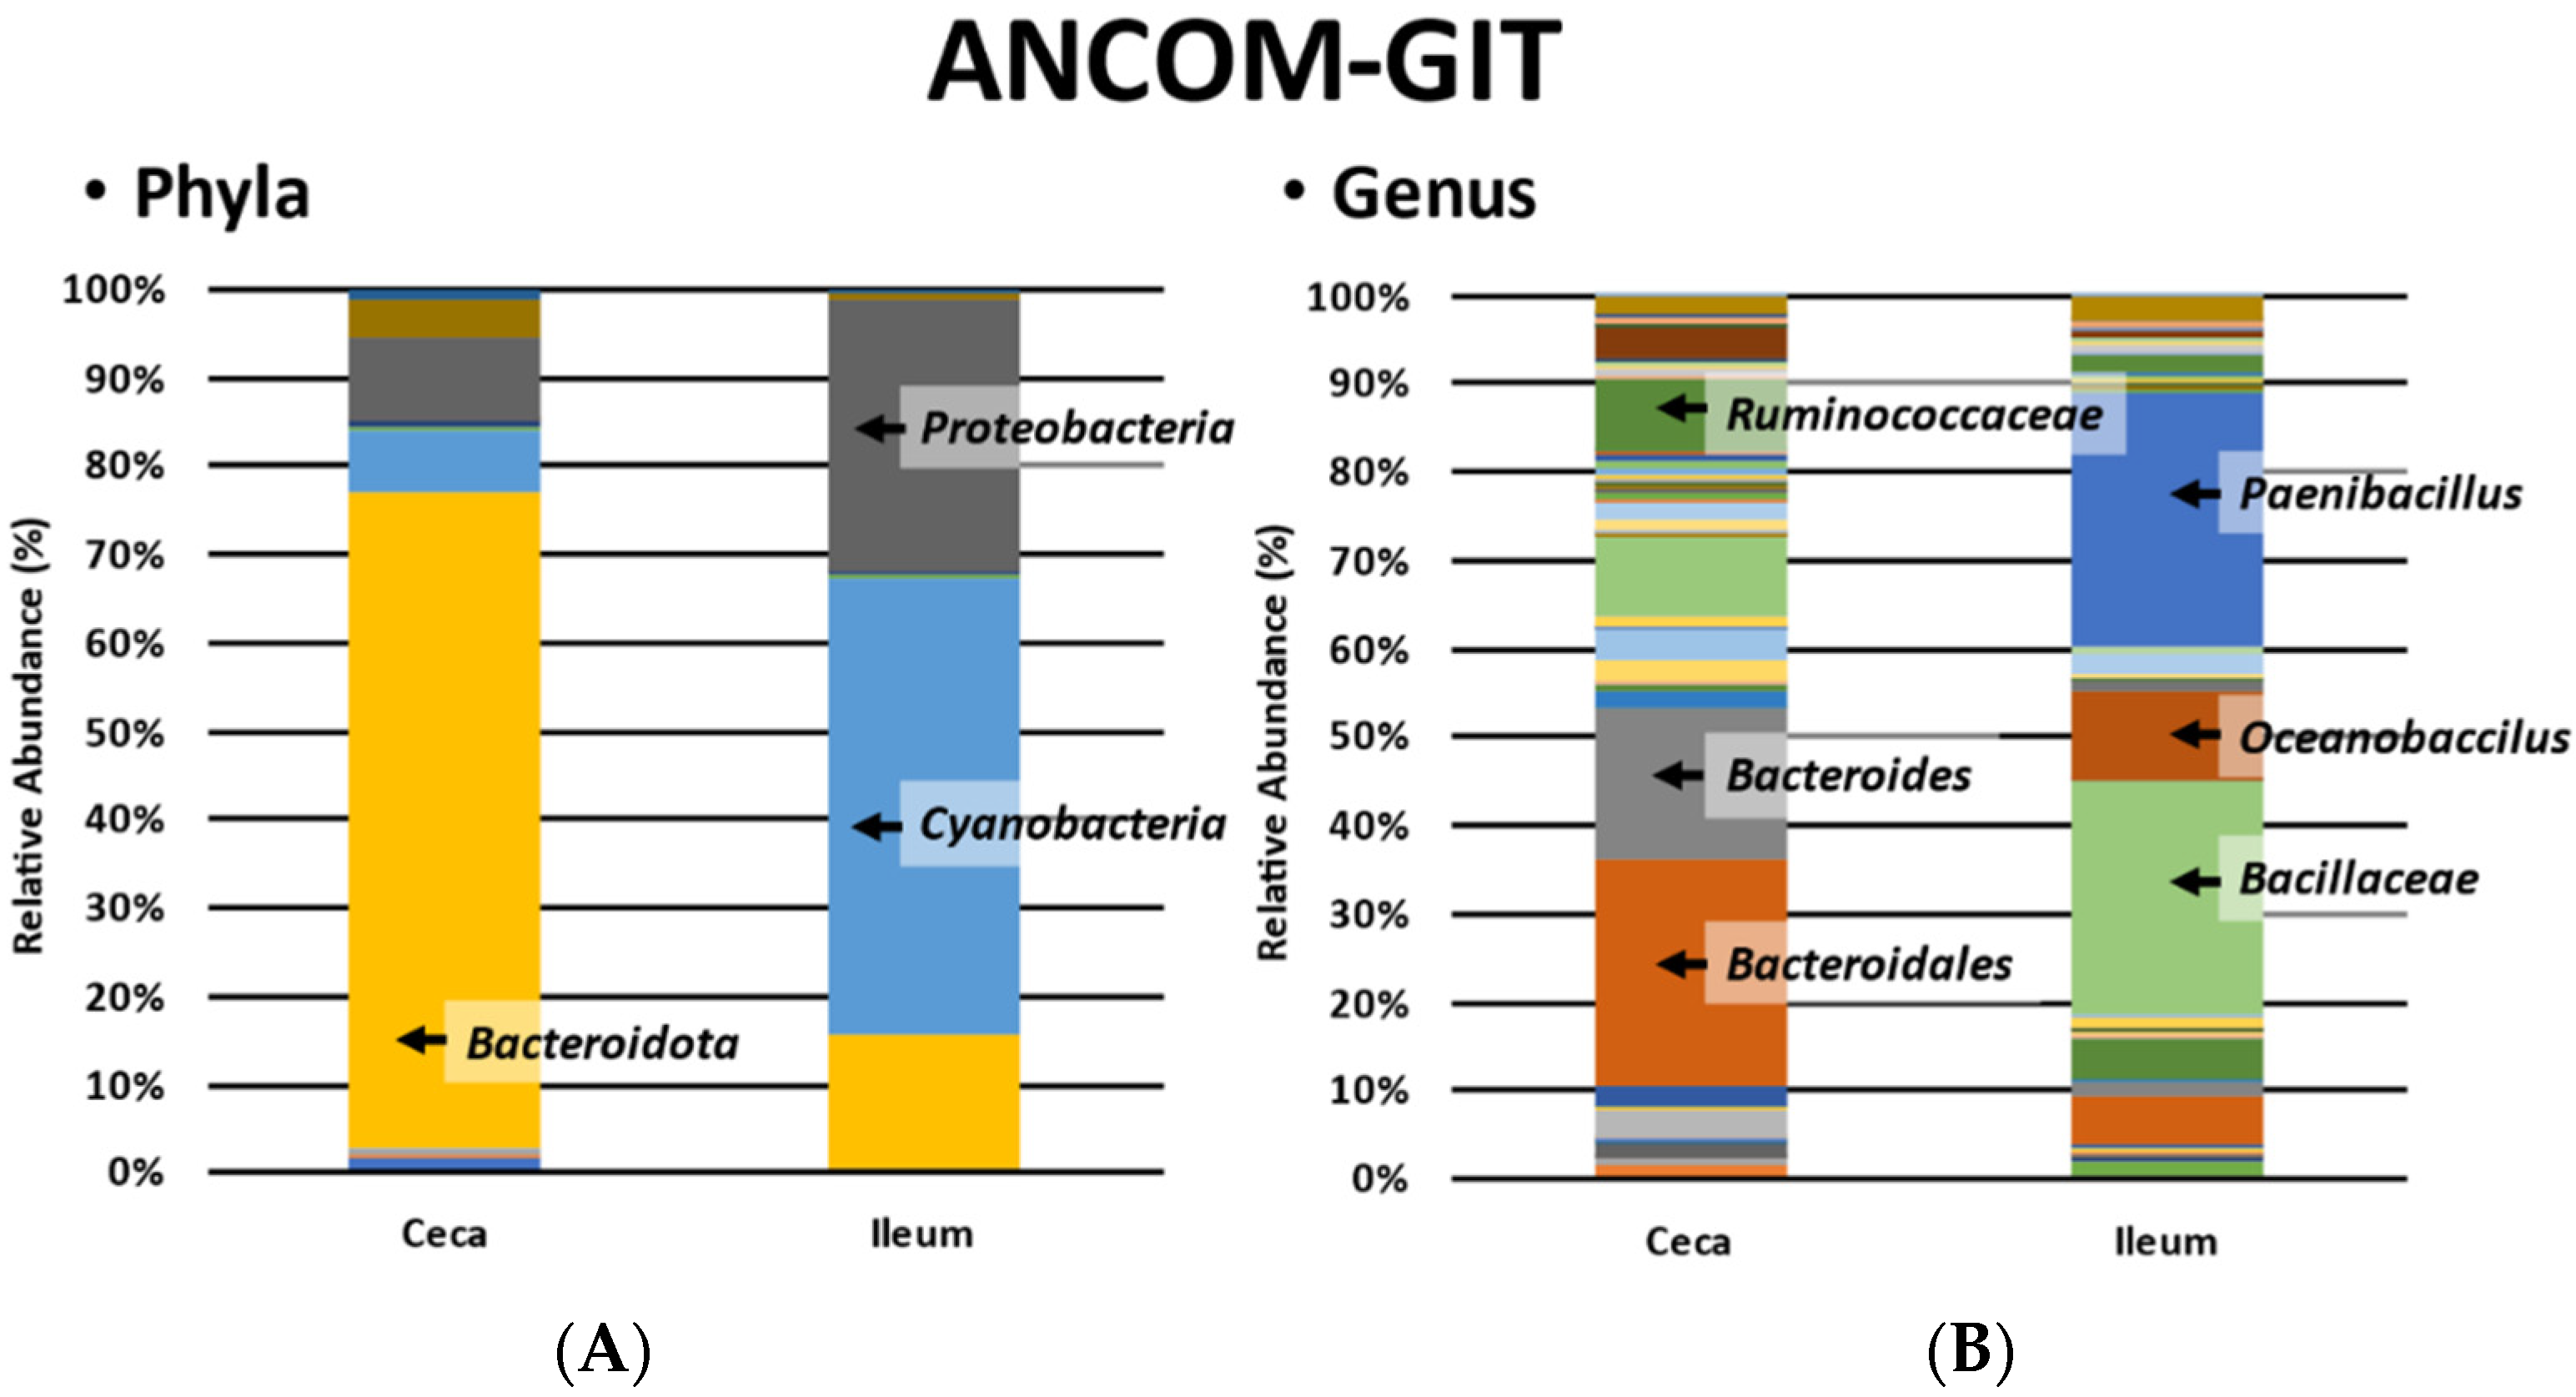
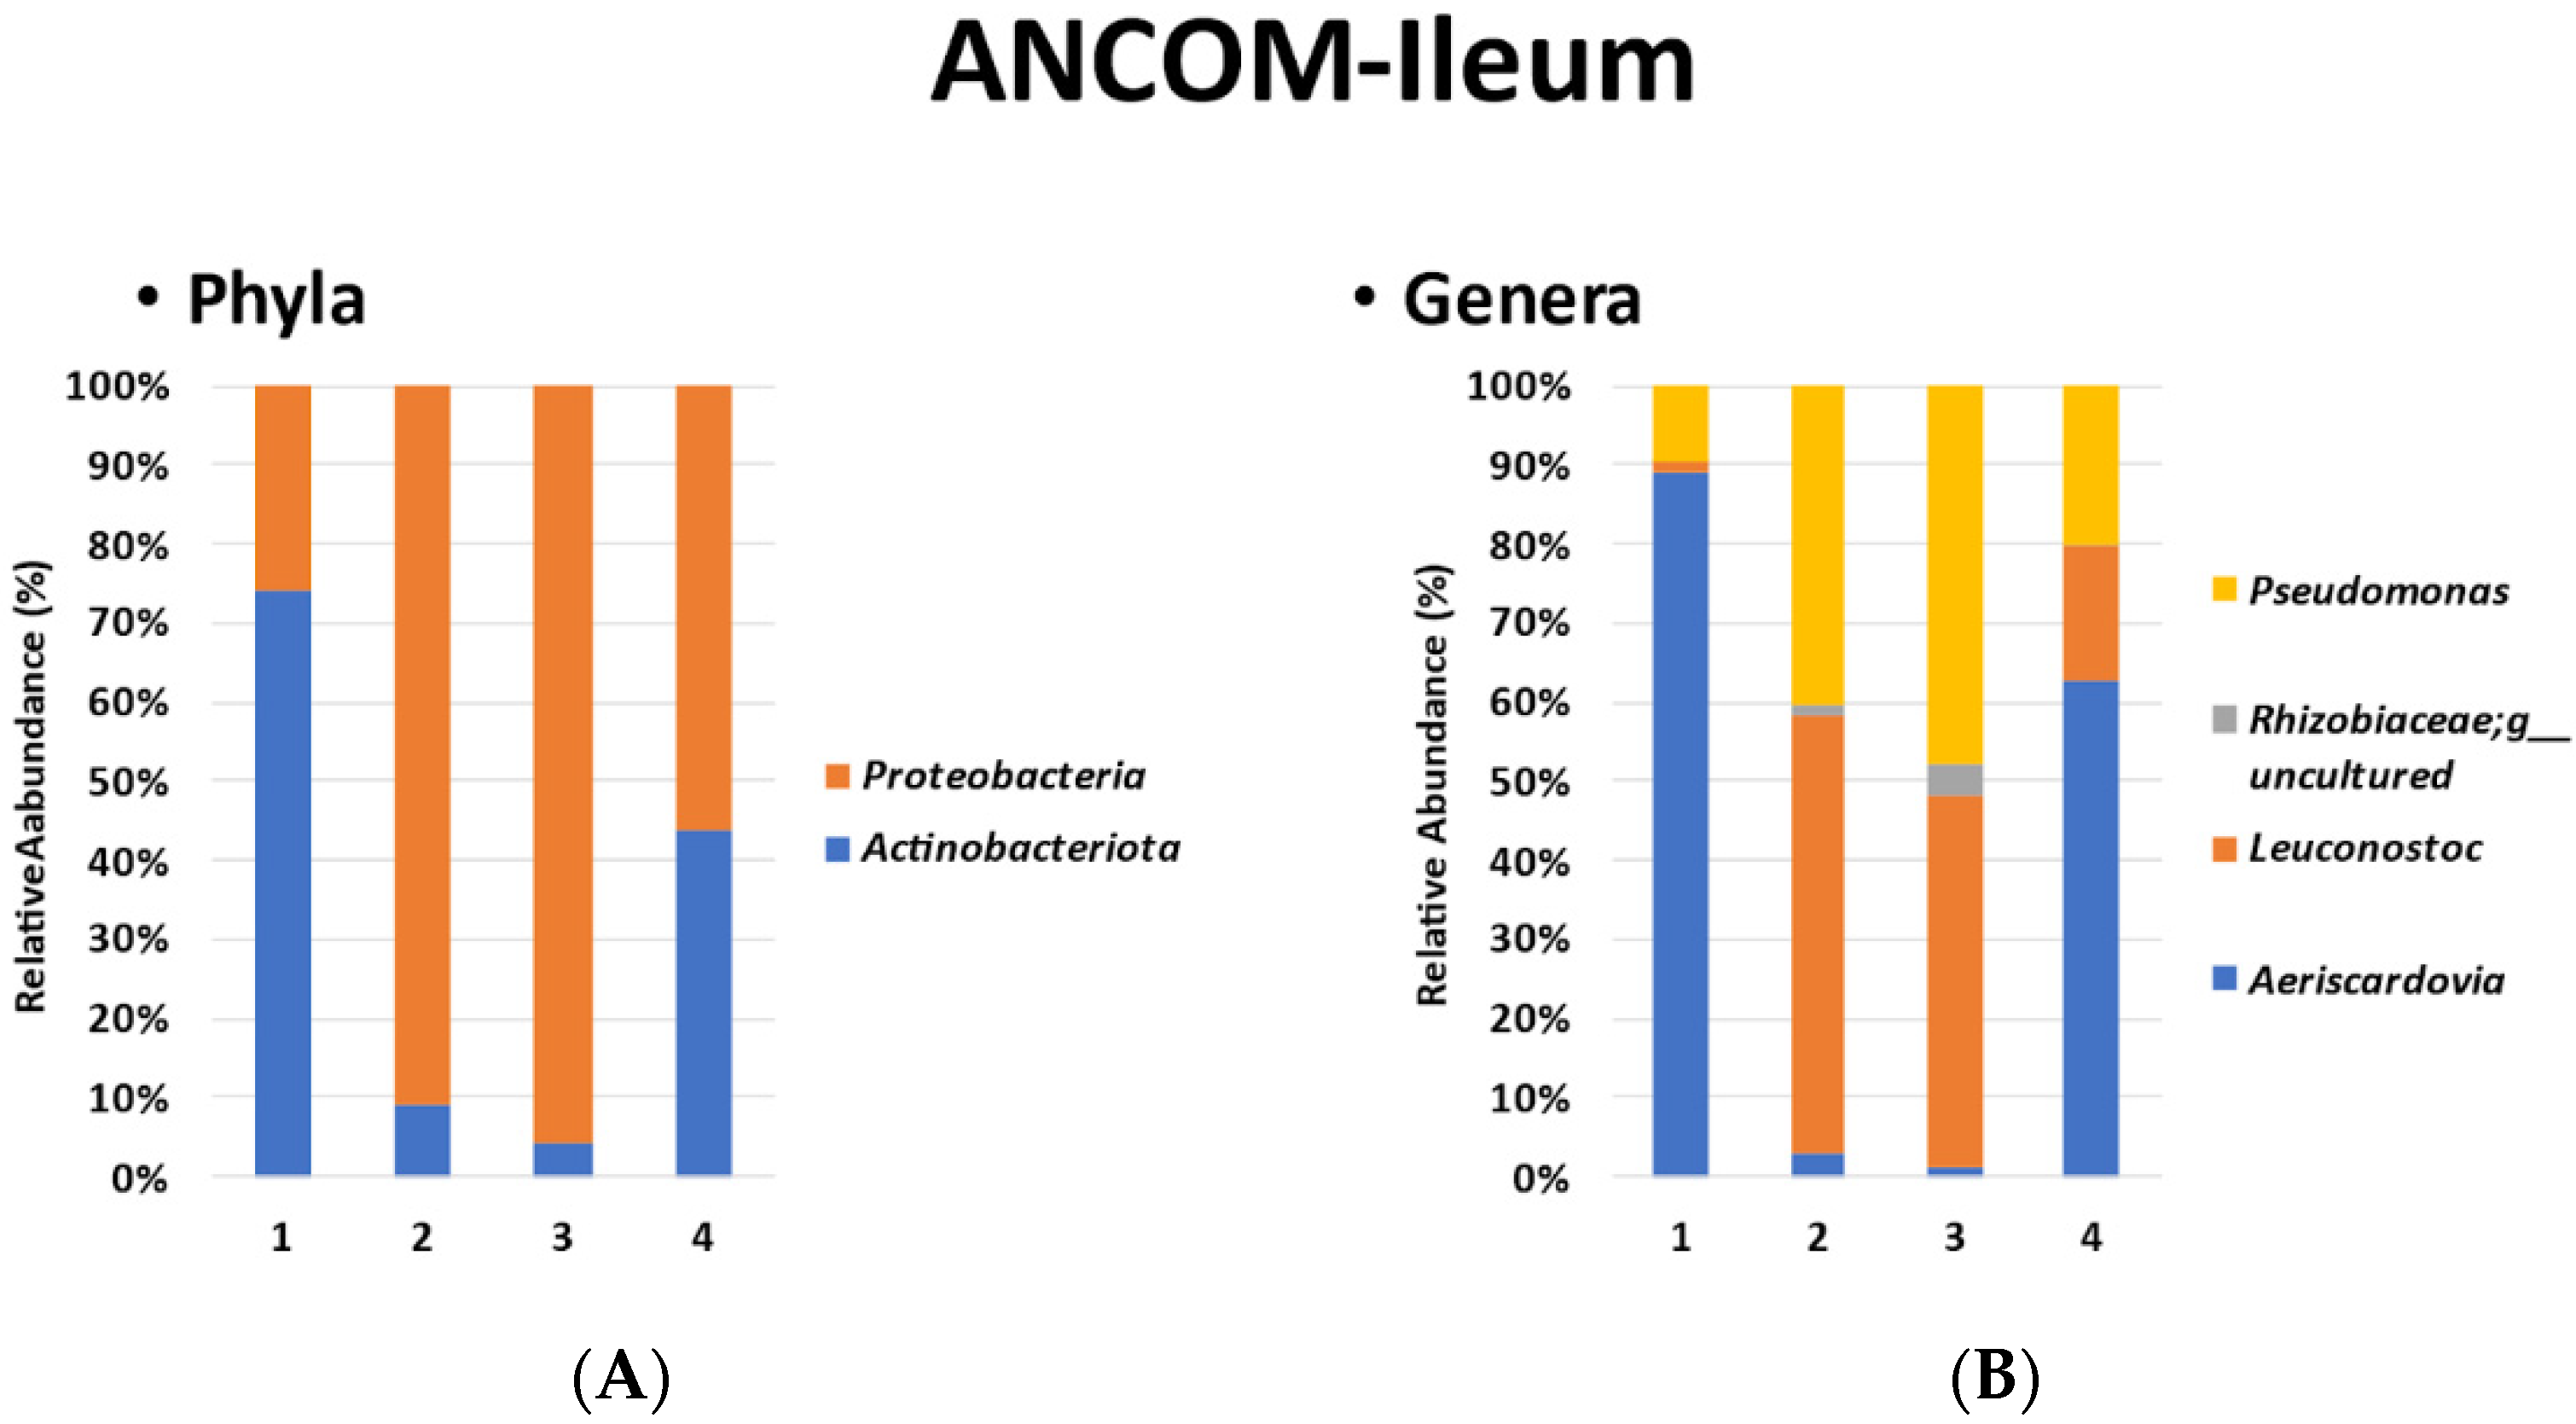
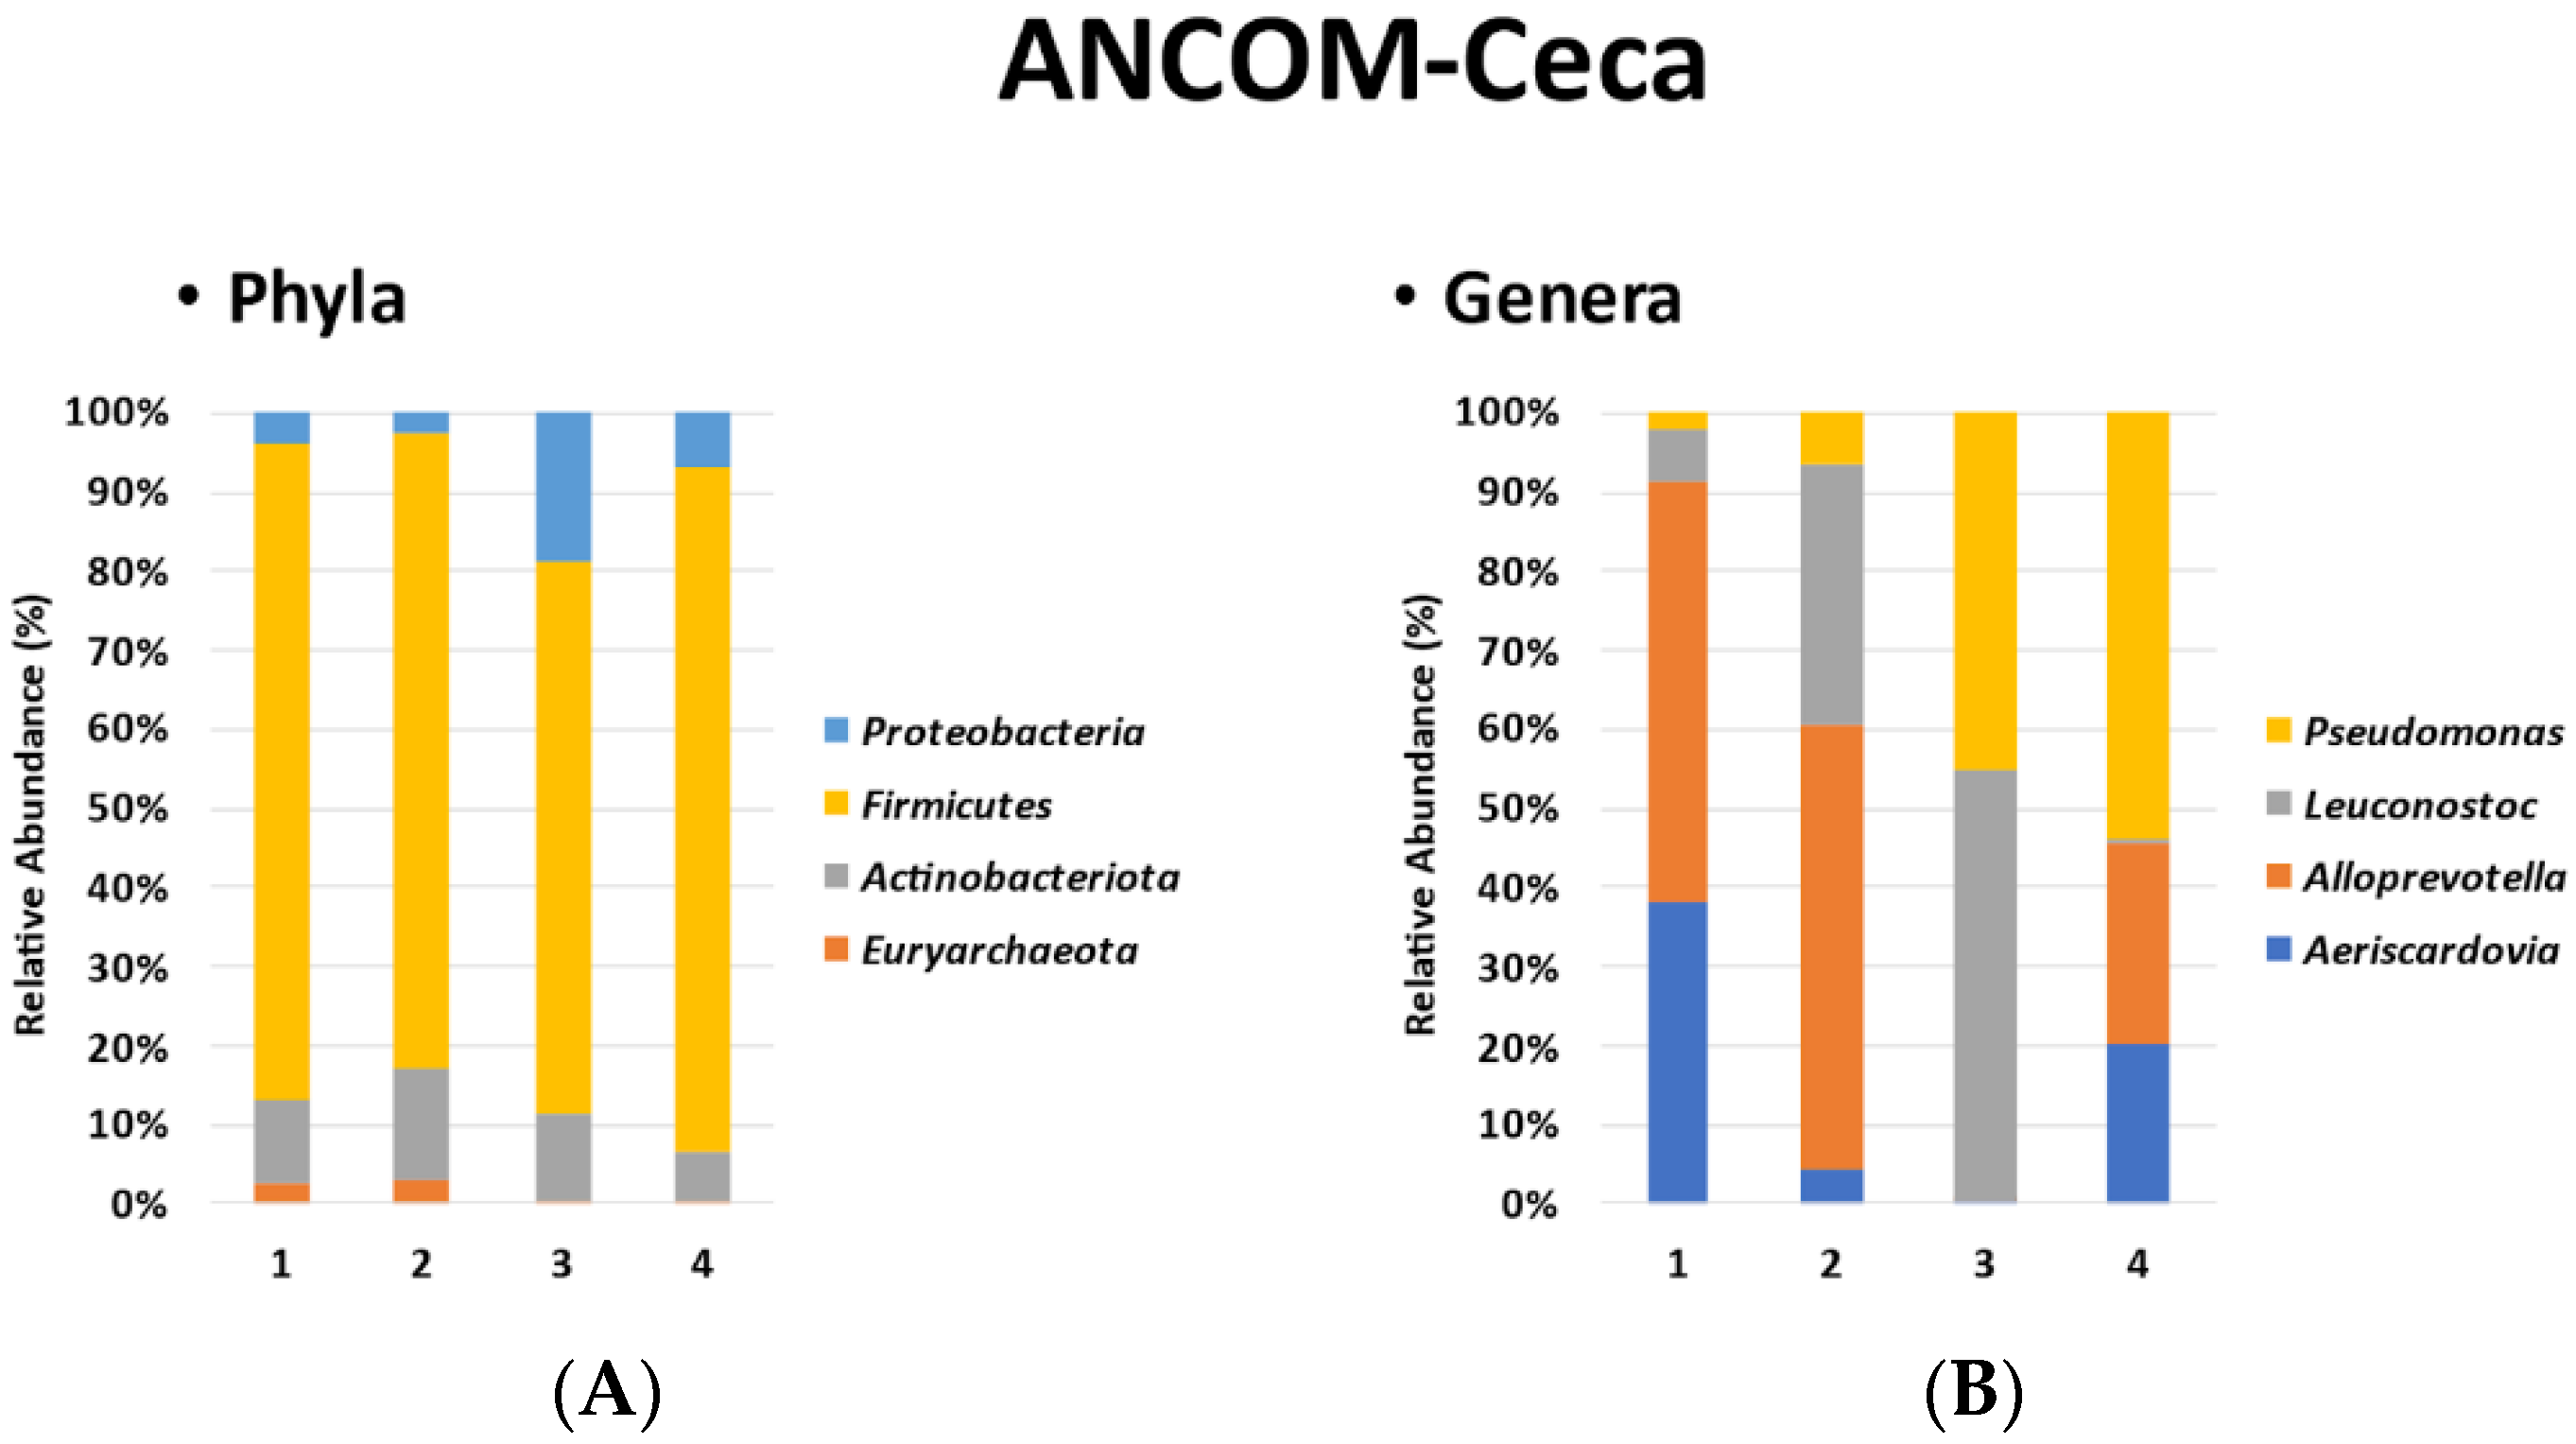
3.3. ANCOM
4. Discussion
5. Conclusions
Author Contributions
Funding
Institutional Review Board Statement
Informed Consent Statement
Data Availability Statement
Conflicts of Interest
References
- Pan, D.; Yu, Z. Intestinal microbiome of poultry and its interaction with host and diet. Gut Microbes 2013, 5, 108–119. [Google Scholar] [CrossRef]
- Shang, Y.; Kumar, S.; Oakley, B.; Kim, W.K. Chicken Gut Microbiota: Importance and Detection Technology. Front. Vet. Sci. 2018, 5, 254. [Google Scholar] [CrossRef] [PubMed]
- Xiao, S.-S.; Mi, J.-D.; Mei, L.; Liang, J.; Feng, K.-X.; Wu, Y.-B.; Liao, X.-D.; Wang, Y. Microbial Diversity and Community Variation in the Intestines of Layer Chickens. Animals 2021, 11, 840. [Google Scholar] [CrossRef] [PubMed]
- Glendinning, L.; Watson, K.A.; Watson, M. Development of the duodenal, ileal, jejunal and caecal microbiota in chickens. Anim. Microbiome 2019, 1, 17. [Google Scholar] [CrossRef] [PubMed]
- Hubert, S.M.; Al-Ajeeli, M.; Bailey, C.A.; Athrey, G. The Role of Housing Environment and Dietary Protein Source on the Gut Microbiota of Chicken. Animals 2019, 9, 1085. [Google Scholar] [CrossRef]
- Zhao, L.; Wang, G.; Siegel, P.; He, C.; Wang, H.; Zhao, W.; Zhai, Z.; Tian, F.; Zhao, J.; Zhang, H.; et al. Quantitative genetic background of the host influences gut microbiomes in chickens. Sci. Rep. 2013, 3, 1163. [Google Scholar] [CrossRef]
- Federation of Animal Science Societies. Guide for the care and use of agricultural animals in agricultural research and teaching. In Committees to Revise the Guide for the Care and Use of Agricultural Animals in Research and Teaching, 3rd ed.; Federation of Animal Science Societies: Champaign, IL, USA, 2010. [Google Scholar]
- Kers, J.G.; Velkers, F.C.; Fischer, E.A.J.; Hermes, G.D.A.; Stegeman, J.A.; Smidt, H. Host and Environmental Factors Affecting the Intestinal Microbiota in Chickens. Front. Microbiol. 2018, 9, 235. [Google Scholar] [CrossRef]
- Rychlik, I. Composition and Function of Chicken Gut Microbiota. Animals 2020, 10, 103. [Google Scholar] [CrossRef]
- Ptak, A.; Bedford, M.R.; Świątkiewicz, S.; Żyła, K.; Józefiak, D. Phytase Modulates Ileal Microbiota and Enhances Growth Performance of the Broiler Chickens. PLoS ONE 2015, 10, e0119770. [Google Scholar] [CrossRef]
- Chen, Y.; Wang, J.; Yu, L.; Xu, T.; Zhu, N. Microbiota and metabolome responses in the cecum and serum of broiler chickens fed with plant essential oils or virginiamycin. Sci. Rep. 2020, 10, 5382. [Google Scholar] [CrossRef]
- Schreuder, J.; Velkers, F.C.; Bouwstra, R.J.; Beerens, N.; Stegeman, J.A.; de Boer, W.F.; van Hooft, P.; Elbers, A.R.W.; Bossers, A.; Jurburg, S.D. An observational field study of the cloacal microbiota in adult laying hens with and without access to an outdoor range. Anim. Microbiome 2020, 2, 28. [Google Scholar] [CrossRef] [PubMed]
- Clench, M.; Mathias, J. The Avian Cecum: A Review. Wilson Bull. 1995, 107, 93–121. Available online: http://www.jstor.org/stable/4163516 (accessed on 11 November 2020).
- Huang, C.-B.; Xiao, L.; Xing, S.-C.; Chen, J.-Y.; Yang, Y.-W.; Zhou, Y.; Chen, W.; Liang, J.-B.; Mi, J.-D.; Wang, Y.; et al. The microbiota structure in the cecum of laying hens contributes to dissimilar H2S production. BMC Genom. 2019, 20, 770. [Google Scholar] [CrossRef] [PubMed]
- Ngunjiri, J.M.; Taylor, K.J.M.; Abundo, M.C.; Jang, H.; Elaish, M.; Kc, M.; Ghorbani, A.; Wijeratne, S.; Weber, B.P.; Johnson, T.J.; et al. Farm Stage, Bird Age, and Body Site Dominantly Affect the Quantity, Taxonomic Composition, and Dynamics of Respiratory and Gut Microbiota of Commercial Layer Chickens. Appl. Environ. Microbiol. 2019, 85, e03137-18. [Google Scholar] [CrossRef]
- Kogut, M.H. The effect of microbiome modulation on the intestinal health of poultry. Anim. Feed. Sci. Technol. 2018, 250, 32–40. [Google Scholar] [CrossRef]
- Choi, K.Y.; Lee, T.K.; Sul, W.J. Metagenomic Analysis of Chicken Gut Microbiota for Improving Metabolism and Health of Chickens—A Review. Asian-Australas. J. Anim. Sci. 2015, 28, 1217–1225. [Google Scholar] [CrossRef]
- Glöckner, F.O.; Yilmaz, P.; Quast, C.; Gerken, J.; Beccati, A.; Ciuprina, A.; Bruns, G.; Yarza, P.; Peplies, J.; Westram, R.; et al. 25 years of serving the community with ribosomal RNA gene reference databases and tools. J. Biotechnol. 2017, 261, 169–176. [Google Scholar] [CrossRef]
- Price, M.N.; Dehal, P.S.; Arkin, A.P. FastTree 2–approximately maximum-likelihood trees for large alignments. PLoS ONE 2010, 5, e9490. [Google Scholar] [CrossRef]
- Yilmaz, P.; Parfrey, L.W.; Yarza, P.; Gerken, J.; Pruesse, E.; Quast, C.; Schweer, T.; Peplies, J.; Ludwig, W.; Glöckner, F.O. The SILVA and “All-species Living Tree Project (LTP)” taxonomic frameworks. Nucleic Acids Res. 2013, 42, D643–D648. [Google Scholar] [CrossRef]
- Kozich, J.J.; Westcott, S.L.; Baxter, N.T.; Highlander, S.K.; Schloss, P.D. Development of a dual-index sequencing strategy and curation pipeline for analyzing amplicon sequence data on the MiSeq Illumina sequencing platform. Appl. Environ. Microbiol. 2013, 79, 5112–5120. [Google Scholar] [CrossRef]
- Bolyen, E.; Rideout, J.R.; Dillon, M.R.; Bokulich, N.A.; Abnet, C.C.; Al-Ghalith, G.A.; Alexander, H.; Alm, E.J.; Arumugam, M.; Asnicar, F.; et al. Reproducible, Interactive, Scalable and Extensible Microbiome Data Science using QIIME 2. Nat. Biotechnol. 2019, 37, 852–857. [Google Scholar] [CrossRef] [PubMed]
- Callahan, B.J.; Mcmurdie, P.J.; Rosen, M.J.; Han, A.W.; Johnson, A.J.A.; Holmes, S.P. DADA2: High-resolution sample inference from Illumina amplicon data. Nat. Methods 2016, 13, 581–583. [Google Scholar] [CrossRef] [PubMed]
- Pineda-Quiroga, C.; Borda-Molina, D.; Chaves-Moreno, D.; Ruiz, R.; Atxaerandio, R.; Camarinha-Silva, A.; García-Rodríguez, A. Microbial and Functional Profile of the Ceca from Laying Hens Affected by Feeding Prebiotics, Probiotics, and Synbiotics. Microorganisms 2019, 7, 123. [Google Scholar] [CrossRef] [PubMed]
- Bokulich, N.A.; Dillon, M.R.; Zhang, Y.; Rideout, J.R.; Bolyen, E.; Li, H.; Albert, P.S.; Caporaso, J.G. q2-longitudinal: Longitudinal and Paired-Sample Analyses of Microbiome Data. mSystems 2018, 3, e00219-18. [Google Scholar] [CrossRef] [PubMed]
- Bokulich, N.A.; Kaehler, B.D.; Rideout, J.R.; Dillon, M.; Bolyen, E.; Knight, R.; Huttley, G.A.; Gregory Caporaso, J. Optimizing taxonomic classification of marker-gene amplicon sequences with QIIME 2’s q2-feature-classifier plugin. Microbiome 2018, 6, 90. [Google Scholar] [CrossRef]
- Kruskal, W.H.; Wallis, W.A. Use of Ranks in One-Criterion Variance Analysis. J. Am. Stat. Assoc. 1952, 47, 583–621. [Google Scholar] [CrossRef]
- Lozupone, C.; Knight, R. UniFrac: A New Phylogenetic Method for Comparing Microbial Communities. Appl. Environ. Microbiol. 2005, 71, 8228–8235. [Google Scholar] [CrossRef]
- Lozupone, C.A.; Hamady, M.; Kelley, S.T.; Knight, R. Quantitative and Qualitative β Diversity Measures Lead to Different Insights into Factors That Structure Microbial Communities. Appl. Environ. Microbiol. 2007, 73, 1576–1585. [Google Scholar] [CrossRef]
- Anderson, M.J. A new method for non-parametric multivariate analysis of variance. Austral Ecol. 2001, 26, 32–46. [Google Scholar] [CrossRef]
- Kohl, K.D. Diversity and function of the avian gut microbiota. J. Comp. Physiol. B 2012, 182, 591–602. [Google Scholar] [CrossRef] [PubMed]
- Oakley, B.B.; Lillehoj, H.S.; Kogut, M.H.; Kim, W.K.; Maurer, J.J.; Pedroso, A.; Lee, M.D.; Collett, S.R.; Johnson, T.J.; Cox, N.A. The chicken gastrointestinal microbiome. FEMS Microbiol. Lett. 2014, 360, 100–112. [Google Scholar] [CrossRef] [PubMed]
- Lu, J.; Idris, U.; Harmon, B.; Hofacre, C.; Maurer, J.J.; Lee, M.D. Diversity and Succession of the Intestinal Bacterial Community of the Maturing Broiler Chicken. Appl. Environ. Microbiol. 2003, 69, 6816–6824. [Google Scholar] [CrossRef] [PubMed]
- Mignon-Grasteau, S.; Narcy, A.; Rideau, N.; Chantry-Darmon, C.; Boscher, M.-Y.; Sellier, N.; Chabault, M.; Konsak-Ilievski, B.; Le Bihan-Duval, E.; Gabriel, I. Impact of Selection for Digestive Efficiency on Microbiota Composition in the Chicken. PLoS ONE 2015, 10, e0135488. [Google Scholar] [CrossRef] [PubMed]
- Elokil, A.A.; Magdy, M.; Melak, S.; Ishfaq, H.; Bhuiyan, A.; Cui, L.; Jamil, M.; Zhao, S.; Li, S. Faecal microbiome sequences in relation to the egg-laying performance of hens using amplicon-based metagenomic association analysis. Animal 2020, 14, 706–715. [Google Scholar] [CrossRef] [PubMed]
- Borda-Molina, D.; Seifert, J.; Camarinha-Silva, A. Current Perspectives of the Chicken Gastrointestinal Tract and Its Microbiome. Comput. Struct. Biotechnol. J. 2018, 16, 131–139. [Google Scholar] [CrossRef] [PubMed]
- Stanley, D.; Hughes, R.J.; Moore, R.J. Microbiota of the Chicken Gastrointestinal Tract: Influence on Health, Productivity and Disease. Appl. Microbiol. Biotechnol. 2014, 98, 4301–4310. [Google Scholar] [CrossRef]
- Scott, K.P.; Gratz, S.W.; Sheridan, P.O.; Flint, H.J.; Duncan, S.H. The influence of diet on the gut microbiota. Pharmacol. Res. 2013, 69, 52–60. [Google Scholar] [CrossRef] [PubMed]
- Magne, F.; Gotteland, M.; Gauthier, L.; Zazueta, A.; Pesoa, S.; Navarrete, P.; Balamurugan, R. The Firmicutes/Bacteroidetes Ratio: A Relevant Marker of Gut Dysbiosis in Obese Patients? Nutrients 2020, 12, 1474. [Google Scholar] [CrossRef]
- Flint, H.J.; Scott, K.P.; Duncan, S.H.; Louis, P.; Forano, E. Microbial degradation of complex carbohydrates in the gut. Gut Microbes 2012, 3, 289–306. [Google Scholar] [CrossRef]
- Mandal, S.; Van Treuren, W.; White, R.A.; Eggesbø, M.; Knight, R.T.; Peddada, S.D. Analysis of composition of microbiomes: A novel method for studying microbial composition. Microb. Ecol. Health Dis. 2015, 26, 27663. [Google Scholar] [CrossRef]
- Wiersema, M.L.; Koester, L.R.; Schmitz-Esser, S.; Koltes, D.A. Comparison of intestinal permeability, morphology, and ileal microbial communities of commercial hens housed in conventional cages and cage-free housing systems. Poult. Sci. 2020, 100, 1178–1191. [Google Scholar] [CrossRef] [PubMed]
- Adhikari, B.; Jun, S.-R.; Kwon, Y.M.; Kiess, A.S.; Adhikari, P. Effects of Housing Types on Cecal Microbiota of Two Different Strains of Laying Hens During the Late Production Phase. Front. Vet. Sci. 2020, 7, 331. [Google Scholar] [CrossRef] [PubMed]
- Sergeant, M.J.; Constantinidou, C.; Cogan, T.A.; Bedford, M.R.; Penn, C.W.; Pallen, M.J. Extensive Microbial and Functional Diversity within the Chicken Cecal Microbiome. PLoS ONE 2014, 9, e91941. [Google Scholar] [CrossRef] [PubMed]
- Hamid, H.; Zhang, J.; Li, W.; Liu, C.; Li, M.; Zhao, L.; Ji, C.; Ma, Q. Interactions between the cecal microbiota and non-alcoholic steatohepatitis using laying hens as the model. Poult. Sci. 2019, 98, 2509–2521. [Google Scholar] [CrossRef] [PubMed]
- Katoh, K.; Standley, D.M. MAFFT Multiple Sequence Alignment Software Version 7: Improvements in Performance and Usability. Mol. Biol. Evol. 2013, 30, 772–780. [Google Scholar] [CrossRef]
- Quast, C.; Pruesse, E.; Yilmaz, P.; Gerken, J.; Schweer, T.; Yarza, P.; Peplies, J.; Glöckner, F.O. The SILVA ribosomal RNA gene database project: Improved data processing and web-based tools. Nucleic Acids Res. 2013, 41, D590–D596. [Google Scholar] [CrossRef]


| Ingredients | 2016 Layer Diet 2 | 1940 Layer Diet 2 |
|---|---|---|
| Corn | 940.5 | 1146.38 |
| Soybean meal | 718.0 | 232.57 |
| Alfalfa meal | 305.97 | |
| Limestone, gr. | 145.5 | 124.2 |
| Coarse limestone | 50.0 | |
| Fat | 110.0 | |
| Phosphate Mono/D | 17.6 | |
| Salt | 6.8 | 5.0 |
| D.L. Methionine | 2.9 | |
| T-Premix | 1.0 | |
| Sodium Bi-carb | 2.0 | |
| Prop Acid 505 | 1.0 | |
| Choline CL 60% | 1.3 | 4.0 |
| Hy-D 62.5 mg/lb | ||
| Trace Min PMX 3 | 1.0 | |
| L-Vitamin PMX 4 | 1.0 | |
| 0.06% Selenium 5 | 1.0 | |
| Ronozyme HI P (GT) | 0.4 | |
| Total | 2000.0 | 2000.0 |
| Calculated Analysis | ||
| Protein % | 20.8 | 20.0 |
| ME kcal/kg | 2926 | 1330 |
| Calcium % | 4.10 | 0.90 |
| A. Phos % | 0.45 | 0.42 |
| Lysine % | 1.20 | 0.82 |
| TSAA % | 0.81 |
Disclaimer/Publisher’s Note: The statements, opinions and data contained in all publications are solely those of the individual author(s) and contributor(s) and not of MDPI and/or the editor(s). MDPI and/or the editor(s) disclaim responsibility for any injury to people or property resulting from any ideas, methods, instructions or products referred to in the content. |
© 2023 by the authors. Licensee MDPI, Basel, Switzerland. This article is an open access article distributed under the terms and conditions of the Creative Commons Attribution (CC BY) license (https://creativecommons.org/licenses/by/4.0/).
Share and Cite
Wall, D.C.; Dittoe, D.; Malherios, R.D.; Anderson, K.E.; Anthony, N. Evaluating the Ileal and Cecal Microbiota Composition of a 1940 Heritage Genetic Line and a 2016 Commercial Line of white Leghorns Fed Representative Diets from 1940 to 2016. Appl. Sci. 2023, 13, 12259. https://doi.org/10.3390/app132212259
Wall DC, Dittoe D, Malherios RD, Anderson KE, Anthony N. Evaluating the Ileal and Cecal Microbiota Composition of a 1940 Heritage Genetic Line and a 2016 Commercial Line of white Leghorns Fed Representative Diets from 1940 to 2016. Applied Sciences. 2023; 13(22):12259. https://doi.org/10.3390/app132212259
Chicago/Turabian StyleWall, Dannica C., Dana Dittoe, Ramon D. Malherios, Kenneth E. Anderson, and Nick Anthony. 2023. "Evaluating the Ileal and Cecal Microbiota Composition of a 1940 Heritage Genetic Line and a 2016 Commercial Line of white Leghorns Fed Representative Diets from 1940 to 2016" Applied Sciences 13, no. 22: 12259. https://doi.org/10.3390/app132212259