
Improving the IoT Attack Classification Mechanism with Data Augmentation for Generative Adversarial Networks

Department of Information and Communication Engineering, Chaoyang University of Technology, Taichung 413310, Taiwan
*
Author to whom correspondence should be addressed.
Appl. Sci. 2023, 13(23), 12592; https://doi.org/10.3390/app132312592
Submission received: 30 September 2023
/
Revised: 25 October 2023
/
Accepted: 20 November 2023
/
Published: 22 November 2023
(This article belongs to the Topic Electronic Communications, IOT and Big Data)
Abstract
:The development of IoT technology has made various IoT applications and services widely used. Because IoT devices have weak information security protection capabilities, they are easy targets for cyber attacks. Therefore, this study proposes MLP-based IoT attack classification with data augmentation for GANs. In situations where the overall classification performance is satisfactory but the performance of a specific class is poor, GANs are employed as a data augmentation mechanism for that class to enhance its classification performance. The experimental results indicate that regardless of whether the training dataset is BoT-IoT or TON-IOT, the proposed method significantly improves the classification performance of classes with insufficient training data when using the data augmentation mechanism with GANs. Furthermore, the classification accuracy, precision, recall, and F1-score performance all exceed 90%.
1. Introduction
The Internet of Things (IoT) [1] has become a vital part of our daily lives, and its applications continue to expand rapidly. The IoT refers to the network of interconnected physical devices, vehicles, appliances, and other objects embedded with sensors, software, and network connectivity. These devices can collect and exchange data to perform different daily tasks, making our lives more convenient, efficient, and connected. According to a report by the IoT Business News [2], the number of devices deployed in 2022 saw an 18% growth compared to 2021, reaching 14.4 billion. It is estimated that by 2025, this number will rise to 27.1 billion to meet market demands.
Although IoT devices offer numerous benefits and conveniences, they also come with several disadvantages and challenges. Security issues are among the most critical challenges in the realm of IoT. Due to their interconnected nature and often limited computing resources, IoT devices are particularly vulnerable to various cybersecurity threats. These devices serve as the backbone of the Internet of Things ecosystem, but their susceptibility to attacks is a pressing concern. According to the latest report on Internet threats by the American cybersecurity company SonicWall [3], 2022 witnessed an alarming 87% increase in IoT attack incidents compared to 2021. This surge in attacks highlights the growing vulnerability of IoT devices. The report identified two primary reasons behind this surge: infrequent fundamental software and hardware updates and imperfect network configurations during data transmission. These factors leave IoT devices exposed to malicious software intrusions, making them susceptible to becoming unwitting participants in botnets. The consequences of these attacks can be severe and lead to system paralysis and service interruptions. To address this growing threat landscape, it is imperative to prioritize robust security measures for IoT devices and networks, including regular software and hardware updates, implementing secure network configurations, and deploying intrusion detection and prevention systems. As the IoT ecosystem continues to expand, mitigating these security risks becomes paramount to ensure the reliability and safety of interconnected devices and systems.
Facing increasingly severe threats to the Internet of Things (IoT) security, the development of intrusion detection systems (IDS) has become an essential tool to assist in detecting cyberattacks. Traditional IDSs can effectively monitor network traffic and identify anomalous behavior. They record every packet during detection, and if a packet violates basic routing rules or exhibits malicious activity, they immediately alert the network administrator and automatically generate related reports. However, IDSs require manual updates of the attack patterns and the corresponding remedies. With ever-changing attack techniques, relying solely on traditional manual updates and processing may no longer be an effective solution. Furthermore, most packets are now encrypted to ensure data transmission security, which leads to higher maintenance costs if detection and maintenance need to be improved.
Following the rapid development of artificial intelligence, deep learning applications have addressed the issues faced by traditional IDSs. These applications eliminate the need for manual packet monitoring or adding attack characteristics and solutions, significantly improving detection efficiency and accuracy. However, most deep learning methods still require large datasets and consume significant time. Additionally, if a category within the dataset has an insufficient number of entries, the learning model might struggle to classify it accurately.
Therefore, this study proposes using a generative adversarial network (GAN) to classify IoT attacks. Through the continuous adversarial training of a generator and a discriminator, the generator generates data that are close, but not identical, to real data. In addition, a generator is used to augment unbalanced class data to increase the amount and diversity of original data. Subsequently, the augmented data are merged with the original data for training in order to enhance the classification accuracy of each class. Regardless of whether the training dataset is BoT-IoT or ToN-IoT, this method achieves accuracy, precision, recall, and F1 scores exceeding 90% in both overall classification and single-class classification. The rest of this study is organized as follows. In Section 2, we analyze related work proposed by other authors in detail, sort out the advantages and disadvantages of their proposed methods, and further clarify our research goals. In Section 3, we clearly explain our proposed IoT attack classification and data augmentation method using GAN. In Section 4, we demonstrate the proposed IoT attack classification mechanism, which provides a high overall classification accuracy, uses GANs for data augmentation, and improves the classification performance of a single class. In the last section, we conclude the study based on our proposed methods and summarize their performance breakthroughs while also presenting a brief overview of our future research.
2. Related Works
2.1. Network-Based IDS [1,4]
A network-based intrusion detection system (NIDS) not only monitors network traffic and analyzes its source for action but also detects both known and unknown attacks, taking measures to block them. Additionally, it can log all activities routed through its configured paths in real-time, generating immediate reports for network administrators for further investigation. However, there is a risk of false positives as a result of the emergence of new types of attacks. From a management perspective, it requires regular updates and maintenance of internal routing specifications and related attack features, consuming significant time and cost. For encrypted data, it becomes challenging to analyze and determine the source of network traffic effectively. Furthermore, the system requires substantial bandwidth to monitor traffic, which can cause network latency.
2.2. Host-Based IDS [5,6]
Host-based intrusion detection systems incorporate signature-based [6] and anomaly-based [6] methods. The signature-based approach targets known malicious software attacks by monitoring the user’s behavior, tracking any applications opened or installed on that host, and user authentication actions. The anomaly based method focuses on a user’s current permissions or software behavior, establishing a normal user behavior pattern. If the detected behavior diverges from the norm, an alert is triggered, and the detected behavior is actively reported. In addition to checking permissions, the system can also compare events recorded in the host’s system logs to detect if they have been tampered with, effectively tracing system activities and ensuring the integrity of the system logs. However, host-based detection systems often require installation on each host, tailored to various operating systems, making them more expensive. If an attack occurs, remediation can only address the compromised host without knowing if similar attacks have occurred on other hosts. Managed hosts require the installation of an agent and frequently report back system information for analysis, consuming significant system resources, which can impact system performance.
2.3. Deep Learning Classification
Deep learning technologies commonly used in classification applications include MLP, DNN, CNN, RNN, LSTM, AE, etc. The relevant research is explained as follows:
In [7], the author used DNN to analyze the statistical characteristics of packet traffic from the CIC DDoS 2019 dataset as input data. The experimental results reached 99% in binary classification, and the classification accuracy for detailed DDoS attacks reached 94.57%. In [8], a deep neural network model is proposed for real-time identification of malicious packet categories. Four datasets, UNSW-NB15, BoT-IoT, ToN-IoT, and CIC-IDS2018, were used to evaluate the dataset. The results indicate that the highest accuracy of 99.21% in binary classification was achieved in CIC-IDS2018. In multiclass classification, the average accuracies were as follows: UNSW-NB15, 97.48%; BoT-IoT, 83.82%; CIC-IDS2018, 97.21%; and ToN-IoT, 69.53%.
In [9], the NSL-KDD dataset was used, specifically the KDD Test+ and KDD Test-21. Training data were divided into four segments: basic packet information (e.g., IP address, protocol type, TCP flags, etc.), packet connection information (e.g., login system privilege levels), time-based network traffic statistics, and host-based network traffic statistics. A convolutional neural network (CNN) model was chosen, and by varying input features and adjusting network layer hyperparameters during training, the effect on detection accuracy was analyzed. The results showed that when identifying multiple attack categories, KDD Test+ achieved an accuracy of 81.33%, and KDD Test-21 achieved 64.81%. For binary classification (whether an attack or not), the KDD Test+ had an accuracy of 86.95%, while the KDD Test-21 was 76.37%. In [10], a combined approach using convolutional neural networks (CNN) with recurring neural networks (RNN) was proposed to predict and classify malicious network attacks. The CSE-CIC-IDS2018 dataset was used for this study. CNN was responsible for identifying significant features within the dataset, which were then fed into the RNN to determine the temporal relationships between packet attacks. This approach yielded an accuracy rate of 97.75%. In [11], the transfer learning method is used, and multiple CNN methods are used to analyze four datasets: BoT-IoT, IoT Network Intrusion, MQTT-IoT-IDS2020, and IoT-23. Among them, the BoT-IoT, IoT Network Intrusion, and MQTT-IoT-IDS2020 datasets are combined into a new IoT-DS-1 dataset to increase the number of attacks in the dataset. The IoT-DS-1 dataset multiclass tags are 0 for the normal class and 1 to 9 for the attack class. The new second set of datasets combines BoT-IoT, IoT Network Intrusion, MQTT-IoT-IDS2020, and IoT-23 datasets, which contain 15 attack categories and one common category. The multicategory of the IoT-DS-2 dataset is marked with 0, indicating the normal category, and 1–15, indicating the attack category. To solve the data imbalance during training, the category weights during training are adjusted so that the classifier has different sensitivities to each category. The results show that the one-dimensional CNN accuracy rate is 99.74%, two-dimensional 99.42%, and three-dimensional 99.03%. In [12], a one-dimensional CNN model was proposed based on the DenseNet architecture, and an Inception Time approach was used to analyze and compare the two models by varying the window sizes. Three datasets, ToN-IoT, Edge-IIoT, and UNSW-2015, were utilized for multiclass classification. The results showed that Inception Time outperforms the DenseNet model when using six different window sizes, achieving an average accuracy of 100% on the ToN-IoT dataset. In the Edge-IIoT dataset, Inception Time achieved an accuracy of 94.94%. In the UNSW-NB15 dataset, the Inception Time achieved an accuracy of 98.4%.
In [13], the use of a recurrent neural network is proposed, and adjustments are made to different numbers of layers and learning rates to find the optimal results. The dataset used is NSL-KDD. The results show that in binary classification, an accuracy of 83.28% was achieved when setting 80 hidden layer neurons and a learning rate of 0.1. In multiclass classification, when 80 hidden layer neurons were configured with a learning rate of 0.5, an accuracy of 81.29% was obtained. In [14], the UNSW-NB15 and Bot-IoT datasets were used. Considering that significant data class disparities can hamper training, the authors selected normal traffic data for the DoS and DDoS of the TCP protocol from the UNSW-NB15 dataset. From the BoT-IoT dataset, they chose attack data for the TCP protocol’s DoS and DDoS. The selected data were merged to address the issue of unbalanced datasets. The model used two layers of long- and short-term memory (LSTM) with three output classes: alert, DDoS, and DoS. The accuracy achieved was 96.3%. In [15], the author believes that DDoS attacks are a persistent problem in the network. There have been many related studies that can detect attacks, so they mainly focus on improving the classification performance of the LSTM model. The LSTM model is used with the latest CIC DDoS-2019 dataset to conduct experiments to detect DDoS attacks. When the one-layer LSTM model performs binary classification tasks, it reaches an accuracy of 99.46%. The two-layer LSTM model achieves an accuracy of 99.16% when dealing with multiclass classification tasks.
In [16], the author proposed a method called DIDDOS to detect DDoS attacks. After pre-processing through feature extraction, normalization, and deletion of data containing missing values, the data were then balanced, and finally, the deep learning model GRU (gate recurrent unit) was used to classify the CICDDoS-2019 dataset and identify individuals. All types of DDoS attacks achieved the best accuracy in 50 iterations. When DDoS attacks were identified using the proposed method, the highest accuracy reached 99.91%, and the accuracy of other categories was about 99.7%. In [17], based on the bidirectional gate recurrent unit (GRU) concept, the network architecture utilizes an autoencoder to analyze zero-day attacks. It performs binary classification to determine whether the data source is normal or an attack. If classified as an attack in binary classification, further analysis is performed to identify the specific attack category. The datasets used include WSN-DS, UNSW-NB15, and KDD CUP99, which achieved average accuracies of 97.91%, 98.92%, and 98.23% in binary classification, respectively.
In [18], to address the issue of class data imbalance in the CSE-CIC-IDS2018 dataset, a two-stage approach was employed. In the first stage, the LightGBM algorithm was introduced to classify normal and abnormal traffic data within the original network flow and analyze various traffic categories’ importance. Subsequently, the IR-SMOTE algorithm was used in the second stage to filter and remove the originally classified normal data from the first stage, achieving data balance between normal and attack categories. Finally, a CNN model was used for detailed category identification, resulting in the following outcomes for multiclass classification: F1-score of 99.862%, average class accuracy of 99.896%, and average precision of 99.903%.
2.4. Generative Adversarial Network
The generative adversarial network (GAN) [19] was proposed by Ian Goodfellow in 2014. The GAN is different from conventional deep learning techniques. As shown in Figure 1, it comprises two neural networks, namely the generator and the discriminator. z is the noise vector that, when combined with the generator, aims to produce forged samples G(z) that are close to the original data (Real data, Rd) in the discriminator but not exactly the same. This is performed to deceive the discriminator’s judgment. The input data for the discriminator are trained using both real data and the generated data from the generator. The discriminator then determines the probability of the data being real and provides feedback via the loss function Loss(D), as indicated in Equation (1). On the other hand, when the discriminator judges the feature data generated by the generator, if the discriminator effectively classifies the generator’s data as fake, its loss function is Loss(G), as shown in Equation (2). Moreover, as the two constantly compete and adjust their parameters, the objective is to make it impossible for the discriminator to determine the authenticity of the generator’s output. At this point, optimization of the GAN training is obtained, as shown in Equation (3).
The generator network’s primary role is to create synthetic data that resemble real data. It starts with random noise as input and gradually refines this noise into data that should resemble samples from the real dataset. The generator network typically uses a series of layers, such as MLP, CNN, RNN, or other learning models, to transform the noise into more complex features that resemble real data. During training, the generator tries to produce data that are indistinguishable from real data. It generates samples and passes them to the discriminator. The discriminator network acts as a binary classifier. Its task is to evaluate whether a given input is real (from the actual dataset) or fake (generated by the generator). The discriminator is trained on both real data and fake data generated by the generator. It learns to distinguish between them and assigns a probability score to indicate how likely it is that the input is real. The discriminator’s objective is to maximize its ability to correctly classify real and fake data, while the generator’s goal is to minimize the ability of the discriminator to differentiate between real and fake data. In [20], a method was proposed using the generative adversarial network (GAN) and the autoencoder (AE). The BoT-IoT dataset was used for anomaly detection. There were two training modes compared: the first was training solely with the AE, and the second utilized data generated by the GAN’s generator for AE training. The experimental results indicated that the second method achieved an accuracy of 97.11%, which was superior to that of the first method’s 92.97%. In [21], the author used seven different datasets to address the issue of traditional data imbalance that causes poor classification during the training of the deep learning model. KDD99, NSL-KDD, BoT-IoT, IoT network intrusion, MQTT-IOT-IDS2020, the MQTT set, and IOT-23. A feed-forward neural network (FNN) model was chosen for the final classification. To address the imbalanced data, conditional generative adversarial networks (CGANs) were used. The aim was to enhance the generated features with category-specific conditions. The post-generation enhanced data were combined with the original data for training and comparative analysis. The experimental results showed that the average accuracy across all datasets was 97%. In [22], to address the issue of unbalanced data, the Wasserstein distance GAN and autoencoders are proposed to generate unbalanced data, comparing the diversity of data generation. For the classification results, DNN, CNN, and LSTM are used for comparative classification. The datasets used are UNSW-NB15, NSL-KDD, CTU-IOT, and real-world data. The results show that the average accuracy reached 87% for USNW and 93.2% for NSL-KDD. In [23], GANs are used and compared with multilayer perceptron (MLP) models in deep learning. The dataset employed is BoT-IoT. In the original dataset consisting of 3 million records, only 50,000 records were selected for training the GAN model. The GAN model trains using a generator to create data features that are similar to the original data class and continuously oppose a discriminator. Experimental results show that while the MLP model required 11 h to complete training, the GAN was able to generate features similar to the original data in just 2 h. After retraining alongside the MLP model, the GAN achieved a classification accuracy of 80%.
2.5. Summary
Summarizing the various applications of deep learning and GAN technologies in investigating IoT attack classification, as shown in Table 1. Among them, “binary classification” refers to methods that classify attacks into only two categories: “attack” and “non-attack”. On the other hand, “multivariate classification” signifies approaches that classify attacks into various distinct attack categories. Most methods achieve an accuracy of over 80% in binary classification, some even reaching 99%. However, there is more variability in the classification accuracy of these methods in multivariate classification. A method is considered superior and practical if it can achieve an accuracy of 95% or higher in multivariate classification, as it demonstrates feasibility and real-world utility.
3. IoT Attack Classification Mechanism
The process of the proposed classification mechanism can be divided into four main steps, namely dataset collection, data pre-processing, classification model establishment, and classification model evaluation. The details of these four steps will be presented in the following subsections.
3.1. Dataset Collection
The BoT-IoT dataset [24] was created by designing a real network environment in the Cyber Range Lab of UNSW Canberra. The network environment includes four attack virtual servers and one normal virtual server to present normal traffic and botnet traffic. IoT devices use Node-red [25], a visual programming language development tool based on process programming, to connect to normal servers and transmit data traffic through message queuing telemetry transport (MQTT). Data traffic is simulated using Ostinato [26]. The number of records in each class in the BoT-IoT dataset is shown in Table 2. There are five classes in the dataset, namely denial of service attack, distributed denial of service attack, reconnaissance attack, theft attack, and normal. The first four are attack categories, and the last one is a normal category.
- Denial of service (DoS) attack [1]: A DoS attack is a malicious attempt to disrupt the normal functioning of a network, system, or online service by overwhelming it with a flood of illegitimate traffic or requests. The primary objective of a DoS attack is to make the targeted resource unavailable to its intended users, causing a denial of service. The two key characteristics of DoS attacks are overloaded resources and various attack vectors. An overload of resources refers to DoS attacks that typically involve sending a large volume of traffic, data, or requests to the target system. This overwhelms the system’s capacity to handle incoming requests, causing it to become slow or unresponsive. A variety of attack vectors means that DoS attacks can take various forms, including flooding a network with traffic, sending a high number of connection requests, exploiting vulnerabilities in software, or depleting system resources like CPU, memory, or bandwidth;
- Distributed denial of service (DDoS) attack [1]: A DDoS attack is a type of cyberattack in which multiple compromised computers, often referred to as a botnet, are used to flood a target system, network, or service with a massive volume of traffic or requests, overwhelming its capacity, and causing a denial of service. DDoS attacks are a more sophisticated and powerful form of the basic denial of service (DoS) attack. DDoS attacks are more powerful and difficult to stop than DoS attacks and can cause long-term and severe service disruptions. Identifying DDoS attacks becomes more complex because attackers often use compromised systems from different locations;
- Reconnaissance attack [24]: A reconnaissance attack is the initial stage of a cyberattack in which an attacker gathers information about a target system, network, or organization. The primary objective of reconnaissance is to collect data that can be used to plan and launch a more focused and effective attack in the future. It is essentially the process of “scouting” or “surveying” the target to identify vulnerabilities and weaknesses. Reconnaissance serves as the basis for subsequent stages of a cyberattack, such as exploitation and intrusion. Armed with the knowledge gained during reconnaissance, attackers can tailor their attack strategies to maximize their chances of success. For this reason, organizations place a strong emphasis on detecting and mitigating reconnaissance activities as part of their cybersecurity measures. Common defense mechanisms include network monitoring, intrusion detection systems (IDS) [4], and security information and event management (SIEM) [27] solutions to spot and respond to suspicious reconnaissance attempts;
- Theft attack [24]: A theft attack is used to describe attempts by attackers to gain unauthorized access to confidential information belonging to others. This type of attack often involves various methods and techniques, including phishing, advanced persistent threats (APTs), malware, and other cyberattacks aimed at stealing sensitive data. Phishing attacks involve sending deceptive emails or messages that appear to come from trusted sources. These emails typically contain links or attachments designed to trick recipients into revealing sensitive information, such as login credentials or personal data. Advanced persistent threats (APTs) are long-term, sophisticated cyberattacks in which attackers gain unauthorized access to a network or system, often using advanced techniques to remain undetected. APTs are typically conducted by well-funded and motivated attackers who aim to steal valuable information over an extended period. Malicious software, including viruses, Trojans, spyware, and ransomware, can be used to compromise systems and steal data. Malware can be delivered by various means, including infected email attachments, malicious downloads, or compromised websites;
Normal: It refers to normal (non-attack) traffic transmitted according to network protocols.
This dataset originally contained 2,934,817 records. After data pre-processing, there are still 2,927,407 records, which will be explained in Section 3.2. It is obvious that the amount of data in the two classes of “Theft” and “Normal” is insufficient. Although the designed classification model can achieve a certain overall performance level, obtaining good classification results for classes with insufficient data will be difficult. Therefore, the use of data augmentation techniques to improve the classification performance of specific classes will be explained in Section 3.3. The features of the BoT-IoT dataset are shown in Table 3. The ID, Feature, and Description fields in Table 3 represent the feature identification number, feature name, and description of the feature meaning. Note that the dataset used in this paper is in comma-separated values (CSV) file format. A CSV is a plain text format with the advantage of being platform-independent, making it readable and easily processed by various software applications. This dataset is employed to simulate potential scenarios encountered during network attacks, facilitating in-depth packet analysis.
3.2. Data Pre-Processing
In this section, the purpose of data pre-processing is to convert the original data into the input format required by the model to ensure the data’s consistency, availability, and applicability, thereby improving the accuracy and efficiency of the model. The data pre-processing step includes three sub-steps: data cleaning, feature selection, and data standardization.
- Data cleaning: This substep will delete low-relevance feature IDs 1, 4, 6, 7, 17, and 19. For example, Feature ID 1 is the row identifier, and ID7 is the serial number of any starting value. Feature IDs 17, 18, and 19 are label fields. According to the needs of this paper, they are not used as input data. Only feature ID 18 is retained as a label field to evaluate classification performance. Feature IDs 4 and 6 are port numbers, which range from 1 to 65,535. However, attackers can set them arbitrarily without following the protocol specifications, so the relevance of this feature is low. To simplify the complexity, consider an environment where IPv4 is used at the network layer, and TCP or UDP is used at the transport layer. Therefore, the Address Resolution Protocol and the Internet Control Message Protocol in Feature ID 2 and IPv6 in Feature IDs 3 and 5 will not be included in the scope of this article;
- Data standardization [28,29]: This substep is mainly to reduce the complexity of model training and accelerate the convergence speed of the model to prevent problems such as gradient explosion during model training. Feature ID 2 uses the label encoding method to set Proto’s TCP and UDP to 0 and 1, respectively. Feature ID 18 also uses label encoding to set each class to a value from 1 to 5. Feature ID 18 also uses label encoding to set each class to a value from 1 to 5. After feature IDs 8 to 16 are normalized using Equation (4), their values will be in the [0, 1] interval. Note that the Xnorm is the normalization value of each feature; X is the original value of the current feature; Xmin is the minimum value of the feature field; and Xmax is the maximum value of the feature field;
- Functions ID 3 and ID 5 are IP addresses. Since an IP address is a combination of four sets of numbers, normalization directly will not effectively reflect this characteristic. Therefore, each number of the IP address is independently decomposed into a sub-feature, and each sub-feature is encoded in an 8-bit binary format. Therefore, there are a total of 64 features.
3.3. Classification Model Establishment
The classification model used in this paper is an integration of two learning models based on multilayer perceptron (MLP) and GANs, as shown in Figure 2. The MLP model is the main classification model, and its input data are the result of data pre-processing from the BoT-IoT dataset. When the overall classification performance after model training reaches the threshold PT, the model training is terminated. This mechanism ensures the overall efficiency of classification. However, when the data from the training set are incomplete or extremely uneven, the classification model can only consider the classification performance of classes with a large amount of data to create the illusion of good overall performance. To solve this problem, the proposed classification method adds the classification performance threshold Pi of class i to ensure the classification performance of a specific class.
When the classification performance of class i is less than the threshold Pi, the class will trigger a data augmentation model GAN_Ci. The original training data from class i are used as the input of GAN_Ci to generate new data K belonging to this class. The newly generated K new data will be added to the original training set, and the MLP classification model will be trained again. Whether training is completed or not still depends on the aforementioned overall classification performance threshold PT and the classification performance threshold Pi of class i. If the requirements of these two thresholds are met, the training of the model will be terminated. On the contrary, data augmentation will continue for the specific class that does not meet the requirements.
Furthermore, our proposed method prioritizes robustness as a fundamental aspect of model training. We have taken proactive measures to ensure the stability and effectiveness of the training process and to prevent the common pitfall of overfitting. To achieve this, we have incorporated early stopping mechanisms [30] into both the multilayer perceptron (MLP) and generative adversarial networks (GANs). These mechanisms serve as an essential safeguard against training-related issues that can compromise the model’s reliability and performance. The early stopping mechanism functions by continuously monitoring the model’s performance on a separate validation dataset throughout the training process. When the model’s performance reaches an optimal point and begins to plateau or even decline, the training is halted. This intervention ensures that the model is stopped at the precise moment when it is in its best state, right before any potential performance degradation. The benefits of this approach are twofold. Not only does it prevent the model from overfitting the training data, which can lead to poor generalization of new data, but it also guarantees that the model achieves the highest possible level of performance. This emphasis on robustness and performance optimization makes our proposed method a reliable and resilient solution.
Note that image data augmentation involves techniques such as rotation, flipping, scaling, cropping, brightness adjustment, and adding noise. These techniques help create variations of the same image for training, making the model more resilient to different image conditions. However, attack data are different from image data, so they cannot be augmented using image data augmentation technology. Therefore, in this study, we use a GAN generator and discriminator to compete with each other to amplify similar attack data.
The hyperparameters of the MLP model and the GANs model are shown in Table 4 and Table 5, respectively. The epoch represents the number of training iterations for the entire classification model. In the MLP model, the epoch is set to 200, and each epoch will have 1024 data pieces input into the model for training. The optimizer is Adam, and the learning rate is set to 0.001. In the GANs model, the epoch is set to 10,000, the learning rate is 0.002, and the noise vector Z is 100. The overall classification performance threshold PT is defined as the overall classification accuracy of 90%. The classification performance threshold Pi of the i-th class is defined as the classification accuracy of the i-th class is 90% and is the same for all classes. That is, P1 = P2= … = Pn = 90%.
3.4. Classification Model Evaluation
The confusion matrix [31,32] is a measure of performance for machine learning classification. It is based on the relationship between actual classes and the classes predicted by the model, allowing us to assess how the model performs in different classification results, as shown in Figure 3. The x-axis represents the predicted results, while the y-axis represents the actual results. A true positive (TP) refers to cases where both the actual and predicted classifications are correct; a true negative (TN) refers to cases where both the actual and predicted classifications are incorrect. A false positive (FP) is when the predicted classification is correct, but the actual classification is incorrect. A false negative (FN) occurs when the predicted classification is incorrect, but the actual classification is correct.
Based on the definition of the confusion matrix, the performance of the model can be evaluated in order to understand the actual and predicted classification results, such as accuracy, precision, recall, and F1-score, which are evaluated as follows.
- Accuracy (PAccuracy): To evaluate the proportion of correct predictions among all classification results;
- Precision (PPrecision): To evaluate the proportion of actual classifications that correctly predict a single classification result;
- Recall (PRecall): To evaluate the proportion of actual single classification results with correctly predicted classifications;
- F1-score (PF1-score): To evaluate the performance of the overall model, the sum of precision and recall is the average.
4. Experimental Results
In this section, the Bot-IoT dataset will be used as the data source to establish the classification model and analyze the classification results. The experimental results will be discussed in three parts. The first part is to use only MLP to build an attack classification model to show that the overall classification accuracy is very high, up to 99%, but the classification accuracy of some single classes is not good. The second part uses GANs for data augmentation to improve the efficiency of the IoT attack classification mechanism. In addition to ensuring high overall classification accuracy, it can also improve the classification accuracy of a single class. The third part compares the proposed method with other existing methods to present the advantages of the proposed method.
The hardware used in the simulation experiment is a desktop computer with a Windows 11 operating system and a 27-inch display with a resolution of 2560 × 1440 pixels. It is powered by a Core i7-12700 processor and comes with 32 GB DDR4 RAM. The desktop computer has 2 TB of hard drive storage. The graphics card is powered by NVIDIA RTX 3080.
4.1. MLP-Based IoT Attack Classification Mechanism
This experiment uses the MLP attack classification model. The total amount of processed data in the BoT-IoT dataset is 2,927,407 records, and its classes include DoS, DDoS, reconnaissance, theft, and normal. The entire dataset will be divided into three parts: training dataset, validation dataset, and test dataset. The data amounts of the training dataset, validation dataset, and test dataset are 70%, 10%, and 20% of the total data amount, respectively.
The training dataset is the primary part of the dataset used to teach a machine learning model. It includes labeled examples pairing input data with the corresponding target labels. The model learns by fine-tuning its internal parameters as it analyzes the training dataset repeatedly, striving to make highly accurate predictions. This iterative process continues until the model’s performance on the training data reaches an acceptable level through adjustments based on prediction errors. The validation dataset is a separate part of the data used to optimize the model’s hyperparameters and track its performance during training. As training progresses, the model’s hyperparameters are fine-tuned based on performance metrics measured on the validation data. This process ensures that the model generalizes effectively to new data and avoids overfitting the training dataset. The test dataset is a distinct subset of data that the model has not encountered during training or validation. Its purpose is to assess the final performance of the trained model and its ability to generalize to new, unseen data.
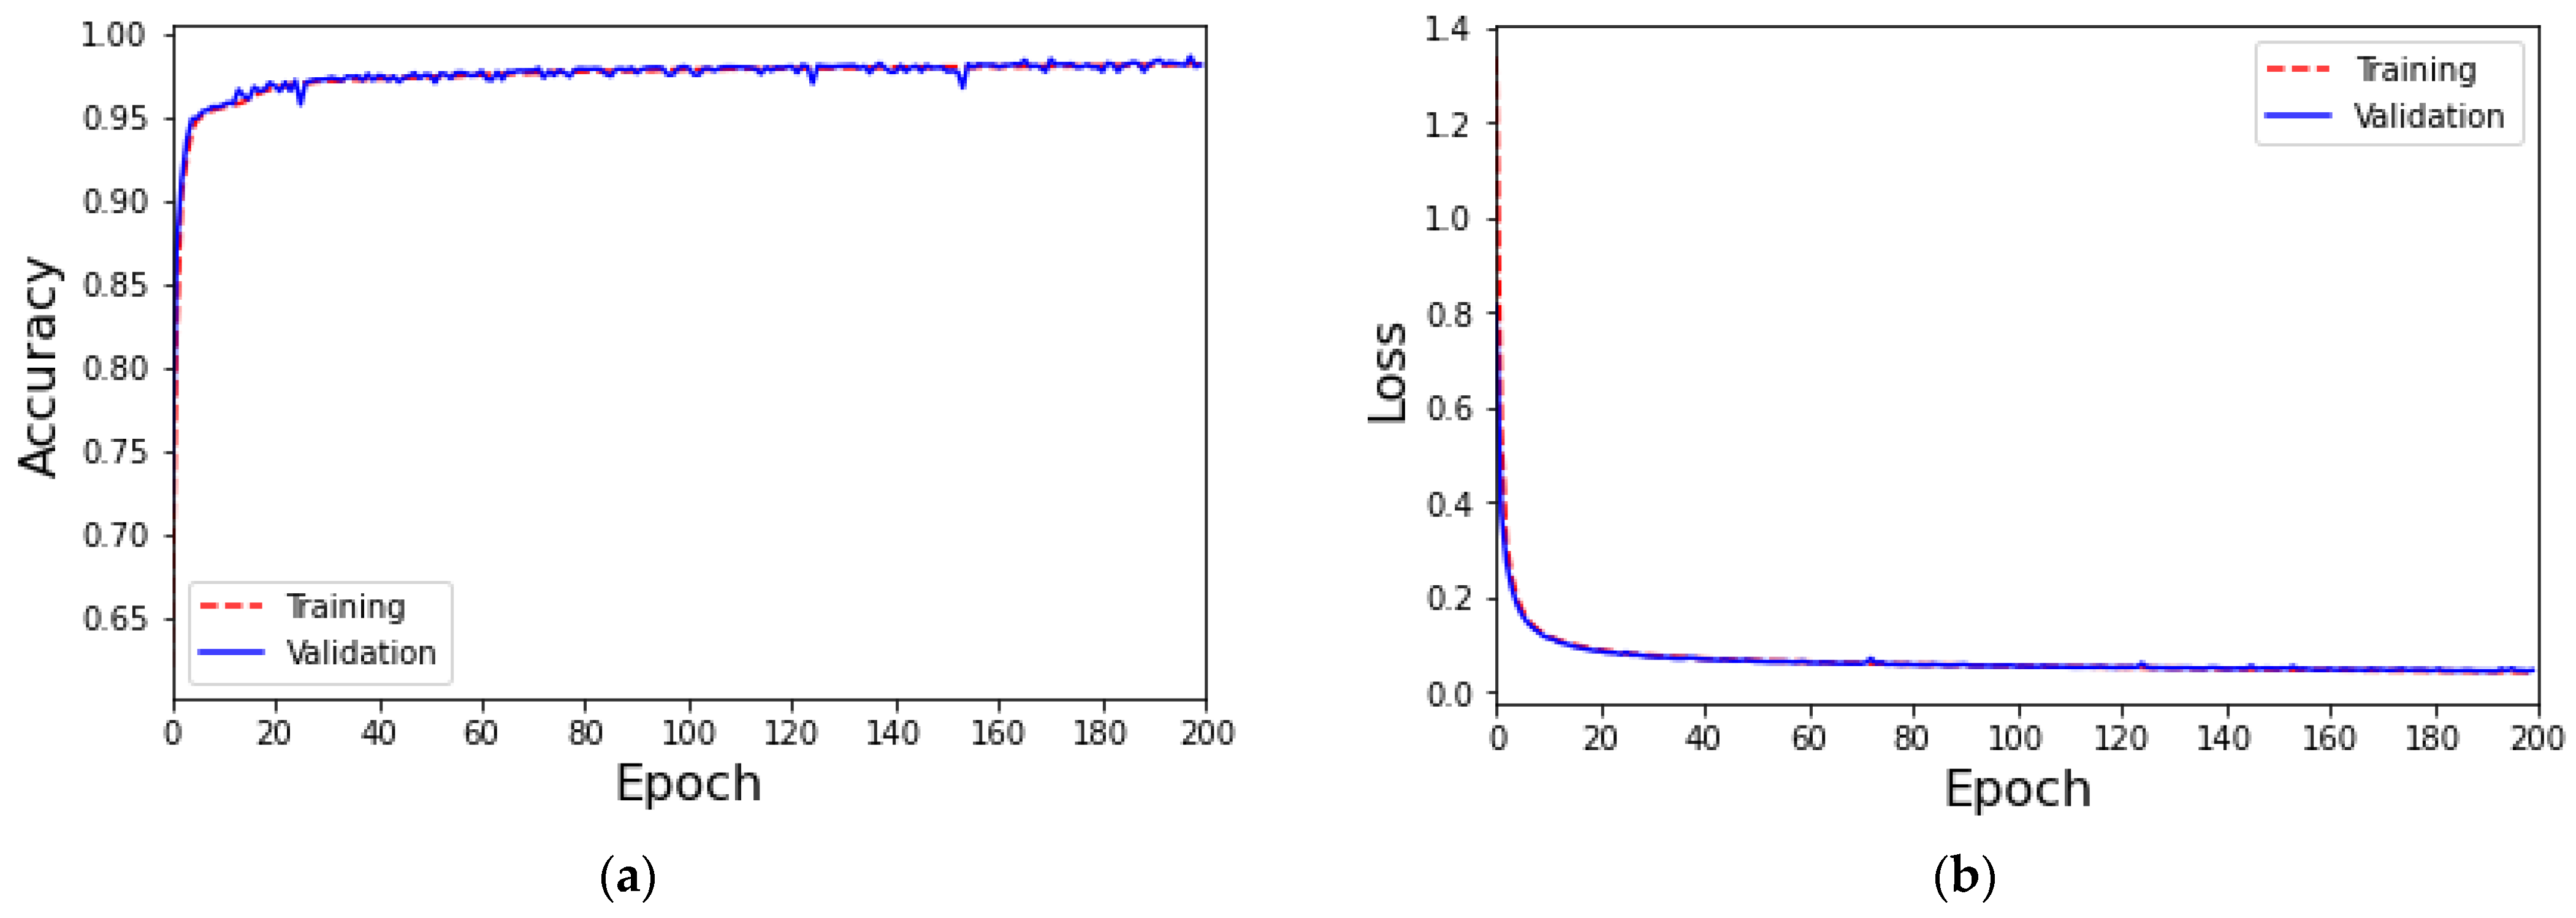
The experimental results of MLP-based IoT attack classification are shown in Figure 4. When the 129th training epoch is completed, the early stopping mechanism is triggered to prevent subsequent overtraining from affecting classification performance. Throughout the training process, as shown in Figure 4a, the accuracy of training and validation is maintained at 99%; as shown in Figure 4b, the loss values of training and validation are below 1%. It can be clearly seen that the curves of overall accuracy and loss value show a gradual convergence trend. The training time and testing time are 900 s and 40 s, respectively.
The performance analysis of the MLP’s IoT attack classification is shown in Table 6. It can be found that the accuracy, precision, and F1-score of the “Theft” class are all lower than 76%. Although the “Normal” class has good accuracy, the recall rate is only 88.22% and lower than the other three main classes. The reason for this result is that the amount of training data for the two classes is too small, which affects the classification effect of the model.
4.2. MLP-Based IoT Attack Classification with Data Augmentation for Generative Adversarial Networks
The dataset and processing used in this section are the same as the experiments in the previous section. The classification model used in this section is MLP-based IoT attack classification with data augmentation for GANs. After the overall performance of the MLP classification model is improved, the single classification performance of each class is examined separately. Use GANs to augment a single type of data. Both the augmented and original data will be sent to MLP for retraining to improve the classification accuracy of a single class. The experimental results of the loss of MLP-based IoT attack classification with data augmentation for GANs in the class “Theft” and class “Normal” are shown in Figure 5.
Experimental results show that in the early stages of training, it can be observed that the generator’s ability to simulate real data is relatively weak. This allows the discriminator to easily identify the fake data produced by the generator, causing the two loss curves to become unstable. However, as the training period increases, the generator will continuously strengthen the data it produces based on the feedback from the discriminator. This results in generated data that are closer to, but not identical to, real data, making it difficult for the discriminator to differentiate between real and generated data. At the same time, as the discriminator has difficulty distinguishing true from false, its loss value gradually increases, while the generator’s loss value decreases because the data it generates are closer to the real data. Eventually, the generator and the discriminator gradually become stable in their confrontation with each other, causing the loss value curve to converge stably. In Figure 5a, the GANs for the “Theft” class completed their training after 4932 epochs, with the generator’s loss reaching 0.7632 and the discriminator’s loss at 0.6853. In Figure 5b, the GANs handling the “Normal” class stopped training at the 3993rd epoch.
Based on the aforementioned results, once the GANs converge, it means that the data generated by GANs is close to the real data of the same class. Therefore, the GANs generator can be used to augment data for a specific class. The experimental results of the accuracy and loss of MLP-based IoT attack classification with data augmentation for GANs are shown in Figure 6. The accuracy of both training and validation remains at 99%, while the loss value is only about 1%. In addition, after using GANs for data augmentation, the performance of each class is shown in Table 7. The experimental results show that the classification performance of the two classes, “Theft” and “Normal”, has been significantly improved. That is, the accuracy, precision, recall, and F1-score are all higher than 90%. The training time and testing time are 1500 s and 60 s, respectively.
4.3. Validate Data Augmentation Mechanisms Using ToN-IoT Dataset
In the case of using the ToN-IoT dataset [33,34], the effectiveness and accuracy of the proposed data augmentation-based classification method were validated. The number of records in each class in the ToN-IoT dataset is shown in Table 8. As the fields in various publicly available datasets vary slightly, the following features were selected for training in this dataset: source IP, destination IP, transmission protocol, duration time, source bytes, destination bytes, number of missing bytes, number of original packets, total length of IP header field of source systems, number of destination packets, and total length of IP header field of destination systems. Data pre-processing is described in Section 3.2. There are 10 classes in the dataset, including 9 attack classes and 1 normal class.
The first experiment was to select only five classes (DoS, DDoS, Backdoor, Password, and Scanning) with sufficient data in the dataset to train the MLP classifier. The training parameters are as set in the previous section. The experimental results for the accuracy and loss of the proposed classification method are shown in Figure 7. In Figure 7a, the accuracy is relatively low in the early stages of training and verification, but as the training rounds increase, the accuracy can remain above 90%. In Figure 7b, the losses for training and validation are close to 0.16. The performance of each class is shown in Table 9. The experimental results show that the classification performance of the five classes has been significantly improved. That is, the accuracy, precision, recall, and F1-score are all higher than 90%. The training time and testing time are 38 s and 1.42 s, respectively.
The second experiment uses 10 data classes in the ToN-IoT dataset to train the MLP classifier. The training parameters are as set in the previous section. The accuracy and loss of the experimental results are shown in Figure 8. In Figure 8a, the accuracy is relatively low in the early stages of training and verification, but as the training rounds increase, the accuracy can remain above 97%. In Figure 8b, the losses for training and validation are close to 0.05. The performance of each class is shown in Table 10. The experimental results can find that the accuracy, recall rate, and F1-score of “DDoS”, “DoS”, and “Password” among the original five classes have dropped significantly. The accuracy of the “Mitm” classification is 96%, but the recall is only about 67%. The training time and testing time are 228 s and 5.7 s, respectively. Obviously, when the number of data in each class among the 10 classes is greatly different, the overall classification accuracy of the MLP classifier can reach 97%. However, the classification performance of each class in precision, recall, and F1 scores needs to be improved.
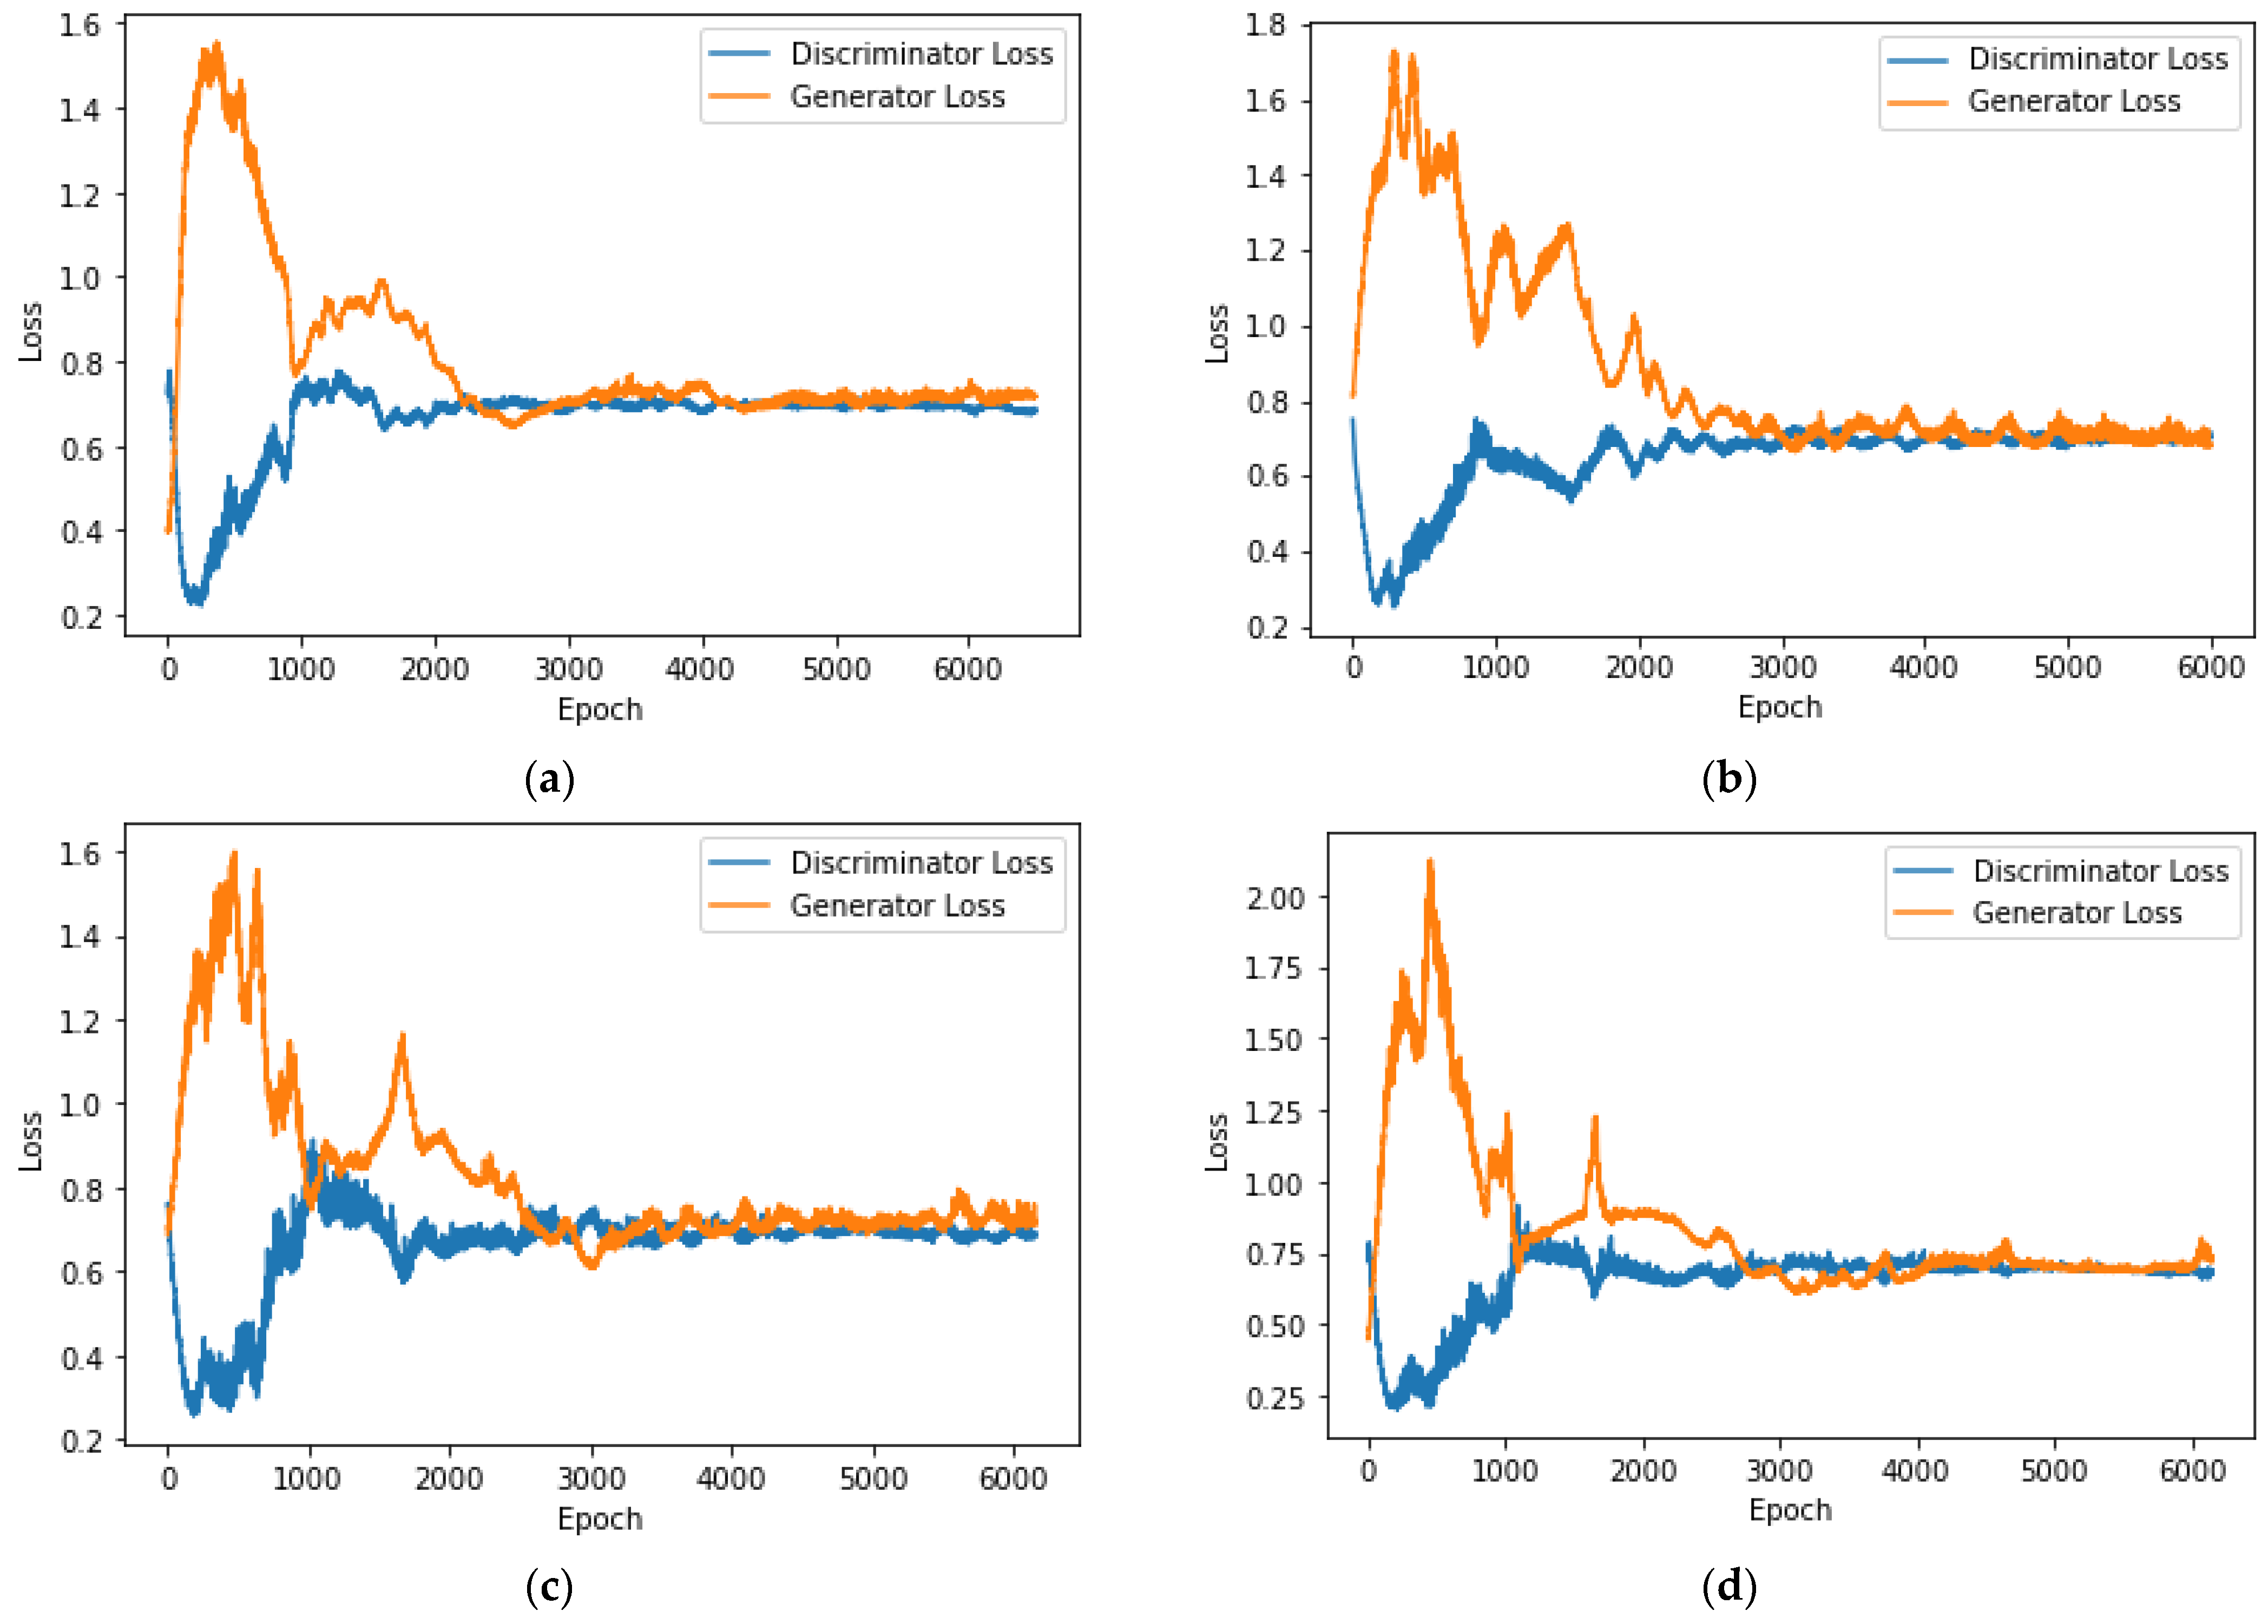
The third experiment is based on the training results of the MLP classifier in the second experiment and uses the proposed data augmentation method to improve the classification performance of each class. For the four classes of DoS, DDoS, Password, and Mitm, which have poor MLP classifier performance, GANs are used for data augmentation, respectively, to improve classification performance. The loss values of these four classes of generators and discriminators during training and verification are shown in Figure 9. In Figure 9a, the GANs for the “DoS” class completed their training after 6352 epochs, with the generator’s loss reaching 0.7456 and the discriminator’s loss at 0.6522. In Figure 9b, the GANs handling the “DDoS” class stopped training at the 5886th epoch, with the generator’s loss at 0.7312 and the discriminator’s loss at 0.6803. Moving to Figure 9c, GANs dedicated to the “Password” class concluded their training at the 6196th epoch, with the generator’s loss measuring 0.7466 and the discriminator’s loss at 0.6982. Finally, in Figure 9d, the GANs responsible for the “Mitm” class finalized their training after 6151 epochs, resulting in a generator’s loss of 0.7029 and a discriminator’s loss of 0.6834.
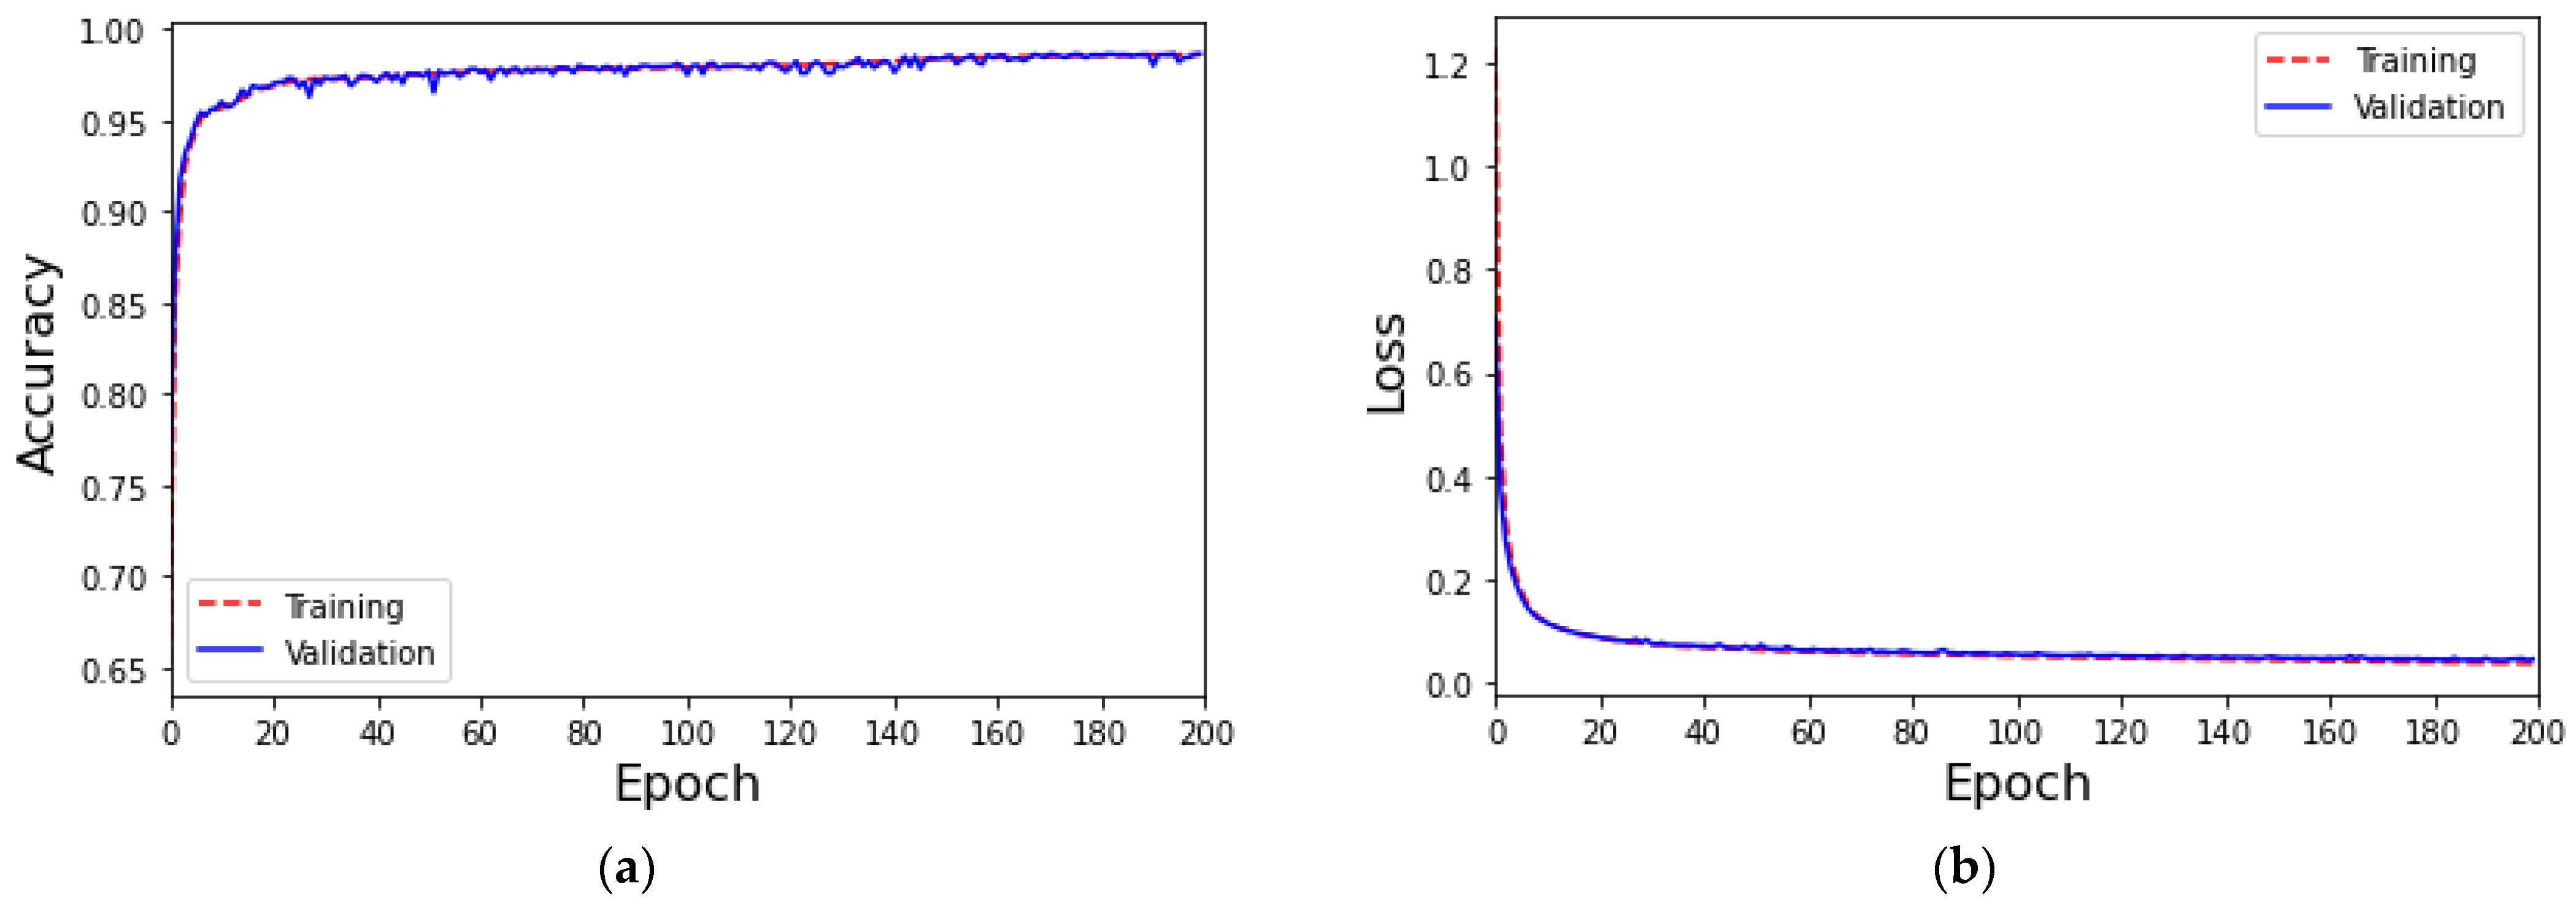
Add the augmented data to the original dataset to expand it into a new dataset. Use this new dataset for the training of the MLP classifier classification. The training accuracy and loss values are shown in Figure 10. The accuracy of both training and validation remains at 98%, while the loss value is only about 3.7%. The performance of each class is shown in Table 11. The classification performance of all 10 classes exceeds 90% in precision, recall, and F1-score.
4.4. Comparison with Other Methods
This section will compare the classification performance with the cited literature [10,11,20], as shown in Table 12. Based on the same BoT-IoT dataset, both models use GANs to solve classification problems. In [10], there is an attack classification model that integrates GANs and AutoEncoder but only distinguishes data into two classes: attack and non-attack. The literature [11] is a multiclass attack classification model that integrates conditional GANs and the feed-forward neural network (FNN). The comparison results show that the proposed method is better than the literature [11] in four performance indicators: accuracy, precision, recall, and F1-score. Although the performance of the proposed method in precision, recall, and F1-score is slightly lower than that of the literature [10] by 2%, the method of the literature [10] can only perform binary classification (attack and non-attack). The proposed method can achieve excellent classification performance for all five classes, reaching more than 90% in the four indicators of accuracy, precision, recall, and F1-score.
Additionally, the proposed classification method was trained using the ToN-IoT dataset. The results demonstrate that the proposed method outperforms the approach presented in the literature [20] that also used the same dataset. Moreover, regardless of whether the BoT-IoT dataset or the ToN-IoT dataset is used, the overall classification performance in terms of accuracy, precision, recall, and F1-score consistently exceeds 95%, while individual class performance exceeds 90%.
5. Conclusions
The rapid development of IoT technology has brought convenient services and applications. However, the ensuing IoT attacks are increasing rapidly. Therefore, this article proposes a classification model that combines MLP and GANs to provide an appropriate data amplification mechanism to improve the classification performance of a single class. The experimental results demonstrate that when using the BoT-IoT dataset, the proposed method effectively augments data for the “Theft” and “Normal” classes, resulting in classification accuracy, precision, recall, and F1-score, all exceeding 90%. The overall classification performance in terms of accuracy, precision, recall, and F1-score consistently surpasses 95%. Furthermore, to validate the robustness and practicality of the proposed method, it was applied to different datasets, and the results were observed. When using the ToN-IoT dataset, the proposed method indeed augments data for the “DoS”, “DDoS”, “Mitm”, and “Password” classes, leading to classification accuracy, precision, recall, and F1-scores all exceeding 90% for these classes. The overall classification performance, in this case, consistently exceeds 97%.
In future work, we will explore various types of datasets and focus on the quantity and timing of precise data augmentation to speed up the training time and testing time of the classification model. As the dataset currently used is in CSV format, unlike real-world IoT attack data, feature selection for the training set will be explored. Thus, the proposed method can be directly applied to actual network equipment and achieve instant and accurate attack classification.
Author Contributions
Conceptualization, H.-C.C. and Y.-J.L.; Methodology, H.-C.C.; Software, Y.-J.L.; Validation, H.-C.C. and Y.-J.L.; Formal analysis, H.-C.C. and Y.-J.L.; Investigation, H.-C.C. and Y.-J.L.; Resources, H.-C.C. and Y.-J.L.; Data curation, Y.-J.L.; Writing–original draft, H.-C.C. and Y.-J.L.; Writing–review & editing, H.-C.C.; Visualization, H.-C.C. and Y.-J.L.; Supervision, H.-C.C.; Project administration, H.-C.C.; Funding acquisition, H.-C.C. All authors have read and agreed to the published version of the manuscript.
Funding
This research was funded by the Endian Hardware Co., Ltd., Taiwan, under grants 111B515 and 111B516.
Institutional Review Board Statement
Not applicable.
Informed Consent Statement
Not applicable.
Data Availability Statement
The data presented in this study are openly available in BoT-IoT at https://research.unsw.edu.au/projects/bot-iot-dataset (accessed on 15 April 2023) and ToN-IoT at https://research.unsw.edu.au/projects/toniot-datasets (accessed on 15 April 2023).
Conflicts of Interest
The authors declare that this study received funding from the Endian Hardware Co., Ltd. The funder was not involved in the study design, collection, analysis, interpretation of data, the writing of this article or the decision to submit it for publication.
References
- Mishra, N.; Pandya, S. Internet of Things Applications, Security Challenges, Attacks, Intrusion Detection, and Future Visions: A Systematic Review. IEEE Access 2021, 9, 59353–59377. [Google Scholar] [CrossRef]
- State of IoT 2022: Number of Connected IoT Devices Growing 18% to 14.4 Billion Globally. Available online: https://iotbusinessnews.com/2022/05/19/70343-state-of-iot-2022-number-of-connected-iot-devices-growing-18-to-14-4-billion-globally (accessed on 20 July 2022).
- 2023 SonicWall Cyber Threat Report. Available online: https://www.sonicwall.com/2023-cyber-threat-report/ (accessed on 10 March 2023).
- Dini, P.; Elhanashi, A.; Begni, A.; Saponara, S.; Zheng, Q.; Gasmi, K. Overview on Intrusion Detection Systems Design Exploiting Machine Learning for Networking Cybersecurity. Appl. Sci. 2023, 13, 7507. [Google Scholar] [CrossRef]
- Martins, I.; Resende, J.S.; Sousa, P.R.; Silva, S.; Antunes, L.; Gama, J. Host-based IDS: A review and open issues of an anomaly detection system in IoT. Future Gener. Comput. Syst. 2022, 133, 95–113. [Google Scholar] [CrossRef]
- Tudor, D. What Is a Host Intrusion Detection System (HIDS) and How It Works. Available online: https://heimdalsecurity.com/blog/host-intrusion-detection-system-hids/ (accessed on 17 December 2021).
- Cil, A.E.; Yildiz, K.; Buldu, A. Detection of DDoS attacks with feed forward based deep neural network model. Expert Syst. Appl. 2021, 169, 114520. [Google Scholar] [CrossRef]
- Vishwakarma, M.; Kesswani, N. DIDS: A Deep Neural Network based real-time Intrusion detection system for IoT. Decis. Anal. J. 2022, 5, 100142. [Google Scholar] [CrossRef]
- Li, Y.; Xu, Y.; Liu, Z.; Hou, H.; Zheng, Y.; Xin, Y.; Zhao, Y.; Cui, L. Robust detection for network intrusion of industrial IoT based on multi-CNN fusion. Measurement 2020, 154, 107450. [Google Scholar] [CrossRef]
- Khan, M.A. HCRNNIDS: Hybrid Convolutional Recurrent Neural Network-Based Network Intrusion Detection System. Processes 2021, 9, 834. [Google Scholar] [CrossRef]
- Ullah, I.; Mahmoud, Q.H. Design and development of a deep learning-based model for anomaly detection in IoT networks. IEEE Access 2021, 9, 103906–103926. [Google Scholar] [CrossRef]
- Tareq, I.; Elbagoury, B.M.; El-Regaily, S.; El-Horbaty, E.S.M. Analysis of ToN-IoT, UNW-NB15, and Edge-IIoT datasets using dl in cybersecurity for IoT. Appl. Sci. 2022, 12, 9572. [Google Scholar] [CrossRef]
- Yin, C.; Zhu, Y.; Fei, J.; He, X. A deep learning approach for intrusion detection using recurrent neural networks. IEEE Access 2017, 5, 21954–21961. [Google Scholar] [CrossRef]
- Zeeshan, M.; Riaz, Q.; Bilal, M.A.; Shahzad, M.K.; Jabeen, H.; Haider, S.A.; Rahim, A. Protocol-Based Deep Intrusion Detection for DoS and DDoS Attacks Using UNSW-NB15 and Bot-IoT Data-Sets. IEEE Access 2021, 10, 2269–2283. [Google Scholar] [CrossRef]
- Gaur, V.; Kumar, R. DDoSLSTM: Detection of Distributed Denial of Service Attacks on IoT Devices using LSTM Model. In Proceedings of the 2022 International Conference on Communication, Computing and Internet of Things (IC3IoT), Chennai, India, 10–11 March 2022; pp. 1–7. [Google Scholar]
- Rehman, S.U.; Khaliq, M.; Imtiaz, S.I.; Rasool, A.; Shafiq, M.; Javed, A.R.; Jalil, Z.; Bashir, A.K. DIDDOS: An approach for detection and identification of Distributed Denial of Service (DDoS) cyberattacks using Gated Recurrent Units (GRU). Future Gener. Comput. Syst. 2021, 118, 453–466. [Google Scholar] [CrossRef]
- Yao, W.; Hu, L.; Hou, Y.; Li, X. A Lightweight Intelligent Network Intrusion Detection System Using One-Class Autoencoder and Ensemble Learning for IoT. Sensors 2023, 23, 4141. [Google Scholar] [CrossRef]
- Zhang, H.; Zhang, B.; Huang, L.; Zhang, Z.; Huang, H. An Efficient Two-Stage Network Intrusion Detection System in the Internet of Things. Information 2023, 14, 77. [Google Scholar] [CrossRef]
- Goodfellow, I.; Pouget-Abadie, J.; Mirza, M.; Xu, B.; Warde-Farley, D.; Ozair, S.; Courville, A.; Bengio, Y. Generative Adversarial Nets. In Advances in Neural Information Processing Systems; Ghahramani, Z., Welling, M., Cortes, C., Lawrence, N., Weinberger, K.Q., Eds.; Neural Information Processing Systems Foundation, Inc.: La Jolla, CA, USA, 2014; pp. 2672–2680. [Google Scholar]
- Zixu, T.; Liyanage, K.S.K.; Gurusamy, M. Generative Adversarial Network and Auto Encoder based Anomaly Detection in Distributed IoT Networks. In Proceedings of the GLOBECOM 2020-2020 IEEE Global Communications Conference, Taipei, Taiwan, 7–11 December 2020; pp. 1–7. [Google Scholar]
- Ullah, I.; Mahmoud, Q.H. A Framework for Anomaly Detection in IoT Networks Using Conditional Generative Adversarial Networks. IEEE Access 2021, 9, 165907–165931. [Google Scholar] [CrossRef]
- Park, C.; Lee, J.; Kim, Y.; Park, J.G.; Kim, H.; Hong, D. An enhanced ai-based network intrusion detection system using generative adversarial networks. IEEE Internet Things J. 2022, 10, 2330–2345. [Google Scholar] [CrossRef]
- Chu, H.C.; Lin, Y.J. IoT Attack Classification Based on Generative Adversarial Networks. In Proceedings of the 6th IEEE International Conference on Knowledge Innovation and Invention, Sapporo, Japan, 11–13 August 2023. [Google Scholar]
- Koroniotis, N.; Moustafa, N.; Sitnikova, E.; Turnbull, B. Towards the development of realistic botnet dataset in the internet of things for network forensic analytics: Bot-IoT dataset. Future Gener. Comput. Syst. 2019, 100, 779–796. [Google Scholar] [CrossRef]
- Foundation, T.O. Node-Red: Low-Code Programming for Event-Driven Applications. Available online: https://nodered.org/ (accessed on 15 March 2022).
- Jekyll. Ostinato Traffic Generator for Network Engineers. Available online: https://ostinato.org/ (accessed on 16 March 2022).
- González-Granadillo, G.; González-Zarzosa, S.; Diaz, R. Security Information and Event Management (SIEM): Analysis, Trends, and Usage in Critical Infrastructures. Sensors 2021, 21, 4759. [Google Scholar] [CrossRef]
- Li, Z.; Usman, M.; Tao, R.; Xia, P.; Wang, C.; Chen, H.; Li, B. A systematic survey of regularization and normalization in GANs. ACM Comput. Surv. 2023, 55, 1–37. [Google Scholar] [CrossRef]
- Singh, D.; Singh, B. Investigating the impact of data normalization on classification performance. Appl. Soft Comput. 2020, 97, 105524. [Google Scholar] [CrossRef]
- Zhang, T.; Zhu, T.; Gao, K.; Zhou, W.; Philip, S.Y. Balancing learning model privacy, fairness, and accuracy with early stopping criteria. IEEE Trans. Neural Netw. Learn. Syst. 2021, 34, 5557–5569. [Google Scholar] [CrossRef]
- Chicco, D.; Jurman, G. The advantages of the Matthews correlation coefficient (MCC) over F1 score and accuracy in binary classification evaluation. BMC Genom. 2020, 21, 6. [Google Scholar] [CrossRef] [PubMed]
- Chicco, D.; Tötsch, N.; Jurman, G. The Matthews correlation coefficient (MCC) is more reliable than balanced accuracy, bookmaker informedness, and markedness in two-class confusion matrix evaluation. BioData Mining 2021, 14, 13. [Google Scholar] [CrossRef] [PubMed]
- Moustafa, N. A new distributed architecture for evaluating AI-based security systems at the edge: Network TON_IoT datasets. Sustain. Cities Soc. 2021, 72, 102994. [Google Scholar] [CrossRef]
- Alsaedi, A.; Moustafa, N.; Tari, Z.; Mahmood, A.; Anwar, A. TON_IoT telemetry dataset: A new generation dataset of IoT and IIoT for data-driven intrusion detection systems. IEEE Access 2020, 8, 165130–165150. [Google Scholar] [CrossRef]
Figure 1.
Model of GANs.

Figure 2.
The classification mechanism with data augmentation for GANs.
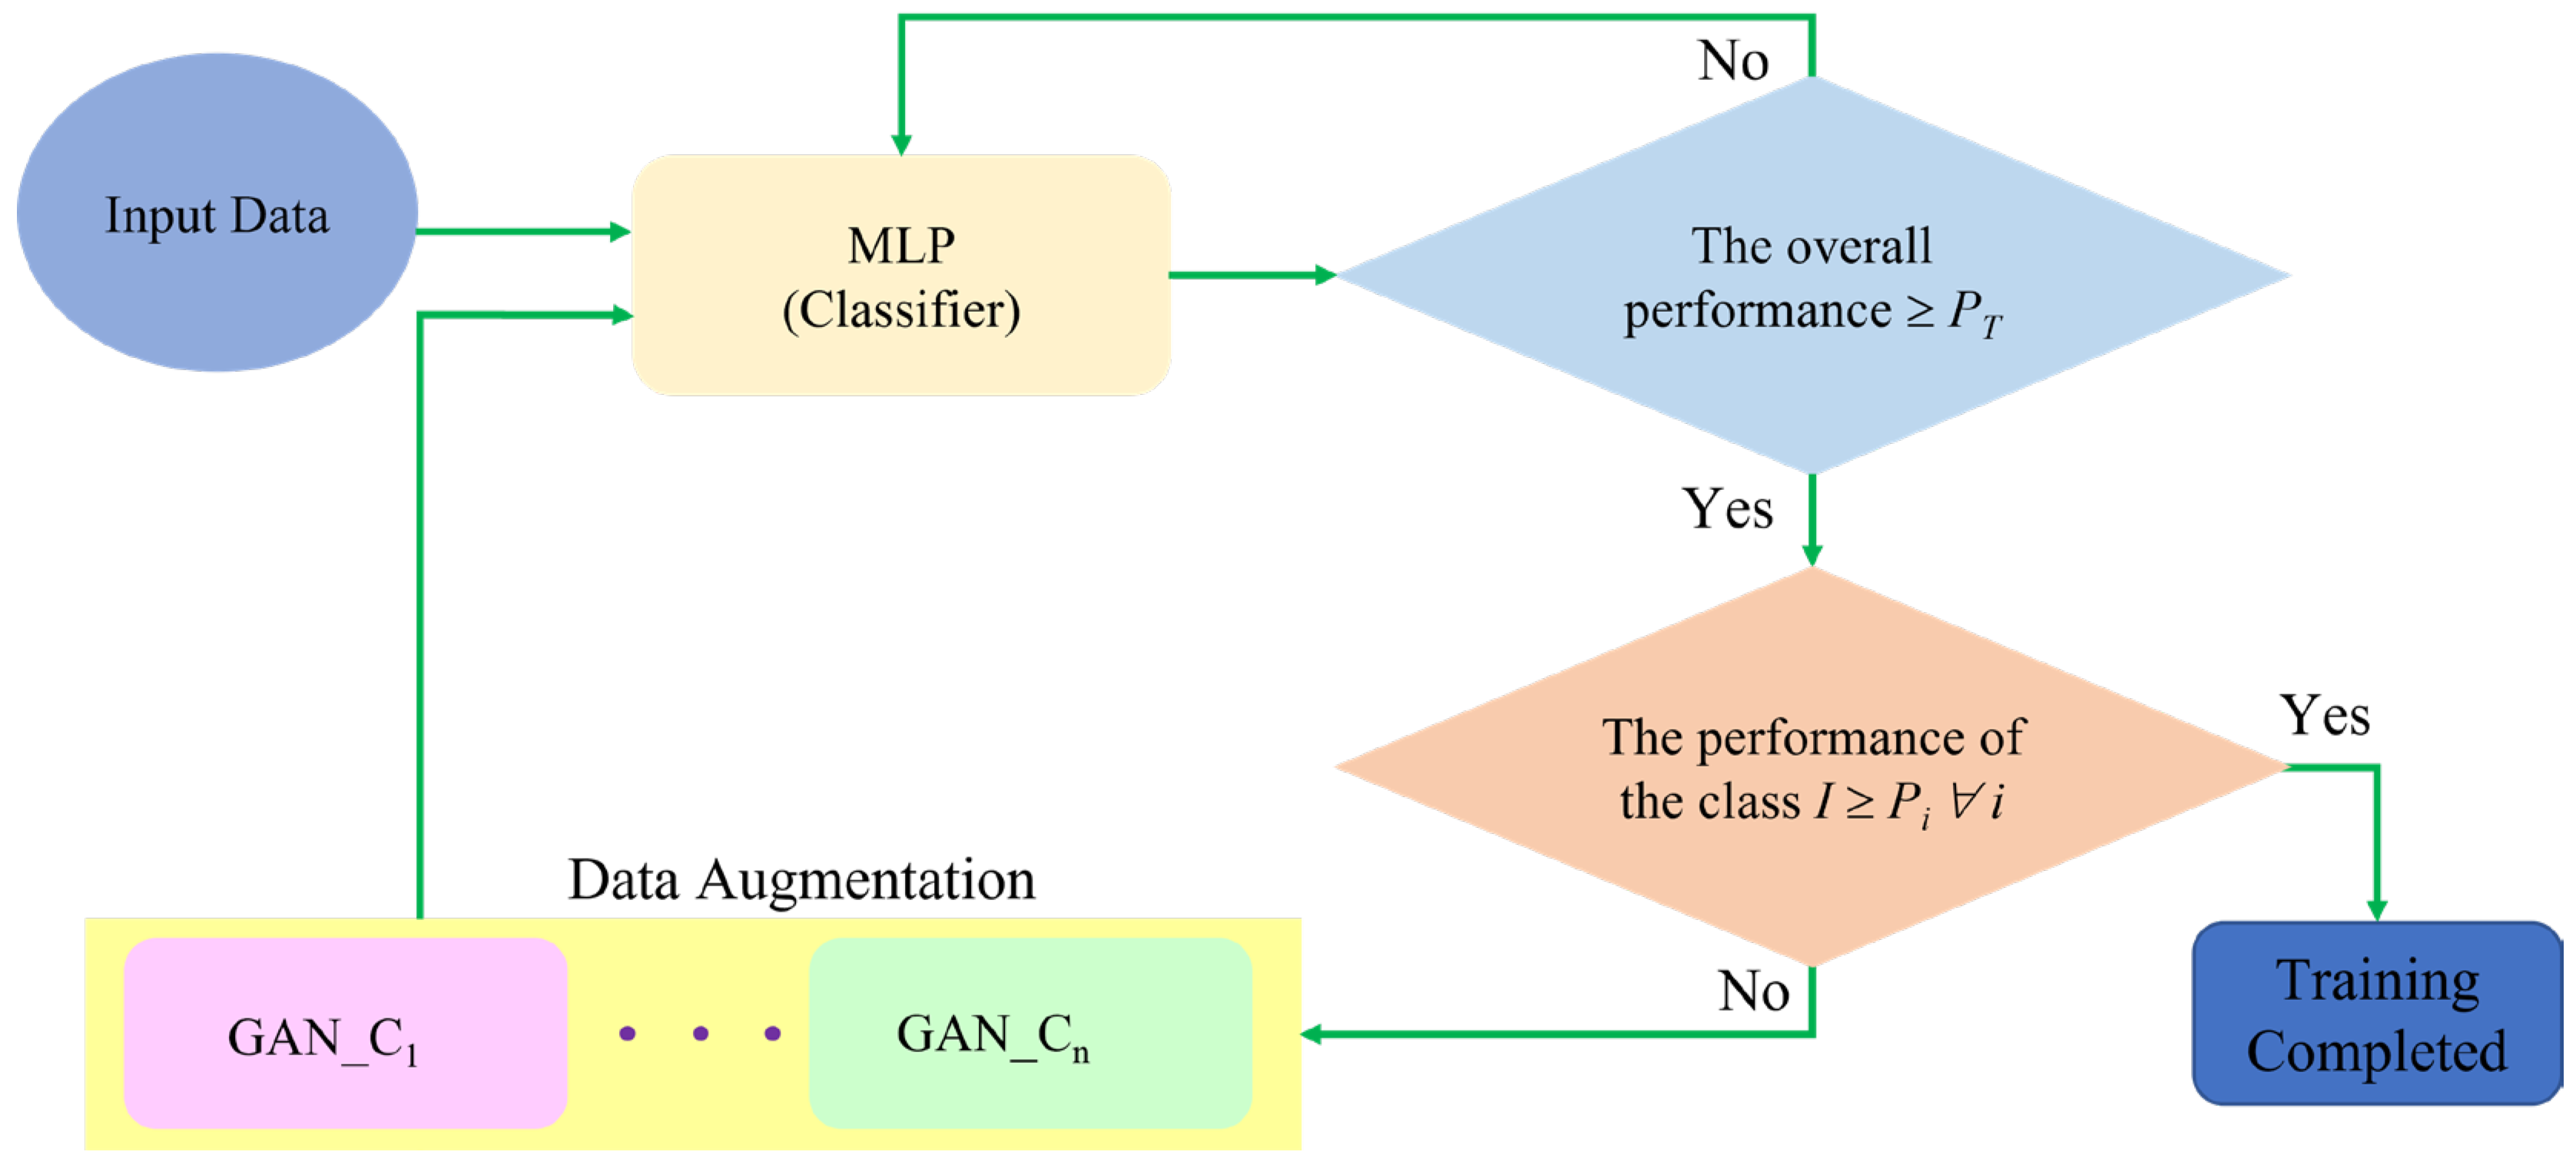
Figure 3.
Confusion matrix.

Figure 4.
(a) The accuracy of the MLP-based IoT attack classification and (b) the loss of the MLP-based IoT attack classification.
Figure 4.
(a) The accuracy of the MLP-based IoT attack classification and (b) the loss of the MLP-based IoT attack classification.
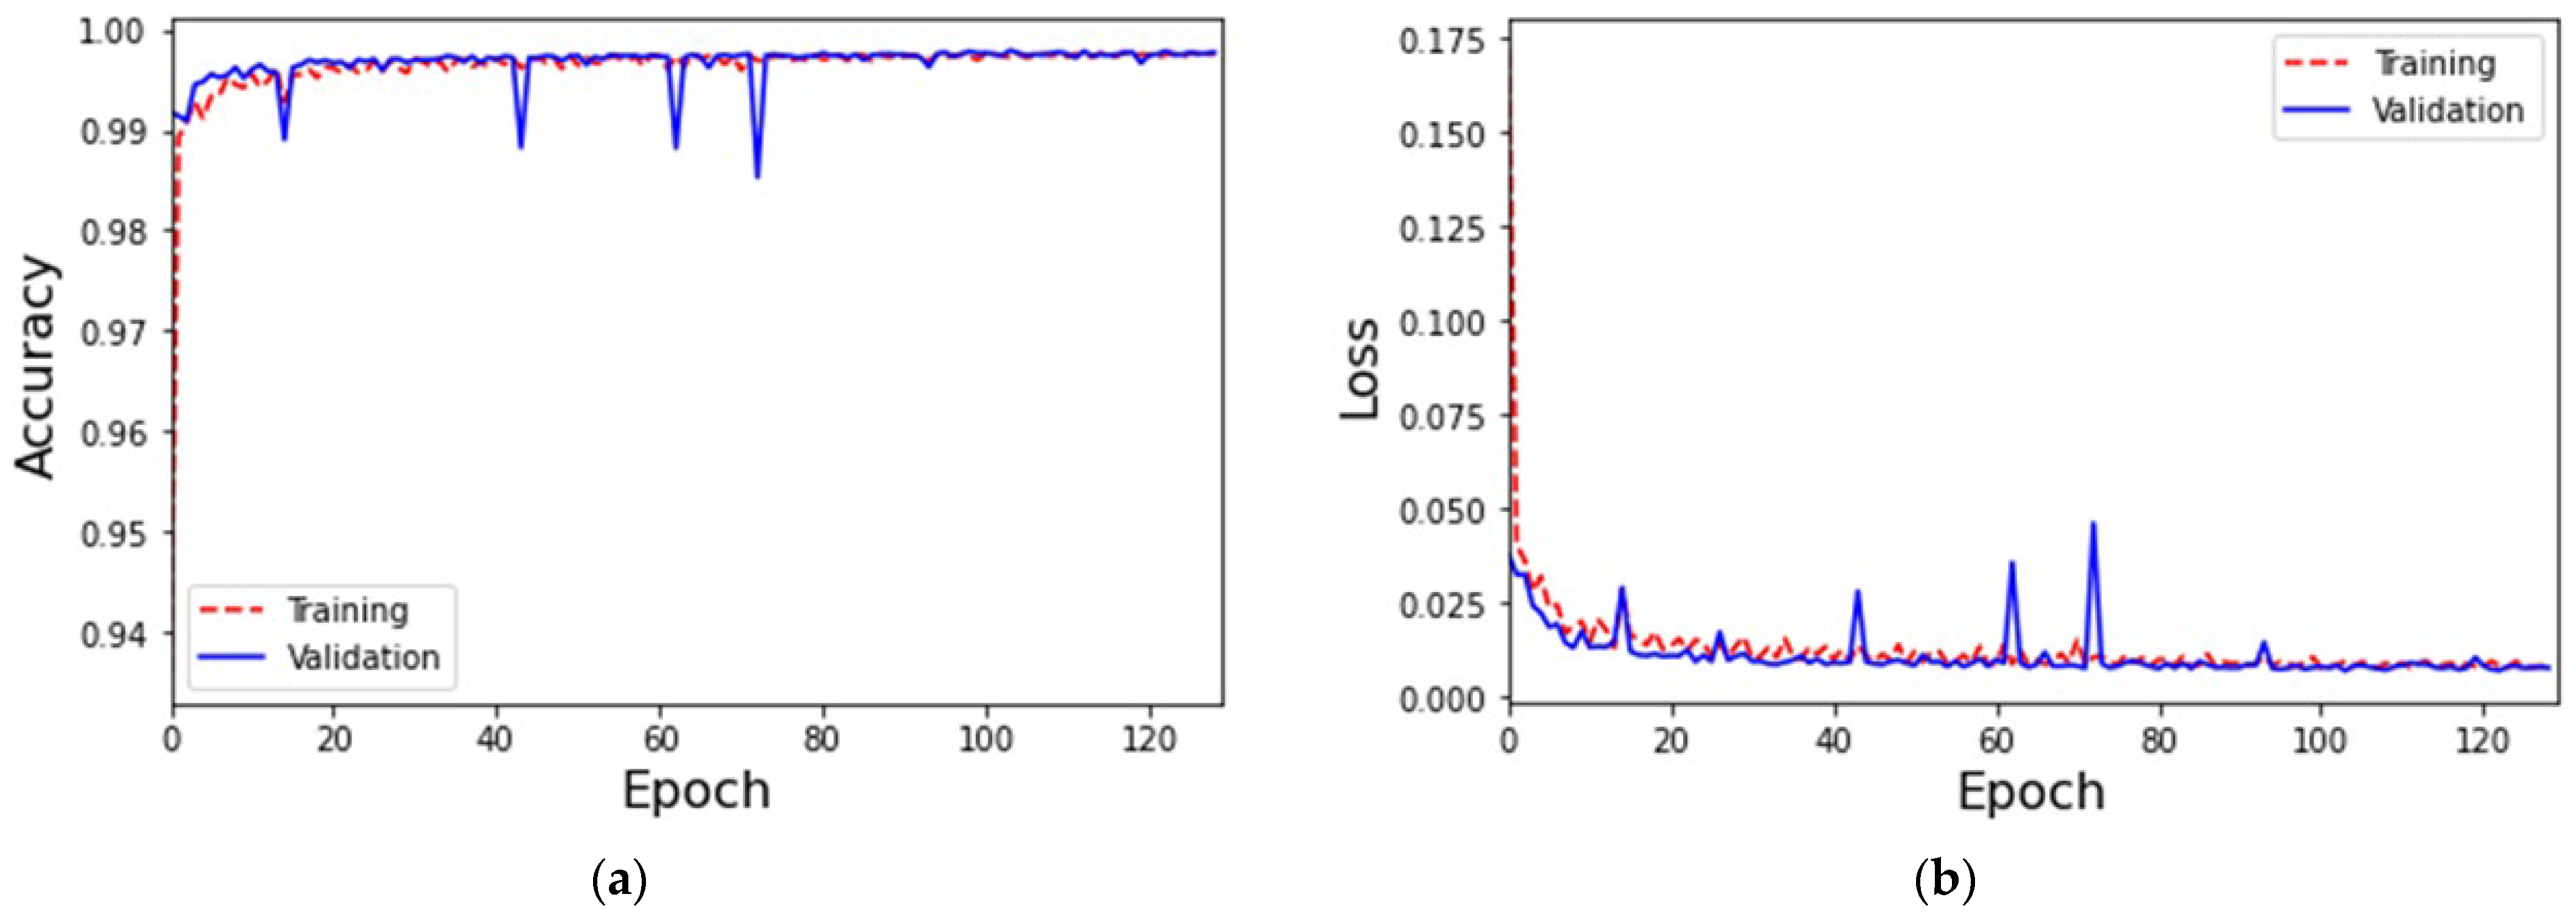
Figure 5.
(a) The loss of the MLP-based IoT attack classification with data augmentation for GANs in the class “Theft” and (b) the loss of the MLP-based IoT attack classification with data augmentation for GANs in the class “Normal”.
Figure 5.
(a) The loss of the MLP-based IoT attack classification with data augmentation for GANs in the class “Theft” and (b) the loss of the MLP-based IoT attack classification with data augmentation for GANs in the class “Normal”.
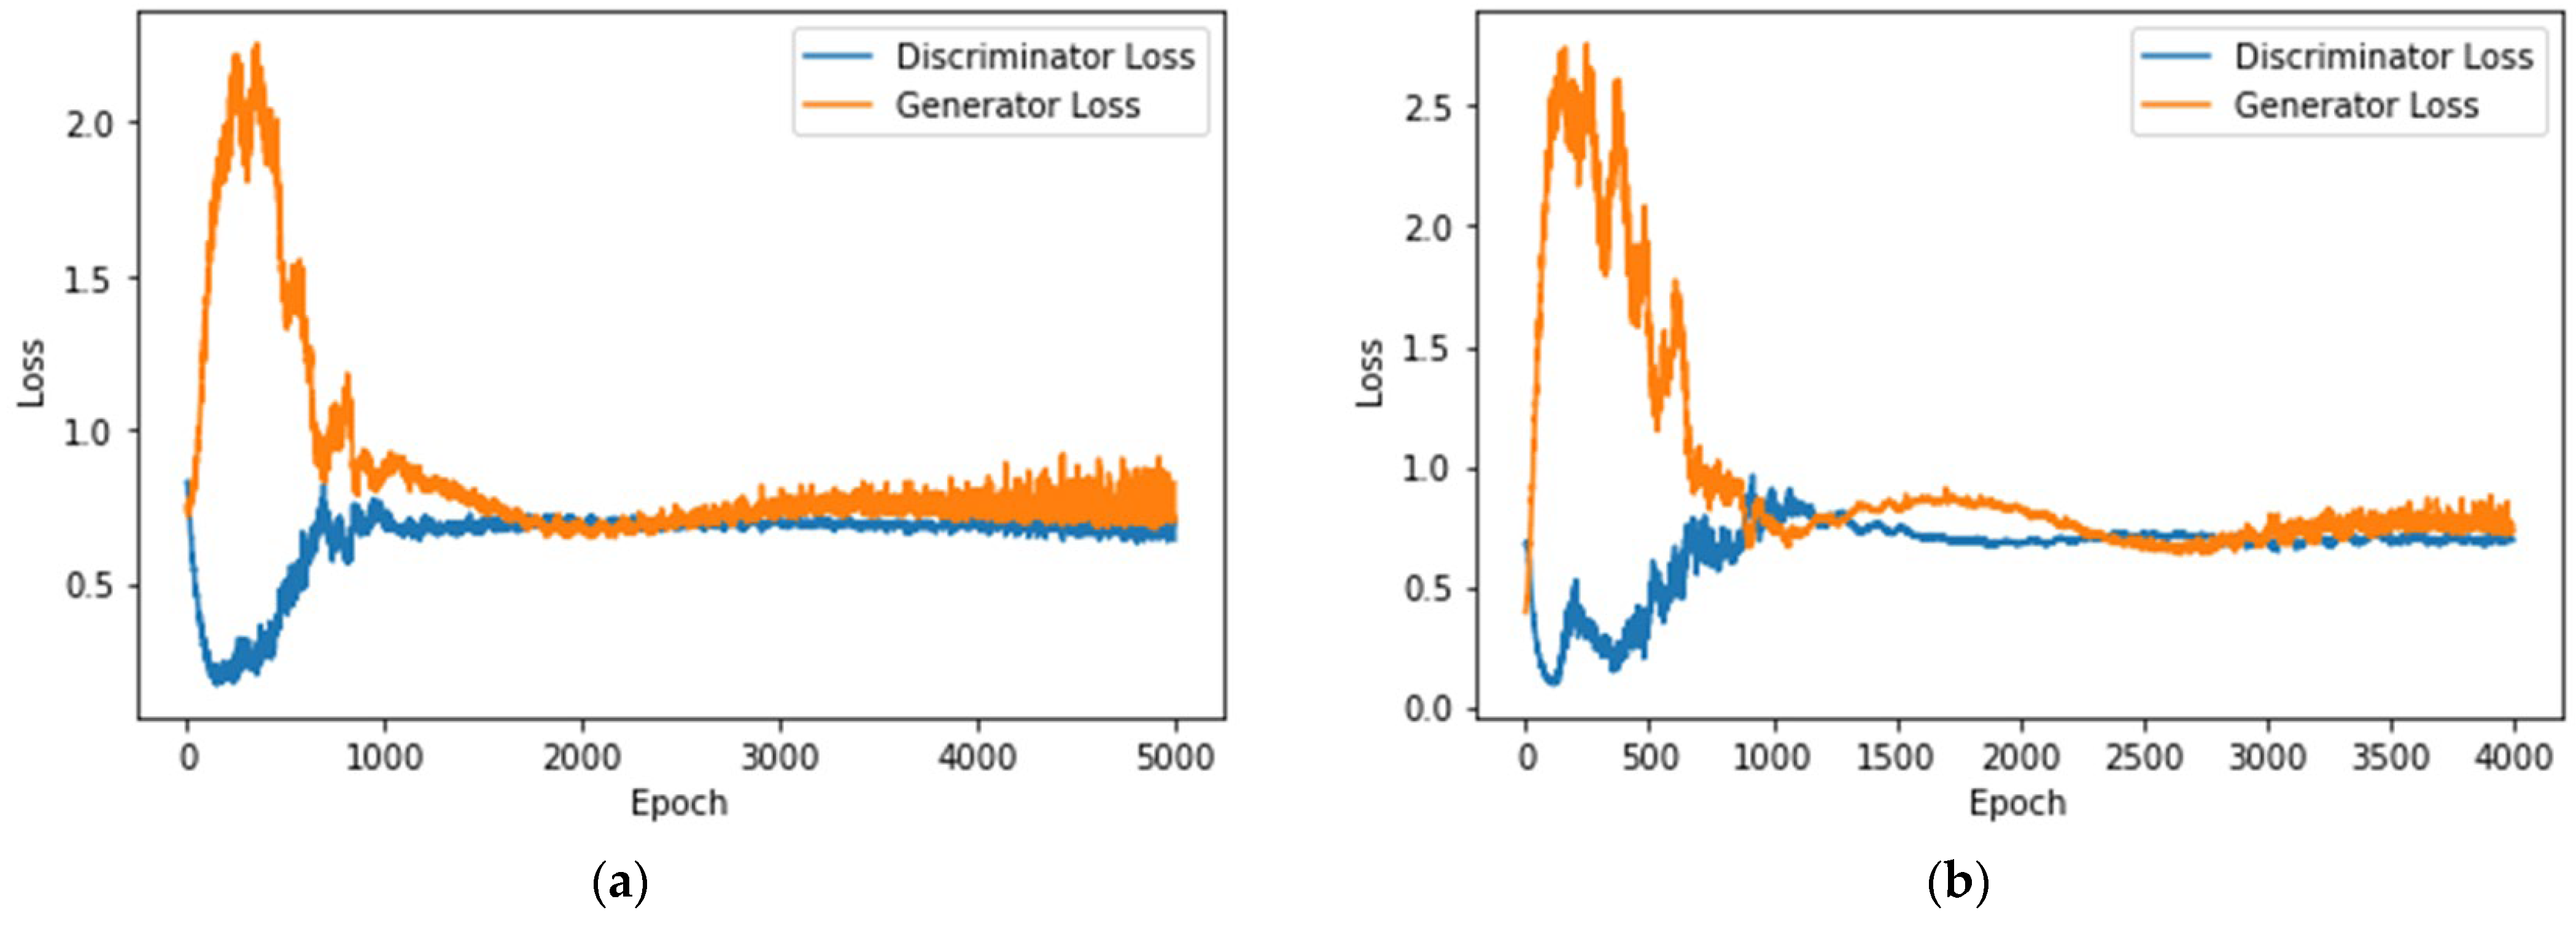
Figure 6.
(a) The accuracy of the MLP-based IoT attack classification with data augmentation for GANs and (b) the loss of the MLP-based IoT attack classification with data augmentation for GANs.
Figure 6.
(a) The accuracy of the MLP-based IoT attack classification with data augmentation for GANs and (b) the loss of the MLP-based IoT attack classification with data augmentation for GANs.
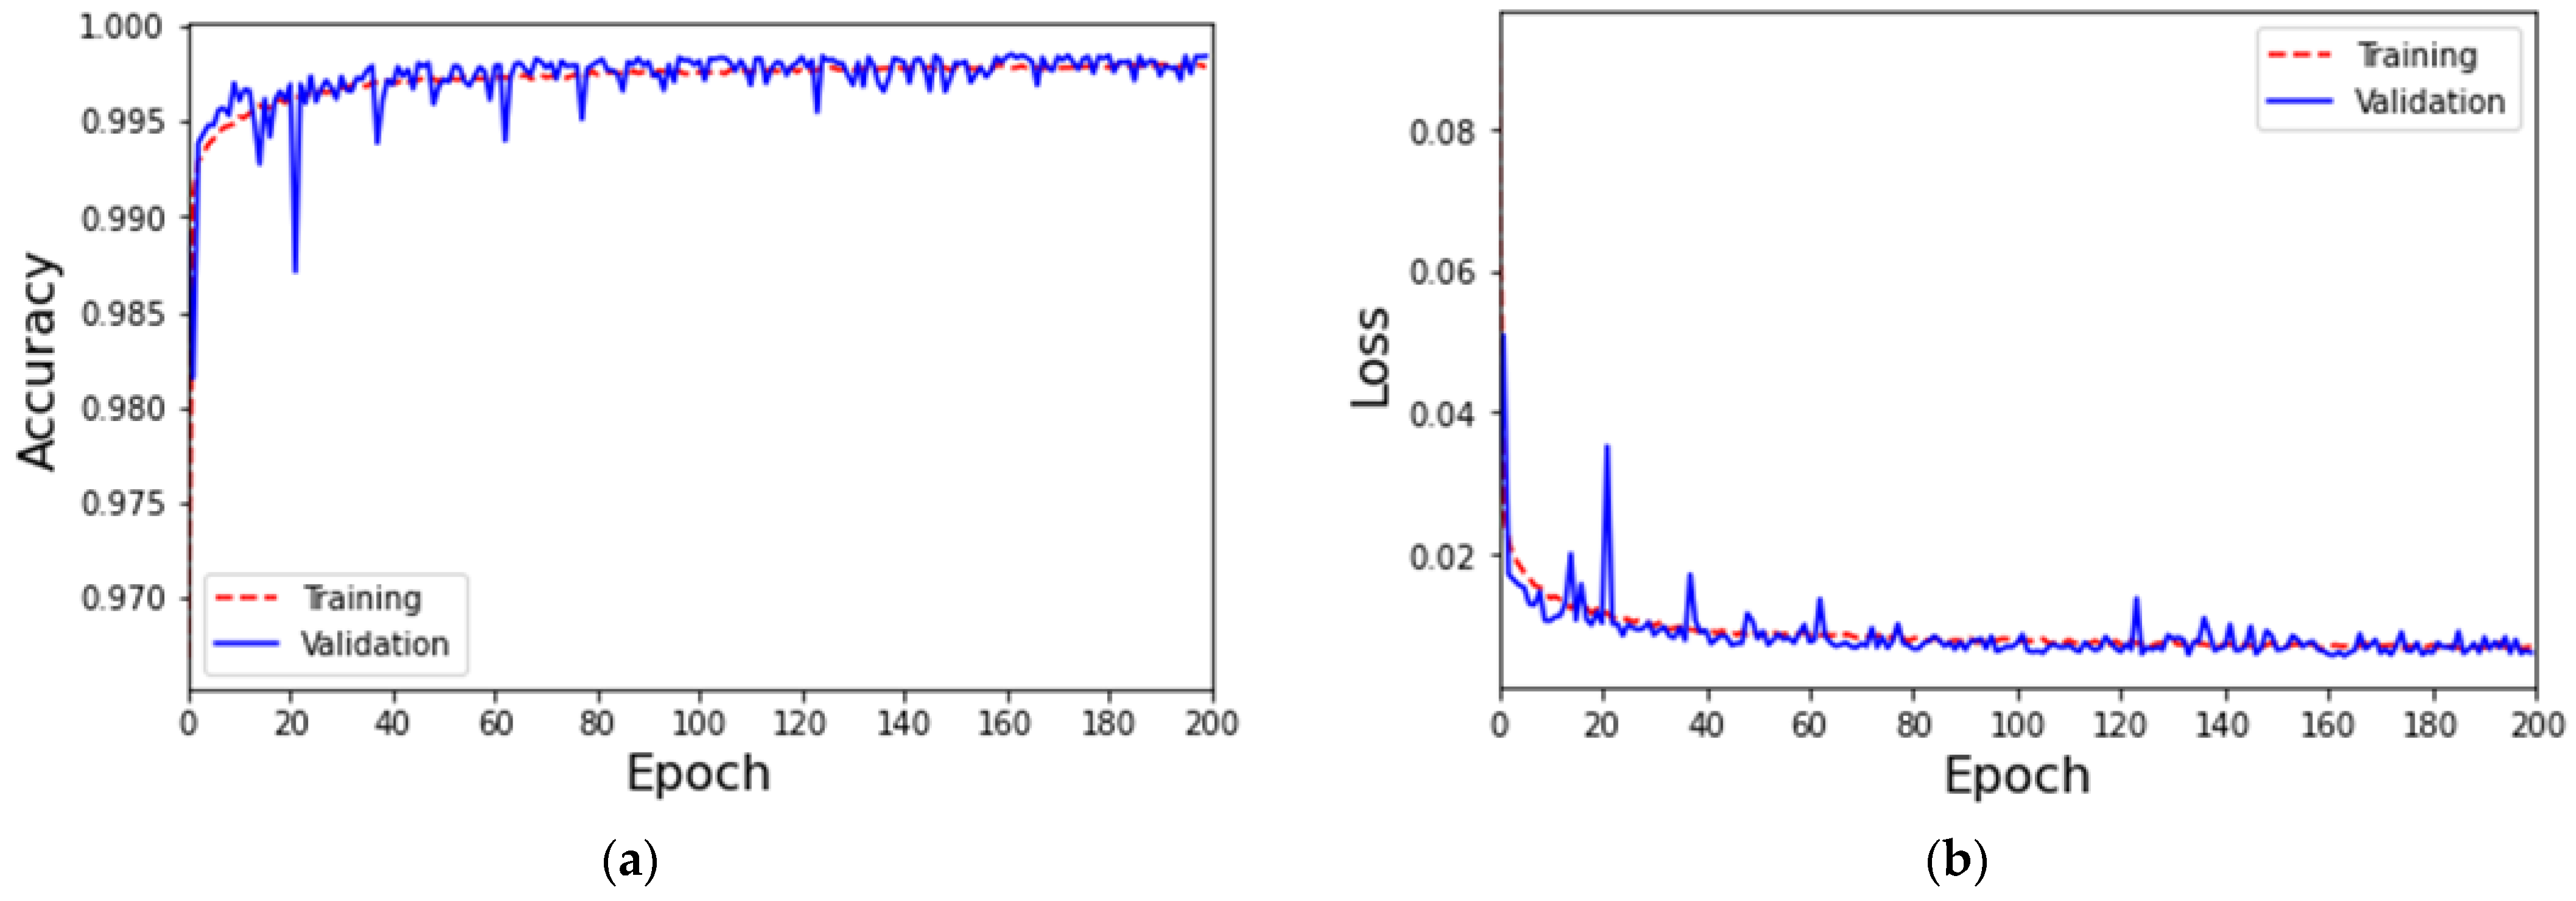
Figure 7.
(a) The accuracy of five classes in the ToN-IoT dataset based on the MLP classifier and (b) the loss of five classes in the ToN-IoT dataset based on the MLP classifier.
Figure 7.
(a) The accuracy of five classes in the ToN-IoT dataset based on the MLP classifier and (b) the loss of five classes in the ToN-IoT dataset based on the MLP classifier.
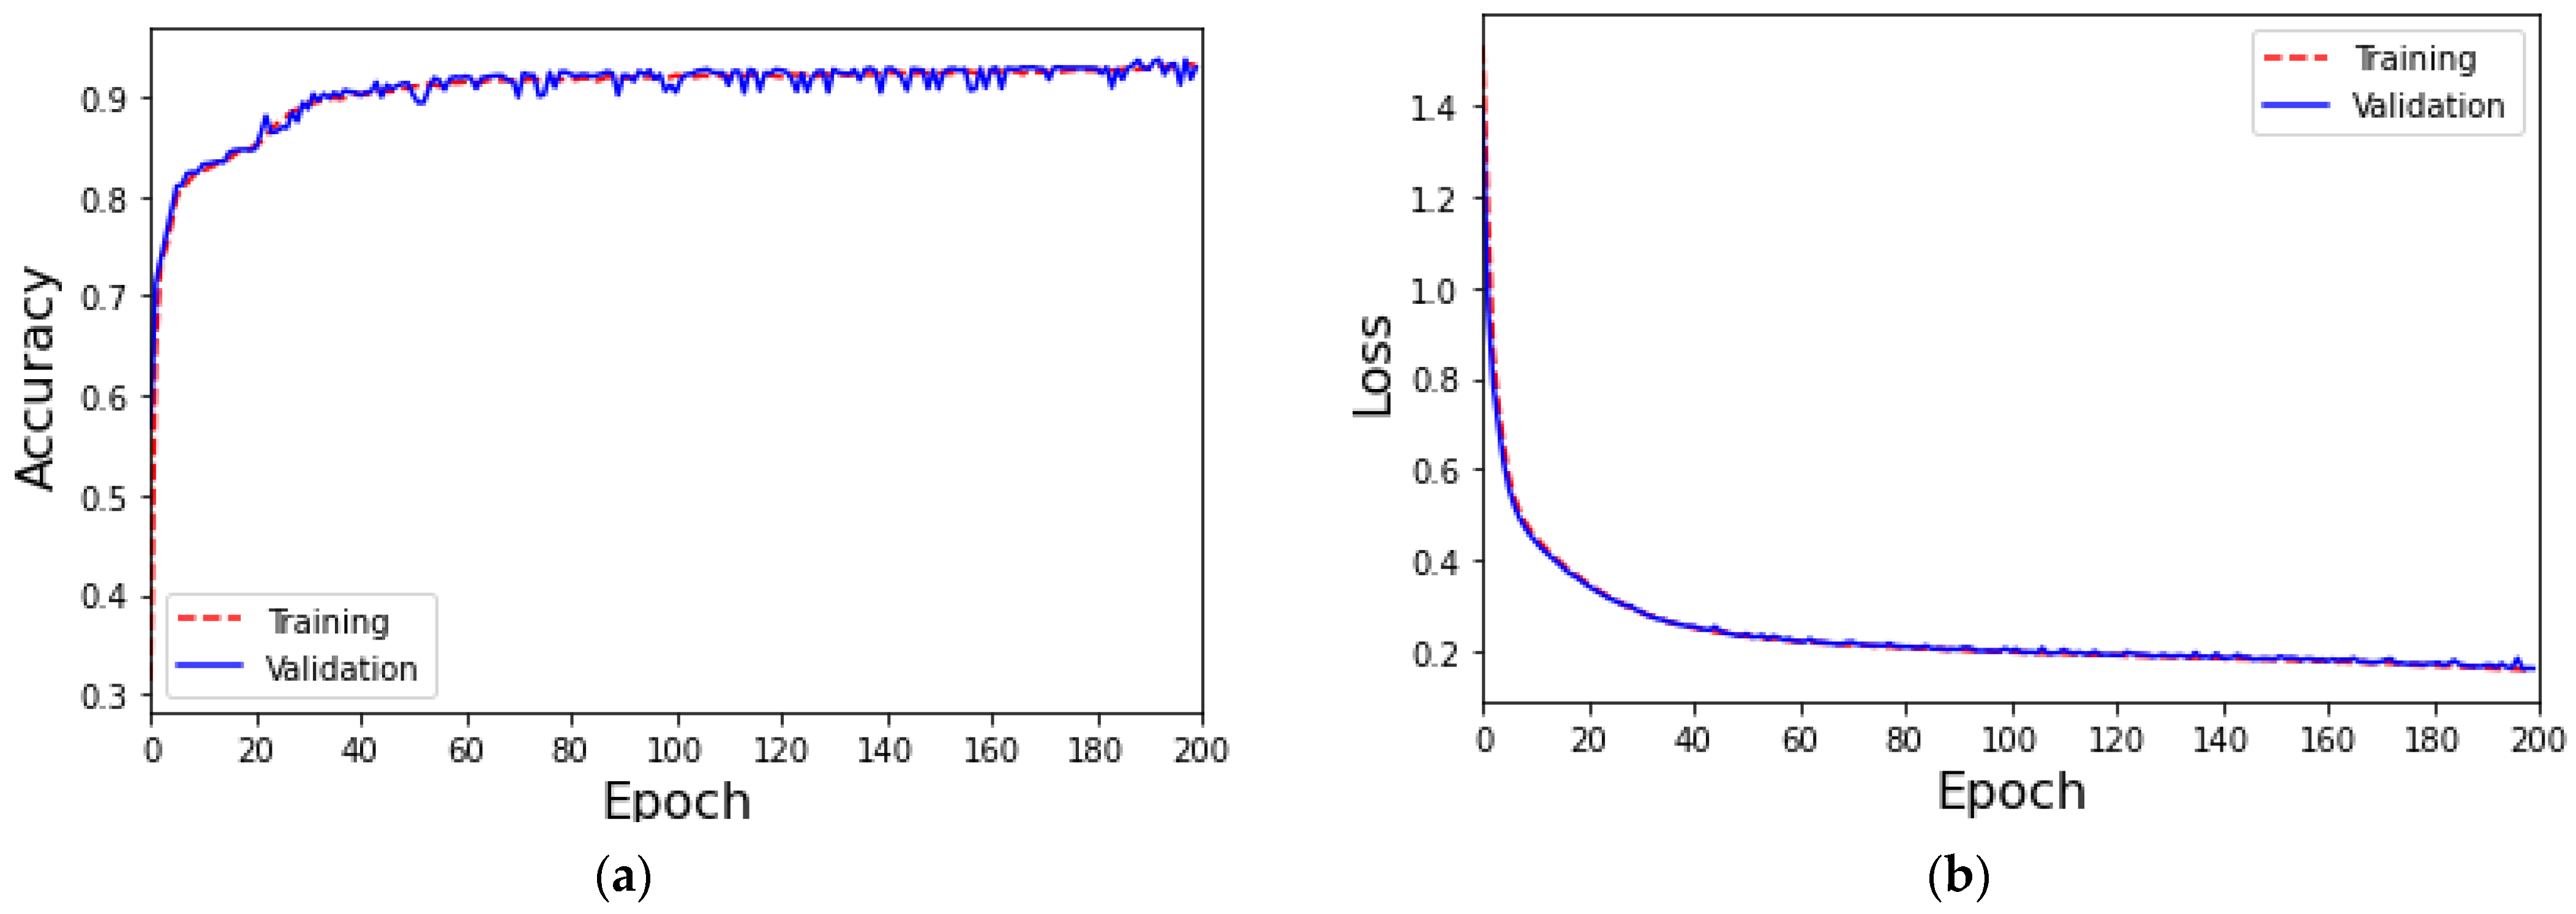
Figure 8.
(a) The accuracy of 10 classes in the ToN-IoT dataset based on the MLP classifier and (b) the loss of 10 classes in the ToN-IoT dataset based on the MLP classifier.
Figure 8.
(a) The accuracy of 10 classes in the ToN-IoT dataset based on the MLP classifier and (b) the loss of 10 classes in the ToN-IoT dataset based on the MLP classifier.
Figure 9.
The training loss of MLP-based IoT attack classification with data augmentation for GANs using the ToN-IoT dataset. (a) Class of “DoS”; (b) class of “DDoS”; (c) class of “Password”; and (d) class of “Mitm”.
Figure 9.
The training loss of MLP-based IoT attack classification with data augmentation for GANs using the ToN-IoT dataset. (a) Class of “DoS”; (b) class of “DDoS”; (c) class of “Password”; and (d) class of “Mitm”.
Figure 10.
(a) The accuracy of the proposed classification mechanism using the ToN-IoT dataset, and (b) the loss of the proposed classification mechanism using the ToN-IoT dataset.
Figure 10.
(a) The accuracy of the proposed classification mechanism using the ToN-IoT dataset, and (b) the loss of the proposed classification mechanism using the ToN-IoT dataset.

Table 1.
Summary of the attack classification method using the deep learning model.
| Reference | Dataset | Method | Accuracy * | Remark |
|---|---|---|---|---|
| [7] | CIC DDoS 2019 | DNN | 94.57% (M) | Analyze the statistical characteristics of packet traffic |
| [8] | UNSW-NB15 BoT-IoT ToN-IoT CSE-CIC-IDS2018 | DNN | UNSW-NB15: 97.48% (M) BoT-IoT: 83.82% (M) ToN-IoT: 69.53% (M) CSE-CIC-IDS2018: 97.21% (M) | Multivariate classification of four datasets based on the DNN model |
| [9] | NSL-KDD | CNN | KDD Test+: 81.33% (M) KDD Test-21: 64.81% (M) KDD Test+: 86.95.33% (B) KDD Test-21: 76.37% (B) | The analysis is mainly based on four parts: Basic packet information Packet connection information Time-based network traffic statistics Host-based network traffic statistics |
| [10] | CSE-CIC-IDS2018 | CNN + RNN | 97.75% (B) | Use CNN to capture local features and RNN to capture temporal features of packets. |
| [11] | BoT-IoT IOT Network Intrusion MQTT-IOT-IDS2020 IOT-23 | CNN | 1D CNN: 99.74% (M) 2D CNN: 99.42% (M) 3D CNN: 99.03% (M) | All datasets are integrated into two new datasets, transfer learning concepts are used to change the network architecture of different CNNs, and detailed category analysis is performed on each dataset. |
| [12] | ToN-IoT Edge-IIoT UNSW-NB15 | DenseNet | ToN-IoT: 99.65 (M) Edge-IIoT: 94.94% (M) UNSW-NB15: 98.4% (M) | Based on the one-dimensional 1-D CNN in the DenseNet architecture and setting different window sizes for multivariate classification. |
| [13] | NSL-KDD | RNN | 83.28% (B) 81.29% (M) | Set different layers based on the RNN model to evaluate the effectiveness of the model in classification. |
| [14] | UNSW-NB15 BoT-IoT | LSTM*2 | 96.3% (B) | Based on the two datasets, the DDoS and DoS attack categories of the TCP protocol are captured and merged into new data, and the output is alert, DDoS, and DoS. |
| [15] | CIC DDoS-2019 | LSTM LSTM*2 | LSTM: 99.46% (B) LSTM: 99.16% (M) | Based on different LSTM layers, the impact of binary classification and multivariate classification is analyzed. |
| [16] | CIC DDoS-2019 | GRU | 99.7% (M) | Analyze different DDoS attack categories based on GRU. |
| [17] | WSN-DS UNSW-NB15 KDD CUP99 | GRU | WSN-DS: 97.91% (B) UNSW-NB15: 98.92% (B) KDD CUP99: 98.23% (B) | Zero-day attack binary classification analysis based on bidirectional GRU analysis. |
| [18] | CSE-CIC-IDS2018 | LightGBM + CNN | 99.896% (M) | LightGBM: binary classification of categories. CNN: First perform IR-SMOTE on the data to balance the categories of the multivariate classification. |
| [20] | BoT-IoT | GANs + AE | AE: 92.97% (B) AE + GAN: 97.11% (B) | Anomaly detection is based on the merger of GANs and AE. |
| [21] | KDD99 NSL-KDD BoT-IoT IOT Network Intrusion MQTT-IOT-IDS2020 MQTT set IOT-23 | CGANs + FNN | KDD99: 95.90% (M) NSL-KDD: 95.46% (M) BoT-IoT: 77.01% (M) IOT Network Intrusion: 79.21% (M) MQTT-IOT-IDS2020: 93.40 (M) MQTT set: 97.30% (M) IOT-23: 64.17% (M) | Based on the CGAN architecture, data augmentation of imbalanced data is performed, and then FNN is used for multivariate classification. |
| [22] | USNW-NB15 NSL-KDD CTU-IoT Real-word data | WGAN + DNN WGAN + CNN WGAN + LSTM DNN + AE CNN + AE | USNW NB15: 87% (M) NSL-KDD: 93.2% (M) | GSNs based on Wasserstein distance are used to improve imbalanced data and are used together with AE to analyze and evaluate the performance of each model. |
| [23] | BoT-IoT | GAN + MLP | 82.25% (M) | GAN-based methods can generate features similar to real data and compare them with MLP models in deep learning, reducing the training time of large amounts of data in the past. |
* “(B)” is binary classification; “(M)” is multivariate classification.
Table 2.
The number of records in each class in the BoT-IoT dataset.
| Classes | Number of Records (Before) | Number of Records (After) |
|---|---|---|
| DoS | 1,320,148 | 1,320,098 |
| DDoS | 1,541,315 | 1,541,278 |
| Reconnaissance | 72,919 | 65,653 |
| Theft | 370 | 316 |
| Normal | 65 | 62 |
Table 3.
Feature descriptions for the BoT-IoT dataset.
| ID | Feature | Description | ID | Feature | Description |
|---|---|---|---|---|---|
| 1 | pkSeqID | Row Identifier | 11 | state_number | Numerical representation of feature state |
| 2 | Proto | Textual representation of transaction protocols present in network flow | 12 | Mean | Average duration of aggregated records |
| 3 | Saddr | Source IP address | 13 | N_IN_Conn_P_DstIP | Number of inbound connections per destination IP. |
| 4 | Sport | Source port number | 14 | Drate | Destination-to-source packets per second |
| 5 | Daddr | Destination IP address | 15 | Srate | Source-to-destination packets per second |
| 6 | Dport | Destination port number | 16 | Max | Maximum duration of aggregated records |
| 7 | Seq | Argus sequence number | 17 | Attack | Class label: 0 for Normal traffic, 1 for Attack Traffic |
| 8 | Stddev | Standard deviation of aggregated records | 18 | Category | Traffic category |
| 9 | N_IN_Conn_P_SrcIP | Number of inbound connections per source IP | 19 | Subcategory | Traffic subcategory |
| 10 | Min | Minimum duration of aggregated records |
Table 4.
The hyperparameters of the MLP model.
| Parameters | Value | Parameters | Value |
|---|---|---|---|
| Input (Features) | 74 | Dense | 64, 64, 64 |
| Batch Size | 1024 | Dense Activation | LeakReLU |
| Epochs | 200 | Activation Value | 0.2 |
| Optimizer | Adam | Output Activation | Softmax |
| Learning Rate | 0.001, 0.5 | Output Activation Value | 5 |
| Loss Function | Sparse categorical cross-entropy |
Table 5.
The hyperparameters of the GANs model.
| Parameters | Value | Parameters | Value |
|---|---|---|---|
| Z | 100 | Loss Function | Binary cross-entropy |
| Input (Features) | 74 | Generator Dense | 256, 128, 64 |
| Batch Size | 64 | Generator Activation | LeakReLU |
| Epochs | 10,000 | Generator Activation Value | 0.2 |
| Optimizer | Adam | Generator Batch Normalization | 0.8 |
| Learning Rate | 0.002, 0.5 | Discriminator Dense | 64, 128, 256 |
Table 6.
The performance of the MLP-based IoT attack classification.
| Classes | Precision | Recall | F1-Score |
|---|---|---|---|
| DoS | 100% | 100% | 100% |
| DDoS | 100% | 100% | 100% |
| Reconnaissance | 99.06% | 98.37% | 98.71% |
| Theft | 75.23% | 62.33% | 68.18% |
| Normal | 100% | 88.22% | 93.74% |
Table 7.
The performance of MLP-based IoT attack classification with data augmentation for GANs.
| Classes | Precision | Recall | F1-Score |
|---|---|---|---|
| DoS | 100% | 99% | 99.50% |
| DDoS | 100% | 100% | 100% |
| Reconnaissance | 96.06% | 94.73% | 95.39% |
| Theft | 92.22% | 90.69% | 91.45% |
| Normal | 99.81% | 92.07% | 95.78% |
Table 8.
The number of records in each class in the ToN-IoT dataset.
| Classes | Number of Records |
|---|---|
| DoS | 20,000 |
| DDoS | 20,000 |
| Backdoor | 20,000 |
| Password | 20,000 |
| Scanning | 20,000 |
| Injection | 20,000 |
| Mitm | 985 |
| Normal | 289,827 |
| Ransomware | 19,901 |
| Xss | 20,000 |
Table 9.
The performance of MLP classification using five classes in the ToN-IoT dataset.
| Classes | Precision | Recall | F1-Score |
|---|---|---|---|
| DoS | 94.28% | 93.23% | 93.75% |
| DDoS | 91.01% | 99% | 94.83% |
| Backdoor | 98.21% | 90.05% | 93.95% |
| Password | 100% | 100% | 100% |
| Scanning | 100% | 100% | 100% |
Table 10.
The performance of MLP classification using 10 classes in the ToN-IoT dataset.
| Classes | Precision | Recall | F1-Score |
|---|---|---|---|
| DoS | 84.19% | 78.21% | 81.09% |
| DDoS | 80.02% | 97.06% | 87.72% |
| Backdoor | 100% | 100% | 100% |
| Password | 98.22% | 88.26% | 92.97% |
| Scanning | 100% | 99.53% | 99.76% |
| Injection | 100% | 99.23% | 99.61% |
| Mitm | 96.31% | 67.23% | 79.18% |
| Normal | 100% | 100% | 100% |
| Ransomware | 100% | 100% | 100% |
| Xss | 100% | 100% | 100% |
Table 11.
The performance of MLP classification using 10 classes in the ToN-IoT dataset.
| Classes | Precision | Recall | F1-Score |
|---|---|---|---|
| DoS | 92.68% | 90.16% | 91.40% |
| DDoS | 93.27% | 96.26% | 94.74% |
| Backdoor | 100% | 100% | 100% |
| Password | 99.31% | 92.19% | 95.62% |
| Scanning | 98.12% | 97.26% | 97.69% |
| Injection | 100% | 99.23% | 99.61% |
| Mitm | 97.56% | 91.33% | 94.34% |
| Normal | 100% | 100% | 100% |
| Ransomware | 99.06% | 97.14% | 98.09% |
| Xss | 99.92% | 98.29% | 99.10% |
Table 12.
Comparison of the classification performance between the proposed method and other methods.
Table 12.
Comparison of the classification performance between the proposed method and other methods.
| Method | Dataset | Accuracy | Precision | Recall | F1-Score | Remark |
|---|---|---|---|---|---|---|
| GANs + AE [20] | BoT-IoT | 97.11% | 99.33% | 97.33% | 98.31% | Binary classification |
| CGANs + FNN [21] | BoT-IoT | 77.01% | 77.74% | 77.00% | 76.56% | Average of multivariate classification |
| Proposed | BoT-IoT | 98.83% | 97.62% | 95.30% | 96.42% | Average of multivariate classification |
| DNN [8] | ToN-IoT | 69.53% | 56.84% | 69.53% | 61.96% | Average of multivariate classification |
| Proposed | ToN-IoT | 98.53% | 97.99% | 97.99% | 97.36% | Average of multivariate classification |
Disclaimer/Publisher’s Note: The statements, opinions and data contained in all publications are solely those of the individual author(s) and contributor(s) and not of MDPI and/or the editor(s). MDPI and/or the editor(s) disclaim responsibility for any injury to people or property resulting from any ideas, methods, instructions or products referred to in the content. |
© 2023 by the authors. Licensee MDPI, Basel, Switzerland. This article is an open access article distributed under the terms and conditions of the Creative Commons Attribution (CC BY) license (https://creativecommons.org/licenses/by/4.0/).
Share and Cite
MDPI and ACS Style
Chu, H.-C.; Lin, Y.-J. Improving the IoT Attack Classification Mechanism with Data Augmentation for Generative Adversarial Networks. Appl. Sci. 2023, 13, 12592. https://doi.org/10.3390/app132312592
AMA Style
Chu H-C, Lin Y-J. Improving the IoT Attack Classification Mechanism with Data Augmentation for Generative Adversarial Networks. Applied Sciences. 2023; 13(23):12592. https://doi.org/10.3390/app132312592
Chicago/Turabian StyleChu, Hung-Chi, and Yu-Jhe Lin. 2023. "Improving the IoT Attack Classification Mechanism with Data Augmentation for Generative Adversarial Networks" Applied Sciences 13, no. 23: 12592. https://doi.org/10.3390/app132312592
Note that from the first issue of 2016, this journal uses article numbers instead of page numbers. See further details here.