
Absorption Variation with Particle Size of Recycled Fine Aggregates Determined by the Electrical Method

1
LEMac-CITEMA-CONICET, Faculty of La Plata, National University of Technology, La Plata 1900, Argentina
2
LEMIT, 52 e/121 y 122, La Plata 1900, Argentina
3
LEMIT, CONICET, 52 e/121 y 122, La Plata 1900, Argentina
4
Sustainable Materials, Flemish Institute for Technological Research (VITO), Boeretang 200, 2400 Mol, Belgium
*
Author to whom correspondence should be addressed.
Appl. Sci. 2023, 13(3), 1578; https://doi.org/10.3390/app13031578
Submission received: 20 December 2022
/
Revised: 22 January 2023
/
Accepted: 23 January 2023
/
Published: 26 January 2023
(This article belongs to the Special Issue Eco-Efficient Construction and Building Materials)
Abstract
:The scarcity of fine natural aggregates and the negative environmental impact of their extraction make it necessary to find new sources of aggregates for the construction industry. The use of recycled aggregates (RA) derived from waste concrete crushing is a viable option for reducing non-renewable raw material consumption. The quality of these aggregates is lower than that of natural aggregates. In particular, the water absorption (WA) of the fine fraction of RA is a topic of constant debate due to the limitations of the standardized practices for determining it. Several methods have previously been proposed concerning this. Among these, the electrical conductivity method has the highest potential for effective WA determination. However, the influence of particle size and shape on the measurement remains unknown. In this study, the electrical conductivity method is applied to determine the WA of different particle size ranges in both natural and recycled aggregates. The results show that the paste content is the main variable that influences the WA of RA, whereas the size and shape of particles have no discernible influence on the measurements made using the electrical conductivity method. The present work expands upon previous studies by demonstrating the universality of the method irrespective of the particle size.
1. Introduction
The construction industry has been identified as one of the most significant worldwide polluters [1]. To lessen its environmental impact, different strategies have been proposed and used in various countries. Waste minimization and recovery are unavoidable practices in the pursuit of sustainability. Every year, 41 billion tons of aggregates are consumed by the construction industry [2]. To reduce the environmental impact of concrete, several waste materials have been studied for raw material replacement in concrete production [3,4,5]. In this regard, the extraction of natural aggregates far exceeds sustainable levels [3,6,7]. The indiscriminate extraction of river sand causes a chain reaction that exacerbates the effects of tsunamis, interferes with fishing and crops, and increases the levels of salinization in the water [3,8]. Furthermore, numerous studies show that an increase in sand consumption implies illegal trade, which leads to violence, social conflict, and the deterioration of habitats [7,9]. The use of FRA may contribute to changing this reality.
In formal markets, because of the need to limit the exploitation of non-renewable natural resources, the use of recycled aggregates (RA) obtained from crushing waste concrete as an aggregate to manufacture new concrete is becoming more common in the ready-mixed concrete industry. This practice has the potential to reduce the industry’s carbon footprint by up to 23% [10], as well as reduce the volume of waste in landfills.
Different countries’ regulations allow for different percentages of RA to be used in structural and non-structural concrete [11,12,13,14]. The use of the coarse fraction is permitted by most of them, but not the use of the fine fraction. This distinction between the two fractions of RA is most likely due to a lack of agreement on the effects of fine recycled aggregate (FRA), as opposed to the consensus on the technical feasibility of using coarse recycled aggregate (CRA) without affecting concrete performance significantly [15,16,17,18]. Conflicting presumptions remain regarding the viability of FRA as an aggregate for concrete production. Some authors report that concretes containing FRA achieve strength levels comparable to or even higher than those of the reference concrete [19,20], whereas other researchers report strength decreases of more than 30% when FRA is used as a partial replacement for natural fine aggregate (FNA) [21,22,23,24]. Similarly, there are significant discrepancies regarding the influence of FRAs on concrete consistency. While some works report similar consistency values between reference mixes and those made with FRA [25,26], other studies report up to a 60% reduction in slump even when the FRA is brought to its saturated surface dry state (SSD) before use [26,27].
The main properties of recycled aggregates (density, porosity, and strength) differ from those of natural aggregates due to the presence of hardened cement paste [26,27,28,29,30]. Compared to natural aggregates, this paste reduces density and resistance and increases the absorption of FRA.
According to recent studies [31,32], the effective w/c ratio of recycled concrete is not an efficient parameter to correlate with the compressive strength of the concrete in which the RA is used. Sosa et al. [32] conclude that the total w/c ratio (which includes the water used to compensate for the greater absorption of the aggregate) has a very good correlation with compressive strength. These findings could explain the contradictory results regarding the influence of FRAs on concrete performance. A reliable determination of the absorption of the aggregates, as well as its water uptake within fresh concrete, is a critical step to avoid changes in the w/c and, consequently, in concrete performance.
At least eight methods are available in the literature to determine aggregate absorption capacities [33,34,35,36,37,38,39,40,41]. Three of these methods were previously compared [42] when determining the absorption capacity of various FRAs and natural aggregates. Such results showed that the electrical conductivity method had less dispersion and greater repeatability than the other alternatives. On this basis, the electrical conductivity method was chosen in the present work for further analysis. This method was also used by Kim et al. [38], who reached similar conclusions about its viability.
The electrical conductivity method determines the saturated surface dry (SSD) state by examining the relationship between electrical conductivity and surface moisture on fine aggregate particles. When aggregate particles have water on their surfaces, liquid bridges form and carry electricity. When water is lost, these bridges disappear, and contact is only possible through solid–solid contact points [43]. Because the current is not well transported through the solid contact between the particles, as the surface water evaporates, conductivity decreases up to a threshold point wherein liquid bridges are no longer present.
The conductivity measurement methodology uses a four-point configuration. This method of measuring electrical conductivity is standardized for soil moisture [44], and it has been used in several studies to evaluate concrete saturation levels and their relationships with reinforcement corrosion [45,46]. The electrical conductivity method has proven effective in determining the SSD state of natural sand and the FRA derived from concrete crushing. However, the potential effect of the particle size range of the material on the test result remains unknown [47]. In this regard, Zhao et al. [48] measured the water absorption (WA) of differently sized fractions of several FRAs (Figure 1). They concluded that when the paper sheet method is compared to the cone method the finest fraction demonstrates a greater difference than the coarser fraction. Moreover, the authors concluded that the cone method underestimates the WA of the finest fractions, whereas the paper sheet method [37] overestimates it. The case for the electrical conductivity method may be similar to the paper method. Both depend on contact points per mass unit (paper–particle or particle–particle depending on the case). The potential effects of the particle size must be addressed to define the reliability of these methods.
In order to eliminate the impact of incorrect WA determination on the effective w/c ratio in concretes in which FRAs are used, this study expands upon previous studies on the electrical conductivity method by investigating the potential influence of particle size. Only through an efficient determination of the WA of FRCA can the actual influence of FRA on concrete performance be determined. Previous studies [42] validated the method based on its reproducibility and repeatability. However, the present additional studies on the potential influence of particle size and composition further supports the universal applicability of the method to manufacture FRAs of different sizes. To that end, two types of FRA and one manufactured FNA with a homogeneous composition were tested, both of which was sieved into differently sized fractions to determine the absorption capacity of each fraction separately and compare these to that of the aggregate as a whole. The relationship between aggregate features and WA was also studied.
2. Materials and Methods
Two concretes were considered, one with a granite aggregate (G) and one with a quartzite aggregate (Q), both of which were crushed with a jaw crusher and sieved through a 4.75 mm mesh to obtain the fine fraction of the recycled aggregates (RG and RQ). Quartzite concrete was produced in the laboratory, with a compressive strength of 26 MPa, an elasticity modulus of 20 GPa, and a sorptivity of 11.89 g·m−2·s−1/2 at 28 days, while the granite concrete was from an unknown source and only its compressive strength was determined (35 MPa).
In addition, a manufactured fine aggregate from the crushing of natural quartzite rock (NQ) was used. Table 1 presents the properties of the studied aggregates. RQ presented a lower density and a higher content of material finer than 75 µm compared to NQ. The lower density of the FRAs was linked to the presence of cement paste in their particles. The difference in fines content was linked with the production process. Recycled aggregates RQ and RG were produced in the laboratory by jaw crushing, and NQ was produced industrially. Whereas RQ was used in its entirety, NQ and RG were subjected to additional washing to remove fines. This is the main reason for the different contents of fines in Table 1. Paste content was determined by selective dissolution of the paste phase with hydrochloric acid, according to the procedure indicated in ASTM [49]. The fineness modulus was computed as indicated in ASTM C 136.
For the electric method measurement, a “u” shaped device made of PVC was used. As electrodes, stainless steel plates were placed at each end of the device with two stainless steel rods in between. The distance between the electrodes was 40 mm. The dimensions of the device are shown schematically in Figure 2.
For the calibration of the device, a solution of a known conductivity (0.01M KCl) was used to determine the cell geometrical constant. Voltage and current were measured with multimeters, while an electrical potential was applied using a (12 ± 1) V AC power source connected to external electrodes on the sides of the device.
Each aggregate was divided into two subsamples; one was evaluated as a whole, whereas the other was divided into five differently sized fractions to evaluate each particle size range separately, as follows: 4.75–2.36 mm, 2.36–1.18 mm, 1.18–0.6 mm, 0.6–0.3 mm, and 0.3–0.15 mm. Each fraction was labeled with letters that indicated the type of aggregate (N: natural; R: recycled; Q: quarzitic; G: granite) and numbers that indicated the evaluated fraction (4.75–2.36, 2.36–1.18, 1.18–0.6, 0.6–0.3, and 0.3–0.15). The whole sample of each aggregate was identified only with letters (no numbers).
Prior to the test, the samples were immersed in water for 24 hours, as required by most standard procedures (ASTM C 128, UNE 1097, and IFSTTAR N°78 [37]) and recommended procedures [35,36,39,40,41]. After immersion, the samples were placed inside the device in two layers; the first layer was tampered 10 times and the second one 15 times using the same tamper as indicated for the cone method (as described in ASTM C 127, UNE 1097, and IRAM 1520). The conductivity of the mass of aggregate was determined from the potential and corresponding current measurements using Equation (1), starting from a certain surface wet state and repeated for increasingly dry states. Each time, approximately 200 g of sample was collected afterwards from the center of the device and weighted before and after drying it out in an oven at (105 ± 5) °C to compute the moisture content of the sample. The procedure was repeated until the sample was too dry to detect currents above the sensitivity of the multimeter (1 µA).
With:
- C = conductivity
- I = current
- V = potential difference
- Cc = cell constant
Then, the relationship between moisture content and corresponding conductivity values was plotted in a semi-logarithmic graph. Two branches (wet on the right and dry on the left) were identified for each aggregate, each one represented by a separate straight line. To achieve enough points to define each of the straight lines, at least three measurement sequences were used for each type of sample. The sorting of data points between one or the other branch was decided in order to assure the maximum value of R2 for both of the straight lines. The intersection of both lines corresponds to the SSD state of the aggregate, and the corresponding moisture value is, therefore, the WA of the sample [44].
3. Results
Figure 3, Figure 4 and Figure 5 show the moisture–conductivity relationship for each of the five sized fractions as well as whole samples for NQ, RQ, and RG. The plots are presented with a logarithmic scale in the vertical axis for better appreciation. The volume of data secured that all of the branches were determined by the linear regression of more than six data pairs. The two branches are easily distinguished for each sample. A good correlation between conductivity and moisture was obtained for both the dry and wet branches of all of the samples. The frequency histograms for the R2 values of each branch and cumulative values are shown in Figure 6. A very good correlation was obtained in almost all branches. This reflects a significant description of the variation in the condition of free water in the sample, depending on the moisture content in relation with the internal porosity of the particles. The intersection of both branches defines the moisture content corresponding to the saturated-surface dry condition, i.e., the water absorption capacity of the granular skeleton. When the moisture content is lower than this intersection value, an insufficient volume of water remains on the surface of the particles to build up the menisci that favor electrical conductivity. However, as moisture content increases, the increase in conductivity is very fast. With moisture contents above the intersection value, larger bridges of water are available to conduct electrical current. As the volume increases proportionally to the increase in the volume of free water, the evolution of conductivity is not as fast as for the other branch.
Table 2 presents a summary of the obtained results. The range of variation in the absorption values of the differently sized fractions, and in the whole-size range of NQ, was (3.2–3.8)%, while the standard deviation was 0.30. The corresponding range of values for RQ was (6.2–6.4)% if the value for the size range 0.3–0.15 of 9.2% was excluded, which is around 3 percentage points higher than the rest of the fractions. A similar situation can be described for RG with the range of values (7.7–8.6)%, and an exceptionally high value of 10.8% for the size range 0.3–0.15. The increase in the WA value for the finest sized fraction of RA was also reported by [28] and associated with its high paste content. The increase in paste content with fineness can be explained by the difference in hardness between natural aggregates and cement paste. When concrete is crushed, the cement paste is released in finer particles more easily than natural aggregate [50]. Thus, the concentration of cement paste in the finest fraction is natural. The lack of significant variation in the other sized fractions of the recycled aggregates, and the homogeneous values for all size ranges of NQ, indicate that the WA results mostly reflect the proportion of cement paste present in each sized fraction rather than an effect of the particle size range.
The weighted averages of WA values (considering the proportion of each sized fraction in the whole sample) correlate well with the experimental measurements of the whole sample. This confirms the consistency of the results. For the weighted average computations, the WA of the fraction under 0.15 mm was considered equal to that of the 0.3–0.15 fraction, but, given its small proportion, any effect of this assumption on the weighted average value would be very small.
Table 3 displays the slope between the branches of the variously sized fractions of all aggregates, along with the standard deviations. Because many more menisci should form in wet samples with finer particle sizes, more significant changes in the finest fractions’ slope may be expected [47]. However, from the slope, no clear trend in the slope shift was observed. While for RA the slope reduced for the finest fraction in comparison with the larger fractions, for NQ the fractions 0.6–0.3 and 0.3–0.15 showed the same slope as those in the larger fraction. These results showed no clear influence of the particle size on the change in slope, but more research is needed in this regard for a conclusive outcome.
4. Discussion
There are many different factors that contribute to the challenge of estimating the amount of water that can be absorbed by FRAs. Particles with sizes ranging from 50 to 4000 μm can have extremely varied characteristics in terms of their composition and shape. Both of these aspects can vary very significantly in such a wide range of sizes. The recycled aggregates that come from the waste concrete are materials that have more than one phase. Even if these materials could be processed and released of any impurities that may have been introduced during the process of recycling (e.g., soil, gypsum, wood, bricks, and asphalt), they would still be a combination of hydrated cement paste and natural rocks. Because the hydrated cement paste phase is the phase that causes an increase in the material’s porosity and absorption capacity, we need to concentrate on that phase whenever we are conducting any kind of analysis regarding the representativeness of an experimental method for determining the water absorption capacity.
The cement paste and the natural rocks do not differ only in porosity but also in strength. This is important to consider as the recycling process involves the crushing of the waste concrete and the division of the material into smaller particles by splitting it through the weakest planes. The mechanical effort of crushing is also combined with the self-abrasion between particles that clash with each other during rotatory processing.
The soft cement paste particles would be more easily crushed, abrased, and concentrated in finer fractions. Such a difference in composition requires an account of the sensitivity of the conductivity method to the increase in paste content. To link both parameters, for the case of RG, the paste content according to ASTM C 1084 was determined for each sized fraction. The results are shown in Figure 7. Although the R2 value is not excellent, a trend to increase the WA with the increase in paste content is suggested. The lack of adjustment is likely a consequence of other variables also affecting the WA value measured.
For the same volume of solids, more angular shapes, more surface roughness, and a higher content of fines would allow for more solid–solid contact points. This would increase the number of menisci formed by surface water, and would potentially affect the conductivity of the granular skeleton [45].
No difference due to composition or particle size was observed among all the tested samples and sub-samples in terms of the linearity of wet and dry branches. This can be interpreted as the fact that the same phenomena are governing the correlation between electrical conductivity and moisture content in the granular skeletons. In other words, any change in particle shape, particle size, or composition does not translate into changes in the building up of conductive bridges as the moisture content increases. The main difference among the samples was in the slope values of the branches, which define the intersection point corresponding to the shift in the driving phenomenon to increase conductivity. However, no consistent effects of the particle size and the type of sample were observed, and additional research is necessary to determine the main aspects governing the slope values of the branches. Therefore, the method seems very suitable for the entire range of particle sizes analyzed in the present study. No fraction was misrepresented in the absorption values obtained for the entire sample, but it contributes to the general value as a function of its internal porosity and proportion present in the whole sample.
Although there was no explicit result confirming that the electrical conductivity method is independent from the particle size range, there are many strong indications in that direction. We can use the example of NQ, for which we cannot expect differences in composition due to the particle size. As the electrical conductivity of the skeleton was dominated by the presence of liquid bridges between particles, the limited variations in the WA for different particle size ranges of NQ suggest that contact points do not have significant relevance on the outcome of the experiment. In FRA samples, higher WA values were obtained for the finest fractions, but, as this cannot be explained by the particle size, it seems more logical to associate it with a higher paste content in these fractions [29], as shown in Figure 7. Finally, the lack of particle geometry influence on the WA value determined by the electrical method is also suggested by the similar slope obtained for dry and wet branches for the various particle size ranges.
More research is still needed to describe the phenomenological connection between the moisture content and the electrical conductivity of the granular skeleton. From a qualitative point of view, the method is well supported and allows us to apply it for practical purposes. However, a quantitative description would bring additional light on aspects related to transition across different saturation states.
5. Conclusions
From the measurement of water absorption by the electrical conductivity method on three different fine aggregates (two recycled and one manufactured), measured on sieved fractions with both different particle size ranges and as a whole, the following conclusions are drawn.
The water absorption measured in the aggregate as a whole and the weighted average WA value, considering the combination of variously sized fractions, are similar, which demonstrates the consistency of values to assess the variable particle size ranges.
A good correlation between conductivity and moisture content was obtained for each sized sample analyzed. A sudden change occurs in accordance with the expected transition from the dominant internal moisture to the dominant external moisture. We can confirm that the method shows good potential to measure the WA of fine aggregates, irrespective of the particle size range within the studied size range of 4.75 mm–0.15 mm, and it is a more advantageous approach than the traditional cone method that earlier proved unsuitable for manufactured sands.
The WA of NQ did not show significant variations in WA with the particle size, which connects with the homogeneous composition of the sand because of its natural origin. In contrast, the WA of RG and RQ showed significant increases in the fractions 0.30–0.15 mm as a result of their higher paste content (i.e., higher porosity).
The lack of a clear trend regarding the slopes of dry and wet branches also indicates that geometry and particle size have no significant influence on the outcome of the electrical conductivity method.
Different studies have concluded the potential of the electrical conductivity method to achieve an effective determination of WA, but uncertainties about the influence of different variables such as the shape and size of the particles on the measured WA remained. When applying other methods, these variables cause inaccurate values of WA, and, thus, the effectiveness of these methods has been widely questioned. In this research, the lack of a clear influence of the particle size and shape on the WA measured by the electrical conductivity method has been proven, with the paste content being the main variable that influenced the WA value. The method consistently showed good performance to achieve WA not only for RA but also for other manufactured sands.
Further research is still needed to support the results of this study; for example, an interlaboratory test among several laboratories can establish accurate levels of the reproducibility of the electrical conductivity method as an intermediate step for standardizing the procedure. A reliable WA determination method is imperative to allow a sound assessment of the actual impact of fine recycled aggregates on concrete performance.
Author Contributions
Conceptualization, E.S. and Y.V.Z.; methodology, E.S. and L.C.; formal analysis, E.S.; investigation, E.S. and Y.V.Z.; resources, L.C. and C.Z.; data curation, Y.V.Z.; writing—original draft preparation, E.S. and L.C.; writing—review and editing, Y.V.Z. and C.Z.; supervision, C.Z. and Y.V.Z.; project administration, C.Z. and Y.V.Z. All authors have read and agreed to the published version of the manuscript.
Funding
The authors express their gratitude for the financial support of FONCyT (PICT 2015-3339 and PICT 2017-0091).
Data Availability Statement
Not applicable.
Conflicts of Interest
The authors declare no conflict of interest.
References
- IPCC. Summary for Policymakers. In Global Warming of 1.5 °C; World Meteorological Organization: Geneva, Switzerland, 2018; 32p. [Google Scholar]
- UNE. Sand and Sustainability: Finding New Solutions for Environmental Governance of Global Sand Resources; UN Environment report; UNE: Gigiri Nairobi, Kenya, 2019; ISBN 978-92-807-3751-6. [Google Scholar]
- Torres, A.; Brandt, J.; Lear, K.; Liu, J. A looming tragedy of the sand commons. Science 2017, 357, 970–971. [Google Scholar] [CrossRef] [PubMed]
- Çelik, A.I.; Özkılıç, Y.O.; Zeybek, Ö.; Karalar, M.; Qaidi, S.; Ahmad, J.; Burduhos-Nergis, D.D.; Bejinariu, C. Mechanical behaviour of crushed waste glass as replacement of aggregates. Materials 2022, 15, 8093. [Google Scholar] [CrossRef] [PubMed]
- Qaidi, S.; Najm, H.M.; Abed, S.M.; Özkılıç, Y.O.; Al Dughaishi, H.; Alosta, M.; Sabri, M.M.S.; Alkhatib, F.; Milad, A. Concrete containing waste glass as an environmentally friendly aggregate: A review on fresh and mechanical characteristics. Materials 2022, 15, 6222. [Google Scholar] [CrossRef] [PubMed]
- Best, J. Anthropogenic stresses on the world’s big rivers. Nat. Geosci. 2018, 12, 7–21. [Google Scholar] [CrossRef]
- Sharma, R.; Khan, R.A. Influence of copper slag and metakaolin on the durability of self-compacting concrete. J. Clean. Prod. 2018, 171, 1171–1186. [Google Scholar] [CrossRef]
- Bendixen, M.; Hackney, C.; Iversen, L.L. Time is running out for sand. Nature 2019, 29–31. [Google Scholar] [CrossRef] [Green Version]
- Bisht, A. Conceptualizing sand extractivism: Deconstructing an emerging resource frontier. Extr. Ind. Soc. 2021, 8, 100904. [Google Scholar] [CrossRef]
- Estanqueiro, B.; Silvestre, J.D.; de Brito, J.D.; Pinheiro, M.D. Environmental life cycle assessment of coarse natural and recycled aggregates for concrete. Eur. J. Environ. Civ. Eng. 2016, 22, 429–449. [Google Scholar] [CrossRef]
- IRAM 1531-2022; Coarse Aggregate for Concrete. Requeriment and Test Method. Instituto Argentino de Normalización y Certificación: Buenos Aires, Argentina, 2022.
- AASHTO MP 16-2013; Standard Specification for Reclaimed Concrete Aggregate (RCA) for Use as Coarse Aggregate in Hydraulic Cement Concrete. American Association of State Highway and Transportation Officials: Washington, DC, USA, 2013.
- ACI 318-2019; Building Code Requirements for Structural Concrete and Commentary. American Concrete Institute: Farmington Hills, MI, USA, 2019.
- ASTM C 33:2018; Standard Specification for Concrete Aggregates. ASTM international: West Conshohocken, PA, USA, 2018.
- Pacheco, J.; de Brito, J.; Chastre, C.; Evangelista, L. Eurocode Shear Design of Coarse Recycled Aggregate Concrete: Reliability Analysis and Partial Factor Calibration. Materials 2021, 14, 4081. [Google Scholar] [CrossRef]
- Zhang, B.; Ahmad, W.; Ahmad, A.; Aslam, F.; Joyklad, P. A scientometric analysis approach to analyze the present research on recycled aggregate concrete. J. Build. Eng. 2022, 46, 103639. [Google Scholar] [CrossRef]
- dos Reis, G.S.; Quattrone, M.; Ambrós, W.M.; Grigore Cazacliu, B.; Hoffmann Sampaio, C. Current Applications of Recycled Aggregates from Construction and Demolition: A Review. Materials 2021, 14, 1700. [Google Scholar] [CrossRef] [PubMed]
- Marvila, M.; de Matos, P.; Rodríguez, E.; Monteiro, S.N.; de Azevedo, A.R.G. Recycled Aggregate: A viable solution for sustainable Concrete Production. Materials 2022, 15, 5276. [Google Scholar] [CrossRef] [PubMed]
- Evangelista, L.; de Brito, J. Criteria for the use of fine recycled concrete aggregate in concrete production. In Proceedings of the International RILEM Conference: The Use of Recycled Materials in Building and Structures, RILEM, Barcelona, Spain, 8–11 November 2004. [Google Scholar]
- Sosa, M.E.; Zega, C.J.; Di Maio, A.A. Influence of fine recycled aggregates on compressive strength, static modulus of elasticity and drying shrinkage of concrete. In Proceedings of the International Conference on Sustainable Structural Concrete, RILEM, La Plata, Argentina, 15–18 September 2015. [Google Scholar]
- Evangelista, L.; de Brito, J. Durability performance of concrete made with fine recycled concrete aggregates. Cem. Concr. Compos. 2010, 32, 9–14. [Google Scholar] [CrossRef]
- Zega, C.J.; Di Maio, A.A. Use of recycled fine aggregate in concretes with durable requirements. Waste Manag. 2011, 31, 2336–2340. [Google Scholar] [CrossRef] [PubMed] [Green Version]
- Pereira, P.; Evangelista, L.; de Brito, J. The effect of superplasticizers on the workability and compressive strength of concrete with fine recycled concrete aggregates. Constr. Build. Mater. 2012, 28, 722–729. [Google Scholar] [CrossRef] [Green Version]
- Khoshkenari, A.G.; Shafigh, P.; Moghimi, M.; Mahmud, H.B. The role of 0-2 mm fine recycled concrete aggregate on the compressive and splitting tensile strengths of recycled concrete aggregate concrete. Mater. Des. 2014, 64, 345–354. [Google Scholar] [CrossRef]
- Khatib, J.M. Properties of concrete incorporating fine recycled aggregates. Cem. Concr. Res. 2005, 35, 763–769. [Google Scholar] [CrossRef]
- Kim, S.W.; Yun, H.D. Evaluation of the bond behavior of steel bars in recycled fine aggregate concrete. Cem. Concr. Compos. 2014, 46, 8–18. [Google Scholar] [CrossRef]
- Cartuxo, F.; de Brito, J.; Evangelista, L.; Jimenez, J.R.; Ledesma, E.F. Rheological behaviour of concrete made with fine recycled concrete aggregates—influence of the super- plasticizers. Constr. Build. Mater. 2015, 89, 26–47. [Google Scholar] [CrossRef]
- Zhao, Z.; Remond, R.; Daminot, D.; Xu, W. Influence of hardened cement paste content on the water absorption of fine recycled concrete aggregates. J. Sustain. Cem. -Based Mater. 2013, 2, 186–203. [Google Scholar] [CrossRef]
- Fan, C.C.; Huang, R.; Hwang, H.; Chao, S.J. Properties of concrete incorporating fine recycled aggregates from crushed concrete wastes. Constr. Build. Mater. 2016, 112, 708–715. [Google Scholar] [CrossRef]
- Sanchez De Juan, M.; Alaejos Gutiérrez, P. Study on the influence of attached mortar content on the properties of recycled concrete aggregate. Constr. Build. Mater. 2009, 23, 872–877. [Google Scholar] [CrossRef]
- Théréné, F.; Keita, E.; Naël-Redolfi, J.; Boustingorry, P.; Bonafous, L.; Roussel, N. Water absorption of recycled aggregates: Measurements, influence of temperature and practical consequences. Cem. Concr. Res. 2020, 137, 106196. [Google Scholar] [CrossRef]
- Sosa, M.E.; Villagrán Zaccardi, Y.A.; Zega, C.J. A critical review of the resulting effective water-to-cement ratio of fine recycled aggregate concrete. Constr. Build. Mater. 2021, 313, 125536. [Google Scholar] [CrossRef]
- Leite, M.B. Avaliaçao de propriedades mecanicas de concretos produzidoscom agregados reciclados de resıduos de construçao e demoliçao. Ph.D. Thesis, Escola de Engenharia, Universidade Federal Rio Grande Do Sul, Porto Alegre, Brazil, 2001. [Google Scholar]
- Tam, V.W.Y.; Gao, X.F.; Tam, C.M.; Chan, C.H. New approach in measuring water absorption of recycled aggregates. Constr. Build. Mater. 2008, 22, 364–369. [Google Scholar] [CrossRef] [Green Version]
- Damineli, B.L.; Quattrone, M.; Angulo, S.C.; Taqueda, M.E.S.; John, V.M. Rapid method for measuring the water absorption of recycled aggregates. Mater. Struct. 2016, 49, 4069–4084. [Google Scholar] [CrossRef]
- Rodriguez, F.; Evangelista, L.; de Brito, J. A New Method to Determine the Density and Water Absorption of Fine Recycled Aggregates. Mater. Res. 2013, 16, 1045–1051. [Google Scholar] [CrossRef] [Green Version]
- IFSTTAR Test Method No. 78:2011. Test on Aggregate for Concrete: Measurement of Total Water Absorption by a Crushed Sand; IFSTTAR: Paris, France, 2011.
- Kim, J.; Zi, G.; Lange, D.A. Measurement of water absorption in very fine particles using electrical resistivity. Mater. J. 2017, 6, 957–965. [Google Scholar] [CrossRef]
- Li, Z.; Liu, J.; Tian, Q. Method for controlling the absorbed water content of recycled fine aggregate by centrifugation. Constr. Build. Mater. 2018, 160, 316–325. [Google Scholar] [CrossRef]
- Hlawatsch, F.; Aycil, H.; Kropp, J. An automated test method for density in the saturated surface dry state (SSD) of porous granular materials. In Proceedings of the 2nd International RILEM Conference in the Building Environment, Sao Paulo, Brazil, 2–4 December 2009. [Google Scholar]
- Gentilini, P.; Yazoghli-Marzouk, O.; Delmotte, V.; Descantes, Y. Determination of the water content of fillerised fine aggregates in the saturated surface dry state. Constr. Build. Mater. 2017, 98, 662–670. [Google Scholar] [CrossRef]
- Sosa, M.E.; Carrizo, L.; Zega, C.J.; Villagrán-Zaccardi, Y.A. Water absorption of fine recycled aggregates: Effective determination by a method based on electrical conductivity. Mater. Struct. 2018, 51, 127. [Google Scholar] [CrossRef]
- Hoornahad, H.; Koenders, E.A.B.; Breguel, K.V. Wettability of particles and its effect on liquid bridges in wet granular materials. J. Silic. Based Compos. Mater. 2015, 67, 142–169. [Google Scholar] [CrossRef]
- JSCE-C506-2003; Test Method for Density and Water Absorption of Slag Fine Aggregate for Concrete by Measurement of Electric Resistance. Japanese Society of Civil Engineers: Tokio, Japan.
- Andrade, C.; D’Andrea, R. La resistividad eléctrica como parámetro de control del hormigón y de su durabilidad. ALCONPAT 2011, 1, 90–98. [Google Scholar] [CrossRef] [Green Version]
- González, J.A.; Andrade, C.; Alonso, C. Aproximación al efecto de la resistividad del hormigón en la corrosión de armaduras embebidas en el hormigón. Mater. De Construcción 1987, 37, 5–12. [Google Scholar]
- Duan, Z.; Zhao, W.; Ye, T.; Zhang, Y.; Zhang, C. Measurement of water absorption of Recycled Aggregates. Materials 2022, 15, 5141. [Google Scholar] [CrossRef] [PubMed]
- Zhao, Z.; Xiao, J.; Damidot, D.; Rémond, S.; Bulteel, D.; Courard, L. Quantification of the Hardened Cement Paste Content in Fine Recycled Concrete Aggregates by Means of Salicylic Acid Dissolution. Materials 2022, 15, 3384. [Google Scholar] [CrossRef]
- ASTM C 1084 - 2010; Standard Test Method for Portland-Cement Content of Hardened Hydraulic-Cement Concrete. ASTM international: West Conshohocken, PA, USA, 2010.
- Figuereido, P.; Ulsen, C.; Bergerman, M.; Nery, G. Liberation of cement paste in recycled aggregates by different comminution methods. In Proceedings of the Fourth International Conference Progress of Recycling in the Built Environment, RILEM, Lisbon, Portugal, 11–12 October 2018. [Google Scholar]
Figure 1.
Water absorption capacities of differently sized fracstions of several FRAs [46].
Figure 1.
Water absorption capacities of differently sized fracstions of several FRAs [46].
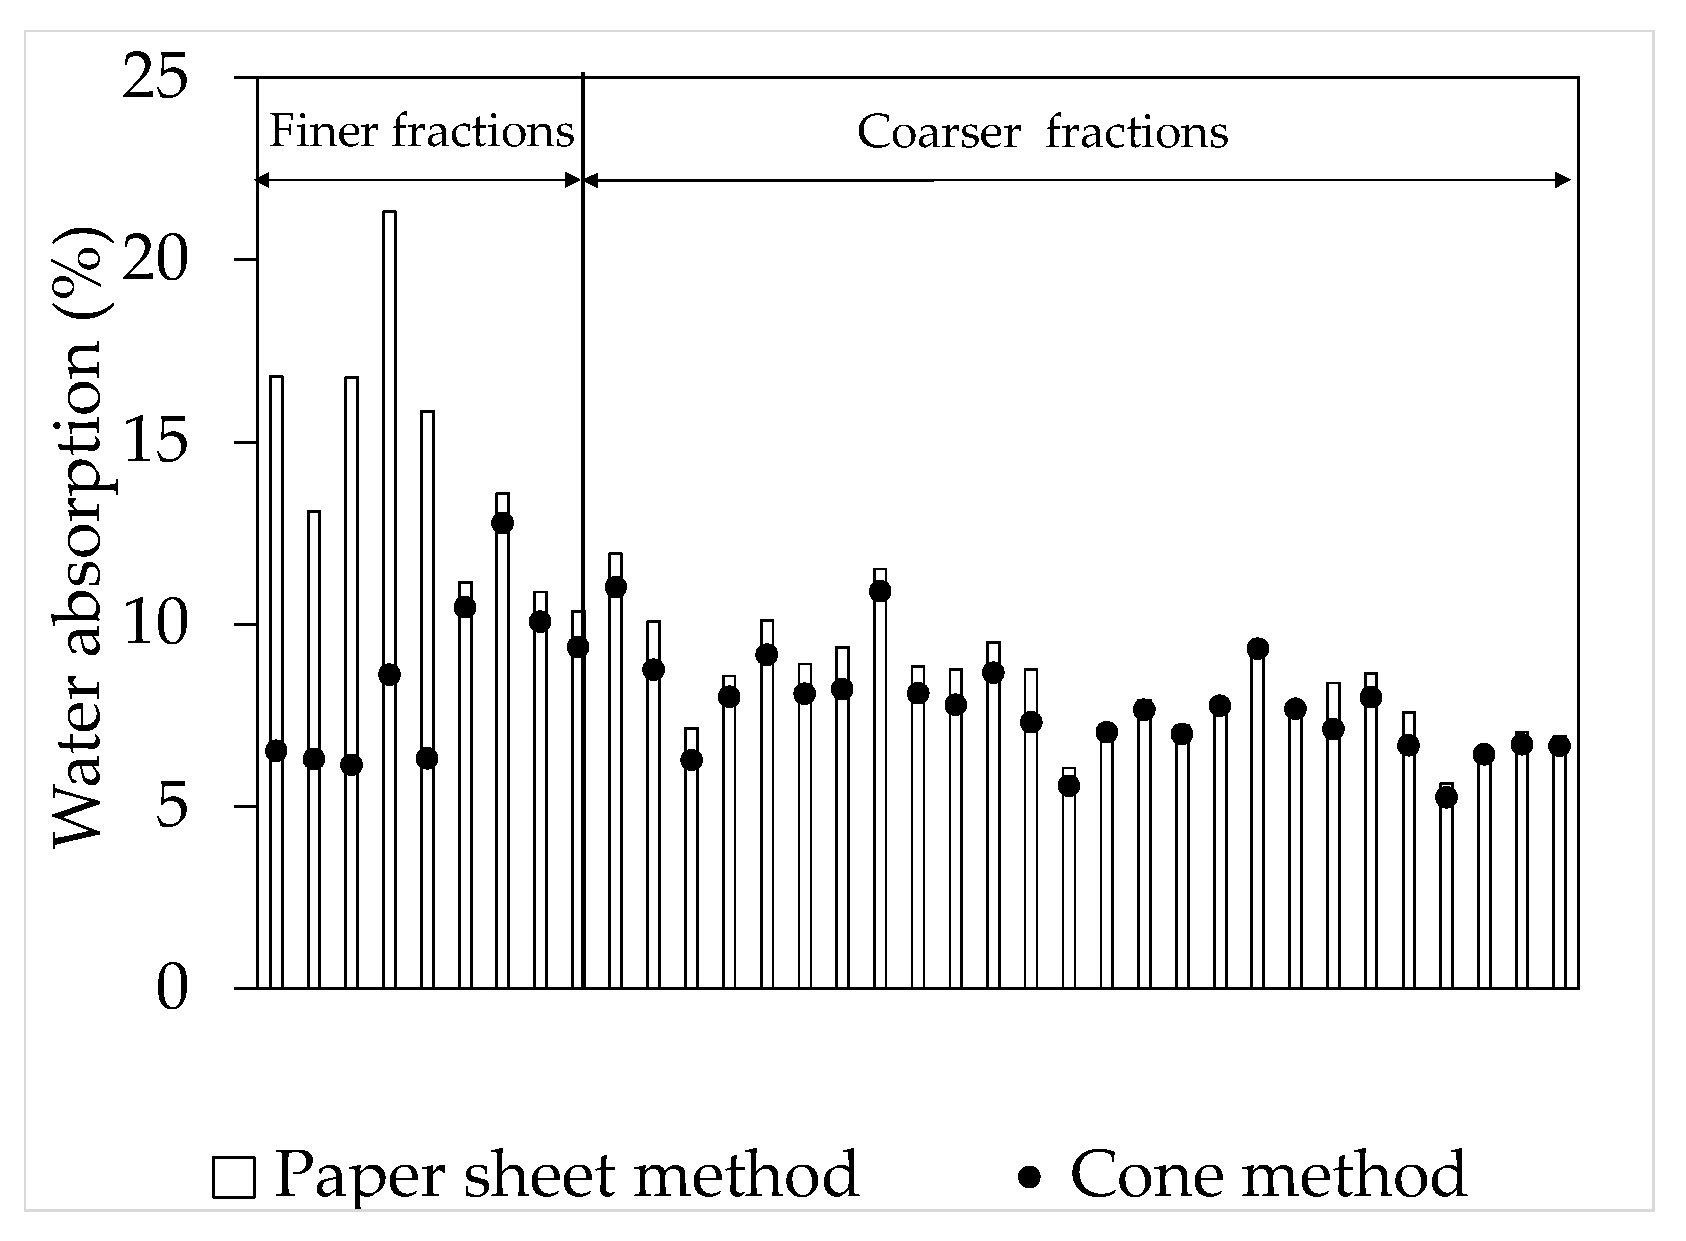
Figure 2.
Scheme and photo of the device.
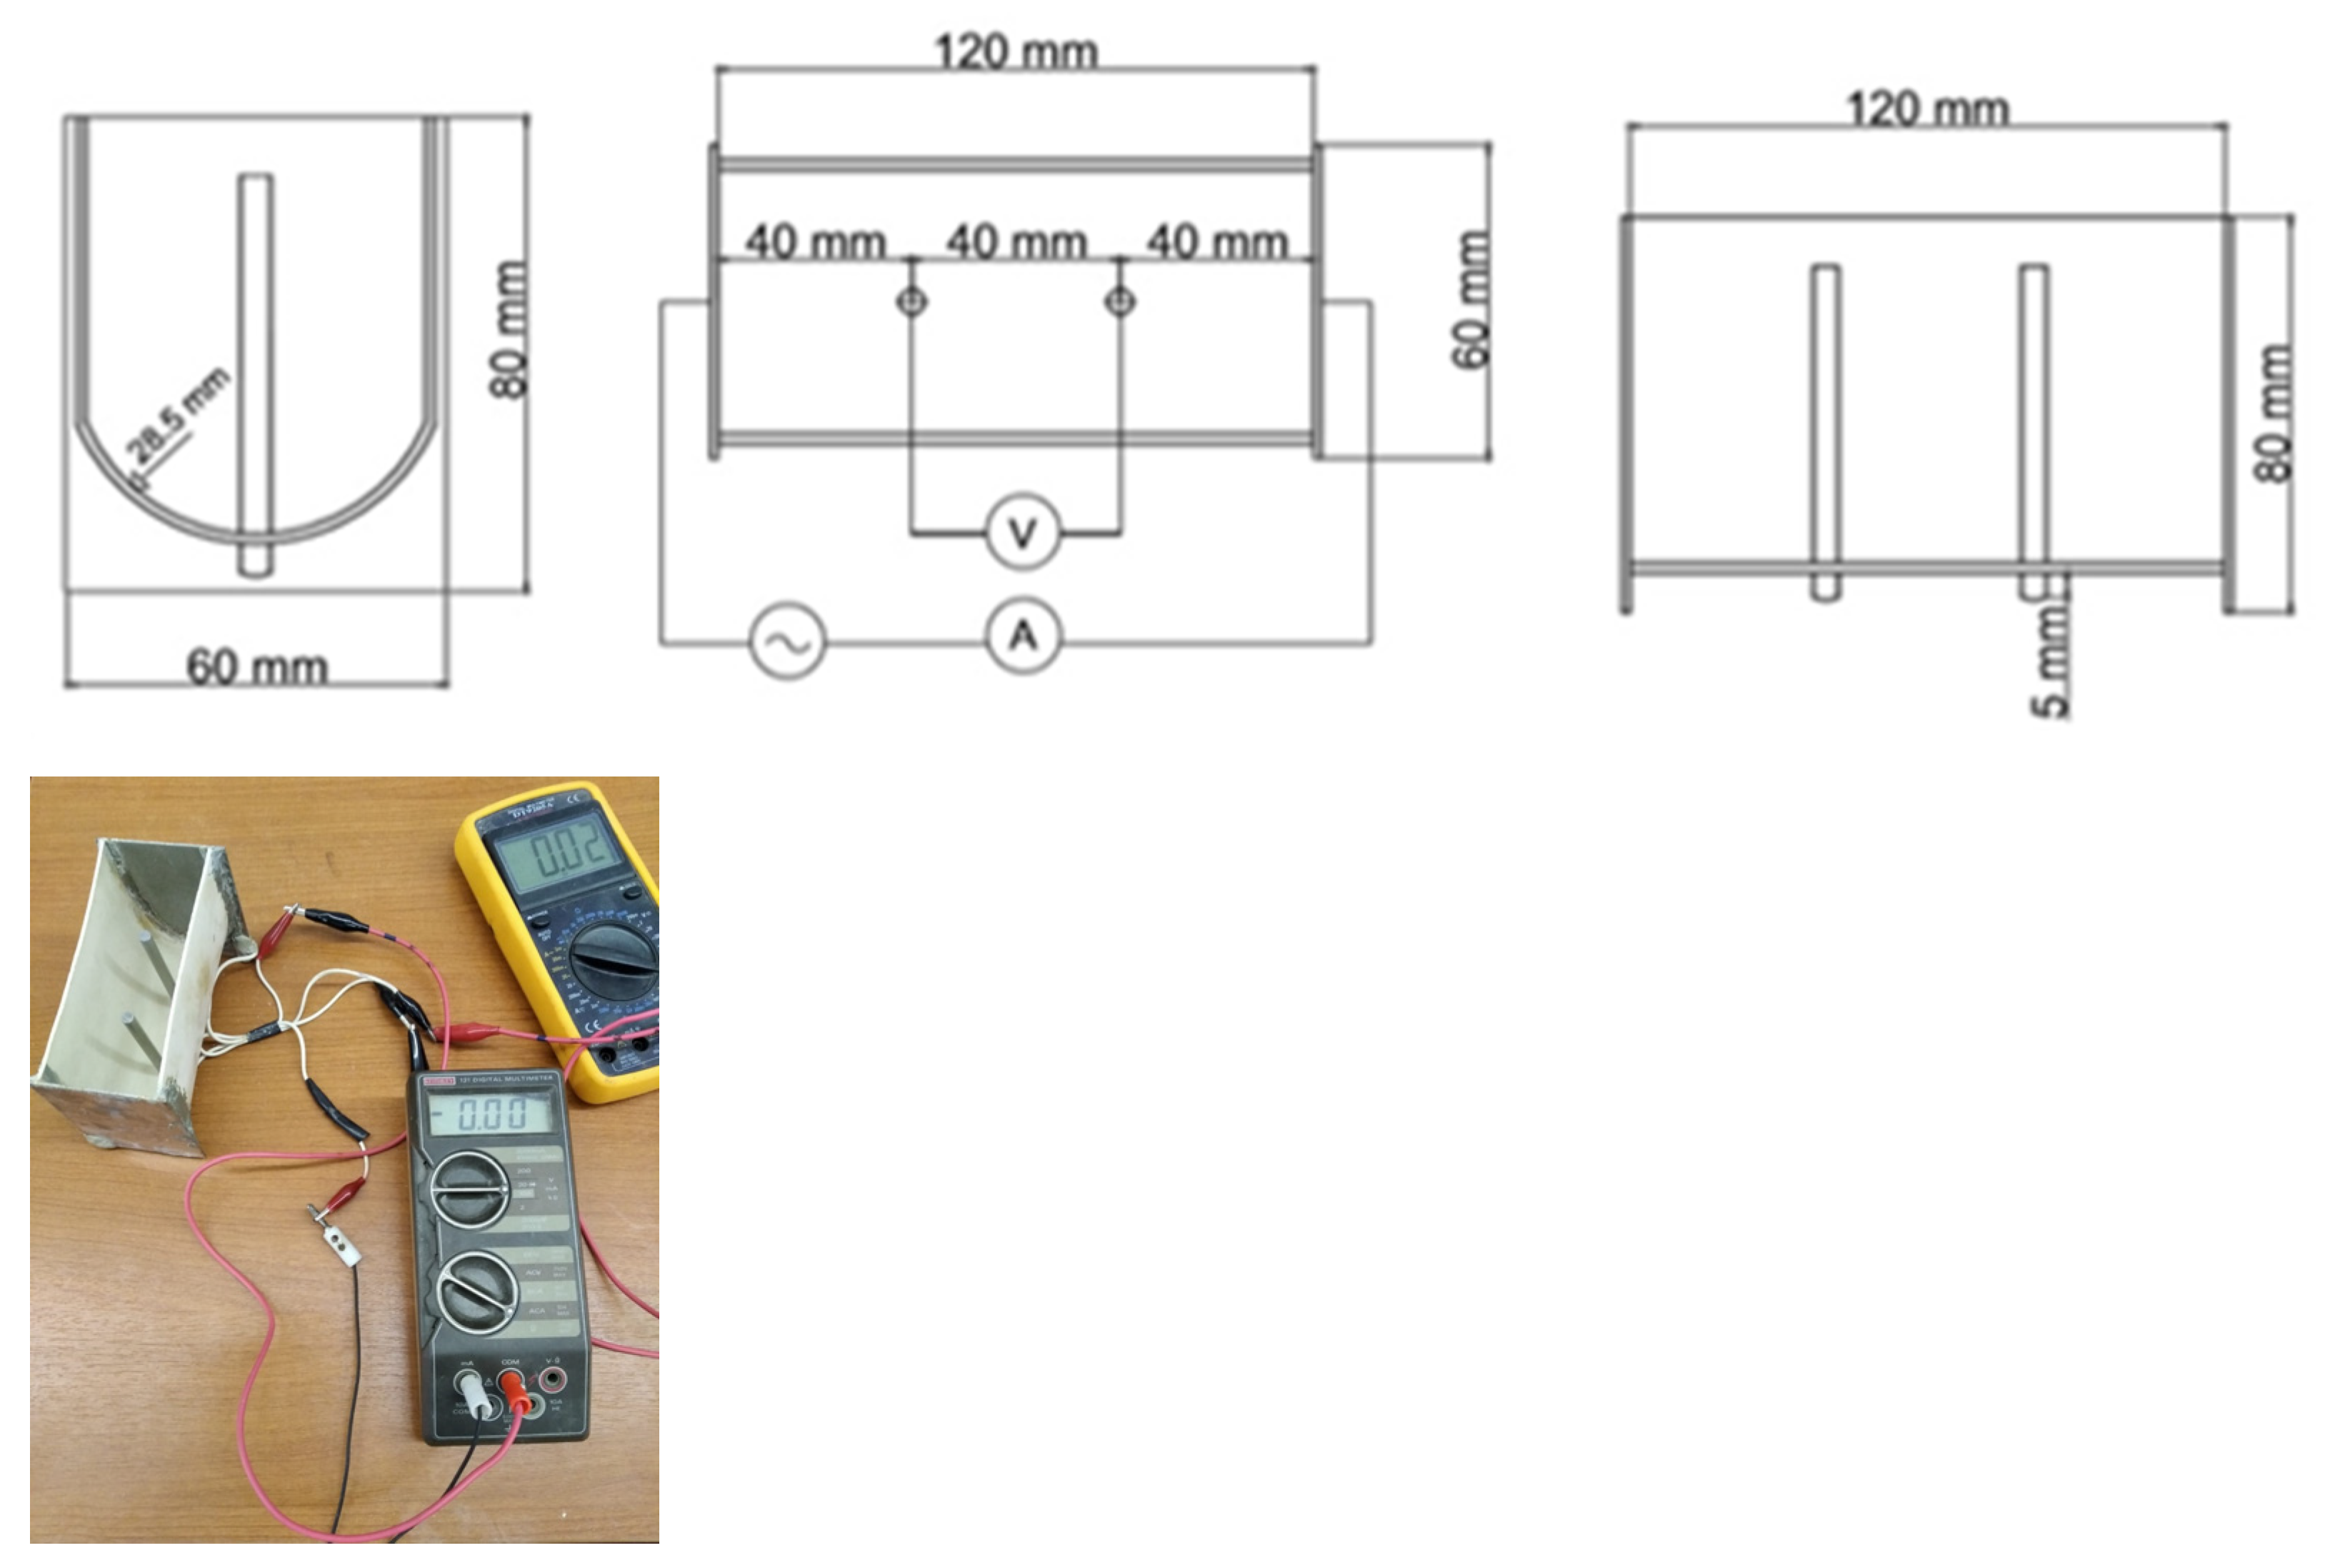
Figure 3.
Moisture contents versus conductivity plots, including the SSD state of NQ samples.

Figure 4.
Moisture contents versus conductivity plots, including the SSD state of RQ samples.
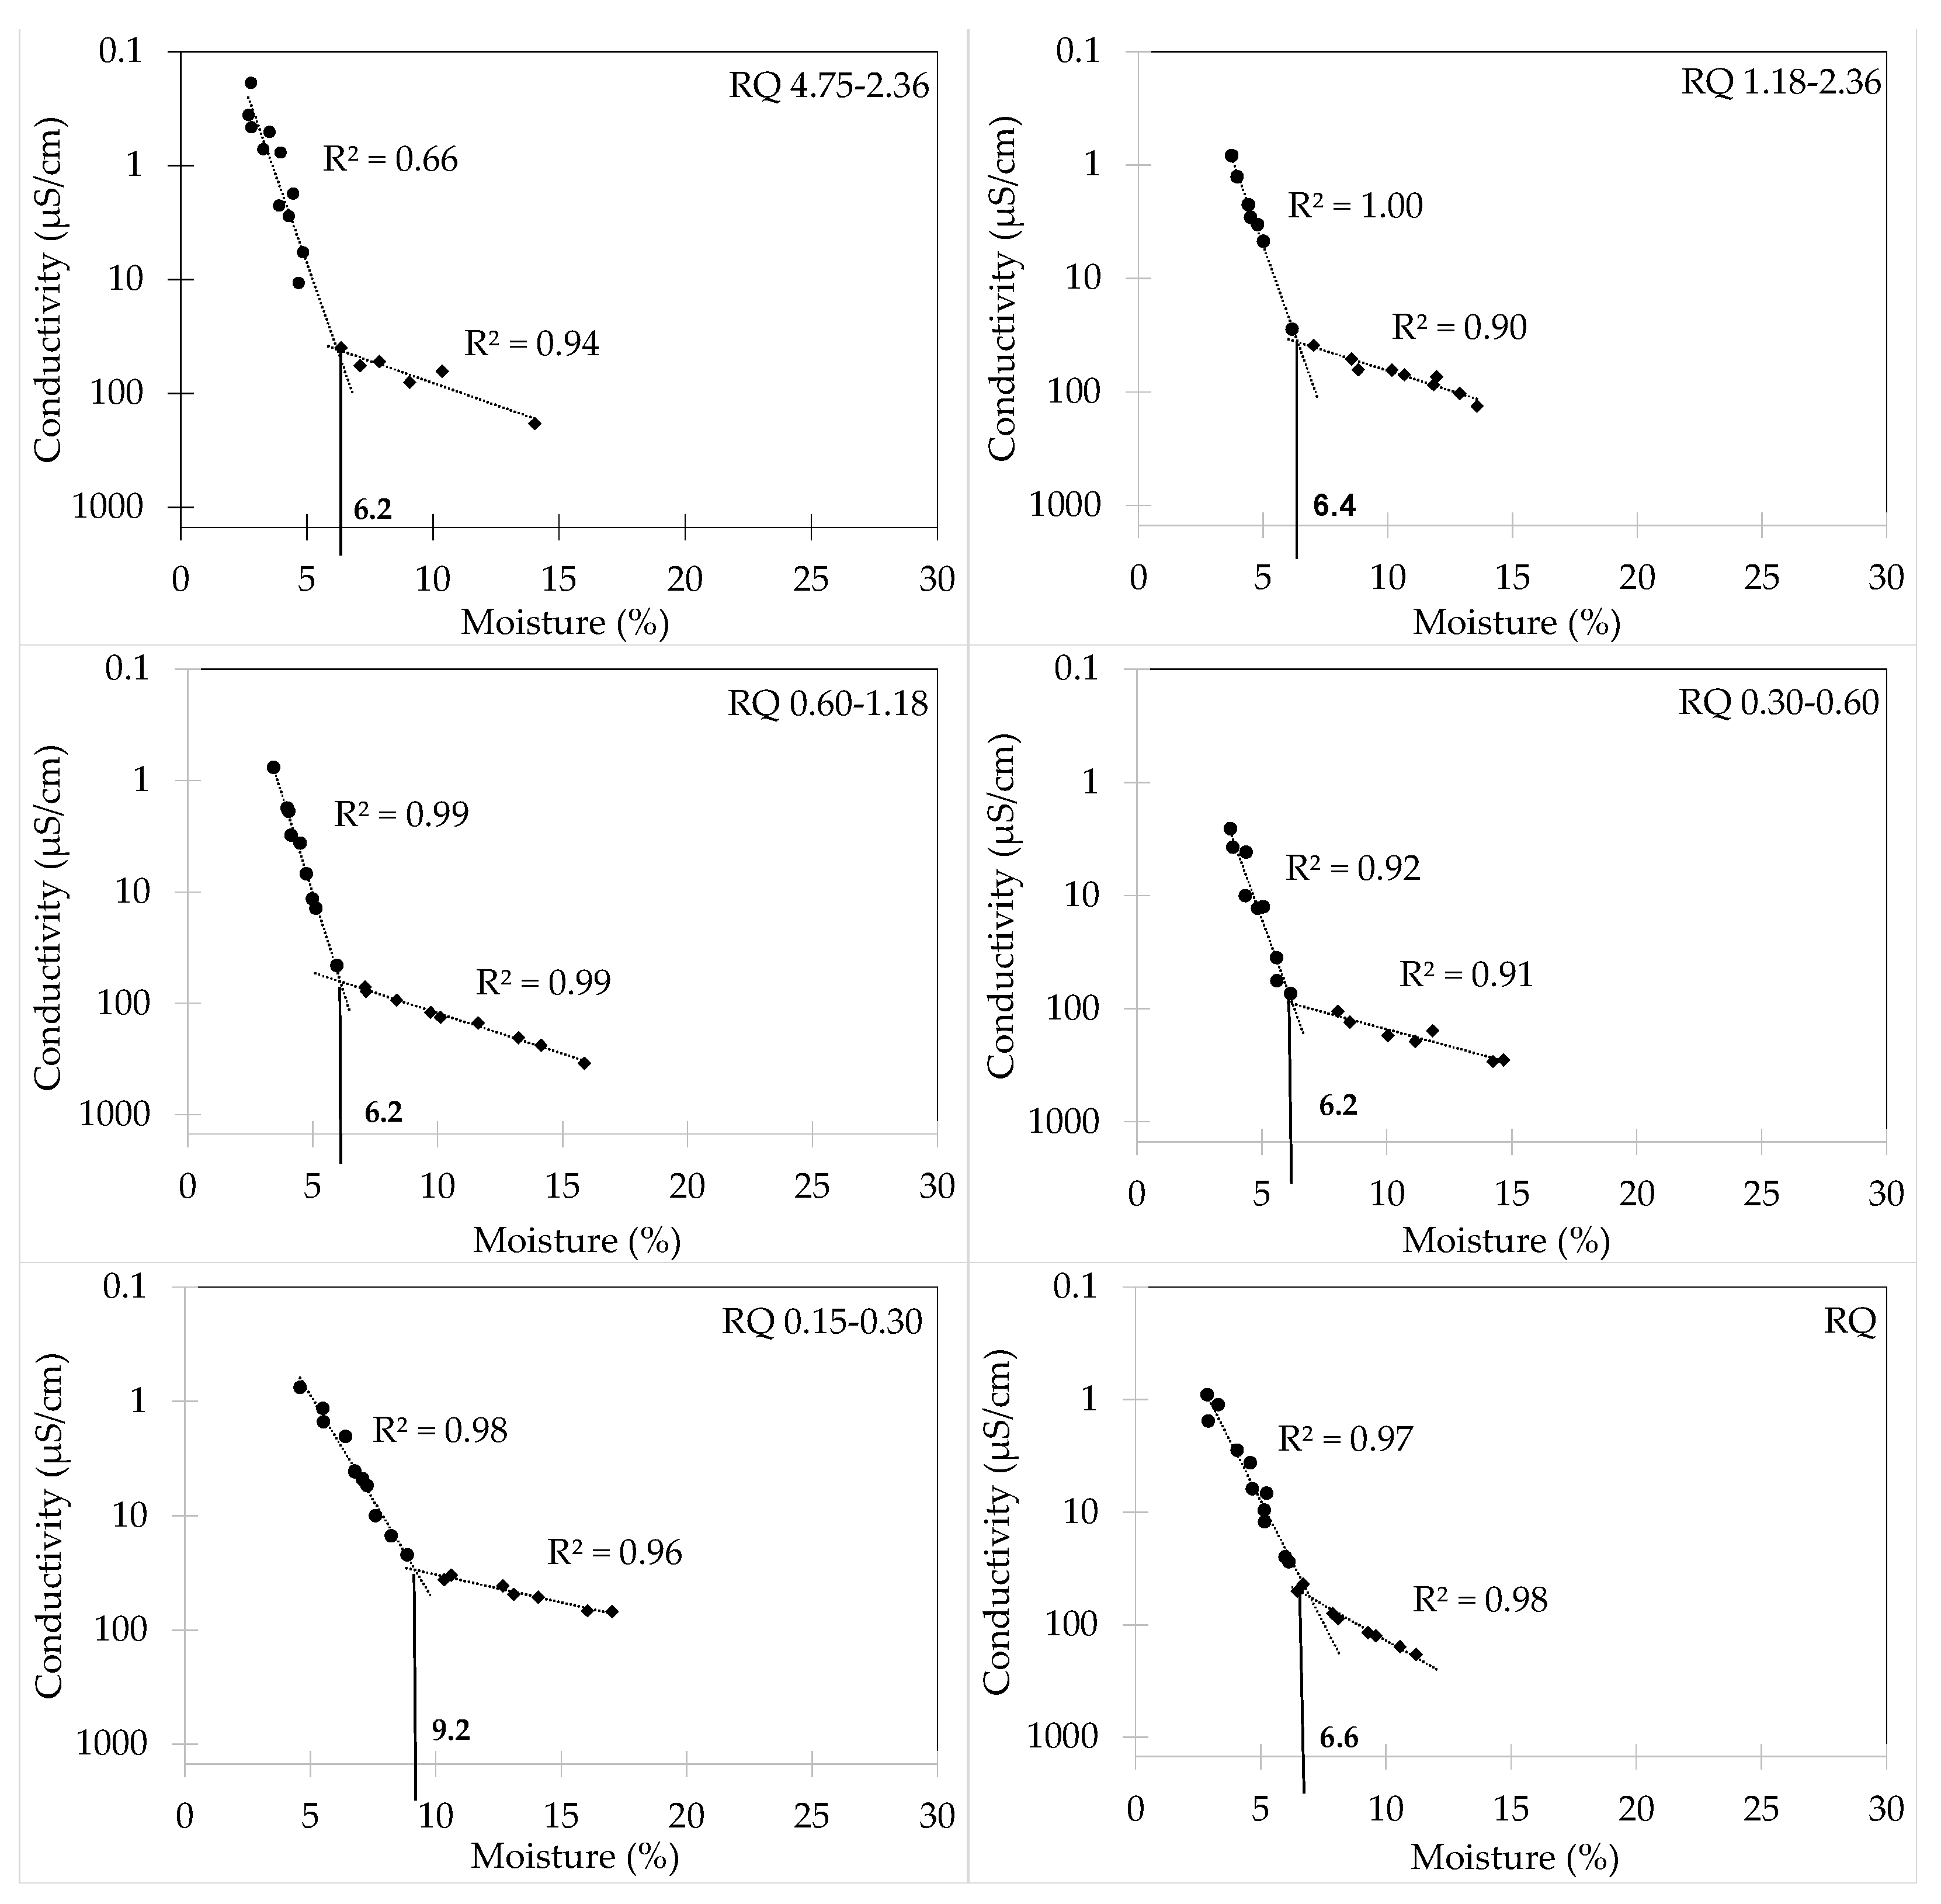
Figure 5.
Moisture contents versus conductivity plots, including the SSD state of RG samples.
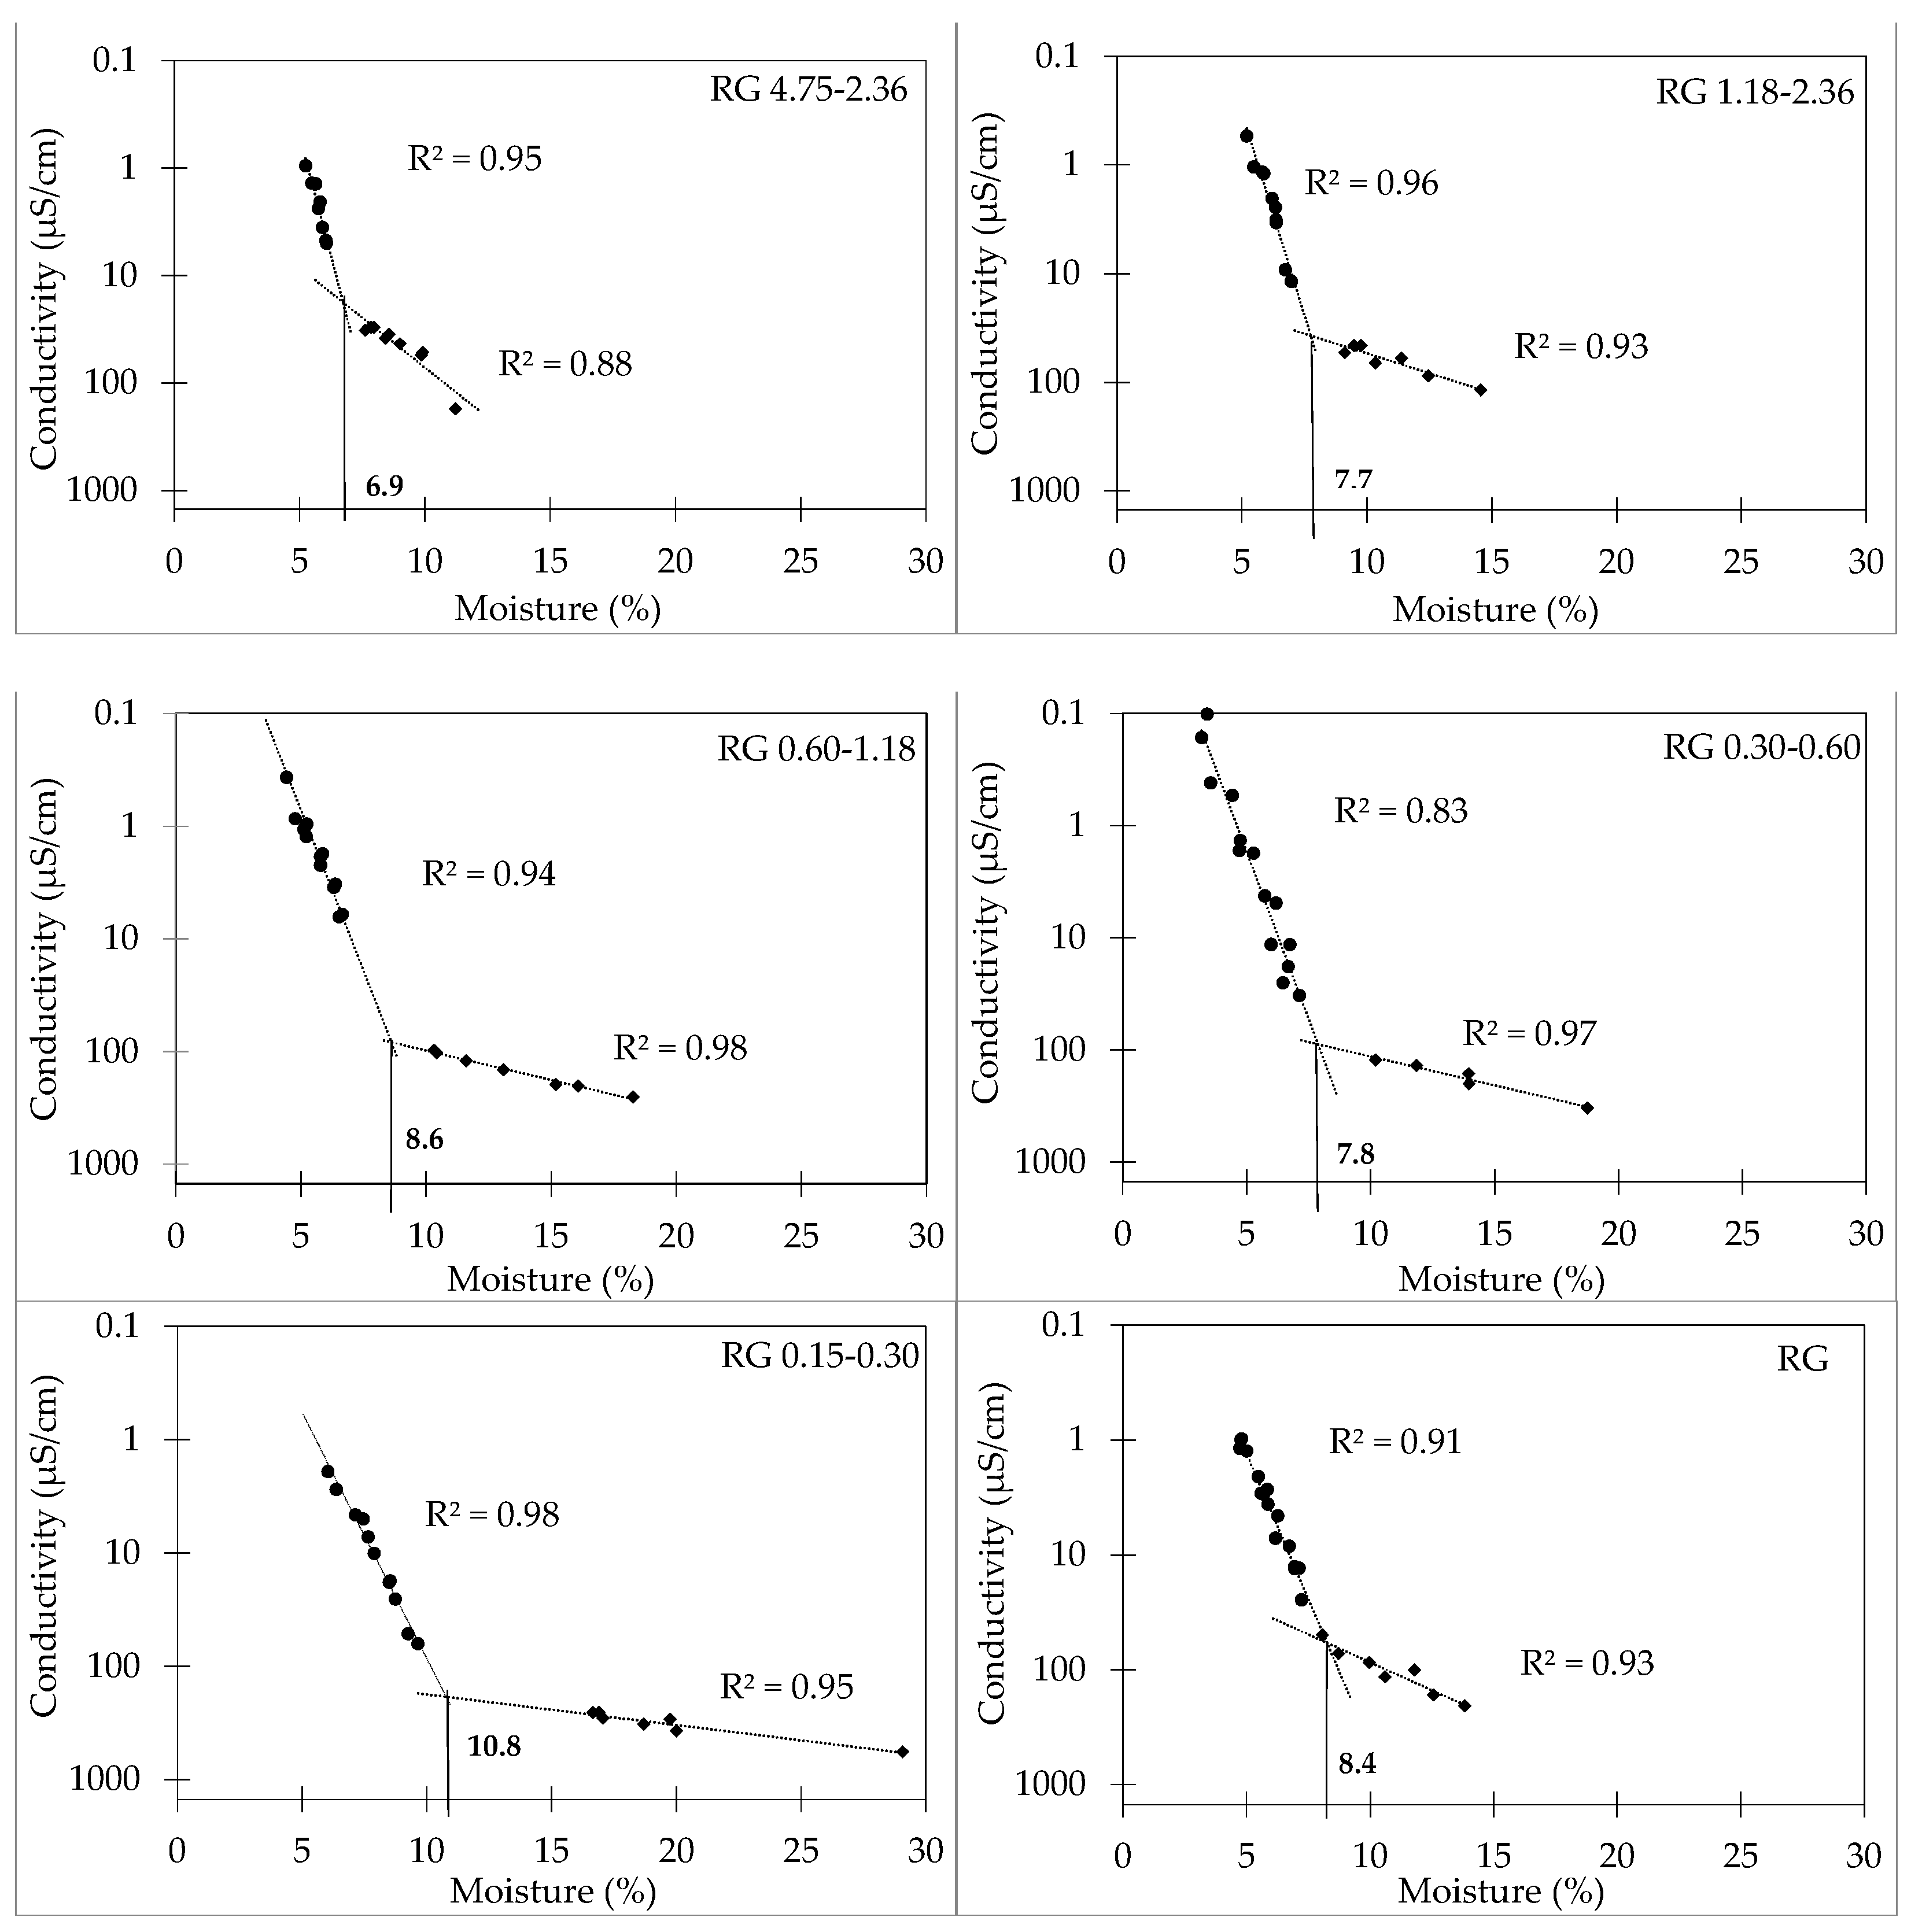
Figure 6.
Cumulative frequency of R2 values.
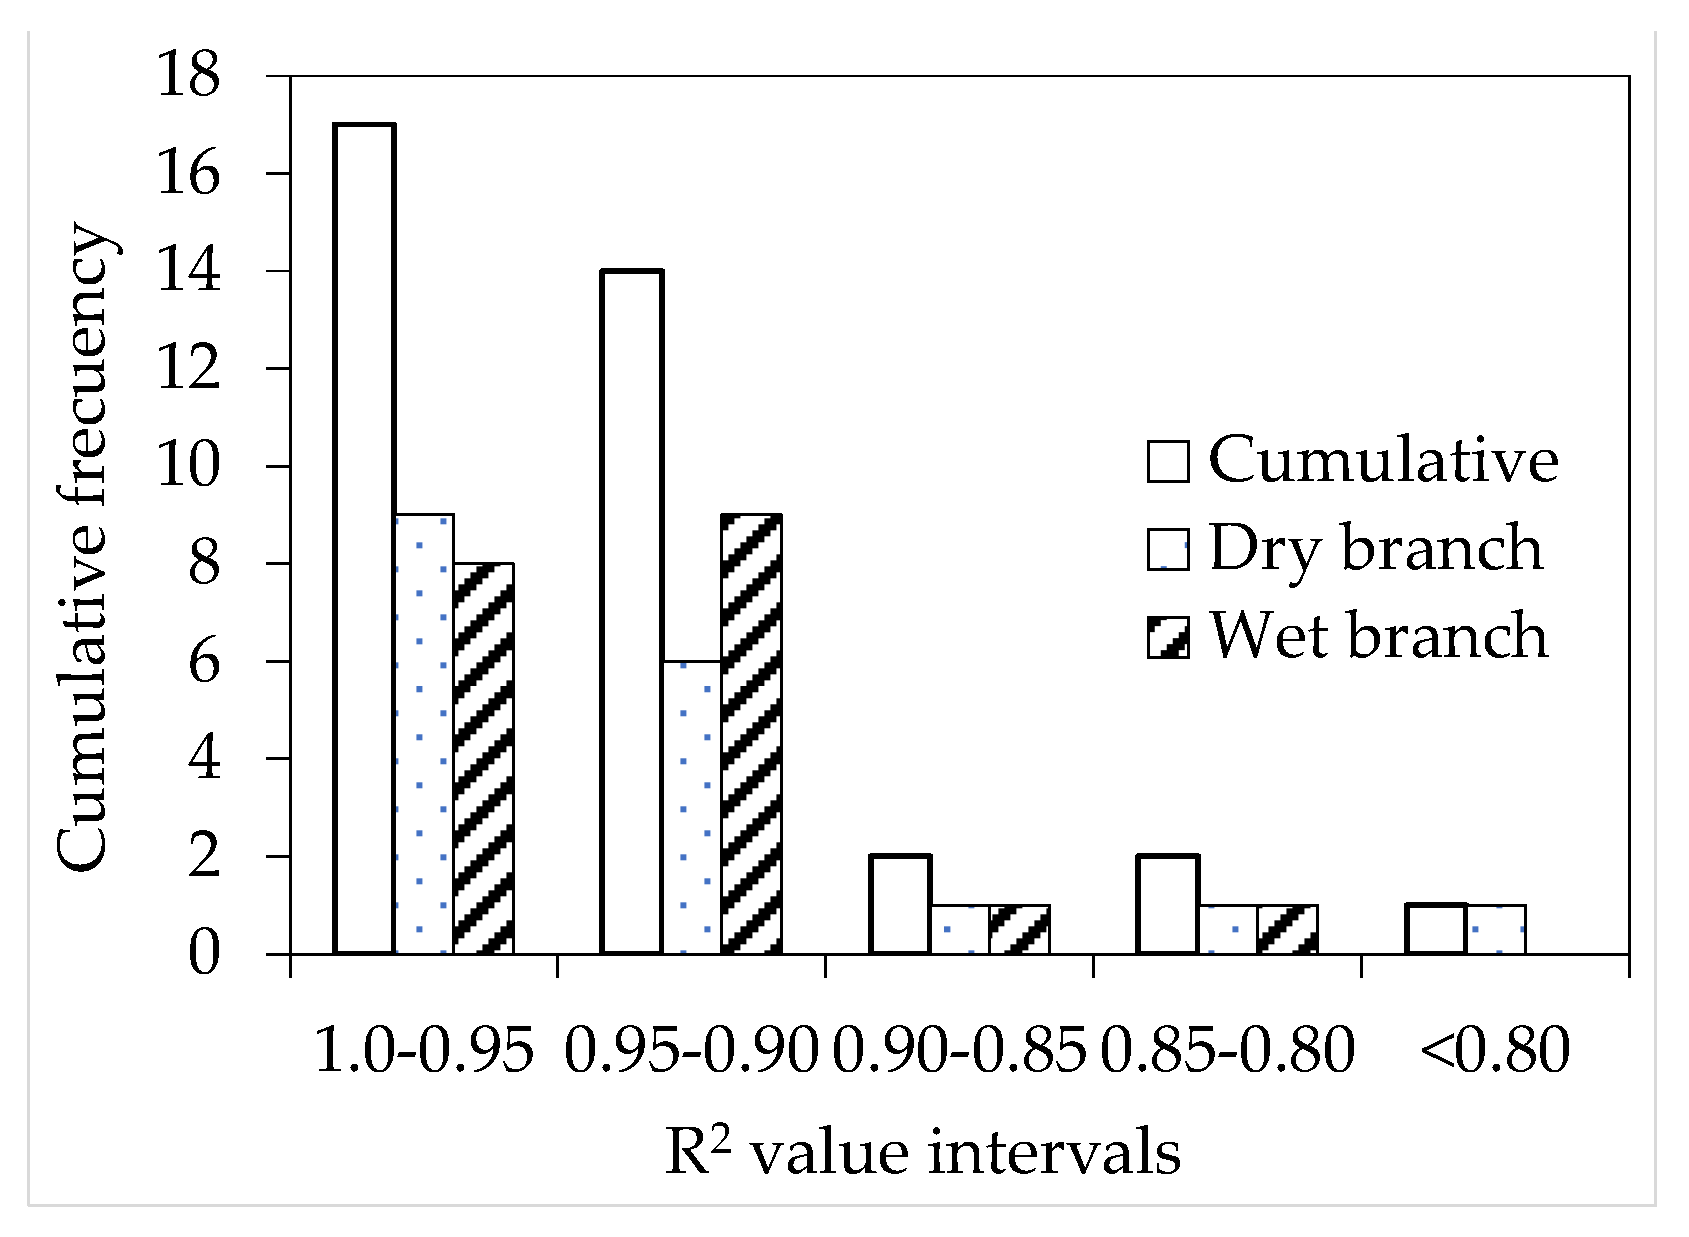
Figure 7.
Link between paste content and WA for RG.


Table 1.
Aggregates properties.
| ID | Fineness Modulus | Density | Paste Content (%) | Particle Size Distribution, Cumulative Retained Mass over Mesh (%) | Material Finer Than 75 µm (%) | |||||
|---|---|---|---|---|---|---|---|---|---|---|
| 4.75 mm | 2.36 mm | 1.18 mm | 600 µm | 300 µm | 150 µm | |||||
| NQ | 3.18 | 2.58 | - | 7 | 27 | 43 | 62 | 83 | 96 | 1.5 |
| RQ | 3.16 | 2.46 | 30.4 | 2 | 27 | 48 | 64 | 83 | 92 | 5.2 |
| RG | 3.45 | 2.49 | 32.1 | 0 | 33 | 57 | 72 | 87 | 95 | 2.7 |
Table 2.
Water absorption results for electrical method.
| Size Range (mm) | Water Absorption (%) | ||
|---|---|---|---|
| NQ | RQ | RG | |
| 4.75–2.36 | 3.6 | 6.2 | 6.9 |
| 2.36–1.18 | 3.2 | 6.4 | 7.7 |
| 1.18–0.6 | 3.8 | 6.2 | 8.6 |
| 0.6–0.3 | 3.2 | 6.2 | 7.8 |
| 0.3–0.15 | 3.8 | 9.2 | 10.8 |
| Weighted average | 3.6 | 6.8 | 8.0 |
| 0.0–4.75 | 3.2 | 6.6 | 8.3 |
Table 3.
Slopes between wet and dry branches.
| Size Fraction (mm) | NQ | NQ | RG | |||
|---|---|---|---|---|---|---|
| Dry | Wet | Dry | Wet | Dry | Wet | |
| 0.0–4.75 | 0.487 | 0.0059 | 0.537 | 0.2108 | 0.507 | 0.097 |
| 4.75–2.36 | 0.543 | 0.050 | 0.614 | 0.070 | 0.744 | 0.073 |
| 2.36–1.18 | 0.504 | 0.026 | 0.718 | 0.073 | 0.570 | 0.052 |
| 1.18–0.6 | 0.411 | 0.026 | 0.609 | 0.060 | 0.596 | 0.051 |
| 0.6–0.3 | 0.411 | 0.020 | 0.365 | 0.064 | 0.434 | 0.027 |
| Standard deviation | 0.501 | 0.033 | 0.628 | 0.078 | 0.899 | 0.111 |
Disclaimer/Publisher’s Note: The statements, opinions and data contained in all publications are solely those of the individual author(s) and contributor(s) and not of MDPI and/or the editor(s). MDPI and/or the editor(s) disclaim responsibility for any injury to people or property resulting from any ideas, methods, instructions or products referred to in the content. |
© 2023 by the authors. Licensee MDPI, Basel, Switzerland. This article is an open access article distributed under the terms and conditions of the Creative Commons Attribution (CC BY) license (https://creativecommons.org/licenses/by/4.0/).
Share and Cite
MDPI and ACS Style
Sosa, E.; Carrizo, L.; Zega, C.; Zaccardi, Y.V. Absorption Variation with Particle Size of Recycled Fine Aggregates Determined by the Electrical Method. Appl. Sci. 2023, 13, 1578. https://doi.org/10.3390/app13031578
AMA Style
Sosa E, Carrizo L, Zega C, Zaccardi YV. Absorption Variation with Particle Size of Recycled Fine Aggregates Determined by the Electrical Method. Applied Sciences. 2023; 13(3):1578. https://doi.org/10.3390/app13031578
Chicago/Turabian StyleSosa, Eva, Leandro Carrizo, Claudio Zega, and Yury Villagrán Zaccardi. 2023. "Absorption Variation with Particle Size of Recycled Fine Aggregates Determined by the Electrical Method" Applied Sciences 13, no. 3: 1578. https://doi.org/10.3390/app13031578
Note that from the first issue of 2016, this journal uses article numbers instead of page numbers. See further details here.