

The Influence of Disclosing the AI Potential Error to the User on the Efficiency of User–AI Collaboration


1
Institute for Ophthalmic Research, University of Tübingen, 72076 Tübingen, Germany
2
Carl Zeiss Vision International GmbH, 73430 Aalen, Germany
*
Author to whom correspondence should be addressed.
Appl. Sci. 2023, 13(6), 3572; https://doi.org/10.3390/app13063572
Submission received: 24 January 2023
/
Revised: 17 February 2023
/
Accepted: 3 March 2023
/
Published: 10 March 2023
(This article belongs to the Special Issue Virtual Reality Technology and Applications)
Abstract
:User–AI collaboration is an increasingly common paradigm in assistive technologies. However, designers of such systems do not know whether communicating the AI’s accuracy is beneficial. Disclosing the accuracy could lead to more informed decision making or reduced trust in the AI. In the context of assistive technologies, understanding how design decisions affect User–AI collaboration is critical because less efficient User–AI collaboration may drastically lower the quality of life. To address this knowledge gap, we conducted a VR study in which a simulated AI predicted the user’s intended action in a selection task. Fifteen participants had to either intervene or delegate the decision to the AI. We compared participants’ behaviors with and without the disclosure of details on the AI’s accuracy prior to the system’s deployment while also varying the risk level in terms of decision consequences. The results showed that communicating potential errors shortened the decision-making time and allowed the users to develop a more efficient strategy for intervening in the decision. This work enables more effective designs of the interfaces for assistive technologies using AI.
1. Introduction
In the last few decades, artificial intelligence (AI) has been swiftly integrated into numerous sectors of our day-to-day life, be it health [1], workspaces [2], education systems [3], or even our private lives [4]. AI-enhanced technologies also offer novel ways to help users to overcome various personal limitations [5], ranging from augmentations, such as enhanced vision aids [6,7] or mobility assistance [8], up to cognitive aids to slow down the development of dementia [9] and other mental burdens [10]. Despite significant improvement in AI algorithms driven by the recent hardware and software advancements, it is still inevitable that the model may fail to meet the user’s needs and expectations, similar to other technologies [11]. Even highly accurate AI algorithms might be subjected to incorrect predictions. As AI technologies are fundamentally data-driven models, their performance highly depends on the training data set used to train the models. Next to biases in the data that influence the predictive power, a training set is unlikely to cover the full range of variance present in the data of the population. Thus, the error potential of AI algorithms is, at least to some extent, always present and therefore needs to be considered. In the context of assistive technology, AI models can furthermore be challenged by the limited data quality on which inference is based. For example, if the patient’s capacity is impaired, intention prediction might not reflect the user’s natural behavior, resulting in undesired consequences for the patient [12].
There are several factors that may affect the user’s acceptance of such technologies, such as the performance of the system. Witnessing an AI producing errors may cause users to stop using a piece of technology due to the mismatch between the AI’s performance and expectations [13,14,15,16,17]. The failure to meet the user’s expectations may also induce algorithm aversion, which describes the user’s tendency to reject the suggestions of an algorithm once they observe its incorrect prediction, even if the model generally outperforms humans [18].
Despite the role of the system’s performance on user acceptance, the usage of more sensors and complex AI-based approaches may also affect the user’s acceptance [19], especially in elderly populations [20,21]. Within the context of health and caregiving, the lack of acceptance becomes particularly acute because users may be highly dependent on the AI’s performance [5,22].
To overcome these challenges of complex AI technologies, prior work suggests ensuring the AI’s model is more explainable and being transparent about the AI’s reasoning and performance to the user [23], which is a core component of the concept of explainable AI (XAI) [24]. One specific goal of XAI is to strengthen users’ trust in the technology and, thus, strengthen the relationship between the user and AI algorithms to help them to unlock their full potential [25]. Furthermore, the increased transparency about the AI and the underlying technology may help designers to manage the user’s expectations of the capabilities of an AI.
Besides transparency, the communication of risks [26] is crucial for balancing the user’s expectations. Prior work emphasizes that risk perception is based on a mental model of the current situation based on direct inputs (e.g., own experience of interacting with a device) and indirect ones (e.g., reading articles about the performance of a device) [27]. Risk communication may alter the personal mental model and trust in the technology itself [28]. In AI-based assistive technologies, researchers emphasize that proper risk and error communication may become essential to help patients and medical experts adopt these technologies [29].
However, while previous research discusses the role of error and risk in separate works, the overall influence of both these factors on the user’s performance is still unclear. In the present work, we address this gap by investigating the communication from the AI to the user in potentially erroneous scenarios and its influences on the efficiency of User–AI collaboration. By error communication, we mean the level of detail in the system’s introduction to the user before its deployment, specifically, the elaboration on the AI accuracy. The risk factor is addressed in terms of decision consequences.
To address this knowledge gap, we evaluate whether the user would be less willing to follow the model’s suggestion once aware of the possible errors, even given an overall high accuracy of the AI, or, conversely, whether it would benefit the user’s performance. Consequently, we address whether conveying the potential AI error to the user will reduce the time necessary for them to settle on either actively intervening in the model’s decision or going along with the model’s prediction. In the present study, the latter scenario is regarded as a more efficient User–AI collaboration.
Notably, the vast majority of existing research on AI’s error communication is focused on models from rather remote modalities, such as making decisions on speed dating results [30] or predicting a person’s yearly income based on their demographics [31]. Additionally, one problem of the mentioned studies is that users typically perform as well as the proposed AI model or worse. This is not applicable in scenarios with assistive technology as the user often precisely knows their intention, be it picking a specific object using a robotic arm or navigating the room using an AI-driven wheelchair. To improve the ecological validity, we designed a paradigm emulating a realistic scenario for a user intending to grasp an object. We implemented the experiment in virtual reality (VR) to maintain a high level of realism and increase the participant’s immersion in the environment [32]. The study is meant to be an initial step within a larger research project aiming to develop an AI-supported system to assist users with motor impairments in daily tasks such as grasping an object using a prosthetic arm. Thus, VR is an essential tool for the experimental design enabling further applicability of the findings.
We conducted a VR study in which the participants were introduced to an AI model that predicted the object of interest the participant intended to grasp. Before confirming each final decision, the participants had to either check the AI’s decision or accept it without intervening. Checking the AI’s decision allowed the user to correct it.
To engage the participants in the paradigm, we implemented a scoring system that allows participants to collect points if the final decision on the object was right or lose points when the decision was false. Critically, users had to invest certain points in checking the AI’s decision. With such a scoring system, we enable the user to collaborate with the AI model. The goal of the task was to maximize the number of points.
To incorporate the potential error of AI systems, we simulated two scenarios where the AI performed at different levels of accuracy as suggested by prior work [31]. A low-predictive-power (low-accuracy) model represents a high-potential-error AI. Another high-predictive-power (high-accuracy) model represents a low-potential-error AI. The key approach of the study was to compare the participants’ behaviors when the potential error of the AI was not disclosed and when it was revealed to the participants. In doing so, we investigate the influence of communicating to the user the potential AI errors on the user’s performance. Additionally, we introduced two levels of risk in terms of decision consequences by varying the number of points participants can lose on incorrect final decisions. This variation allowed us to gain insights into the impact of risk communication on user performance.
The present study provides insights for AI developers in various sectors, particularly assistive technology. Regarded together, our results show that conveying the potential AI error to the user enables the user to anticipate when it is more practical to actively participate in the final decision or delegate it to the AI and also ensures a faster decision regardless of the risk level. That is to say, it enables more efficient collaboration between the user and the AI.
1.1. Related Work
As our main contribution focuses on error communication in human–computer interaction with specific regard to assistive technology, we will first define AI in the context of assistive technology. Afterward, we emphasize the role of error communication in human–AI interaction and, finally, we will discuss the influences of risk in the context of error communication.
1.1.1. AI in the Context of Assistive Technologies
During the last decade, computational power rapidly grew, enabling researchers and developers to apply advanced technologies such as artificial intelligence to various areas [9]. Furthermore, in the context of assistive technologies, researchers began to apply AI to help individuals with special needs along with caregivers. AI-enhanced systems may be useful to overcome personal limitations of both physiological and cognitive nature. For example, through the application of enhanced computer vision, researchers created tools to restore the capabilities of the patient’s eyes [33]. Furthermore, through advanced AI prostheses, users may gain more independence and flexibility in their daily routines [34]. Furthermore, researchers show that applying AI systems may help to slow down the development of Alzheimer’s disease and other mental problems [35]. Moreover, artificial intelligence may assist caregivers and health experts in their practices [36]. Such, through applied machine learning algorithms, researchers were able to improve the detection of illnesses through advanced analysis techniques of medical images [37]. Finally, AI-enhanced systems have been applied as social assistance, for example, to engage the elderly by means of high-level conversations while assisting them during various tasks [38]. However, while these examples illustrate the great potential of AI in the context of assistive technology, there are certain risks and challenges relevant when applying AI in this domain.
Similar to Leonelli [39], who states that “extracting knowledge from data is not a neutral act”, we face a similar problem in the context of assistive technologies [40]. Recently applied AI approaches are data-driven and rely heavily on high-quality data from numerous sources [41]. However, if the underlying data are already biased, the evolving AI model will likely be biased as well and, therefore, increase the probability of making wrong decisions such as false diagnoses or interventions when the user is not present in the bias-supported class [42,43].
Another challenge for AI developers is the acceptance of new technology. Various examples show that, while a piece of technology may benefit a user, there are multiple reasons to stop using it or mistrust it. One aspect may be the experience of anxiety while interacting with the system due to the usage of intimidating sensors such as brain–computer interfaces [44]. Furthermore, AI systems may become rather complex and, therefore, difficult to understand how they work [45]. A common term for this phenomenon is “black box”. In some cases, even developers do not understand the mechanics inside the AI model and only work on it as a black box by adjusting its inputs and outputs. Thus, users might have even bigger problems in understanding the complexity and are expected to blindly trust the results of an AI without knowing how it works [46]. However, this may cause discomfort and lead to users experiencing algorithm aversion [47]. To overcome these problems of a complex black box, researchers and designers began to introduce the concept of explainable AI [48]. It has the goal of explaining the AI’s decision to the user. As such, the communication of the AI’s limitations and potential errors are important aspects of explainable AI.
1.1.2. Error Communication
While interacting with a system, the user and the system itself may cause errors. To manage the errors caused by users, research on user experience (UX) design emphasizes that designers should offer simple ways to correct errors [49,50]. Similarly, designers should show easy-to-understand information on the origin of the error and its occurrence, such as highlighting errors in a web form [51]. At the same time, insufficient error communication may cause frustration, and, in the worst case, users may lose their trust in the system [52].
Looking at system errors, there are even long time risks if errors are communicated in an inappropriate way. If communicated wrongly, users may adopt harmful strategies leading to disruptive behaviors [53,54]. For example, if a voice-based interface does not recognize the user’s command, some users adapt their voice and rely on hyperarticulate speech to “assist” the system in recovery [54], which may cause discomfort and further increase the user’s algorithm aversion [47]. Even showing an error message can already cause unpleasant emotions in users [55]. However, the tone of voice used to communicate an error can alter how unpleasant the users see these messages as. As prior work shows, using an apologetic tone of voice reduces the negative effects of error messages [56].
In recent years, more advanced artificial intelligence systems have been developed to support individuals in making optimal decisions in high-risk scenarios [57]. Contrary to UX design strategies, prior work shows that communicating errors in such situations may increase the probability that users stop trusting such systems or begin to rely more on their own intuition. Thus, error communication can lead to decreased performance [58].
Moreover, it has been shown that users lose their trust in an AI much faster than when interacting with other humans [59]. As these data suggests, designers are challenged with two apparently contradictory recommendations: On one side, the UX design literature suggests being open and directly communicating errors to the user. On the other side, the experiments show that being open about system errors can cause users to distrust the results of the AI’s prediction and, in the worst case, stop using the technology.
1.1.3. The Relationship between User Performance, Risk, and Error Communication
Furthermore, it has been shown that being transparent about limitations such as low predictive power (low accuracy) could be beneficial for appropriate user expectation management. As such, it could lead to a higher model acceptance [60], too. One of the key pillars of the XAI concept is transparency. Derived from sociology, the authors in [61] outlined several principles for XAI. Among others, transparently informing about non-trustworthy AI is critical. This guideline addresses communicating situations to the user where the AI system would not work as expected.
Numerous authors have also studied the effect of conveying AI accuracy to users regarding the user’s performance. For example, it has been shown that the model’s stated accuracy affects the user’s willingness to check the model’s decision. The participants agreed with the model’s prediction more readily if the AI’s stated accuracy was higher [30]. In [31], the authors attempted to objectively measure how much participants trusted the AI model while varying the reported predictive power of the AI on a trial-by-trial basis. The results showed that, starting at an accuracy level of 70%, the participants were more willing to delegate the decision to the AI once they were aware of the model’s confidence.
Alternatively, the decision of whether to communicate errors to the user can also depend on the application’s risk level. In [30], where an AI was represented by an assistant to predict a person’s yearly income with certain qualities, the researchers did not find any influence on the amount at stake on the participants’ behavior. The authors recognize, however, that the absence of the effect can be explained by negligible consequences for the participants in the case of an incorrect final decision. In assistive technology, however, the role of the risk of AI failure to correctly predict a user’s intention grows significantly as the user physically relies on the system’s performance. The failure of an AI to successfully support the user can cost them various resources, while financial and temporal costs are the least, physical trauma and health threats are more severe safety-related consequences [62,63].
1.2. Scope of This Study
As stated above, there is a gap in the current research: On the one hand, XAI and UX design recommend being transparent about the system’s performance and to communicate errors. On the other hand, there is existing evidence that challenges these recommendations, as it might introduce mistrust when the user experiences an error or malfunctioning system. Furthermore, previous research shows that even just communicating an error to the user can already cause discomfort. However, a clear analysis of whether communicating the AI’s potential error is essential to help AI designers correctly communicate the system’s status to the user is missing. Especially in high-risk contexts, such as assistive technologies, losing the user’s trust may hold them back by forcing them to rely on their intuition instead of using advanced AI-based systems to their full potential. Thus, in this paper, we investigate the importance of potential error communication of AI models while varying risk in terms of the decision consequences.
2. Materials and Methods
To better understand the effect of error communication on the efficiency of User–AI collaboration, we conducted a VR study where participants interacted with a simulated artificial intelligence. Keeping in mind the assistive technologies, where users have to rely on an AI-enhanced prosthesis [34] as the principle application, an “imagine-to-grasp” task was implemented.
2.1. Experimental Paradigm and the Task
The task was implemented where the participants were instructed to imagine grasping one of the four objects in front of them on a virtual table. An AI model was simulated, predicting which of the presented objects the user intended to grasp. The total accuracy of the model was set to 90%. In each trial, the participant was instructed to imagine grasping a specific object that was displayed prior to the trial. Thereafter, the participant had to decide whether they trusted the model’s prediction without knowing the result and move on or double-check whether the model made the correct decision.
After their decision, we revealed whether the AI “predicted” the correct object they imagined to grasp regardless of whether the participant checked and potentially corrected it or did not intervene. A decision was considered to be correct if the final selected object matched the object that the participant was instructed to imagine to grasp. Otherwise, the final decision was regarded as incorrect. In the case of an incorrect decision, the model’s prediction was randomly assigned to one of the three non-target objects. Note that an incorrect prediction could only be assigned to the objects adjacent to the target one. In doing so, we intended to avoid compromising the simulated AI model if the proposed model’s prediction appeared spatially too far from the target object.
To address the User–AI collaboration, we used a scoring system where the participants gained points whenever the AI made a correct final decision and lost points otherwise. In addition, the participants lost some points every time they checked the model’s decision. The ultimate goal for the task was to maximize the total score in each experimental session. The participants had to collaborate with the AI to gain as many points as possible during the tasks. The details on the number of gains and penalty points can be found in Section 2.5.
To confirm that the participants generally trusted the system and, consequently, to validate the implemented paradigm, at the end of each experimental session, the participants were requested to provide a rating from 0 (= no trust at all) to 10 (= complete trust) on how much they trusted the model’s predictions overall.
The participants were explicitly informed that, during the experiment, the model does not learn from the participants’ responses but rather collects the data for further post-analysis. Thus, the participants were encouraged not to try to adjust their strategy while striving to improve the model performance. The specific instructions to the participants can be found in Section 2.2.1.
2.2. Trial Flow
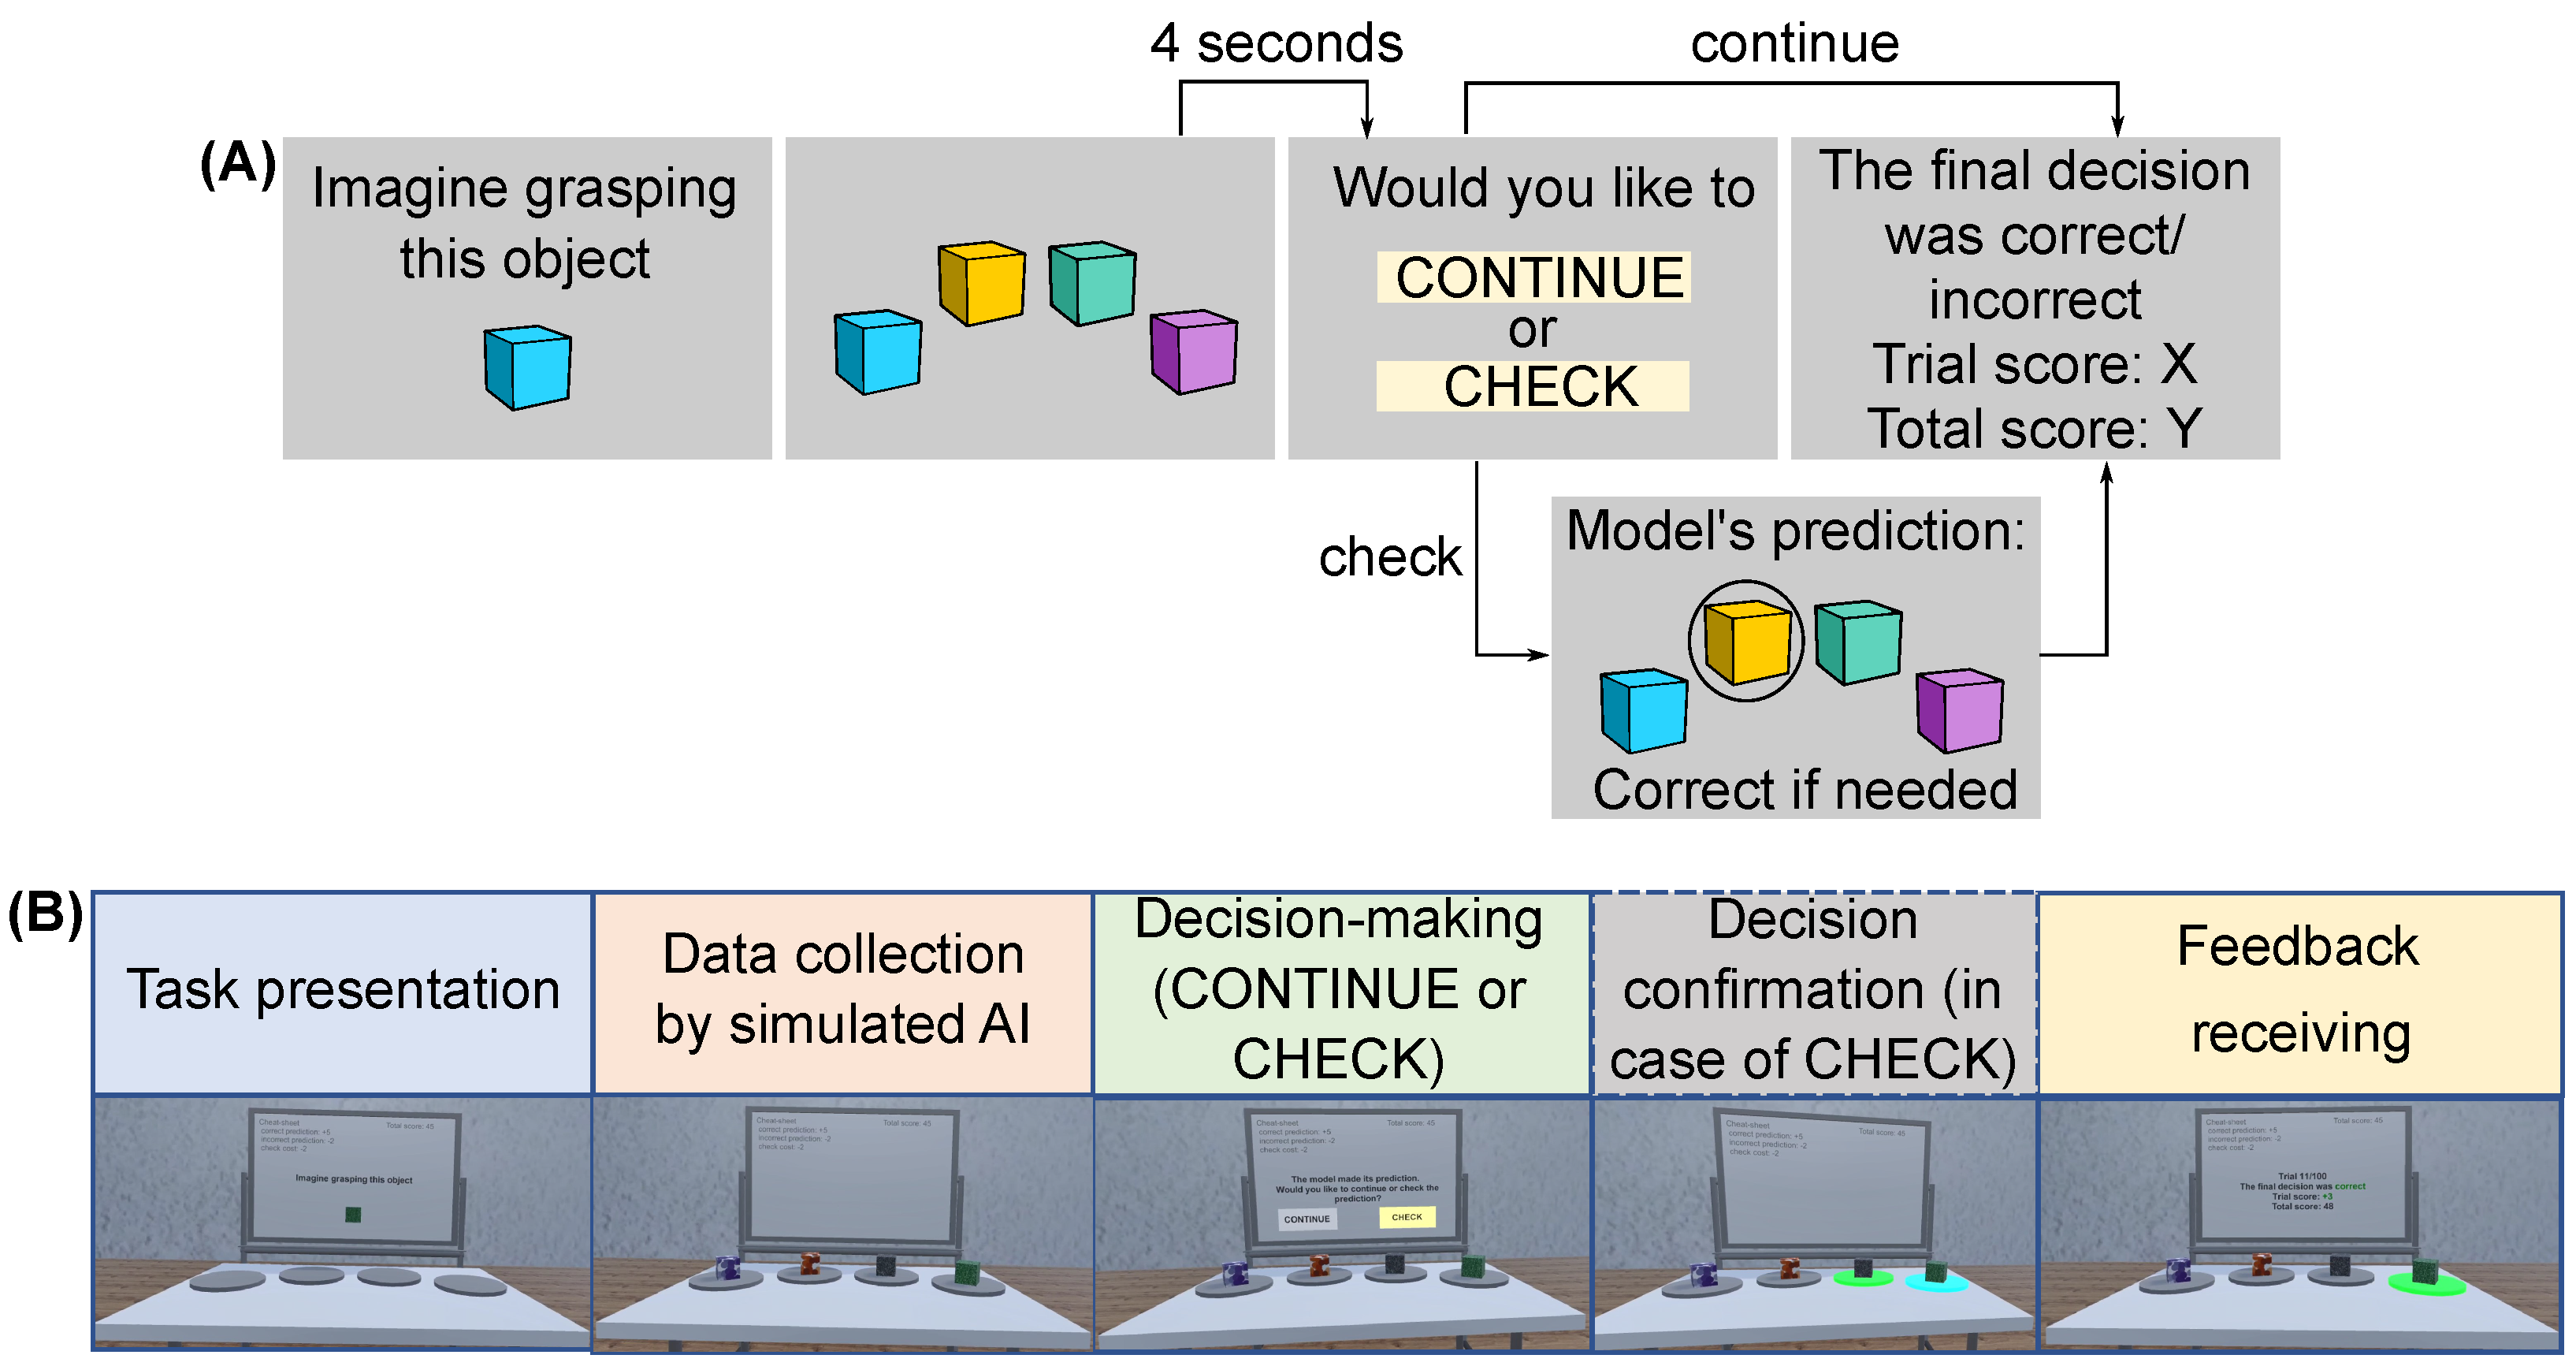
The general trial flow is demonstrated in Figure 1A. Each trial can be segmented into four or five phases that are indicated in Figure 1B:
- Task presentation: starts from the moment the target object is shown to the participant until they press a button to start the presentation of four objects.
- Data collection by simulated AI: starts when four objects appear in front of the user and finishes after four seconds. The participant is told that, during this phase, the AI model is collecting the data from the user as well as from the environment.
- Decision making: starts immediately after the data collection and is initiated by the appearance of two buttons CONTINUE and CHECK. The phase finishes once one of the buttons is selected by the participant.
- Decision confirmation: starts if the participant decides to check the model’s prediction and selects the respective button. The phase finishes once the participant confirms the final decision, which can either be the same as the model’s prediction in the case of a correct trial or be corrected by the participant.
- Feedback receiving: starts after the selection of the CONTINUE button in the case the participant decides to continue or after the participant confirms the final decision in the case the CHECK button was selected. The phase ends upon a button press on the controller, and a new trial immediately starts thereafter.
2.2.1. Instructions for Participants
First, the researcher conducting the experiment vocally provided a general introduction to the experiment to the participant. Thereafter, at the beginning of each session, the respective instructions were displayed as text in the virtual environment and played in audio format for each participant. The specific instructions were:
We trained an AI model to predict which of the presented objects the user is intending to grasp. The model is based on multimodal data from the user and the visual scene. We previously evaluated this model on a large data set, and its total accuracy was approximately 90%.
In the “revealed” condition, we additionally informed the participants:
However, based on the evaluation, the objects with larger circle textures are identified with lower accuracy, 60%.
The rest of the instructions were identical for both conditions:
The aim of this study is to test our AI model. In each trial, you will see a set of four cubes. You will be asked to imagine grasping one of them—just look at the target where you would grasp it. After the model collects the data, it will produce its prediction of the intended object. You will then be prompted to either CONTINUE to the next trial or CHECK the model’s prediction and correct it if needed. To select the button, use your gaze and press the trigger. For each correct final decision, you will gain +5 points. For each incorrect final decision, you will lose −X points. Each check will cost you −2 points. The final goal is to maximize your number of points. Note, the X corresponds to the risk level where it is −2 points for the low risk and −10 points for the high risk.
Figure 1.
(A) A schematic representation of the trial flow. (B) An example of the respective virtual environment scenes. After the target object was presented to the participant, four objects appeared in front of the participant, including the target object. The participant was requested to imagine grasping the target object for four seconds. Then, the participant selected to check or continue to the next trial using their gaze and the controller. Depending on the selection, the model’s decision was indicated or not. After the confirmation of the final decision, feedback was displayed on the correctness of the final decision as well as the current trial score and the total score. The objects were positioned on four platforms equidistantly located relative to the participant. The relevant text was displayed on the virtual whiteboard. Moreover, to remind the participant about the number of points they could gain or lose, the scoring system for the current sub-session was displayed on the left corner of the whiteboard throughout the whole experiment. In the right corner of the whiteboard, the updated total score was displayed. If the participant decided to check the model’s decision, the respective model’s prediction platform was highlighted in blue. The current participant’s selection was indicated by highlighting the respective platform in green. To confirm the final decision, the participant scrolled the joystick on the controller and pressed the trigger once the intended platform was selected. Thereafter, the feedback with the updated scores was instantaneously displayed. The trial score was colored in green or red depending on whether the decision was correct or incorrect, respectively.
2.3. Error Implementation: Scenarios of High and Low Accuracy
To implement an AI error, two scenarios were designed where the accuracy of the simulated AI model differed. Varying the texture pattern, two sets of objects were generated: the first type of objects were set to be correctly predicted by the simulated AI with an accuracy of 97.5%, whereas the second subset of objects was adjusted to be successfully predicted with an accuracy of only 60%. We refer to the former as scenarios of high accuracy, while the latter is regarded as scenarios of low accuracy. The details on the object design can be found in Section 2.7.
To ensure that the participants generally considered the model’s decision and to prevent participants checking every model’s prediction due to an excessive number of errors, the proportion of the trials where the target object was drawn from the set with low accuracy was adjusted to 20% of all trials. The remaining 80% were trials with the target object belonging to the high-accuracy scenarios. Considering the selected accuracy levels, 60% and 97.5%, respectively, and the corresponding proportion of trials, the total accuracy of the model was 90%.
2.4. Experimental Conditions
Two experimental conditions were implemented to target the impact of the error conveyed on the User–AI collaboration. In the first condition, before the experiment, the participants were informed only of the total accuracy of the AI model. In the second condition, the participants were additionally communicated about the low success rate of the model’s predictions when the target object belonged to the scenarios of low accuracy. We refer to these conditions as “not revealed” and “revealed”, respectively. From a procedure perspective, both conditions were identical. The only difference was ensuring the participants were explicitly aware of the existence of two types of objects and communicating that one specific type is the potential object category that is more likely to be incorrectly predicted by the AI system.
2.5. Score and Risk Implementation
Two different risks were implemented to address the issue that the desire to check the model’s decision can also be affected by the amount of risk that the participant experiences if the model fails to correctly predict the user’s intention. The risk level was modulated using two different numbers of penalty points in the case of an incorrect final decision. Specifically, the participant lost 2 points at the low risk and 10 points at the high risk. The rest of the implemented score gains and losses were maintained unchanged for all experimental sessions. In particular, the participant gained 5 points in the case of the correct final decision. Moreover, each time the participant checked the model’s decision, 2 points were subtracted from the score.
2.6. Study Design
In the present study, we used a within-subjects design where every participant performed all experimental sessions. For each participant, the experiment was executed on two different days, separated by a maximum of one week, where one of the conditions, “not revealed” and “revealed”, was performed on each day. Due to potentially bias-prone experimental conditions, on the first day, the participant always performed the “not revealed”, and, on the second day, the “revealed” condition. Furthermore, each condition was split into two sub-sessions defined by the level of risk. The chronological order of the set risk levels was randomized among the participants as well as for each participant between sessions. Approximately half of the participants started from the low risk on the first day and from the high risk on the second day, whereas the other half followed the opposite order. Each sub-session consisted of 100 trials resulting in a total of 400 trials for each participant in the experiment over two days. Depending on the individual performance of every participant, each sub-session lasted 15–20 min. Between the two sub-sessions, the participant had a short 3–5 min pause where they could remove the headset and rest.
Before starting the main experiment, each participant performed a short training session of 3–5 trials to familiarize themselves with the VR environment as well as learn how to interact within the experiment using the controller and their gaze.
2.7. Stimuli
We chose a neutral abstract design for the objects to prevent meaning-related biases as well as keep the stimuli of the same geometrical simple shape. The idea was to have two well-distinguishable object categories while avoiding explicit characteristics supposing worse accuracy detection such as shape or size variability. The objects were represented by cubes of size 0.15 Unity meters. The cubes differed by two parameters, the texture pattern and the color. The former was the informative parameter indicating the objects drawn from the set of various accuracy of the AI prediction. The latter was uninformative and was utilized to diversify the objects. The texture patterns were generated by randomly positioning multiple circles on a square using the CircleCollections class from Matplotlib library. The textures with smaller circles represented the objects of high accuracy, whereas the patterns with larger circles constituted the objects of low accuracy. The relative size of the smaller and larger circles was arbitrarily set to 1:333. Consequently, the relative number of circles on the square was set to 333:1. The color spectrum of the circles was uniformly distributed over a selected color map. Six different color maps from Matplotlib were used to generate the textures including “cool”, “Greys”, “Greens”, “Blues”, “Reds”, and “Purples”. In Figure 2, all the generated texture patterns are demonstrated.
2.8. Participants
We tested 15 naive participants (13 female and 2 male) with normal or corrected to normal vision. The participants were aged between 20 and 31 years old. No formal power analysis for the sample size calculation was performed. All the procedures conformed to Standard 8 of the American Psychological Association’s “Ethical Principles of Psychologists and Code of Conduct (2010)”. Signed informed consent was obtained from each participant before the measurements. All the data were stored and analyzed in full compliance with the principles of the Data Protection Act GDPR 2016/679 of the European Union.
2.9. Experimental Setup
2.9.1. Hardware Specifications
The visual content was displayed to the participants using an HTC Vive Pro Eye (HTC Corporation, Taoyuan, Taiwan) virtual reality headset running on a Windows 10 PC with a NVIDIA GeForce GTX 1070 graphics card (NVIDIA Corporation, Santa Clara, CA, USA). The field of view of the headset and the refresh rate reported by the manufacturer are 110 and 90 Hz, respectively. The participants operated within the environment via the Valve Index controller held in the right hand. The headset’s and controller’s positions and rotations were tracked via four HTC base stations 2.0. To facilitate the interaction with the VR environment, their gaze was used for the selection of the respective option, to continue or to check the model’s decision. Once the intended button was gazed on, the participant confirmed their choice by pressing the trigger on the controller. In the case of checking the model’s decision, the participant could scroll through the objects using the joystick on the controller and select the intended object by pressing the trigger. The eye-tracking data were collected using the built-in eye tracker at a frequency of 90 Hz. During the experiment, the participant was in a sitting position and could freely rotate their head within the working space. The experimental setup is schematically shown in Figure 3.
2.9.2. Software Specifications
The experimental paradigm was generated using the Unity Game engine [64], Unity version 2019.4.0.f1. The eye movement data were recorded using Unity package SRanipal version 1.3.3.0 at a sampling rate of 90 Hz. The data analysis was performed using Python 3.6 packages NumPy [65] version 1.19.1, SciPy [66] version 1.5.2, and Pandas [67] version 1.1.3. The statistical analysis was conducted using R version 3.6.1. The data visualization was performed using Python packages Matplotlib [68] version 3.3.1 and Seaborn [69] version 0.11.0.
2.10. Analysis and Expected Behavior
2.10.1. Behavioral Metrics
To address the efficiency of the User–AI collaboration, we used several behavioral markers. We evaluated the number of times the participant checked the model’s prediction during each session and the duration of the decision-making phase. Furthermore, the total score over each experimental session was examined. We were primarily interested in the effect of the experimental condition as well as evaluating the risk influence. For all statistical ANOVA tests, the data were checked for normality.
Number of Checks
We evaluated the difference between the total number of checks in the “revealed” and “not revealed” conditions at each risk level using a two-way repeated measures ANOVA with the condition and risk as independent variables. To further understand the participants’ strategy, we inspected the difference in the number of checks between the objects corresponding to the low-accuracy scenarios and high-accuracy objects. Specifically, the effect of the condition and risk on the difference between the number of checks for low- and high-accuracy objects was evaluated using two-way repeated-measures ANOVA. Finally, a post hoc Tukey test was conducted.
Although the total number of checks can provide a general idea of how often participants were willing to intervene in the model’s prediction vs. delegating the decision to the AI, we primarily focused on the distribution between the number of checks for the high- and low-accuracy objects in “not revealed” vs. “revealed” conditions. The main hypothesis was that, if the communication of the erroneous scenarios to the participants positively affects the efficiency of User–AI collaboration in the “revealed” condition, there would be a significant shift in the number of checks toward the objects with low accuracy relative to the objects with high accuracy. It would indicate that the participants adjusted their strategy when collaborating with AI leading to more efficient performance. Alternatively, the distribution of the number of checks could stay similar among the conditions demonstrating no significant effect of the error communication. Furthermore, we expected a generally larger number of checks in the case of higher risk due to aversion to the risk of losing a lot of points.
Total Score
We inspected the total score in points for each experimental session. Generally, the scoring system was designed to regard (1) the effort of the user when collaborating with AI, (2) the undesired outcome in case of the system’s failure to predict the user’s intention, and (3) the benefits in the case of accurate intention prediction by the AI. Thus, the total score in the present study serves as an implicit indicator of the efficiency of the User–AI collaboration. We, therefore, examined the effect of the condition, “revealed” vs. “not revealed”, and the risk on the total score using two-way repeated-measures ANOVA. Finally, a post hoc Tukey test was conducted.
If causing participants to be aware of the low-accuracy objects positively influences the efficiency of the collaboration between the user and AI, we expected the total score to increase in the “revealed” condition. Alternatively, the score would stay unchanged, indicating no effect of the revealing of the erroneous scenarios. Moreover, we expected the score to be generally lower for the higher risk due to the study design, where the steps for the score increment are much larger for the higher risk.
Decision Time
As an additional metric of the User–AI collaboration efficiency, we examined the time that participants needed to decide whether to continue to the next trial or to check the model’s prediction. We evaluated the decision time using two-way ANOVA with the condition and risk as independent variables. Thereafter, a post hoc Tukey test was conducted.
A more efficient User–AI collaboration would manifest in the reduction in time that participants needed to make a decision. Thus, we expected a lower decision time in the “revealed” condition compared to the “not revealed”. Otherwise, no effect of the condition on decision time could be expected. Furthermore, we expected longer decision times for the high risk due to higher stakes in the case of failure.
2.10.2. Self-Reported Trust
We evaluated the self-reported trust of the participants to validate the experimental paradigm. We expected a relatively high rating, indicating that the participants trusted that there is an actual AI model and that the paradigm successfully engaged the User–AI collaboration.
3. Results
3.1. Self-Reported Trust
The self-reported trust remained stably high across conditions and risk levels and was rated at on average among 15 participants. This result indicates that the implemented experimental paradigm successfully captured the collaboration between the user and AI. We further elaborate on the self-reported trust in Section 4.4.
3.2. Behavioral Metrics
3.2.1. Number of Checks
In Figure 4A, the total number of checks is shown across the conditions and at different risk levels. No significant effects of the condition () and the risk () were found. This indicates that the participants did not check the model’s decision more often, even when the low-accuracy objects were communicated to them, nor when the risk varied. Figure 4B demonstrates the difference in the number of checks between the trials with low-accuracy target objects and high-accuracy trials. The respective ANOVA results are summarized in Table 1. There was a significant effect of the condition (), indicating a clear shift of the interventions in the “revealed” condition toward the objects that were communicated to be predicted by the model with low accuracy. A post hoc Tukey test showed a significant difference between the checks for both low risk () and high risk (). Note that the total number of trials where the target object was drawn from the set of low accuracy scenarios was significantly less than that of high accuracy as discussed in Section 2.3. Nonetheless, the total number of checks for the low-accuracy objects is clearly larger in the “revealed” condition. There was no significant effect of the risk () nor the interaction between the condition and risk ().
3.2.2. Total Score
Figure 5 demonstrates the total score across the conditions and risk levels. The respective ANOVA results are summarized in Table 2. There was a significant effect of the condition () and risk (), as well as the risk–condition interaction (). The post hoc Tukey test showed significant differences between all the groups.
3.2.3. Decision Time
In Figure 6, the duration of the decision phase is shown across conditions and risk levels. The presented data were first cured from outliers using the interquartile range approach. The main origin of the outliers was sporadic Unity freezing, where the recorded decision time was abnormally long. This occurred a maximum of once per experimental session. Note that, in contrast to other behavioral metrics where there is one data point for each participant per experimental session, there are multiple points for the decision time for each participant as each individual trial is considered. The cured data were normalized using a logarithmic function. The respective ANOVA results are summarized in Table 3. There was a significant effect of condition () and risk (). A post hoc Tukey test showed a significant difference between the decision time across “not revealed” and “revealed” conditions for both low risk () and high risk (). Furthermore, there was a significant difference between the decision time in the “not revealed” condition across risk levels (). The respective difference for the “revealed” condition was not significant.
4. Discussion
4.1. Summary of Results
In this study, we investigated whether disclosing to the user the potential AI system’s error before the system’s deployment affects the efficiency of the User–AI collaboration in a VR setup. In summary, we found the following results:
- We found no influence of conveying the potential AI error to the user on the total number of checks. Furthermore, there was no significant risk effect.
- Crucially, after the low-accuracy scenarios were revealed to the participants, the distribution of the checks between the high- and low-accuracy significantly changed for both risk levels. Specifically, the participants more frequently checked the cases when the potential AI error was more probable. The finding becomes more prominent when considering the ratio of the high- and low-accuracy trials number: even though, in the majority of trials, the target object represented the high-accuracy cases (80% of trials, see Section 2) and the remaining minority (20% of trials) were the objects detected at low-accuracy, the absolute number of the model’s decision checks was still significantly larger for the low-accuracy trials. Regarding the risk influence, no significant effect was found on the distribution of the checks between the high- and low-accuracy.
- The participants spent less time on decision making on whether to check the model’s prediction or not once the low-accuracy scenarios were disclosed to them for both risk levels. When the potential erroneous scenarios were not revealed, the participants needed more time to decide whether to accept the model’s decision without checking it. However, once the low-accuracy objects were revealed, the decision time decreased and no longer depended on the risk level.
- We found a significant effect of conveying the potential error on the total score, which significantly increased once the low-accuracy scenarios were disclosed to the participants for both risk levels. Furthermore, a significant influence of the risk factor on the total score was found. Namely, the difference in score between the “revealed” and “not revealed” conditions were found larger for the higher risk.
4.2. Explanations of Findings
There are several factors that may help to explain the results of this experiment.
In the context of XAI, prior work emphasizes not only that users should be able to build trust toward AI but also should be capable of detecting potentially malfunctioning AI. Building on this recommendation, we see that, by highlighting the AI’s performance, users may have become aware of an AI with low predictive power and therefore adapted their strategy. Through transparent potential error communication, the users were able to anticipate when it was worth following an AI recommendation or actively engage in the decision process based on their experienced trust or distrust. Furthermore, our results also highlight that error communication did not affect the overall self-reported trust in the system.
An additional factor for these findings may be the perception of risk: on one side, we see no effect of risk on the number of checks but, on the other side, we see a significant influence of risk perception on the decision time. An explanation for these results may lie in the perceived level of risk to which the users were exposed. Due to the limited capabilities of a controlled lab environment, we were not able to increase the severity of risk that may have caused the users to perceive not being in a risky situation.
The findings on the decision time suggest that conveying the potential AI error to the user helps the user make a faster decision on whether to actively check the model’s prediction before accepting it or fully delegating it to the AI regardless of the risk level. These results are in line with prior work [70] showing that users required longer to make a decision whenever they felt insecure about the decision. By providing information about the AI’s shortcomings, the users anticipated potential risks more easily and were therefore able to make faster decisions [71]. As prior research shows, a higher risk may increase the time required to make a decision [72], which we also observed in the “not revealed” condition. However, our results show that, once the AI’s performance information was revealed, there was no significant difference in the decision time across risk levels.
The findings about the total score may reflect the participant’s performance improvement when communicating the potential AI error. We consider the total score increase as a product of a more efficient participant’s strategy of collaborating with the AI. Note that the risk effect becomes apparent as the score increment and decrement are larger at high risk. Thus, given that the total number of checks of the model’s decision did not vary between two conditions and across two risks, the total score difference was substantially bigger at a high risk.
4.3. Implications for Design
Our results provide several implications to the AI developers striving to be more mindful of the users’ resources.
First, our data highlight the need for developers to be transparent about the potential for low-accuracy scenarios. In the context of assistive technology, if the system consistently performs insufficiently, be it operating in low-light or cluttered environments or detecting objects with specific textures at low accuracy, along with trying to improve that, it is crucial to ensure the user is aware of these drawbacks.
Second, even with the low accuracy of the AI, users did not lose their trust in the system. This suggests that presenting the potential error does not necessarily induce algorithm aversion [47]. Therefore, the results of our work recommend that designers may prioritize a clear communication of potential errors and capabilities of the AI to reduce the risk of potential loss in performance.
Third, designers should be aware of the fact that the user’s performance may be influenced by the system but not be a direct measurement of it. This work emphasizes that researchers and designers must consider the underlying source of data for their measurement in order to interpret the gained information correctly. For example, as long as the decision time remains at the same level as in other situations, the user’s intervention should not necessarily be considered a prerequisite to adjusting the AI system.
4.4. Limitations and Future Work
In the present work, we intended to carefully address the effect the potential error conveyed on the user’s behavior. Nonetheless, it is important to comment on the existing limitations and potential future research directions.
First, while the main focus of this study was the effect of disclosing the potential error on user collaboration with AI, we also expected some differences in the performance across various risk levels. It is not a trivial task to ensure that the participants perceive actual risk in the experimental setup as it is still remote from a real-life situation. In the present work, the scoring system appeared to be a reasonable approach to inducing the risk of failure. Even though no differences were found in the number of checks across various risks, the data showed a significant risk effect on the decision time and the total score. We suggest that a finer scoring arrangement could be more sensitive to the risk effect in other constructs, such as the number of checks. Future studies should systematically investigate this.
Second, in the current study, the AI algorithm was only simulated. This approach ensured the stable accuracy levels of the AI system attributing to the high- and low-accuracy scenarios. However, there is the risk that the participants do not believe that there is an AI algorithm. Given the high stated accuracy of the AI system, 90%, the substantial self-reported trust ratings indicated that the participants indeed perceived there was an actual AI algorithm in the experiment. While the trust questionnaire sufficiently served our purpose in this study, future researchers should focus on the role of trust and investigate how disclosing the potential system error affects the trust of the user in AI.
Third, the present study is intended to provide implications primarily for the assistive technology application. However, the experiment was performed by young healthy participants and not patients. The VR paradigm enabled the realistic simulation of a grasping task in the context of assistive technology as well as a high level of realism and a stronger immersion of the participants into the experiment. Nonetheless, future studies should closely examine to what extent the findings of the present study can be transferred to real patients.
Fourth, the number of participants in the present study (n = 15) is not extensive. We argue that the experiment was intended to reproduce a more realistic scenario of a grasping task in the context of assistive technologies. Thus, as previously discussed, VR technology was selected for the paradigm implementation. Collecting the data from the participants using VR is typically resource-consuming and, therefore, challenging for the set size. The results of the present study serve as an initial step in evaluating the influence of disclosing the AI potential error to the user prior to the system deployment on the efficiency of User–AI collaboration while enabling a more realistic implementation. Future studies should extend the number of the participants to strengthen and expand the findings of the present work.
Finally, it is important to mention individual variability. In our experiment, some users were generally more eager to delegate their final decision to the AI than others due to personal preferences. It manifests in the number of checks being nearly zero for some participants while reaching several dozens for others. This, on one hand, creates a challenge for the researchers striving to draw generalizing conclusions. On the other hand, it opens up new opportunities to better understand users’ needs and contribute to developing more efficient human-centric AI systems tailored to the user. Beyond the scope of the present work, it is compelling to deliberately study the individual variability in the error conveying effect on the user’s behavior.
Additionally, future research may look into whether it would be beneficial to actively offer the user an opportunity to check the AI’s prediction constantly or only when necessary, such as in low-accuracy scenarios and high-risk situations. Furthermore, future researchers may investigate various design aspects of error communication in order to find the most efficient way to communicate the AI’s performance.
5. Conclusions
In the last few decades, artificial intelligence has rapidly entered into various aspects of assistive technology and User–AI collaboration has become an increasingly common paradigm in this context. However, the designers of AI-based assistive technology have inconclusive design recommendations, where HCI researchers suggest communicating the AI’s error while AI researchers emphasize that communicating potential errors may cause algorithm aversion. To address this gap, we conducted a VR study in which the participants either intervene or delegate the decision to the AI. We compared the participants’ behavior with and without disclosure of the AI’s low accuracy in different scenarios while also varying risk.
Our results show that communicating the potential AI error was beneficial to the user’s performance and led to a more efficient collaboration between the user and AI. Through our work, we want to help the designers of assistive technology to better understand how to communicate potential errors to their users and create even more effective assistive technology.
Author Contributions
Conceptualization, O.L.-S., M.D. and S.W.; methodology, O.L.-S., M.D. and S.W.; software, O.L.-S. and M.D.; validation, O.L.-S., M.D. and S.W.; formal analysis, O.L.-S. and M.D.; investigation, O.L.-S., M.D. and S.W.; resources, S.W.; data curation, O.L.-S.; writing—original draft preparation, O.L.-S. and M.D.; writing—review and editing, S.W.; visualization, O.L.-S.; supervision, S.W.; project administration, S.W.; funding acquisition, S.W. All authors have read and agreed to the published version of the manuscript.
Funding
This research was funded by European Union’s Horizon 2020 research and innovation program under grant agreement No. 951910.
Institutional Review Board Statement
The study was approved by the ethics committee of the Faculty of Medicine at the University of Tübingen with a corresponding ethical approval identification code 986/2020BO2.
Informed Consent Statement
Informed consent was obtained from all subjects involved in the study.
Data Availability Statement
The complete recorded data set for this study can be found in the OSF repository https://osf.io/eja7g/ (accessed on 10 January 2023).
Conflicts of Interest
We declare that Olga Lukashova-Sanz, Martin Dechant, and Siegfried Wahl are scientists at the University of Tübingen and employees of Carl Zeiss Vision International GmbH, as detailed in the affiliations. The authors declare that the research was conducted in the absence of any commercial or financial relationships that could be construed as a potential conflict of interest.
Abbreviations
The following abbreviations are used in this manuscript:
| VR | Virtual reality |
| AR | Augmented reality |
| AI | Artificial intelligence |
| XAI | Explainable artificial intelligence |
References
- Tucci, V.; Saary, J.; Doyle, T.E. Factors influencing trust in medical artificial intelligence for healthcare professionals: A narrative review. JMAI 2022, 5, 1–13. [Google Scholar] [CrossRef]
- Braganza, A.; Chen, W.; Canhoto, A.; Sap, S. Productive employment and decent work: The impact of AI adoption on psychological contracts, job engagement and employee trust. J. Bus. Res. 2021, 131, 485–494. [Google Scholar] [CrossRef] [PubMed]
- Zhai, X.; Chu, X.; Chai, C.S.; Jong, M.S.Y.; Istenic, A.; Spector, M.; Liu, J.B.; Yuan, J.; Li, Y. A Review of Artificial Intelligence (AI) in Education from 2010 to 2020. Complexity 2021, 2021, 8812542. [Google Scholar] [CrossRef]
- Bruun, E.P.; Duka, A. Artificial Intelligence, Jobs and the Future of Work: Racing with the Machines. Basic Income Stud. 2018, 13, 20180018. [Google Scholar] [CrossRef]
- Lillywhite, A.; Wolbring, G. Coverage of ethics within the artificial intelligence and machine learning academic literature: The case of disabled people. Assist. Technol. 2019, 33, 129–135. [Google Scholar] [CrossRef]
- Montanha, A.; Oprescu, A.M.; Romero-Ternero, M. A Context-Aware Artificial Intelligence-based System to Support Street Crossings For Pedestrians with Visual Impairments. Appl. Artif. Intell. 2022, 36, 2062818. [Google Scholar] [CrossRef]
- Tyagi, N.; Sharma, D.; Singh, J.; Sharma, B.; Narang, S. Assistive Navigation System for Visually Impaired and Blind People: A Review. In Proceedings of the 2021 1st IEEE International Conference on Artificial Intelligence and Machine Vision, AIMV 2021; Institute of Electrical and Electronics Engineers Inc.: Gandhinagar, India, 2021; pp. 1–5. [Google Scholar] [CrossRef]
- Ito, S.; Ito, S.; Suteu, I. AI mobility solutions for an active ageing society. Introducing aesthetic affordances in the design of smart wheelchairs. In Lecture Notes in Computer Science (Including Subseries Lecture Notes in Artificial Intelligence and Lecture Notes in Bioinformatics); Springer International Publishing: Copenhagen, Denmark, 2020; Volume 12217 LNCS, pp. 339–352. [Google Scholar] [CrossRef]
- Abdi, S.; Kitsara, I.; Hawley, M.S.; de Witte, L.P. Emerging technologies and their potential for generating new assistive technologies. Assist. Technol. 2021, 33, 17–26. [Google Scholar] [CrossRef]
- Dada, S.; van der Walt, C.; May, A.A.; Murray, J. Intelligent assistive technology devices for persons with dementia: A scoping review. Assist. Technol. 2022, 25, 1–14. [Google Scholar] [CrossRef]
- Beudt, S.; Blanc, B.; Feichtenbeiner, R.; Kähler, M. Critical reflection of AI applications for persons with disabilities in vocational rehabilitation. In Proceedings of the DELFI Workshops 2020, Online, 14–15 September 2020; Gesellschaft für Informatik e.V.z: Bonn, Germany, 2020; p. 137. [Google Scholar] [CrossRef]
- Lorenzo Villalobos, A.E.; Giusiano, S.; Musso, L.; De’Sperati, C.; Riberi, A.; Spalek, P.; Calvo, A.; Moglia, C.; Roatta, S. When assistive eye tracking fails: Communicating with a brainstem-stroke patient through the pupillary accommodative response–A case study. Biomed. Signal Process. Control 2021, 67, 102515. [Google Scholar] [CrossRef]
- Gong, B.; Nugent, J.P.; Guest, W.; Parker, W.; Chang, P.J.; Khosa, F.; Nicolaou, S. Influence of Artificial Intelligence on Canadian Medical Students’ Preference for Radiology Specialty: A National Survey Study. Acad. Radiol. 2019, 26, 566–577. [Google Scholar] [CrossRef]
- Liew, C. The future of radiology augmented with Artificial Intelligence: A strategy for success. Eur. J. Radiol. 2018, 102, 152–156. [Google Scholar] [CrossRef]
- He, J.; Baxter, S.L.; Xu, J.; Xu, J.; Zhou, X.; Zhang, K. The practical implementation of artificial intelligence technologies in medicine. Nat. Med. 2019, 25, 30–36. [Google Scholar] [CrossRef]
- Karches, K.E. Against the iDoctor: Why artificial intelligence should not replace physician judgment. Theor. Med. Bioeth. 2018, 39, 91–110. [Google Scholar] [CrossRef]
- Xiang, Y.; Zhao, L.; Liu, Z.; Wu, X.; Chen, J.; Long, E.; Lin, D.; Zhu, Y.; Chen, C.; Lin, Z.; et al. Implementation of artificial intelligence in medicine: Status analysis and development suggestions. Artif. Intell. Med. 2020, 102, 101780. [Google Scholar] [CrossRef]
- Dietvorst, B.J.; Simmons, J.P.; Massey, C. Algorithm aversion: People erroneously avoid algorithms after seeing them err. J. Exp. Psychol. Gen. 2015, 144, 114–126. [Google Scholar] [CrossRef] [Green Version]
- Guidotti, R.; Monreale, A.; Ruggieri, S.; Turini, F.; Giannotti, F.; Pedreschi, D. A Survey of Methods for Explaining Black Box Models. ACM Comput. Surv. (CSUR) 2018, 51, 93. [Google Scholar] [CrossRef] [Green Version]
- Othman, K. Public acceptance and perception of autonomous vehicles: A comprehensive review. AI Ethics 2021, 1, 355–387. [Google Scholar] [CrossRef]
- Baisch, S.; Kolling, T.; Schall, A.; Rühl, S.; Selic, S.; Kim, Z.; Rossberg, H.; Klein, B.; Pantel, J.; Oswald, F.; et al. Acceptance of Social Robots by Elder People: Does Psychosocial Functioning Matter? Int. J. Soc. Robot. 2017, 9, 293–307. [Google Scholar] [CrossRef]
- Ran, M.; Banes, D.; Scherer, M.J. Basic principles for the development of an AI-based tool for assistive technology decision making. Disabil. Rehabil. Assist. Technol. 2020, 17, 778–781. [Google Scholar] [CrossRef]
- Linardatos, P.; Papastefanopoulos, V.; Kotsiantis, S. Explainable ai: A review of machine learning interpretability methods. Entropy 2021, 23, 18. [Google Scholar] [CrossRef]
- Islam, M.R.; Ahmed, M.U.; Barua, S.; Begum, S. A Systematic Review of Explainable Artificial Intelligence in Terms of Different Application Domains and Tasks. Appl. Sci. 2022, 12, 1353. [Google Scholar] [CrossRef]
- Jacovi, A.; Marasović, A.; Miller, T.; Goldberg, Y. Formalizing trust in artificial intelligence: Prerequisites, causes and goals of human trust in AI. In Proceedings of the 2021 ACM Conference on Fairness, Accountability, and Transparency, Online, 3–10 March 2021; pp. 624–635. [Google Scholar] [CrossRef]
- Gisladottir, U.; Nakikj, D.; Jhunjhunwala, R.; Panton, J.; Brat, G.; Gehlenborg, N. Effective Communication of Personalized Risks and Patient Preferences During Surgical Informed Consent Using Data Visualization: Qualitative Semistructured Interview Study With Patients After Surgery. JMIR Hum. Factors 2022, 9, e29118. [Google Scholar] [CrossRef] [PubMed]
- Renn, O. Risk perception and risk management: A review. In Risk Perception, 1st ed.; Pt. 1; OPUS-Publication Server of the University of Stuttgart: Stuttgart, Germany, 1990; Volume 7, pp. 1–9. [Google Scholar] [CrossRef]
- Morgan, M.G.; Fischhoff, B.; Bostrom, A.; Cynthia, J.A. Risk Communication: A Mental Models Approach; Cambridge University Press: Cambridge, UK, 2001. [Google Scholar]
- Sunarti, S.; Fadzlul Rahman, F.; Naufal, M.; Risky, M.; Febriyanto, K.; Masnina, R. Artificial intelligence in healthcare: Opportunities and risk for future. Gac. Sanit. 2021, 35, S67–S70. [Google Scholar] [CrossRef]
- Yin, M.; Vaughan, J.W.; Wallach, H. Understanding the effect of accuracy on trust in machine learning models. In Proceedings of the Conference on Human Factors in Computing Systems—Proceedings; Association for Computing Machinery: New York, NY, USA, 2019; pp. 1–12. [Google Scholar] [CrossRef]
- Zhang, Y.; Vera Liao, Q.; Bellamy, R.K. Efect of confidence and explanation on accuracy and trust calibration in AI-assisted decision making. In Proceedings of the FAT* 2020—Proceedings of the 2020 Conference on Fairness, Accountability, and Transparency; Association for Computing Machinery: New York, NY, USA, 2020; pp. 295–305. [Google Scholar] [CrossRef] [Green Version]
- Georgiou, Y.; Kyza, E.A. The development and validation of the ARI questionnaire: An instrument for measuring immersion in location-based augmented reality settings. Int. J. Hum.-Comput. Stud. 2017, 98, 24–37. [Google Scholar] [CrossRef]
- Walle, H.; De Runz, C.; Serres, B.; Venturini, G. A Survey on Recent Advances in AI and Vision-Based Methods for Helping and Guiding Visually Impaired People. Appl. Sci. 2022, 12, 2308. [Google Scholar] [CrossRef]
- Gozzi, N.; Malandri, L.; Mercorio, F.; Pedrocchi, A. XAI for myo-controlled prosthesis: Explaining EMG data for hand gesture classification. Knowl.-Based Syst. 2022, 240, 108053. [Google Scholar] [CrossRef]
- Yadav, K.; Hasija, Y. Artificial Intelligence and Technological Development in Behavioral and Mental Healthcare. In Proceedings of the 2022 International Conference for Advancement in Technology (ICONAT); Institute of Electrical and Electronics Engineers Inc.: Goa, India, 2022; pp. 1–6. [Google Scholar] [CrossRef]
- Zhao, Z.; Wu, J.; Li, T.; Sun, C.; Yan, R.; Chen, X. Challenges and Opportunities of AI-Enabled Monitoring, Diagnosis & Prognosis: A Review. Chin. J. Mech. Eng. 2021, 34, 1–29. [Google Scholar] [CrossRef]
- Alberich-Bayarri, A.; Neri, E.; Martí-Bonmatí, L. Imaging biomarkers and imaging biobanks. In Artificial Intelligence in Medical Imaging: Opportunities, Applications and Risks; Springer International Publishing: Cham, Switzerland, 2019; pp. 119–126. [Google Scholar] [CrossRef]
- Martinez-Martin, E.; Costa, A. Assistive Technology for Elderly Care: An Overview. IEEE Access 2021, 9, 92420–92430. [Google Scholar] [CrossRef]
- Leonelli, S. Data—From objects to assets. Nature 2019, 574, 317–320. [Google Scholar] [CrossRef] [Green Version]
- Brault, N.; Saxena, M. For a critical appraisal of artificial intelligence in healthcare: The problem of bias in mHealth. J. Eval. Clin. Pract. 2021, 27, 513–519. [Google Scholar] [CrossRef]
- Kaur, D.; Uslu, S.; Durresi, A. Requirements for Trustworthy Artificial Intelligence—A Review. Adv. Intell. Syst. Comput. 2021, 1264 AISC, 105–115. [Google Scholar] [CrossRef]
- Daneshjou, R.; Smith, M.P.; Sun, M.D.; Rotemberg, V.; Zou, J. Lack of Transparency and Potential Bias in Artificial Intelligence Data Sets and Algorithms: A Scoping Review. JAMA Dermatol. 2021, 157, 1362–1369. [Google Scholar] [CrossRef]
- Parikh, R.B.; Teeple, S.; Navathe, A.S. Addressing Bias in Artificial Intelligence in Health Care. JAMA 2019, 322, 2377–2378. [Google Scholar] [CrossRef]
- Sullivan, L.S.; Klein, E.; Brown, T.; Sample, M.; Pham, M.; Tubig, P.; Folland, R.; Truitt, A.; Goering, S. Keeping Disability in Mind: A Case Study in Implantable Brain–Computer Interface Research. Sci. Eng. Ethics 2018, 24, 479–504. [Google Scholar] [CrossRef]
- MillerTim. “However, why?” Understanding explainable artificial intelligence. XRDS Crossroads ACM Mag. Stud. 2019, 25, 20–25. [Google Scholar] [CrossRef]
- Feldman, R.C.; Aldana, E.; Stein, K. Artificial Intelligence in the Health Care Space: How We Can Trust What We Cannot Know. Stan. L. Pol’y Rev. 2019, 30, 399. [Google Scholar]
- Burton, J.W.; Stein, M.K.; Jensen, T.B. A systematic review of algorithm aversion in augmented decision making. J. Behav. Decis. Mak. 2020, 33, 220–239. [Google Scholar] [CrossRef]
- Gunning, D.; Stefik, M.; Choi, J.; Miller, T.; Stumpf, S.; Yang, G.Z. XAI—Explainable artificial intelligence. Sci. Robot. 2019, 4, 37. [Google Scholar] [CrossRef] [Green Version]
- Nielsen, J. Enhancing the Explanatory Power of Usability Heuristics. In Proceedings of the SIGCHI Conference on Human Factors in Computing Systems, Boston, MA, USA, 24–28 April 1994; pp. 152–158. [Google Scholar]
- Cho, H.; Keenan, G.; Madandola, O.O.; Dos Santos, F.C.; Macieira, T.G.; Bjarnadottir, R.I.; Priola, K.J.; Lopez, K.D. Assessing the Usability of a Clinical Decision Support System: Heuristic Evaluation. JMIR Hum. Factors 2022, 9, e31758. [Google Scholar] [CrossRef]
- Seckler, M.; Heinz, S.; Bargas-Avila, J.A.; Opwis, K.; Tuch, A.N. Designing usable web forms- Empirical evaluation of web form improvement guidelines. In Proceedings of the Conference on Human Factors in Computing Systems—Proceedings; Association for Computing Machinery: New York, NY, USA, 2014; pp. 1275–1284. [Google Scholar] [CrossRef] [Green Version]
- Peacock, C.E.; Lafreniere, B.; Zhang, T.; Santosa, S.; Benko, H.; Jonker, T.R. Gaze as an Indicator of Input Recognition Errors. Proc. ACM Hum.-Comput. Interact. 2022, 6, 18. [Google Scholar] [CrossRef]
- Soltau, H.; Waibel, A. Specialized acoustic models for hyperarticulated speech. In Proceedings of the ICASSP, IEEE International Conference on Acoustics, Speech and Signal Processing—Proceedings; Institute of Electrical and Electronics Engineers Inc.: Istanbul, Turkey, 2000; Volume 3, pp. 1779–1782. [Google Scholar] [CrossRef] [Green Version]
- Stent, A.J.; Huffman, M.K.; Brennan, S.E. Adapting speaking after evidence of misrecognition: Local and global hyperarticulation. Speech Commun. 2008, 50, 163–178. [Google Scholar] [CrossRef]
- Ceaparu, I.; Lazar, J.; Bessiere, K.; Robinson, J.; Shneiderman, B. Determining Causes and Severity of End-User Frustration. Int. J. Hum.–Comput. Interact. 2010, 17, 333–356. [Google Scholar] [CrossRef] [Green Version]
- Akgun, M.; Cagiltay, K.; Zeyrek, D. The effect of apologetic error messages and mood states on computer users’ self-appraisal of performance. J. Pragmat. 2010, 42, 2430–2448. [Google Scholar] [CrossRef]
- Leichtmann, B.; Humer, C.; Hinterreiter, A.; Streit, M.; Mara, M. Effects of Explainable Artificial Intelligence on trust and human behavior in a high-risk decision task. Comput. Hum. Behav. 2023, 139, 107539. [Google Scholar] [CrossRef]
- Bliss, J.P.; Acton, S.A. Alarm mistrust in automobiles: How collision alarm reliability affects driving. Appl. Ergon. 2003, 34, 499–509. [Google Scholar] [CrossRef]
- Araujo, T.; Helberger, N.; Kruikemeier, S.; de Vreese, C.H. In AI we trust? Perceptions about automated decision-making by artificial intelligence. AI Soc. 2020, 35, 611–623. [Google Scholar] [CrossRef]
- Kocielnik, R.; Amershi, S.; Bennett, P.N. Will You Accept an Imperfect AI? Exploring Designs for Adjusting End-user Expectations of AI Systems. In Proceedings of the 2019 CHI Conference on Human Factors in Computing Systems; ACM: Glasgow, UK, 2019; pp. 1–14. [Google Scholar] [CrossRef]
- Barredo Arrieta, A.; Díaz-Rodríguez, N.; Del Ser, J.; Bennetot, A.; Tabik, S.; Barbado, A.; Garcia, S.; Gil-Lopez, S.; Molina, D.; Benjamins, R.; et al. Explainable Artificial Intelligence (XAI): Concepts, taxonomies, opportunities and challenges toward responsible AI. Inf. Fusion 2020, 58, 82–115. [Google Scholar] [CrossRef] [Green Version]
- Dorsten, A.M.; Sifford, S.K.; Bharucha, A.; Mecca, L.P.; Wactlar, H. Ethical perspectives on emerging assistive technologies: Insights from focus groups with stakeholders in long-term care facilities. J. Empir. Res. Hum. Res. Ethics 2009, 4, 25–36. [Google Scholar] [CrossRef]
- Rasouli, O.; Kvam, L.; Husby, V.S.; Røstad, M.; Witsø, A.E. Understanding the possibilities and limitations of assistive technology in health and welfare services for people with intellectual disabilities, staff perspectives. Disabil. Rehabil. Assist. Technol. 2021, 63, 1–9. [Google Scholar] [CrossRef]
- Unity Technologies. Unity; Unity Technologies: San Francisco, CA, USA, 2019. [Google Scholar]
- Van Der Walt, S.; Colbert, S.C.; Varoquaux, G. The NumPy array: A structure for efficient numerical computation. Comput. Sci. Eng. 2011, 13, 22–30. [Google Scholar] [CrossRef] [Green Version]
- Virtanen, P.; Gommers, R.; Oliphant, T.E.; Haberland, M.; Reddy, T.; Cournapeau, D.; Burovski, E.; Peterson, P.; Weckesser, W.; Bright, J.; et al. SciPy 1.0: Fundamental algorithms for scientific computing in Python. Nat. Methods 2020, 17, 261–272. [Google Scholar] [CrossRef] [Green Version]
- Mckinney, W. Data Structures for Statistical Computing in Python. In Proceedings of the 9th Python in Science Conference (SCIPY 2010), Austin, TX, USA, 28 June–3 July 2010; Volume 445, pp. 56–61. [Google Scholar]
- Hunter, J.D. Matplotlib: A 2D graphics environment. Comput. Sci. Eng. 2007, 9, 99–104. [Google Scholar] [CrossRef]
- Waskom, M.Q.; Botvinnik, O.; O’Kane, D.; Hobson, P.; Lukauskas, S.; Gemperline, D.C.; Augspurger, T.; Halchenko, Y.; Cole, J.B.; Warmenhoven, J.; et al. seaborn: V0.8.1 (September 2017); Zenodo: Genève, Switzerland, 2017. [Google Scholar] [CrossRef]
- Luster, M.S.; Pitts, B.J. Trust in Automation: The Effects of System Certainty on Decision-Making. Proc. Hum. Factors Ergon. Soc. Annu. Meet. 2021, 65, 32–36. [Google Scholar] [CrossRef]
- Loft, S.; Bhaskara, A.; Lock, B.A.; Skinner, M.; Brooks, J.; Li, R.; Bell, J. The Impact of Transparency and Decision Risk on Human–Automation Teaming Outcomes. Hum. Factors 2021, 1–16. [Google Scholar] [CrossRef]
- Wilcox, N.T. Lottery Choice: Incentives, Complexity and Decision Time. Econ. J. 1993, 103, 1397–1417. [Google Scholar] [CrossRef]
Figure 2.
The generated texture pattern for the cube objects. The upper row corresponds to the objects designed for the scenarios of low accuracy, whereas the lower row regards the scenarios of high accuracy. The color was an uninformative feature for the task and was used to diversify the objects.
Figure 2.
The generated texture pattern for the cube objects. The upper row corresponds to the objects designed for the scenarios of low accuracy, whereas the lower row regards the scenarios of high accuracy. The color was an uninformative feature for the task and was used to diversify the objects.

Figure 3.
Schematic representation of the experimental setup. To strengthen the immersion, a virtual chair was placed in the VR environment at the same position where the actual chair was located in the real world.
Figure 3.
Schematic representation of the experimental setup. To strengthen the immersion, a virtual chair was placed in the VR environment at the same position where the actual chair was located in the real world.

Figure 4.
The number of trials where participants chose to check the model’s prediction. (A) The total number of checks; (B) the difference between the checks of the objects drawn from the low-accuracy set and the ones from the high-accuracy set. A positive value corresponds to a larger amount of checks for the objects of low accuracy. The data are visualized using bar plots and violin plots with superimposed individual data for each participant. In violin plots, the thick gray bar in the center represents the interquartile range. The thin gray line represents the rest of the distribution except the outliers. The error bars in the bar plots indicate confidence intervals of 95% computed using bootstrapping. The indicators of significant differences obtained from the ANOVA analysis are **: , ***: . Not significant differences are not indicated.

Figure 5.
The total score in the experimental sessions. The data are visualized using bar plots with superimposed individual data for each participant. The error bars indicate confidence intervals of 95% computed using bootstrapping. The indicators of significant differences obtained from the ANOVA analysis are *: , ***: .

Figure 6.
The duration of the decision-making phase where the participants had to choose either to check the model’s prediction or delegate the decision to the AI. The error bars indicate confidence intervals of 95% computed using bootstrapping. The individual data are not shown to not overload the figure. The indicators of significant differences obtained from the ANOVA analysis are *: , **: , and ***: . Not significant differences are not indicated.


Table 1.
The summary table for ANOVA results for the number of checks. DF is degrees of freedom, Sum Sq contains values for the sum of squares, Mean Sq are mean squares, and F- and p-values are respective ANOVA statistics values.
Table 1.
The summary table for ANOVA results for the number of checks. DF is degrees of freedom, Sum Sq contains values for the sum of squares, Mean Sq are mean squares, and F- and p-values are respective ANOVA statistics values.
| Factor | DF | Sum Sq | Mean Sq | F-Value | p-Value |
|---|---|---|---|---|---|
| Risk | 1 | 16.4 | 16.4 | 0.266 | 0.608 |
| Condition | 1 | 2171.3 | 2171.3 | 35.373 | |
| Risk:Condition | 1 | 31.7 | 31.7 | 0.516 | 0.476 |
| Residuals | 49 | 3007.7 | 61.4 |
Table 2.
The summary table for ANOVA results for the total score. DF is degrees of freedom, Sum Sq contains values for the sum of squares, Mean Sq are mean squares, and F- and p-values are respective ANOVA statistics values.
Table 2.
The summary table for ANOVA results for the total score. DF is degrees of freedom, Sum Sq contains values for the sum of squares, Mean Sq are mean squares, and F- and p-values are respective ANOVA statistics values.
| Factor | DF | Sum Sq | Mean Sq | F-Value | p-Value |
|---|---|---|---|---|---|
| Risk | 1 | 49,135 | 49,135 | 119.076 | |
| Condition | 1 | 14,947 | 14,947 | 36.223 | |
| Risk:Condition | 1 | 1984 | 1984 | 4.808 | 0.0325 |
| Residuals | 56 | 23,108 | 413 |
Table 3.
The summary table for ANOVA results for the decision time. DF is degrees of freedom, Sum Sq contains values for the sum of squares, Mean Sq are mean squares, and F- and p-values are respective ANOVA statistics values.
Table 3.
The summary table for ANOVA results for the decision time. DF is degrees of freedom, Sum Sq contains values for the sum of squares, Mean Sq are mean squares, and F- and p-values are respective ANOVA statistics values.
| Factor | DF | Sum Sq | Mean Sq | F-Value | p-Value |
|---|---|---|---|---|---|
| Risk | 1 | 1.6 | 1.566 | 14.092 | 0.000176 |
| Condition | 1 | 3.6 | 3.648 | 32.838 | |
| Risk:Condition | 1 | 0.3 | 0.273 | 2.459 | 0.116937 |
| Residuals | 5613 | 623.6 | 0.111 |
Disclaimer/Publisher’s Note: The statements, opinions and data contained in all publications are solely those of the individual author(s) and contributor(s) and not of MDPI and/or the editor(s). MDPI and/or the editor(s) disclaim responsibility for any injury to people or property resulting from any ideas, methods, instructions or products referred to in the content. |
© 2023 by the authors. Licensee MDPI, Basel, Switzerland. This article is an open access article distributed under the terms and conditions of the Creative Commons Attribution (CC BY) license (https://creativecommons.org/licenses/by/4.0/).
Share and Cite
MDPI and ACS Style
Lukashova-Sanz, O.; Dechant, M.; Wahl, S. The Influence of Disclosing the AI Potential Error to the User on the Efficiency of User–AI Collaboration. Appl. Sci. 2023, 13, 3572. https://doi.org/10.3390/app13063572
AMA Style
Lukashova-Sanz O, Dechant M, Wahl S. The Influence of Disclosing the AI Potential Error to the User on the Efficiency of User–AI Collaboration. Applied Sciences. 2023; 13(6):3572. https://doi.org/10.3390/app13063572
Chicago/Turabian StyleLukashova-Sanz, Olga, Martin Dechant, and Siegfried Wahl. 2023. "The Influence of Disclosing the AI Potential Error to the User on the Efficiency of User–AI Collaboration" Applied Sciences 13, no. 6: 3572. https://doi.org/10.3390/app13063572
Note that from the first issue of 2016, this journal uses article numbers instead of page numbers. See further details here.