
Deterioration Process of Cementitious Material Properties under Internal Sulphate Attack
1
College of Materials Science and Engineering, Nanjing Tech University, Nanjing 211800, China
2
State Key Laboratory of Materials-Oriented Chemical Engineering, Nanjing 211800, China
*
Author to whom correspondence should be addressed.
Appl. Sci. 2023, 13(6), 3982; https://doi.org/10.3390/app13063982
Submission received: 8 February 2023
/
Revised: 2 March 2023
/
Accepted: 17 March 2023
/
Published: 21 March 2023
(This article belongs to the Section Earth Sciences)
Abstract
:As one of the important factors affecting the structural durability of cementitious materials, sulphate erosion not only reduces the service life of the material but also poses a threat to the structural safety of the project. At present, scholars around the world have conducted extensive research on topics related to external sulphate attacks and have achieved fruitful results. However, the process and mechanism of attack degradation of the gelling material are not clear. In this paper, gypsum sand was introduced into the mortar. The effects of gypsum content, gypsum particle size and curing temperature on physical properties such as expansion and strength of specimens were investigated. X-ray diffraction (XRD), thermogravimetry (TG), differential scanning calorimetry (DSC), Scanning Electron Microscopy (SEM) and energy dispersive spectrometry (EDS) were used to analyse specimens’ phase composition and microstructure evolution at different attack ages. Finally, cementitious materials’ degradation process and mechanism under internal sulphate attack (ISA) were analysed. Through the above research, the following main conclusions are drawn: (1) The swelling rate of cement mortar specimens all increased with the increase of gypsum dosing; (2) The expansion of cement pastes and mortars does not increase with the increase in curing temperature; (3) The gypsum particle sizes are smaller, the expansion of mortar specimens is larger, and the loss of compressive and bending strength of mortar specimens is large; and (4) The main reaction product of ISA is Ettringite (AFt). The gypsum formed during the ISA process does not cause expansion, while AFt is the main reason for the destruction of the cementitious material.
1. Introduction
In recent years, the structural durability of concrete has become a hot research topic in materials science. Its importance to the social and economic benefits of our national economy and to engineering safety has received increasing attention [1,2]. Engineering safety accidents due to deterioration problems in concrete structures frequently occur [3,4,5,6], and sulphate attack is one of the important causes of structural durability problems and shortened service life of concrete materials [7]. Sulphate attack is a relatively complex physicochemical reaction process, and there are many sources of sulphate ions. In general, ions enter the cementitious material from the external environment and react with substances in the cement, such as seawater, industrial wastewater, acid rain, and sulphate ions in the soil; however, nowadays, due to the special requirements of different projects for cementitious materials as well as raw materials taken nearby, often with some chemical admixtures and misuse of gypsum-containing aggregates, sulphate ions are already present in the matrix when the concrete is mixed [8]. The ions can react directly with the hydration products of cement and damage cementitious materials. Therefore, we can classify external sulphate attack (ESA) and ISA according to how sulphate ions are sourced [9]. Tassiane A. and others have pointed out that among the deterioration processes to which concrete structures are susceptible, internal attack by sulphate (ISA) is prominent [10]. Currently, the hot direction of research on sulphate attacks has moved from external to internal [11]. ISA occurs due to the iron sulfide minerals in the aggregate, which react with oxygen, water and cement hydrates [12].
Gypsum rocks are widely distributed in China [13], so this type of rock will often be misused in engineering construction, causing safety problems and economic losses [14,15,16]. This problem has occurred in dams and tunnels in Middle Eastern countries [17] and some European countries [18]. A similar problem occurred in the Cross Pass Tunnel in Hubei, China [19,20], which started construction in October 2002 and was forced to close for remediation after an inspection found that the tunnel’s concrete had swelling, cracking and damage such as softening after commissioning in July 2004 maintenance. Xing Zhishui [21] and others studied the concrete removed through an on-site collection of remediation and found that the concrete contained gypsum dolomite aggregate; it is this aggregate that caused internal sulphate attack [22]. A large number of calcium alumina crystals were found in the transition zone of the interface between the cement paste and the aggregate; and carbon sulfur silica calcium products were also found, making the paste soften and lose its cementitious properties without strength. Sulphate attack with gypsum-containing aggregates also occurred in China’s Chengkun Railway tunnel [23,24], causing the train to stop running.
At present, the research on sulphate erosion of cementitious materials is mostly on external sulphate erosion, while the research on internal sulphate erosion is not very comprehensive. However, many cases of sulphate erosion of gypsum-containing aggregates have occurred in actual projects, yet we are not very clear about its erosion mechanism. There are few methods to evaluate the index of such internal erosion, and only a few methods to evaluate external sulphate erosion are suitable for evaluating internal sulphate erosion. Therefore, this paper investigates the effects of gypsum admixture, gypsum particle size and maintenance temperature on the performance of cementitious materials. It also investigates the types of erosion products generated and the effects on microstructure and analyses the process and mechanism of material performance deterioration under internal sulphate erosion.
2. Materials and Methods
2.1. Raw Materials
2.1.1. Cement
2.1.2. Gypsum Aggregate
2.1.3. Standard Sand
2.1.4. Tricalcium Aluminate (C3A)
Tricalcium Aluminate (C3A) was obtained by calcination of chemical reagents CaCO3 and Al(OH)3 produced by Sinopharm. The analytically pure CaCO3 and Al(OH)3 were weighed according to the molar ratio of 3:2, put into the mixing ball on the mixing machine for 24 h, and then the mixed raw materials were weighed and pressed on the tablet press. After the pressing was completed, it was placed in the drying oven at 105 °C for 4 h and then placed in the high-temperature furnace for calcination. The heating rate was 6 °C/min, and the temperature was raised to 900 °C for half an hour; the temperature then continued to increase to 1350 °C for 2 h. After the end of the heating, the sample was naturally cooled to room temperature, and the calcined sample was taken out, crushed and ground and repressed; the calcination was repeated three times until the content of free CaO was less than 0.5%. The XRD pattern of the calcined finely ground sample is shown in Figure 4, and the sample was analyzed as C3A.
2.2. Mix Proportion
According to GB/ T 749-2008 [25] “Test method of cement against sulphate attack”, P-II 52.5 silicate cement produced by Nanjing Jiangnan Onoda Cement Factory Co., Ltd. (Nanjing, China) was used to form the specimens, and the mortar specimens were formed according to the fitting ratio of Table 5, with a water–cement ratio 0.50 and a cement–sand ratio 1:2.5. The mortar was divided into 3 groups, and the first group is a partial replacement of standard sand with <0.3mm gypsum sand. The SO3 content introduced by gypsum in the sand was controlled as 0.6%, 1.2%, 2.4%, 4.8% and 7.2% to evaluate the effect of SO3 content of aggregate on the degree of ISA caused by mortar specimens. The 2nd group was to fix the SO3 content introduced by gypsum in the sand as 4.8% and adjust the particle size of gypsum sand as <0.3 mm, 0.3–1.18 mm and 1.18–2.36 mm to evaluate the effect of SO3 content of aggregate on the degree of ISA caused by mortar specimens, and 2.36 mm to evaluate the effect of gypsum particle size on the ISA of mortar specimens. The 3rd group was to fix the SO3 content introduced in the sand at 4.8%, the particle size of gypsum sand was <0.3 mm, and the mortar specimens are maintained in water at 20 °C, 40 °C and 60 °C to evaluate the effect of maintenance temperature on the ISA of mortar specimens. According to GB/T17671-1999 [26] in the mortar mixer to mix the material, the prepared material was filled into 25 mm × 25 mm × 280 mm and 40 mm × 40 mm × 160 mm mortar moulds, pounded and vibrated on the shaking table; the surface of the mould was then smoothed with a spatula, placed in a standard maintenance box (20 °C, RH ≥ 97%) and maintained, and demoulded after 1 day. The size of the mould for testing the expansion rate of the mortar specimen was 25 mm × 25 mm × 280 mm, with nail heads preburied at both ends of the specimen; the size of the specimen for testing the strength of mortar was 40 mm × 40 mm × 160 mm.
2.3. Formation Conditions of AFt and Gypsum
The pH values of the solutions were adjusted by NaOH to 7.0, 11.0, 12.0, 12.6, 13.0, 13.2 and 13.6, respectively. Then, 1.2 g of C3A was added to 100 mL of solutions with different pH values and hydrated by magnetic stirring for 12 h. Then, 7.6 g of CaCl2 was added and stirred well, and 0.1 g/0.5 g/1.2 g of Na2SO4 was added by magnetic stirring for 12 h. Three solutions with different pH values of SO42− concentrations of <1000 mg/L, 1000~8000 mg/L and >8000 mg/L were designed. The reaction products of the C3A-CaCl-Na2SO4 ternary system in water were studied at different pH and sulphate concentrations. To prevent the effect of air on the experiment, the beaker was sealed with cling film throughout the stirring process, the filter residue was filtered out, dried under vacuum at 45 °C, ground finely and analyzed for its main components using XRD. The pH value and sulfate ion concentration required for Aft and gypsum phase formation were determined by this method.
2.4. pH Value of Mortar Test
The test pieces containing different amounts of gypsum were crushed and ground, then sieved (0.08 mm square hole sieve), weighed 5 g, then dissolved into 10 times the mass of distilled water, plugged tightly with rubber plugs to prevent carbonization, shaken about every 5 min, left to stand for 2 h, filtered after 24 h, and the pH value of the filtrate was determined using an acidity meter.
2.5. Dissolution of Gypsum in Solution with Different pH Values
Solutions of pH 7.0 (deionized water), 11.0, 12.0, 12.6 and 13.0 were made using Ca(OH)2 and NaOH, and gypsum powder was immersed in the solution with a solid-liquid ratio of 1:6, sealed with a film, and the sulphate ion concentration in the solution was measured after 180 d using an ion chromatograph.
2.6. Test Methods
2.6.1. Expansion Measurement
The durability of the cement-based material structure is closely related to its volume stability because the volume of the specimen will change due to the effect of sulphate in the material; thus, the measurement of the deformation performance of the mortar specimen has some significance for the study of internal sulphate attacks. In this test, the nail head has been buried in the axial at both ends of the specimen in advance, and the lengths of mortar specimens at different ages during the process of sulphate attack have been measured using BC-II ratio meter to calculate the expansion rate of the specimens. Measurement and calculation method: After the specimen is demoulded, it is placed in water for 30 min to measure its initial length L0, and then its length Lt is measured at different ages of attack. The expansion rate of the specimen is calculated according to the Formula (1), and the average expansion rate of each group of three specimens is taken as the expansion value of the group, accurate to 0.001%.
where Pt: expansion rate of the specimen at age t, 100%.
L0: the initial length of the specimen, mm.
Lt: length of the specimen at age t, mm.
L: the effective length of the test piece and the effective length of the mortar is 250 mm.
2.6.2. Strength Test
In this paper, the compressive and flexural strengths of mortar specimens with different gypsum contents, different gypsum particle sizes and different curing temperatures were measured. The strength of the specimens was measured in accordance with GB/T 17671-1999 “Test Method for Strength of Cementitious Mortar”.
2.6.3. Mineral Components Analysis
The mineral composition in specimens with different gypsum dosing and different attack times were analyzed by XRD and TG–DSC. The mortars cut from the concrete samples were immersed in absolute ethyl alcohol for 12 h to terminate hydration, before being vacuum dried at 60 °C for 24 h and then ground into powder. The test powders were passed through an 0.08 mm sieve. The XRD data were collected in the range of 10°–70°, 2θ at a counting time of 15 s/step, and a divergence slit of 1°. TG–DSC data were obtained from 50 to 950 °C at a rate of temperature increase of 10 °C/min in a N2 atmosphere.
2.6.4. SEM Analysis
Because of the ISA caused by gypsum aggregates, the internal structure and the products of cement mortar specimens were changed, and the samples were observed under SEM, while dispersive EDS could be used to analyze the attack products. At different ages of attack, the surface of the specimen was excised, cracked and selected with fresh sections, soaked in anhydrous ethanol for 48 h to terminate hydration, and removed and dried under vacuum for 24 h. The samples for backscattering observation also required sandpaper for grinding, using 800–5000 grit sandpaper respectively. The cracks occurring inside the cementitious material after suffering from ISA were observed by backscattering, the morphology inside the transition zone of the interface between gypsum and slurry, cracks and holes were observed by SEM, and the damage caused by the attack products to the microstructure was analyzed by combining with EDS energy spectroscopy.
2.6.5. MIP Analysis
The specimens were removed at different ages, the surface layer was removed by 2 mm, small pieces of about 2 mm were made with scissors, soaked in anhydrous ethanol for 48 h to terminate hydration, and finally dried in a vacuum-drying oven at 45 °C for 24 h. Liquid mercury was pressed into the pores of the slurry using a mercury press and the properties of the solid material were characterized as a function of mercury entering the pore size and pressure. The data were processed and analyzed using Porowin software for the internal effect of the sulphate attack on the pore size distribution and porosity of the cement slurry.
3. Results and Discussion
3.1. XRD Analysis
3.1.1. Samples with Different Contents of Gypsum
Figure 5 shows the XRD patterns of mortar specimens with different SO3 contents in the aggregate at 28 d and 360 d under 20 °C maintenance. Figure 5a shows that all mortar specimens have calcium alumina and calcium hydroxide diffraction peaks at 28 d, and the intensity of calcium alumina and calcium hydroxide diffraction peaks is weaker for 0% SO3 content in the aggregate. When the SO3 content in the aggregate was 0%, 0.6% and 1.2%, no gypsum diffraction peaks were detected in the mortar specimens at 28 d, indicating that all the gypsum was dissolved. When the SO3 content in the aggregate was greater than or equal to 2.4%, there were gypsum diffraction peaks in the specimens, and the higher the SO3 content in the aggregate, the stronger the intensity of the gypsum diffraction peaks. From Figure 5b, it can be seen that the intensity of the calcium alumina peak of the mortar specimen with SO3 content greater than or equal to 0.6% in the aggregate at 360 d is stronger than that of the specimen with 0% SO3 content in the aggregate, indicating that the mortar specimen mixed with gypsum sand generates more calcium alumina than that of the mortar specimen without gypsum sand. The gypsum diffraction peak of the mortar specimen with 2.4% SO3 content in the aggregate has disappeared, indicating that all the gypsum has dissolved. The gypsum diffraction peaks of the mortar specimens with SO3 content of 4.8% and 7.2% SO3 in the aggregate still existed, indicating that the gypsum was not completely dissolved, and the gypsum of the two groups of mortar specimens with SO3 content of 4.8% and 7.2% SO3 in the aggregate was sufficient within 360 d.
3.1.2. Samples Curing in Different Temperatures
Figure 6 shows the XRD patterns of mortar specimens with 4.8% SO3 in the aggregate at 28 d and 360 d under different temperature maintenance. From Figure 6a, it can be seen that the gypsum-doped sand specimens cured at 28 d, 20 °C, 40 °C and 60 °C all have calcium alumina, gypsum and calcium hydroxide diffraction peaks, indicating that the gypsum aggregate failed to dissolve completely. From Figure 6b, it can be seen that after 360 d of curing, there are still gypsum diffraction peaks in the gypsum-doped sand specimens cured at 20 °C, 40 °C and 60 °C. The intensity of gypsum diffraction peaks in the specimens cured at 20 °C >, those cured at 40 °C > and those cured at 60 °C, indicating that increasing the curing temperature accelerates the rate of gypsum dissolution. In general, the calcium alumina diffraction peak tends to be enhanced and the gypsum diffraction peak tends to be weakened as the age of maintenance increases.
3.1.3. Samples with Different Size of Gypsum Sand (<0.3 mm)
Figure 7 shows the XRD patterns of mortar specimens mixed with gypsum aggregates of different particle sizes with 4.8% SO3 content in the aggregate at 28 d and 360 d of maintenance. The results show that calcium alumina, gypsum and calcium hydroxide are present in mortar specimens mixed with 0.15–0.30 mm, 0.3–1.18 mm and 1.18–2.36 mm gypsum sand at 28 d and 360 d. The smaller the particle size of gypsum sand, the weaker the diffraction peak of gypsum. The weakest intensity of the gypsum diffraction peak is in mortar specimens mixed with less than 0.3 mm gypsum sand and the slightly stronger calcium alumite diffraction peak, which indicates that the smaller the particle size of gypsum aggregate, the faster the dissolution rate of gypsum, and the rate of calcium alumite formation is also accelerated.
3.2. TG–DSC Analysis
Figure 8 shows the TG–DSC curves of cement mortar specimens with 7.2% SO3 content at 56 d, 120 d and 240 d under 20 °C maintenance. Because the heat absorption decomposition temperature of each phase is different, the heat absorption peaks in different temperature intervals can reflect the changes of the phases. In the DSC curves, the dehydration temperatures of calcium alumina, gypsum and calcium hydroxide ranged from 80 to 120 °C, 120 to 150 °C and 390 to 470 °C, respectively. From Figure 8a, it can be seen that there are heat absorption peaks of calcium alumite, gypsum and calcium hydroxide at 56 d, 120 d and 240 d. Combined with Figure 8b, the contents of calcium alumite, gypsum and calcium hydroxide can be calculated according to Equations (2)–(4).
WAFt, WG and WP are the dehydrated mass loss of calcium alumina, gypsum and calcium hydroxide, respectively, and MAFt, MG, MP and MH2O are the relative molecular masses of calcium alumina, gypsum, calcium hydroxide and water, respectively.
Figure 9 shows the contents of calcium alumina, gypsum and calcium hydroxide for cement mortar specimens with 7.2% SO3 content at 56 d, 120 d and 240 d under 20 °C maintenance. The results showed that the contents of calcium alumina were 9.40%, 12.28% and 17.75%, of gypsum they were 1.42%, 1.11% and 0.65% and of calcium hydroxide they were 8.79%, 8.96% and 8.87% at 56 d, 120 d and 24 d, respectively, which were similar to the results of XRD quantitative analysis. This indicates that during the internal sulphate attack, the gypsum content decreases, the calcium alumina content increases, and the calcium hydroxide content remains relatively stable.
3.3. Expansion Measurements
Figure 10 shows the swelling rate of cement mortar specimens with different SO3 content in the aggregate at 20 °C. The results show that the greater the SO3 content in the aggregate, the greater the swelling rate of mortar specimens. When the SO3 content in the aggregate was 0.6% and 1.2%, the expansion rate of mortar specimens at 360 d did not exceed 0.1% and no longer had a significant expansion trend. The expansion rates were 0.029% and 0.094% at 360 d. When the SO3 content in the aggregate was 2.4%, the expansion rate of the specimens reached 0.33% at 360 d, and the expansion trend slowed down; and when the SO3 content in the aggregate was 4.8% and 7.2%, the swelling rate of the specimens at 360 d was 0.55% and 0.61%, respectively, and the swelling had not yet stabilized. From XRD Figure 5, we know that the gypsum in the mortar specimens with SO3 content less than or equal to 2.4% in the aggregate at 360 d has been consumed, and the mortar specimens with SO3 content of 4.8% and 7.2% in the aggregate have remaining unreacted gypsum. This indicates that when the gypsum admixture is small, the amount of calcium alumina generated by ISA is limited and the volume deformation caused to the specimens is limited; instead, calcium alumina is used to fill the cement paste pores [27].
Figure 11 shows the expansion rates of mortar specimens with 4.8% SO3 content in the aggregate at different curing temperatures. From Figure 11, it can be seen that the expansion of the mortar specimens maintained at 20 °C grows linearly with age, the mortar specimens maintained at 40 °C and 60 °C expand rapidly within 14 d, and then the expansion development slows down, where the expansion of the mortar specimens maintained at 40 °C continues to grow at a lower rate, and the expansion of the mortar specimens maintained at 60 °C tends to stabilize after 14 d, with little expansion enhancement. The expansion rate of the mortar specimens maintained at 20 °C was the smallest before 85 d, and its expansion exceeded that of the mortar specimens maintained at 60 °C and 40 °C at 86 d and 150 d, respectively; at 360 d, the expansion rates of the mortar specimens maintained at 20 °C, 40 °C and 60°C were 0.55%, 0.37% and 0.15%, respectively. From the next section, we know that the higher the maintenance temperature, the higher the strength of mortar specimens. In maintenance of mortar specimens at 60 °C with fast strength development, the higher the maintenance temperature, the faster the rate of gypsum dissolution reaction to generate calcium alumina, as the strength limits the expansion of calcium alumina; while in maintenance of the specimens at 20 °C with slow strength development, the gypsum dissolution to generate calcium alumina rate is slow. The swelling value law is 40 °C > 20 °C > 60 °C. From XRD analysis in Figure 11, we know that the gypsum in the mortar specimen with 4.8% SO3 content in the aggregate is sufficient, which is higher than the gypsum content in the net mortar specimen with 4.8% SO3 cement, which will generate more calcium alumina; thus, after 150 d, the swelling rate of the specimen maintained at 20 °C exceeds 40 °C.
Figure 12 shows the expansion rates of mortar specimens with 4.8% SO3 content in different gypsum particle size aggregates at 20 °C maintenance. From Figure 12, it can be seen that the swelling of mortar specimens mixed with gypsum sand of particle size < 0.3 mm, 0.3–1.18 mm and 1.18–2.36 mm grows linearly with age and the swelling has not yet stabilized. The swelling of mortar increases as the particle size of gypsum aggregate decreases. At 360 d, the swelling of mortar specimens with gypsum particle size < 0.3 mm, 0.3–1.18 mm and the expansion of mortar specimens with 1.18–2.36 mm were 0.55%, 0.36% and 0.24%, respectively. From XRD analysis in Figure 12, it is known that this is because the smaller particle size of gypsum aggregate accelerates the rate of calcium alumina formation and causes more significant swelling.
3.4. Strength Measurements
Figure 13a,b shows the compressive strength and flexural strength of mortar specimens with different SO3 content in the aggregate when maintained at 20 °C, respectively. The results show that the higher the SO3 content in the aggregate, the lower the compressive strength and flexural strength of the mortar specimens, which is because gypsum replaces part of the aggregate and its own low strength leads to the low strength of the specimens. In the mortar specimens with 0% SO3 content in the aggregate, the compressive and flexural strengths are enhanced with the extension of age. In the mortar specimens with 0.6%, 1.2%, 2.4%, 4.8% and 7.2% SO3 content in the aggregate, the compressive and flexural strengths grow first and then decrease, which indicates that with the hydration reaction of cement, the early filling of mortar pores by calcium alumina has a certain contribution to the strength. However, after the strength of cement slurry rose and hardened 3 months later, the expansion stress generated by the expansion of ettringite caused cracks in the mortar and damaged the internal structure of mortar.When the SO3 content in the aggregate was 0.6% and 1.2%, the compressive strength of mortar specimens at 28 d was 60.5 MPa and 46.9 MPa, and the flexural strength was 10.0 MPa and 7.7 MPa, respectively. The compressive strength at 360 d was 69.2 MPa and 57.0 MPa, and the flexural strength was 9.8 MPa and 9.3 MPa, respectively. As can be seen from Figure 10, the expansion rate of mortar specimens with SO3 content of 0.6% and 1.2% in the aggregate did not exceed 0.1%, but there was a certain tiny expansion relative to the blank sample, so the strength of mortar specimens had loss after 3 months, but the compressive and flexural strength of mortar at 360 d was basically higher than the strength at 28 d. When the SO3 content in the aggregate was 2.4%, 4.8% and 7.2%, the compressive strengths of mortar specimens were 38.2 MPa, 36.9 MPa and 35.6 MPa, and the flexural strengths were 6.5 MPa, 6.3 MPa and 6.0 MPa at 28 d, respectively. The compressive strengths at 360 d were 36.6 MPa, 32.9 MPa and 29.5 MPa and flexural strengths of 5.0 MPa, 4.6 MPa and 4.3 MPa, respectively. From Figure 13, it can be seen that the swelling rates of mortar specimens with 2.4%, 4.8% and 7.2% SO3 content in the aggregate at 360 d were 0.33%, 0.55% and 0.61%, respectively, the swelling of mortar was larger and caused greater strength loss, and the mortar compressive and flexural strengths at 360 d were already lower than the strength at 28 d.
The 28-d strength of mortar specimens was selected as the initial strength, and the rate of change of strength at different curing ages was converted to obtain the trend of the rate of change of strength, which is shown in Figure 14. It can be seen from the figure that with the increase of curing age, the rate of change of compressive flexural strength of mortar with 0% SO3 content in the aggregate was increasing, while the rate of change of the strength of mortar specimens mixed with gypsum sand showed different degrees of decreasing due to the internal sulphate attack. When the SO3 content in the aggregate was 2.4%, 4.8% and 7.2%, the compressive and flexural strengths of the mortar specimens decreased to a level lower than the initial strength at 360 d due to the sulphate attack, with compressive strength losses of 4.2%, 10.8% and 17.1%, and flexural strength losses of 23.1%, 27.0% and 28.3%, respectively; and the swelling rate of the specimens exceeded 0.1%, indicating that the swelling rate of cementitious materials with the introduction of gypsum is harmful when it exceeds 0.1%, similar to the criteria for judging the activity of alkali aggregates [28]. From the above, it can be found that the introduction of gypsum sand as an attack source providing internal sulphate is harmful to mortar specimens in relation to the amount of gypsum admixture.
3.4.1. The Effect of Maintenance Temperature on Strength
Figure 15a,b show the compressive strength and flexural strength of mortar specimens with SO3 content of 4.8% in the aggregate at different curing temperatures. The results show that the compressive strength and flexural strength of mortar specimens increase by increasing the curing temperature, indicating that increasing the curing temperature is beneficial to the compressive strength and flexural strength of mortar; the compressive strength and flexural strength of mortar specimens cured in water at 20 °C, 40 °C and 60 °C grow first and then decrease. The compressive strength of specimens cured in water at 20 °C, 40 °C and 60 °C at 28 d are 36.9 MPa, 50.6 MPa and 59.6 MPa, respectively, and flexural strength is 6.3 MPa, 8.0 MPa and 8.8 MPa, respectively. At 360 d, compressive strength is 32.9 MPa, 58.9 MPa and 69.8 MPa, respectively, and flexural strength is 4.6 MPa, 8.5 MPa and 9.0 MPa, respectively. From Figure 15, it can be seen that at 20 °C, 40 °C and 60 °C, curing mortar specimens swell 0.55%, 0.37% and 0.15%, respectively; the mortar curing at 20 °C swells the most, the strength loss is larger, and the mortar strength at 360 d is lower than that at 28 d. The mortar swelling at 60 °C curing stabilizes faster and swells the least, causing a small strength loss, and the strength of the mortar is higher than that of the mortar curing at 20 °C and 40 °C.
3.4.2. Effect of Gypsum Sand Particle Size on Strength
Figure 16a,b show the compressive strength and flexural strength of mortar specimens with different particle sizes of gypsum aggregates at 4.8% SO3 content in the aggregates under 20 °C curing, respectively. The results showed that the smaller the particle size of gypsum sand, the lower the compressive and flexural strengths of mortar specimens. The strengths of mortar specimens mixed with <0.3 mm, 0.3–1.18 mm and 1.18–2.36 mm gypsum sand grew first and then decreased; the 28-d compressive strengths of specimens with particle sizes < 0.3 mm, 0.3–1.18 mm and 1.18–2.36 mm were 36.9 MPa, 35.7 MPa and 41.5 MPa; and flexural strengths were 6.3 MPa, 6.4 MPa and 6.8 MPa, respectively. At 360 d, compressive strengths were 32.9 MPa, 39.3 MPa and 43.7 MPa and flexural strengths were 4.6 MPa, 5.1 MPa and 6.4 MPa, respectively. From Figure 16, it can be seen that gypsum with particle sizes < 0.3 mm, 0.3–1.18 mm and 1.18–2.36 mm mortar specimens swelling rate is 0.55%, 0.36% and 0.24%, respectively; <0.3 mm mortar expansion is the largest, causing greater losses. Compressive strength and flexural strength at 360 d are lower than at 28 d, because the smaller the particle size, gypsum and mortar slurry reaction contact area is large, accelerating the rate of calcium alumina formation and accelerating the attack on the specimen.
3.5. SEM Analysis
Figure 17 shows the microstructure inside the cracks of the lumpy gypsum buried into the cement paste at 90 d greater than 2 mm. From Figure 17 conclusions (a) and (b), it can be found that needle- and rod-like material of about 1–2 μm can be found at the junction of gypsum and slurry as well as within the cracks of the slurry. This means that the gypsum particles dissolve and react with the cement to produce a needle-like substance and that this substance is the cause of the cracks. After the energy spectrum analysis, we know that the needle- and rod-like material is AFt.
3.6. Deterioration Mechanism Analysis
3.6.1. Formation of AFt and Gypsum
The reaction products contain AFt, but the cement matrix still contains a certain amount of gypsum. During the internal sulphate attack, whether there is a new gypsum phase generated, to investigate this issue, we configured solutions with different pH values and different sulphate ion contents to examine the pH and sulphate ion concentration conditions for the formation of AFt and gypsum phases.
Figure 18a,c show the XRD patterns of the precipitation products at different pH values when the SO42− concentration was <1000 mg/L, 1000~8000 mg/L and >8000 mg/L, respectively. From Figure 18a, it can be seen that when the SO42− concentration < 1000 mg/L, calcium alumina was present in the products at each pH condition, and there was no gypsum peak. From Figure 18b, it can be seen that when the SO42− concentration is 1000~8000 mg/L, calcium alumina is present in the products at all pH conditions, and there is a gypsum peak in the products with pH ≤ 12.6, while there is no gypsum peak in the products with pH ≥ 13.0. From Figure 18c, it can be seen that when the SO42− concentration > 8000 mg/L, both calcium alumina and gypsum peaks were present in the products at all pH conditions.
3.6.2. Dissolution of Gypsum
Figure 19 shows the concentration of sulphate ions in solution at 360 d. The results show that the SO42− concentration in the solution increases with increasing pH, a conclusion similar to that of Yuan Yuexue [29]. The SO42− concentration in the solution with pH 13.0 was 4230 mg/L, while the SO42− concentration in the solution with pH 7.0 was 1432 mg/L; thus, the SO42− concentration dissolved from gypsum is affected by the pH of the solution.
3.6.3. pH Value in Mortar
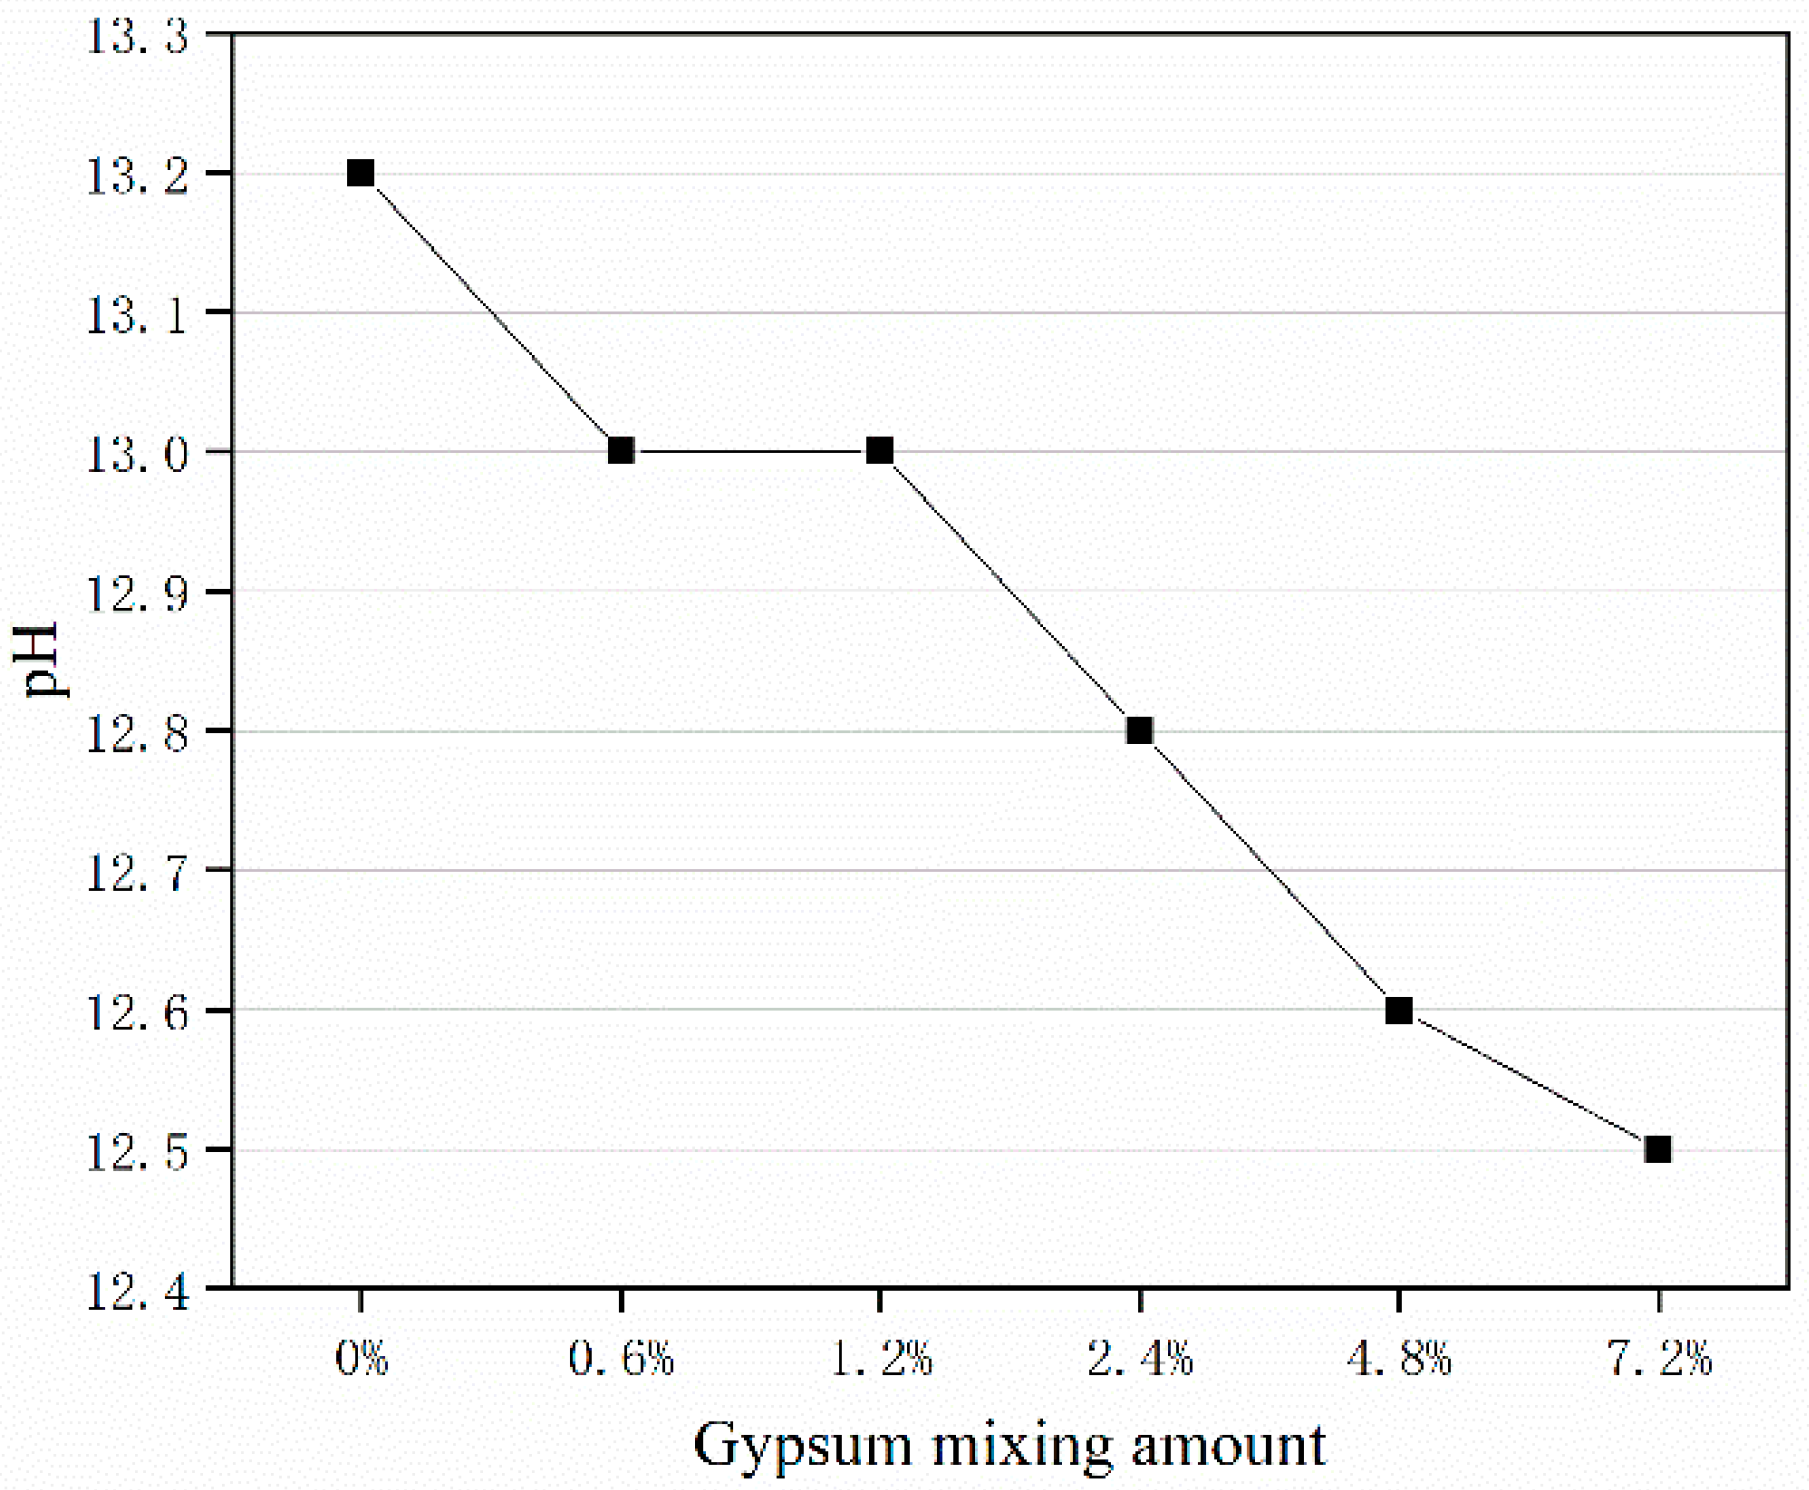
Figure 20 shows the pH values in different doping amounts of gypsum. From the results, the pH value of the solution is gradually decreasing with the increase of gypsum admixture, and the decrease of pH value gradually slows down with the increase of admixture. In the case of 0% gypsum admixture, the pH is 13.2, while in the case of 7.2% gypsum admixture, the pH is 12.5; thus, the gypsum admixture has an effect on the pH value of the solution.
4. Conclusions
The deterioration process of concrete exposed to ISA was investigated. The main conclusions are as follows:
(1) The results of the swelling rate and compressive flexural strength of mortar specimens show that the higher the SO3 content in the aggregate, the greater the swelling rate of mortar specimens, the lower the strength and the more significant the strength loss, and the more significant the effect of ISA on the mortar.
(2) The increase of the curing temperature makes the mortar specimen swell rapidly and steadily on the one hand and promote increased strength on the other hand. In general, it improves the resistance to internal sulphate attack.
(3) The increased contact area for the reaction between gypsum and slurry accelerates the dissolution rate of gypsum and deepens the erosion of the specimen. This suggests that ISA tests can be accelerated by reducing the particle size of the aggregates.
(4) The concentration of sulphate ions dissolved from gypsum aggregates in the pore solution environment of cementitious materials is low enough to generate sulphate reaction products of gypsum, and the main reaction product of ISA is calcium alumina.
(5) The generation of gypsum during ISA does not produce expansion, and the main cause of cracking and damage of cementitious materials is the calcium alumina generated during the reaction.
Author Contributions
C.Z.: Conceptualization, Methodology, Validation, Writing—original draft preparation. B.H.: Conceptualization, Methodology, data curation. All authors have read and agreed to the published version of the manuscript.
Funding
We are grateful to the financial support from National Key Research and Development Program of China (2021YFB3802002).
Institutional Review Board Statement
Not applicable.
Informed Consent Statement
Not applicable.
Data Availability Statement
Not applicable.
Conflicts of Interest
The authors declare no conflict of interest.
References
- Yishen, D. Experimental Study on the Durability of Concrete under Sulfate Attack; Zhejiang University: Hangzhou, China, 2011. [Google Scholar]
- Xiaobin, C.; Mengxiong, T.; Kunlin, M. Durability experiments on sulfate and chloride salt attack of underground concrete structures. J. Cent. South Univ. 2012, 43, 2803–2812. [Google Scholar]
- Meyer, Y.A.; Menezes, I.; Bonatti, R.S.; Bortolozo, A.D.; Osório, W.R. EIS investigation of the corrosion behavior of steel bars embedded into modified concretes with eggshell contents. Metals 2022, 12, 417. [Google Scholar] [CrossRef]
- Jia-Ming, Z. Study on the Effect of Dry and Wet Cycles and Carbonation on Sulfate Attack of Concrete; Yangzhou University: Yangzhou, China, 2009. [Google Scholar]
- Yin, G.J.; Zuo, X.B.; Tang, Y.J.; Ayinde, O.; Wang, J.L. Numerial simulation on time-dependent mechanical behavior of concrete under coupled axial loading and sulfate attack. Ocean. Eng. 2017, 142, 115–124. [Google Scholar] [CrossRef]
- Yang, Z.; Ye, H.; Yuan, Q.; Li, B.; Li, Y.; Zhou, D. Factors influencing the hydration, dimensional stability, and strength development of the OPC-CSA-anhydrite ternary system. Materials 2021, 14, 7001. [Google Scholar] [CrossRef] [PubMed]
- Li, H. Testing and Analysis of Microstructure Evolution of Cementitious Materials under Sulfate Attack; Southeast University: Nanjing, China, 2012. [Google Scholar]
- Horkoss, S.; Lteif, R.; Rizk, T. Influence of the clinker SO3 on the cement characteristics. Cem. Concr. Res. 2011, 41, 913–919. [Google Scholar] [CrossRef]
- Lei, Z.; Dingyi, Y. Research progress on the process and main products of concrete sulfate attack. Concr. Cem. Prod. 2006, 19–22. [Google Scholar] [CrossRef]
- Oliveira Tassiane, A.; Pinkoski Igor, M.; D’Orey Gaivão Portella Bragança, M.; André, A.; Oliveira, I.C.; Eduardo, P. Use of Raman spectroscopy to characterize the effect of nanomagnetite as an addition to Portland cement paste on mitigating internal sulfate attack. Constr. Build. Mater. 2020, 262, 120803. [Google Scholar] [CrossRef]
- Lin-N, L.; Yong-Jia, H. Sulfate attack mechanism of concrete and its influencing factors. J. Jiaozuo Eng. Coll. 2003, 465–468. [Google Scholar] [CrossRef]
- Elias, P.; Eduardo, P.; Antonio, P.S.; Miranda, F.M.; D’Orey Gaivão Portella Bragança, M.; Oliveira, I.C. Combined effect of alkali-aggregate reaction (AAR) and internal sulfate attack (ISA): Microstructural and porous structure modifications of portland cement mortars. Constr. Build. Mater. 2023, 362, 129676. [Google Scholar]
- Yinliang, W. Research on the Engineering Geological Characteristics of Gypsum Rock and its Hazard Mechanism to Tunnel Concrete Structure; China University of Geosciences: Wuhan, China, 2013. [Google Scholar]
- Tu, Y.L.; Wu, Y.L. Experimental study on the deterioration of gypsum rock on tunnel concrete. Southwest Highw. 2017, 14–20, CNKI:SUN:XNGL.0.2017-03-003. [Google Scholar]
- Horkoss, S.; Escadeillas, G.; Rizk, T.; Lteif, R. The effect of the source of cement SO3 on the expansion of mortars. Case Stud. Constr. Mater. 2016, 4, 62–72. [Google Scholar]
- Chongbang, X.; Huajun, W. Geological characteristics of gypsum-bearing marl and analysis of the impact of tunneling. J. Undergr. Space Eng. 2020, 16, 227–233. [Google Scholar]
- Gesoglu, M.; Güneyisi, E.; Nahhab, A.H.; Yazıcı, H. The effect of aggregates with high gypsum content on the performance of ultra-high strength concretes and Portland cement mortars. Constr. Build. Mater. 2016, 110, 346–354. [Google Scholar] [CrossRef]
- Crammond, N.J. The thaumasite form of sulfate attack in the UK. Cem. Concr. Compos. 2003, 25, 809–818. [Google Scholar] [CrossRef]
- Geng, W.N.; Shang, J.L.; Chen, Q.S. Experimental study on the corrosion of concrete due to sulphate containing aggregates. Constr. Technol. 1992, 19, 472–474. [Google Scholar]
- Fu, K.; Liu, J.; Hu, H. Research and Engineering Countermeasures of “Ash Baobao” in Yi-Ba Expressway. In Proceedings of the 2010 Annual Conference of Computer Application Branch of China Highway Society, Taiyuan, China, 22–24 October 2010; pp. 151–153. [Google Scholar]
- Xing, C.-S.; Deng, M.; Wang, A.-G.; Liu, K. Internal sulfate attack of concrete caused by gypsum-containing aggregates. J. Constr. Mater. 2014, 30–34. [Google Scholar] [CrossRef]
- Skalny, J.; Marchand, J.; Odler, I. Sulfate Attack on Concrete; Spon Press: London, UK, 2002. [Google Scholar]
- Jian, L. Paste-bearing rock systems and their influence on tunneling. J. Southwest Jiaotong Univ. 1978, 63–72, CNKI:SUN:XNJT.0.1978-01-004. [Google Scholar]
- Biyu, Y.; Maojing, W. The Chengkun Railway through the “Geological Museum”. J. Railw. Eng. 2005, 210–215. [Google Scholar] [CrossRef]
- GB/T 749-2008; Test Method for Determining Capability of Resisting Sulfate Corrode of Cement. National Standard of the People’s Republic of China: Beijing, China, 2017.
- GB/T17671-1999; Method of Testing Cements-Determination of Strength. Test Method for Determining Capability of Resisting Sulfate Corrode of Cement. National Standard of the People’s Republic of China: Beijing, China, 2017.
- Clark, B.A.; Brown, P.W. Formation of ettringite from monosubstituted calcium sulfoaluminate hydrate and gypsum. J. Am. Ceram. Soc. 1999, 82, 2900–2905. [Google Scholar] [CrossRef]
- Liu, S.H.; Rao, M.J. Judgment criteria and evaluation of alkali-aggregate reaction. Highway 2010, 139–142, CNKI:SUN:GLGL.0.2010-01-036. [Google Scholar]
- Yuexue, Y. Process and Mechanism of Sulfate Attack within Gypsum-Containing Aggregates; Nanjing University of Technology: Nanjing, China, 2017. [Google Scholar]
Figure 1.
XRD pattern of P·II 52.5 Portland cement.

Figure 2.
Particle size of P·II 52.5 Portland cement.

Figure 3.
XRD pattern of gypsum.
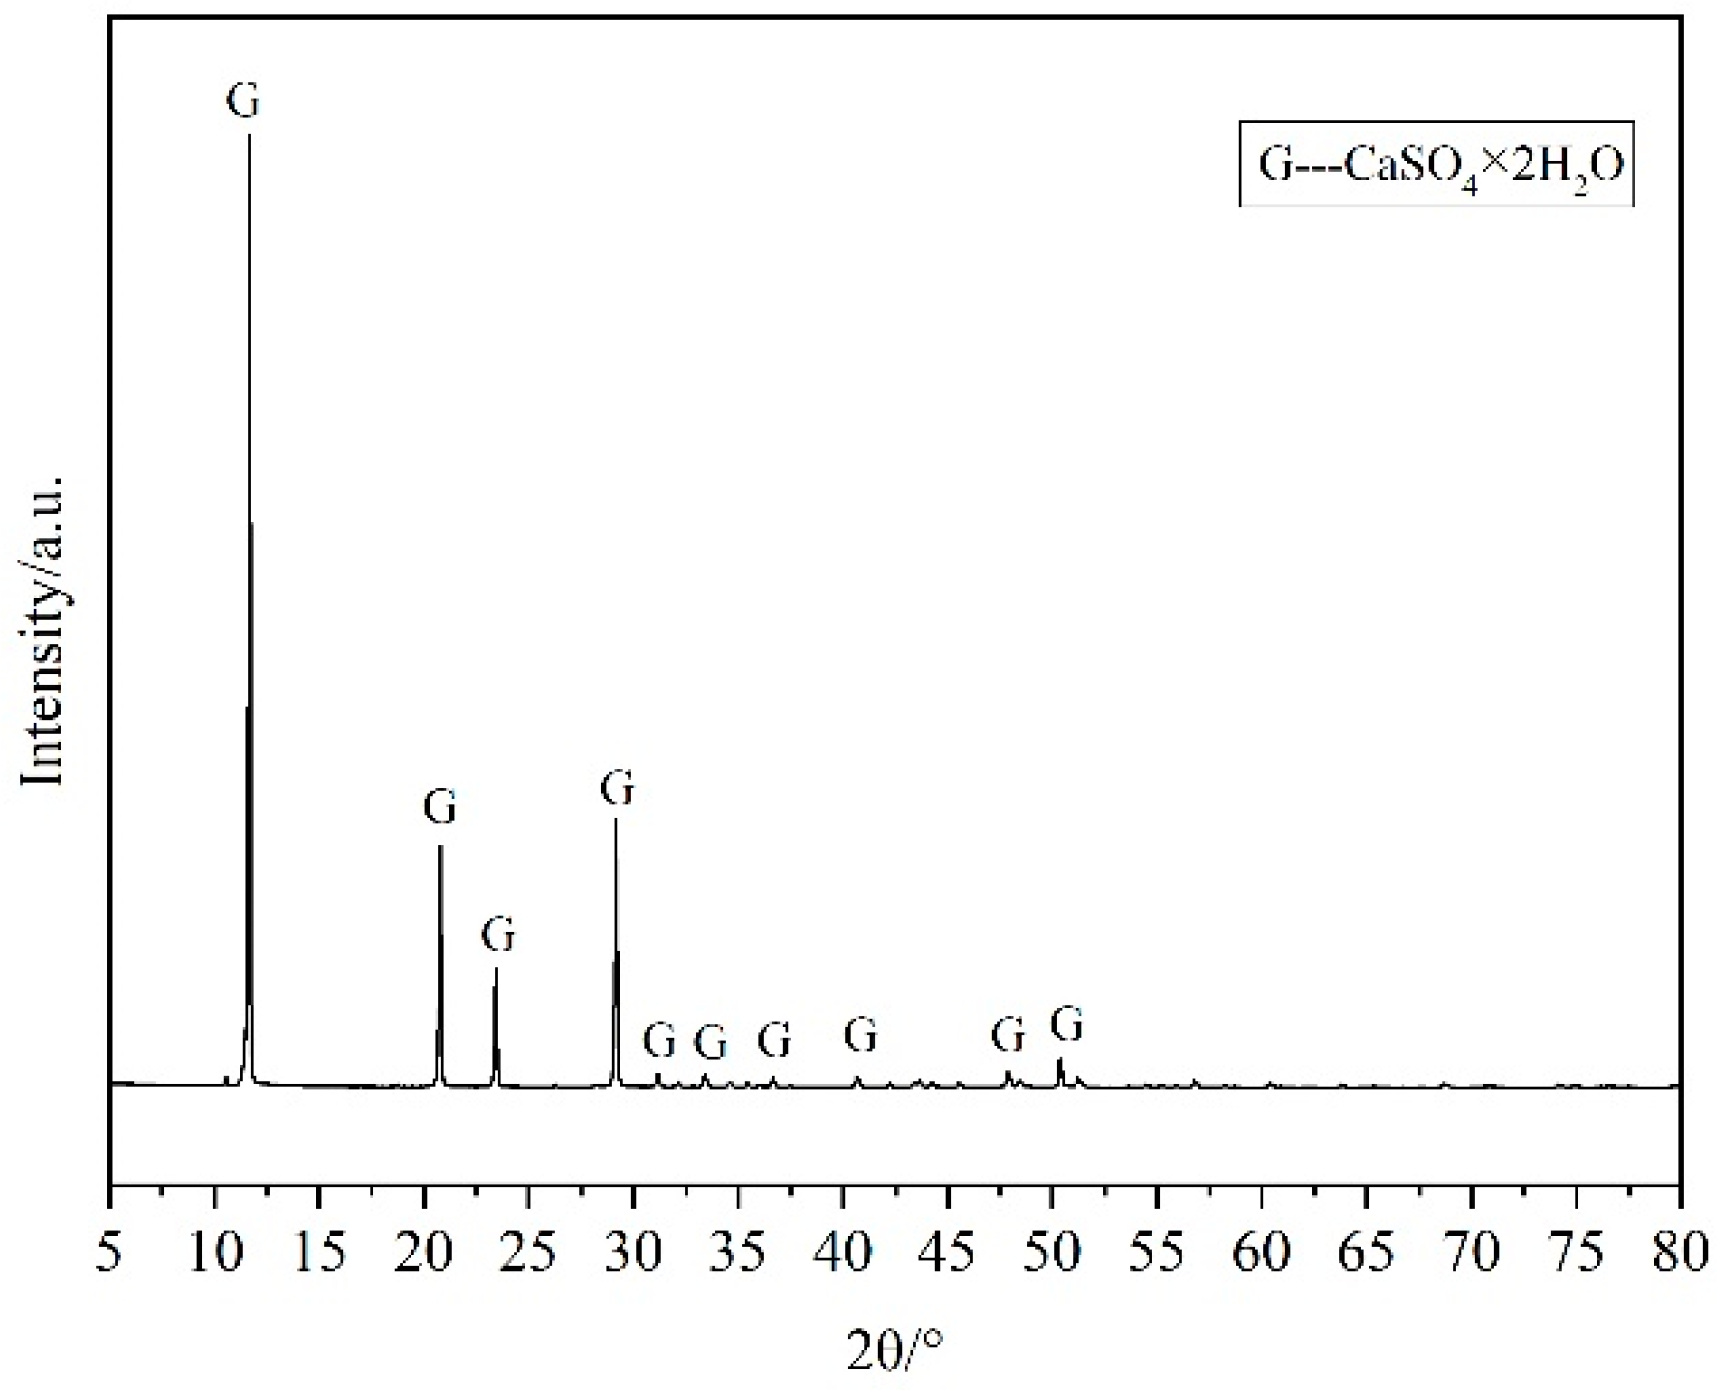
Figure 4.
XRD pattern of C3A.
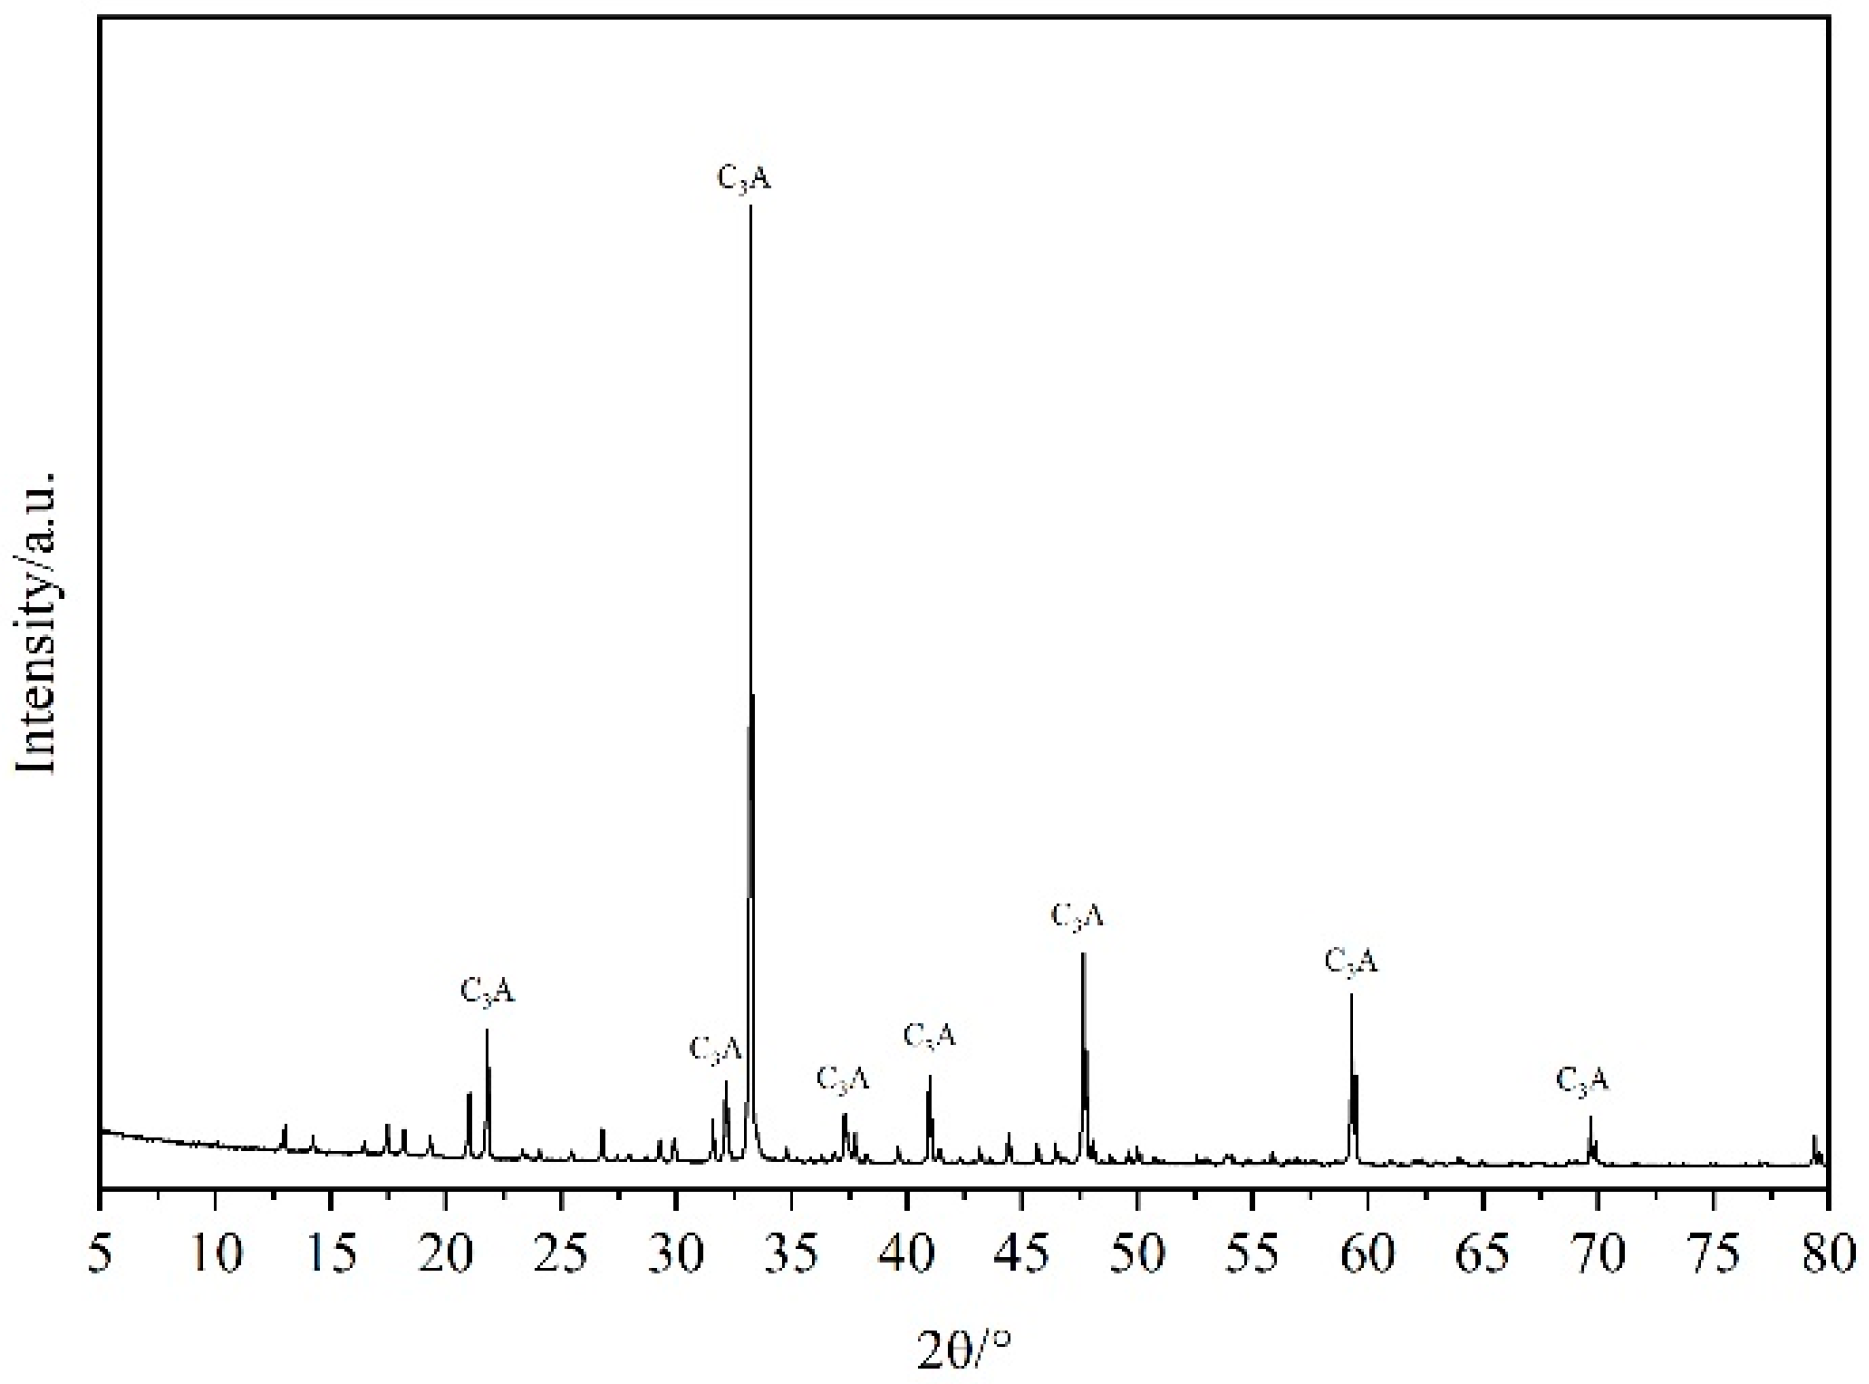
Figure 5.
XRD patterns of mortars with different SO3 content in aggregate.

Figure 6.
XRD patterns of mortars added with 4.8% SO3 in aggregate at different curing temperatures.
Figure 6.
XRD patterns of mortars added with 4.8% SO3 in aggregate at different curing temperatures.
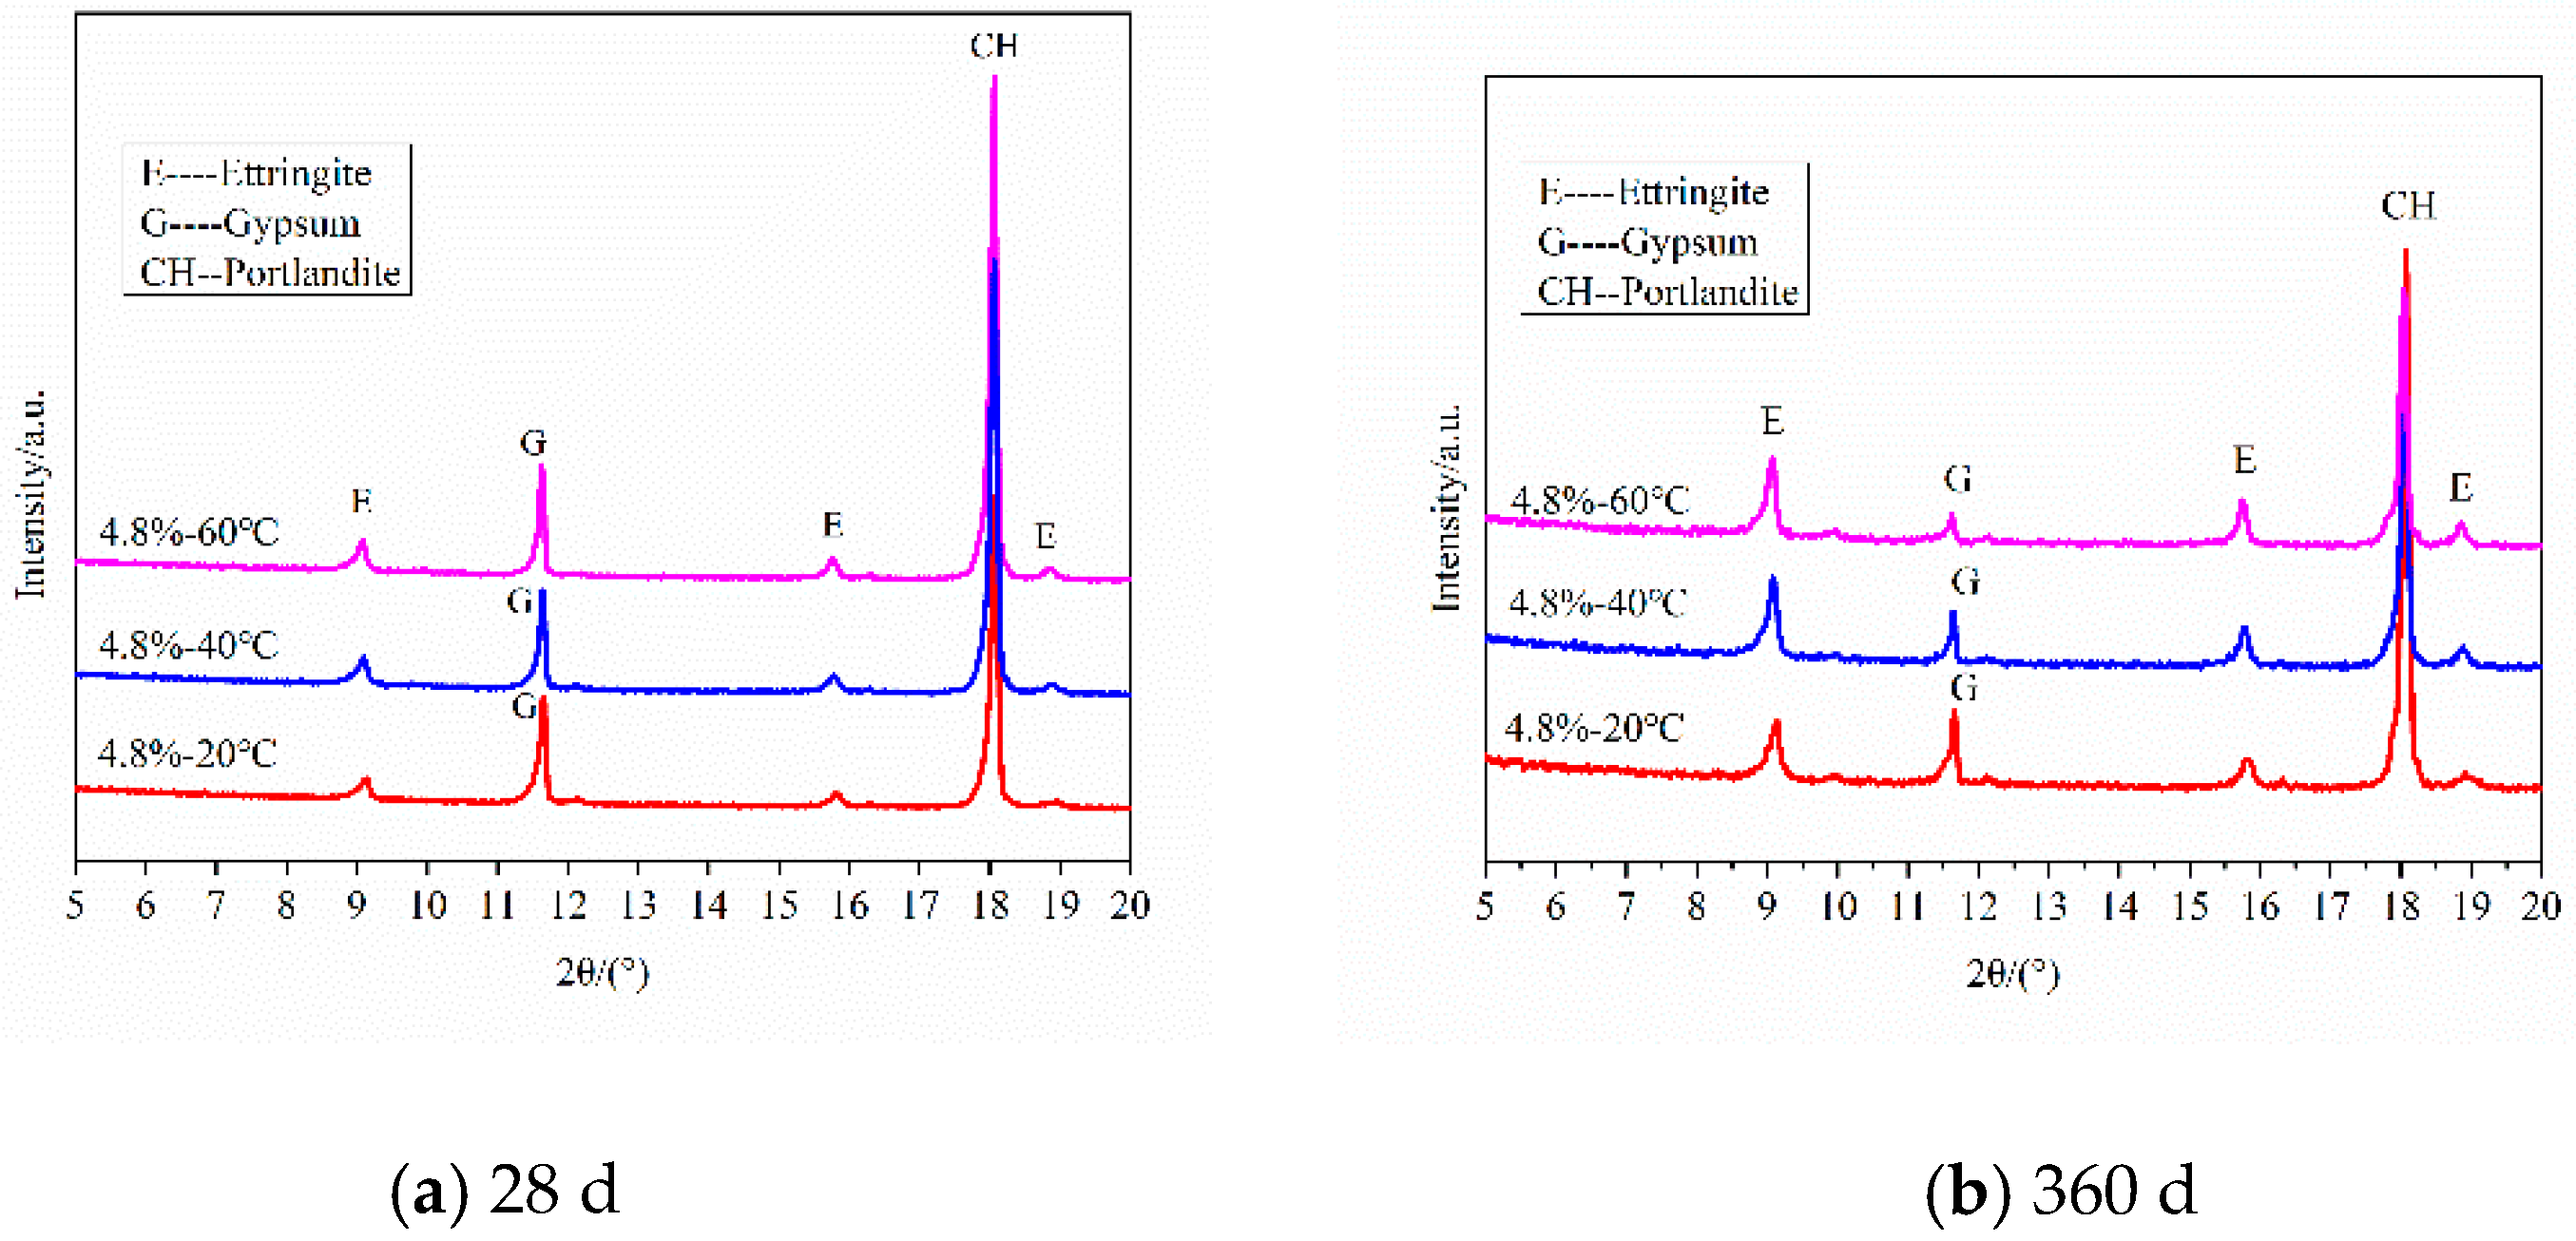
Figure 7.
XRD patterns of mortars with different sizes of gypsum aggregate.
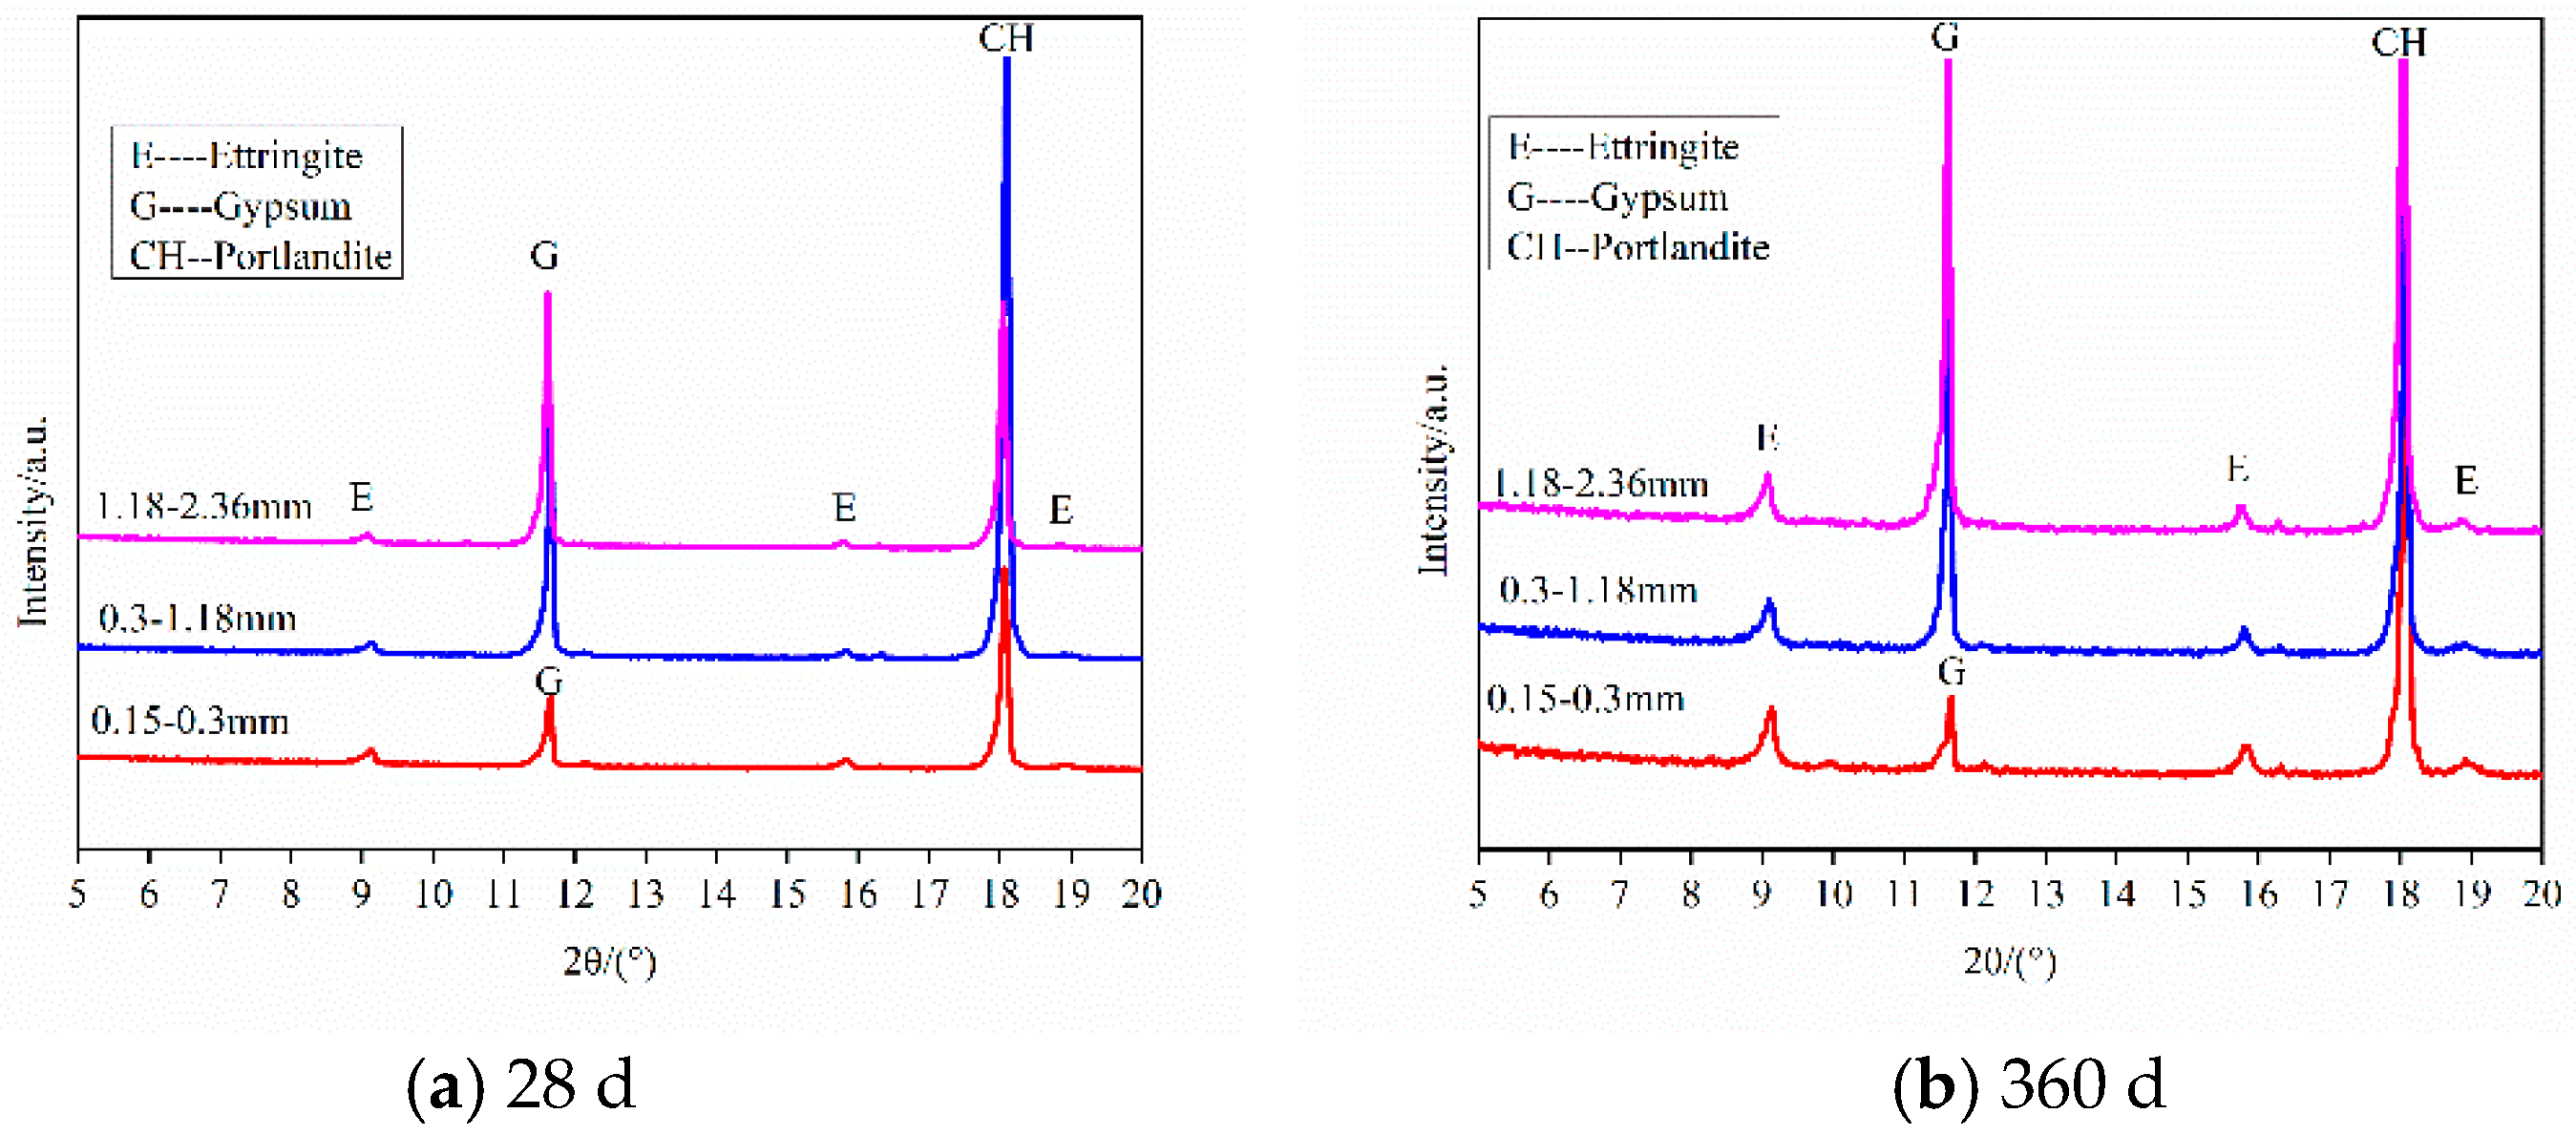
Figure 8.
TG–DSC curves of cement pastes added with 7.2% SO3.
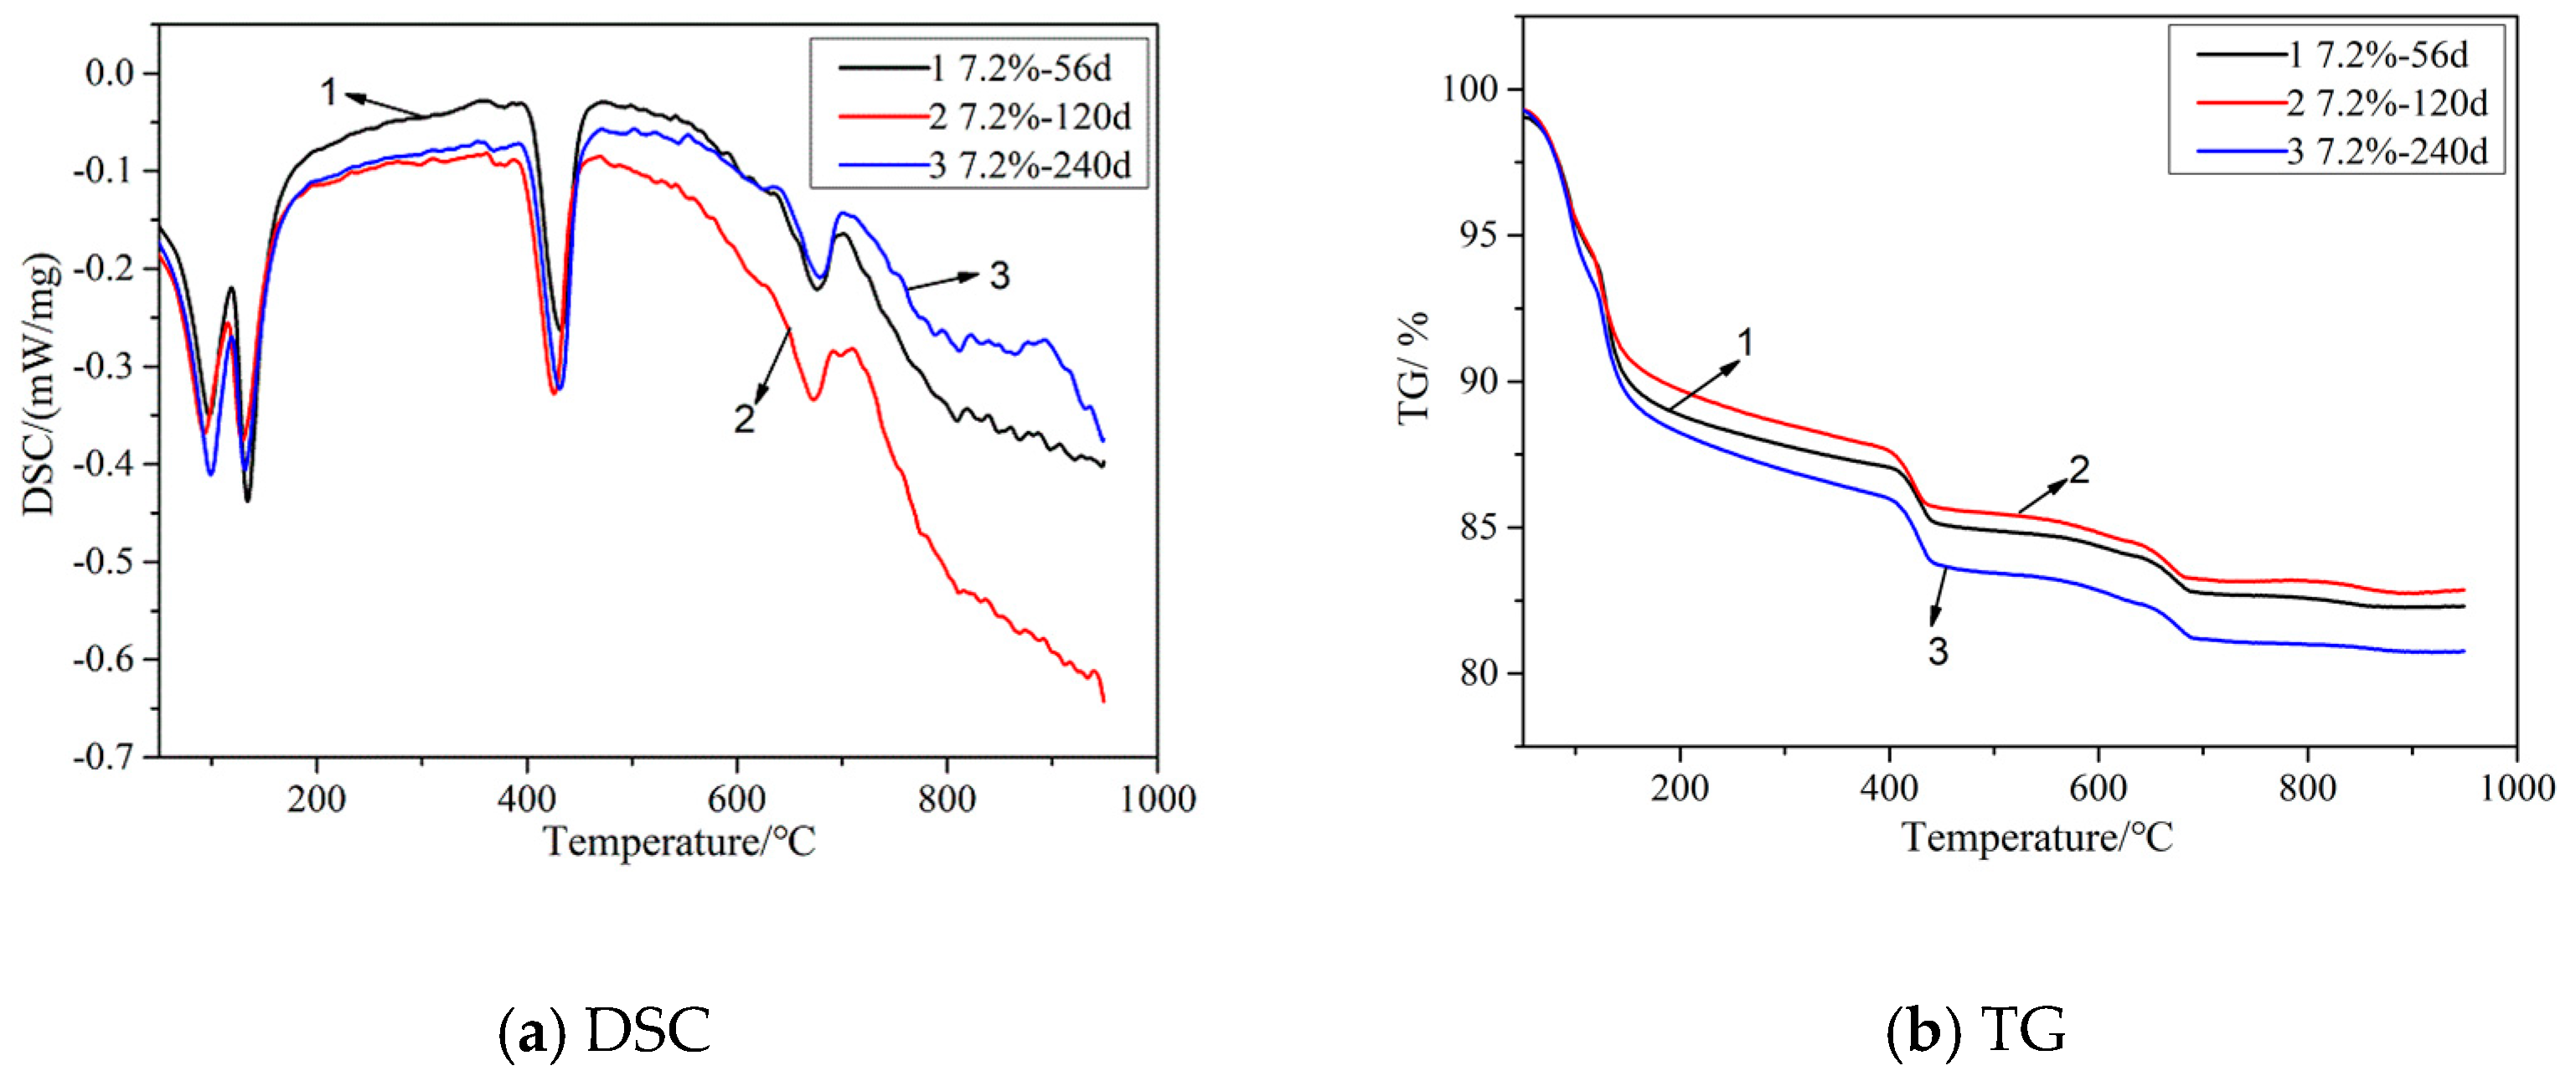
Figure 9.
Phase content of cement mortar added with 7.2% SO3.
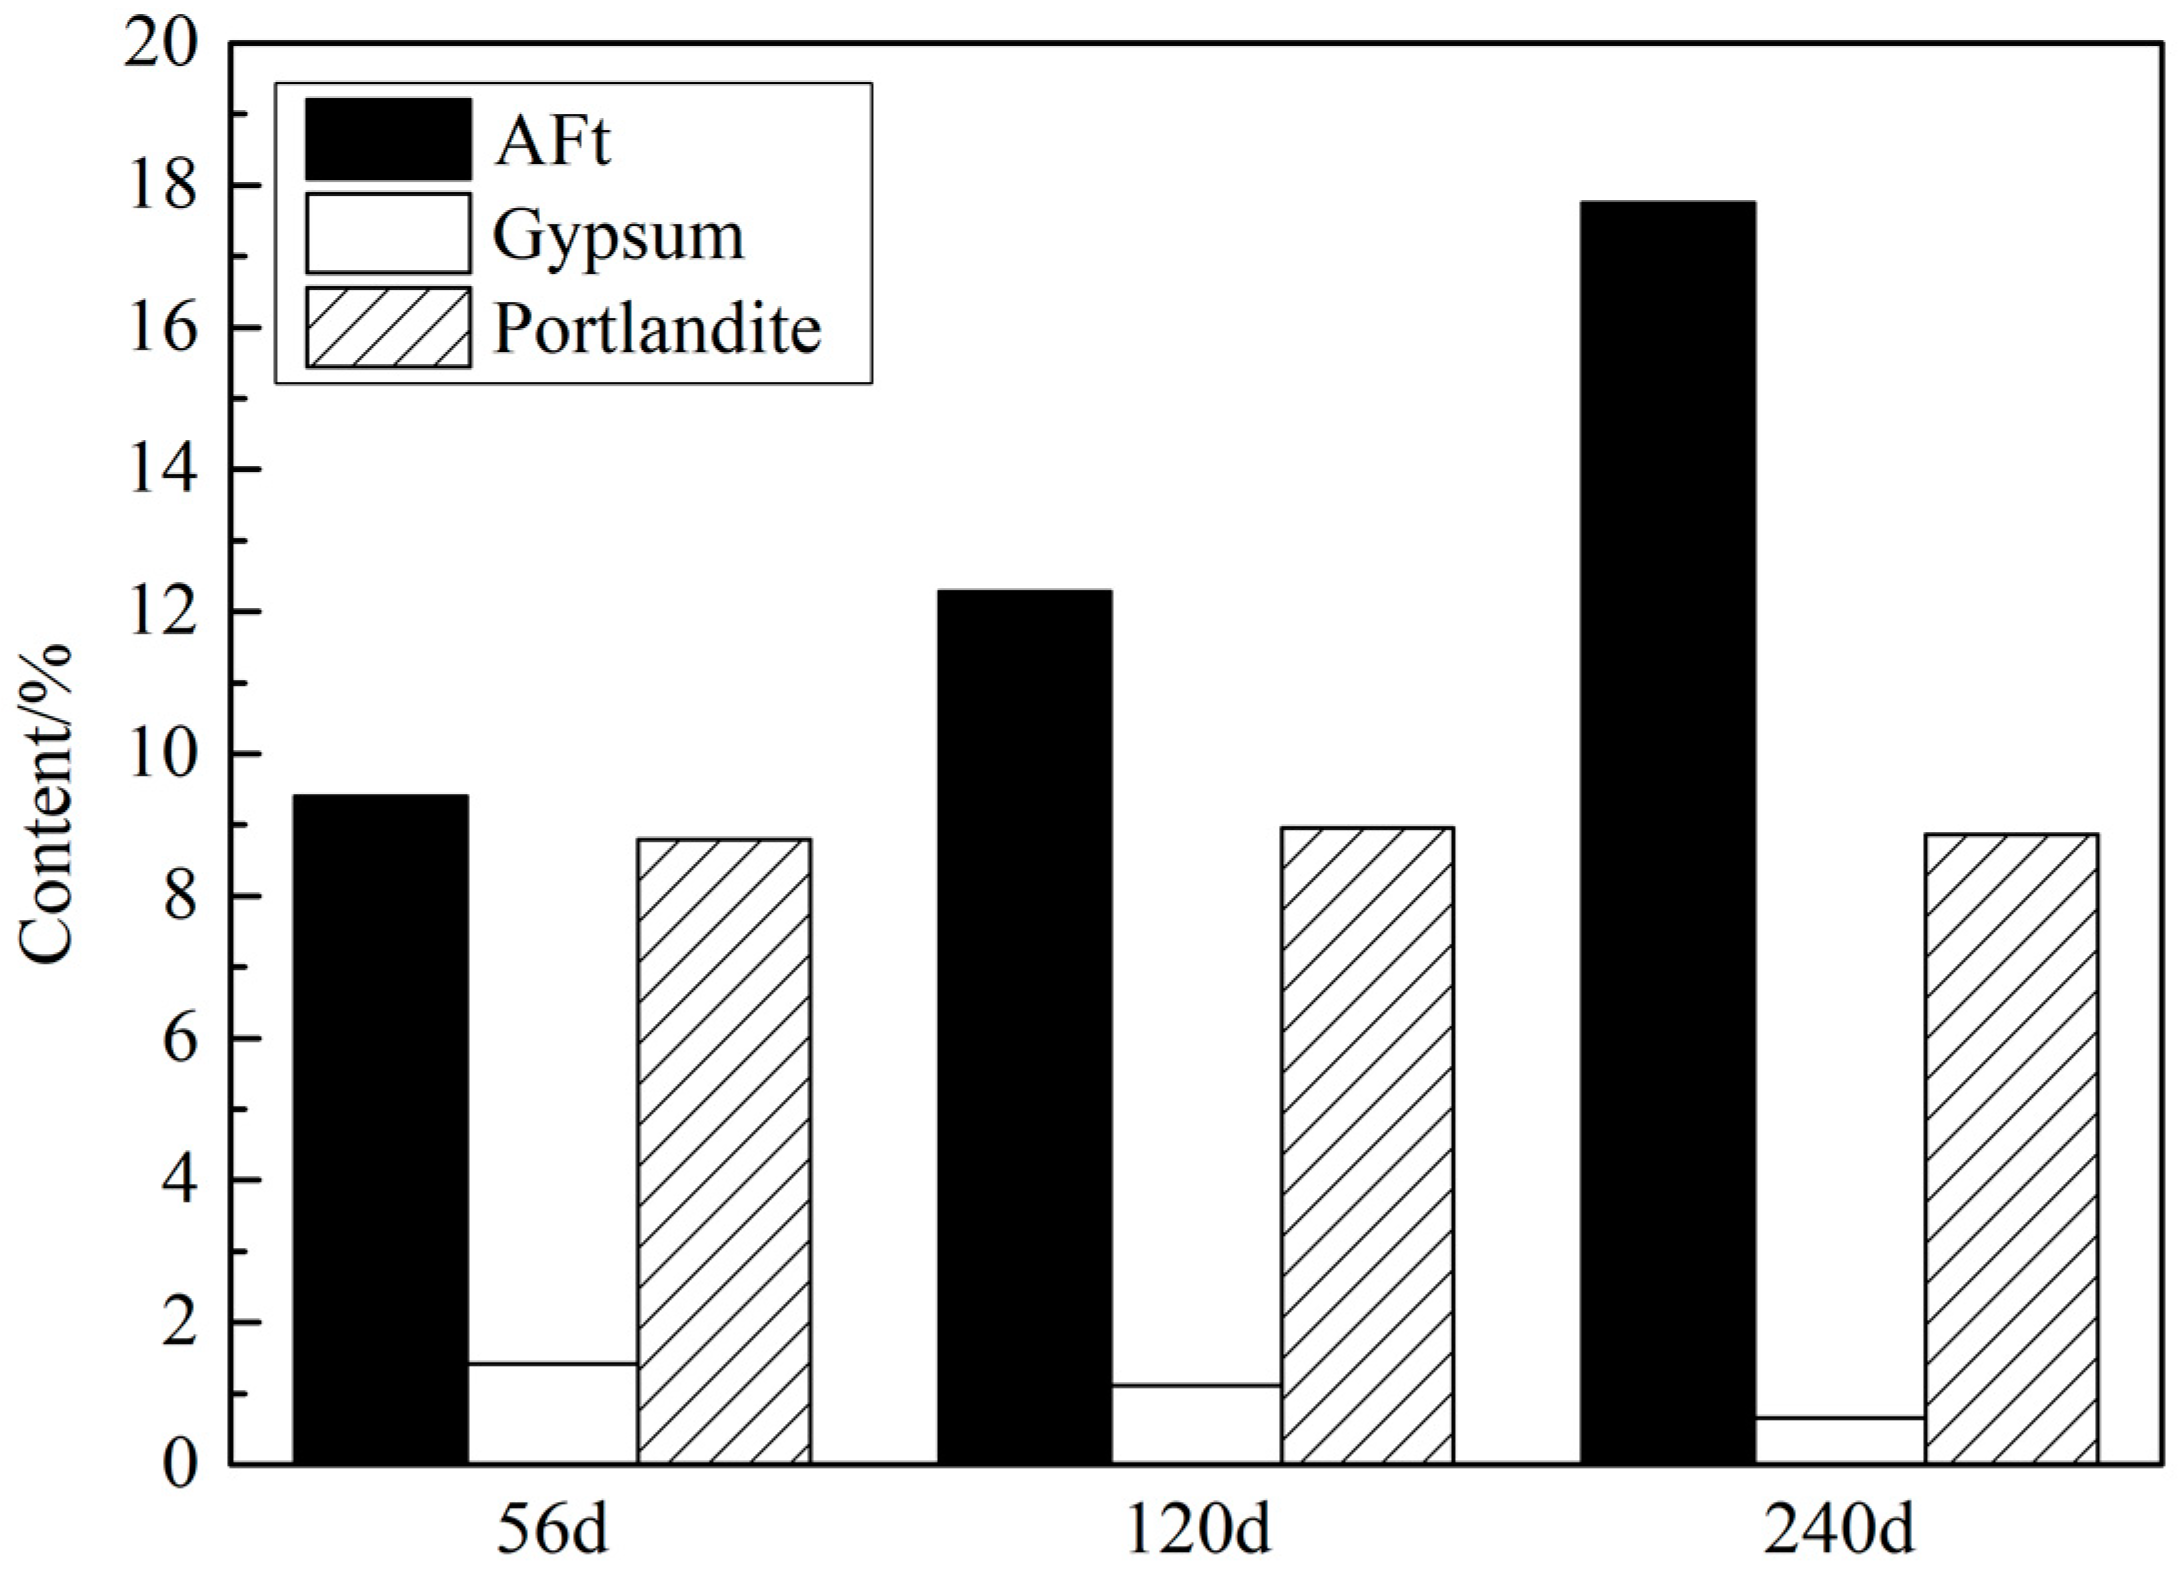
Figure 10.
Expansion of mortars with different SO3 content in aggregate.
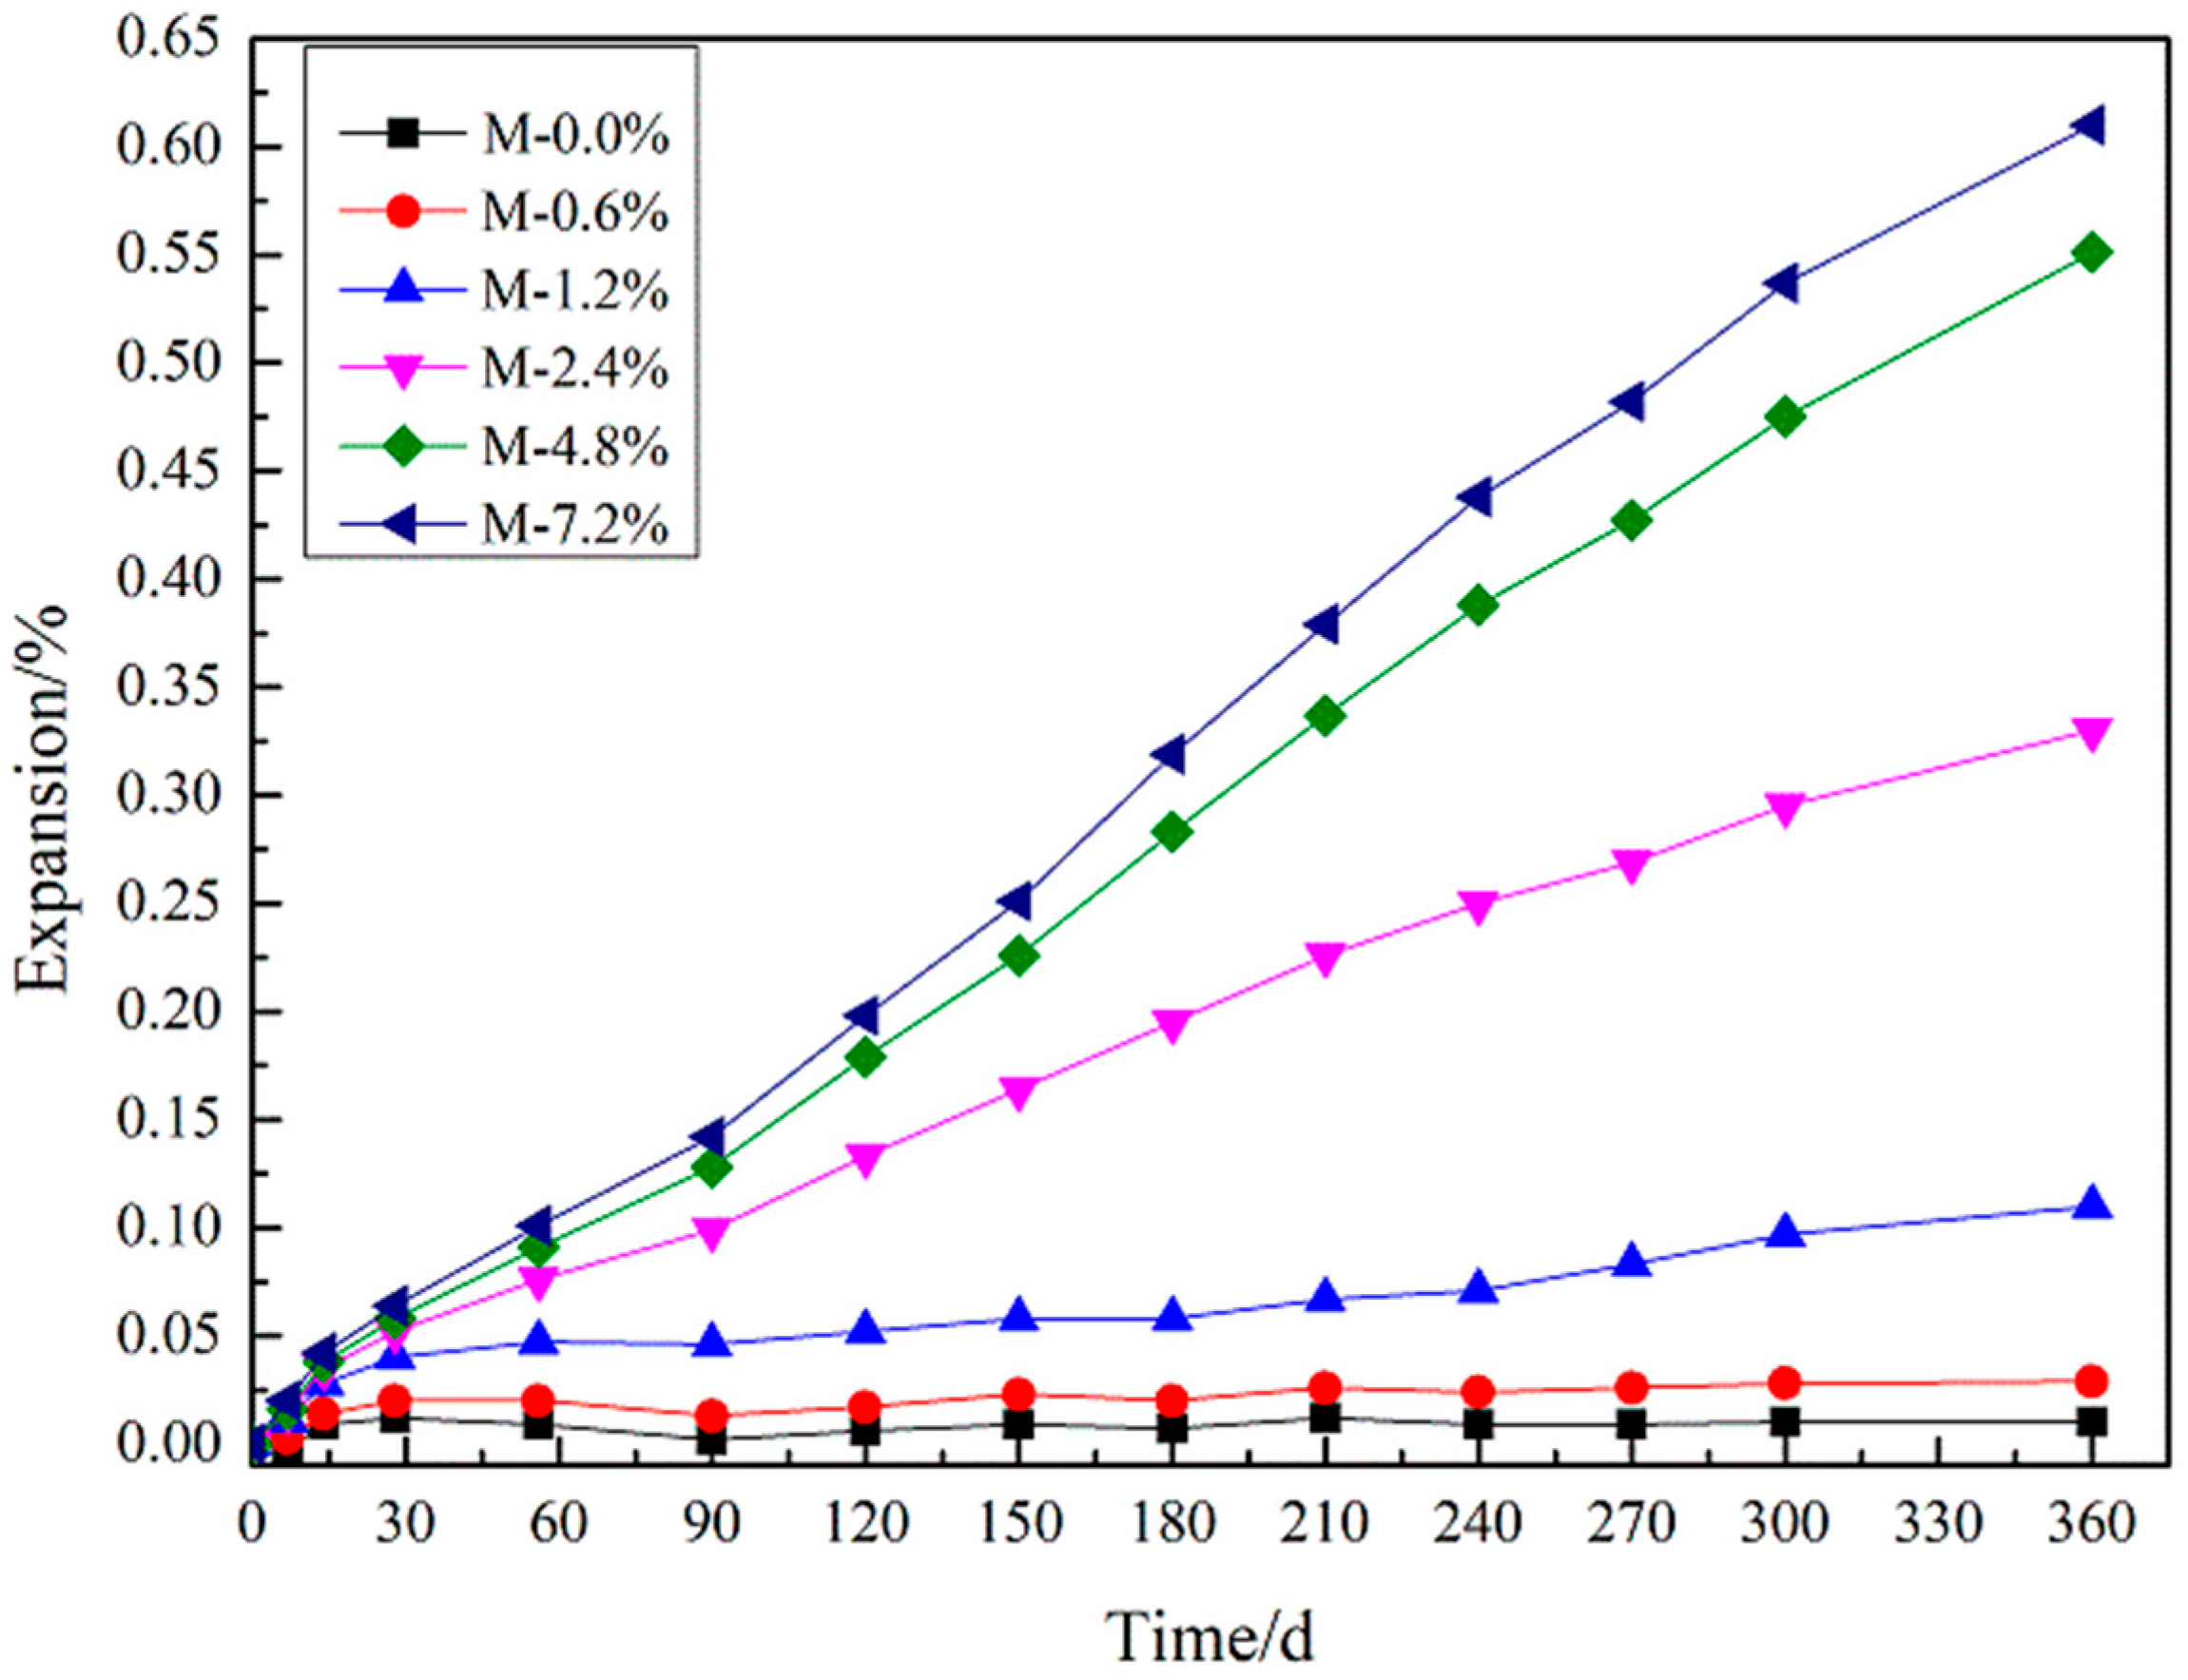
Figure 11.
Expansion of mortars added with 4.8% SO3 at different curing temperature.

Figure 12.
XRD patterns of mortars with different sizes of gypsum aggregate.
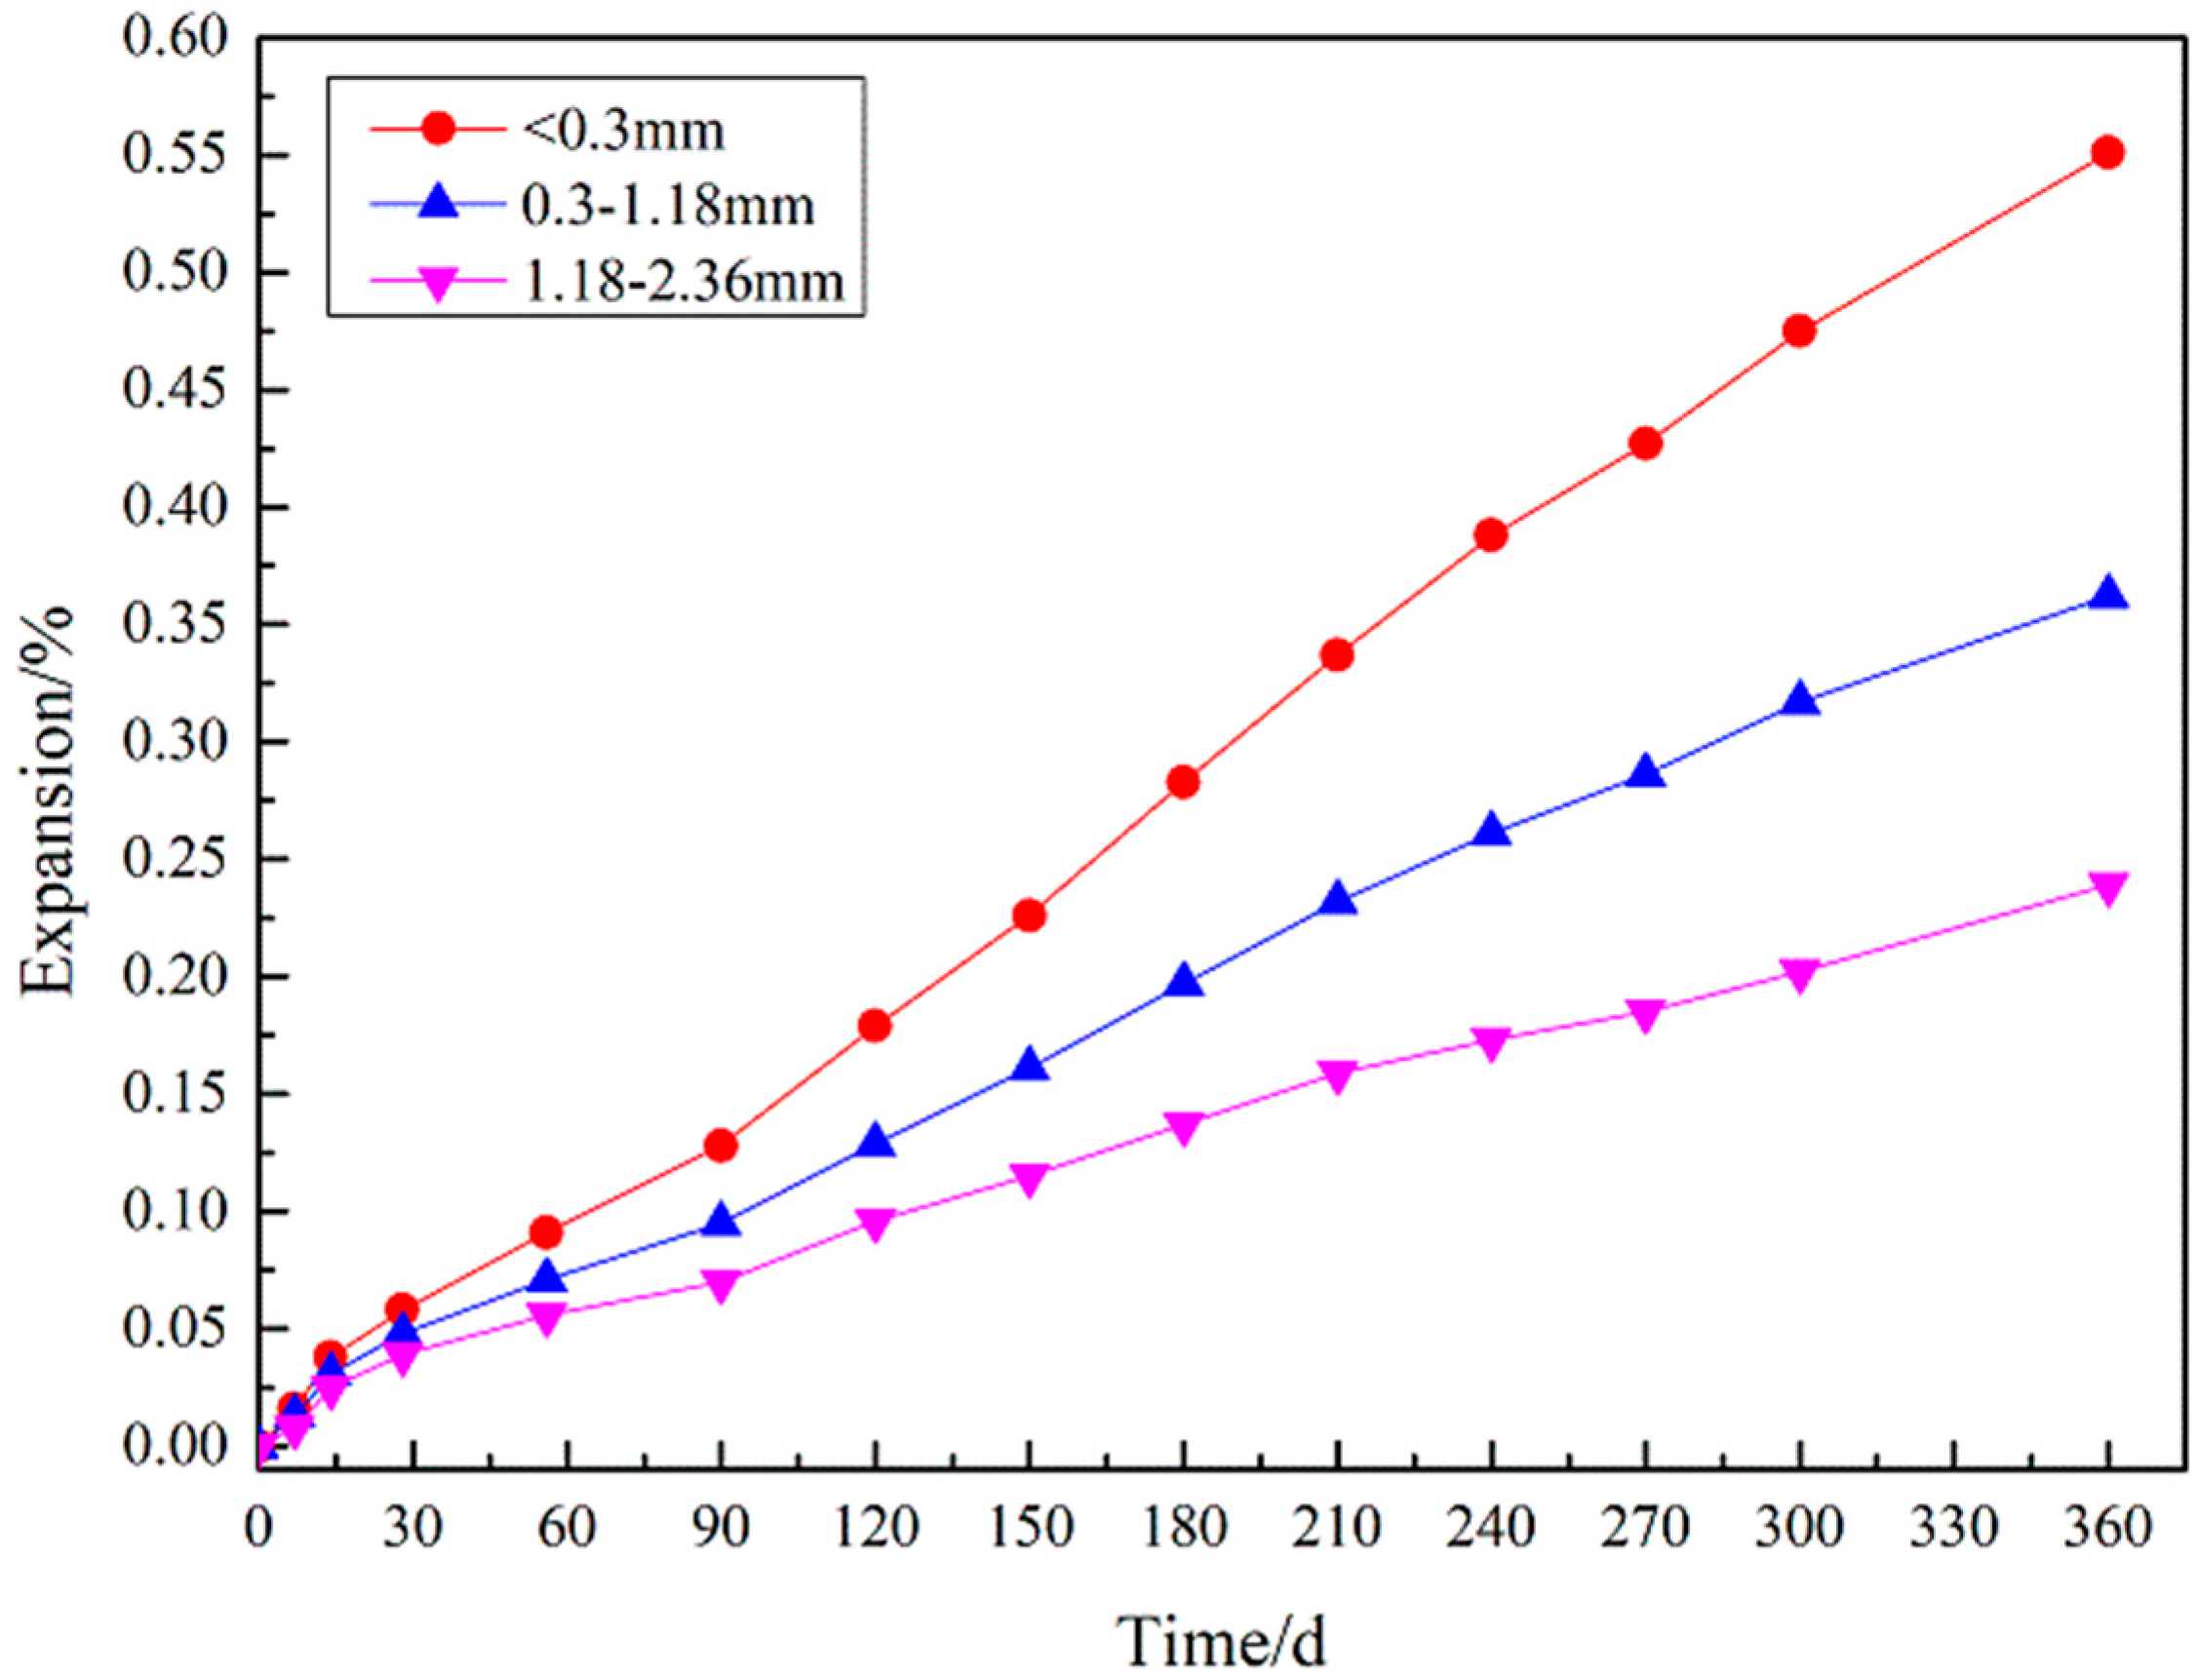
Figure 13.
Strength of mortars with different SO3 content in aggregate.
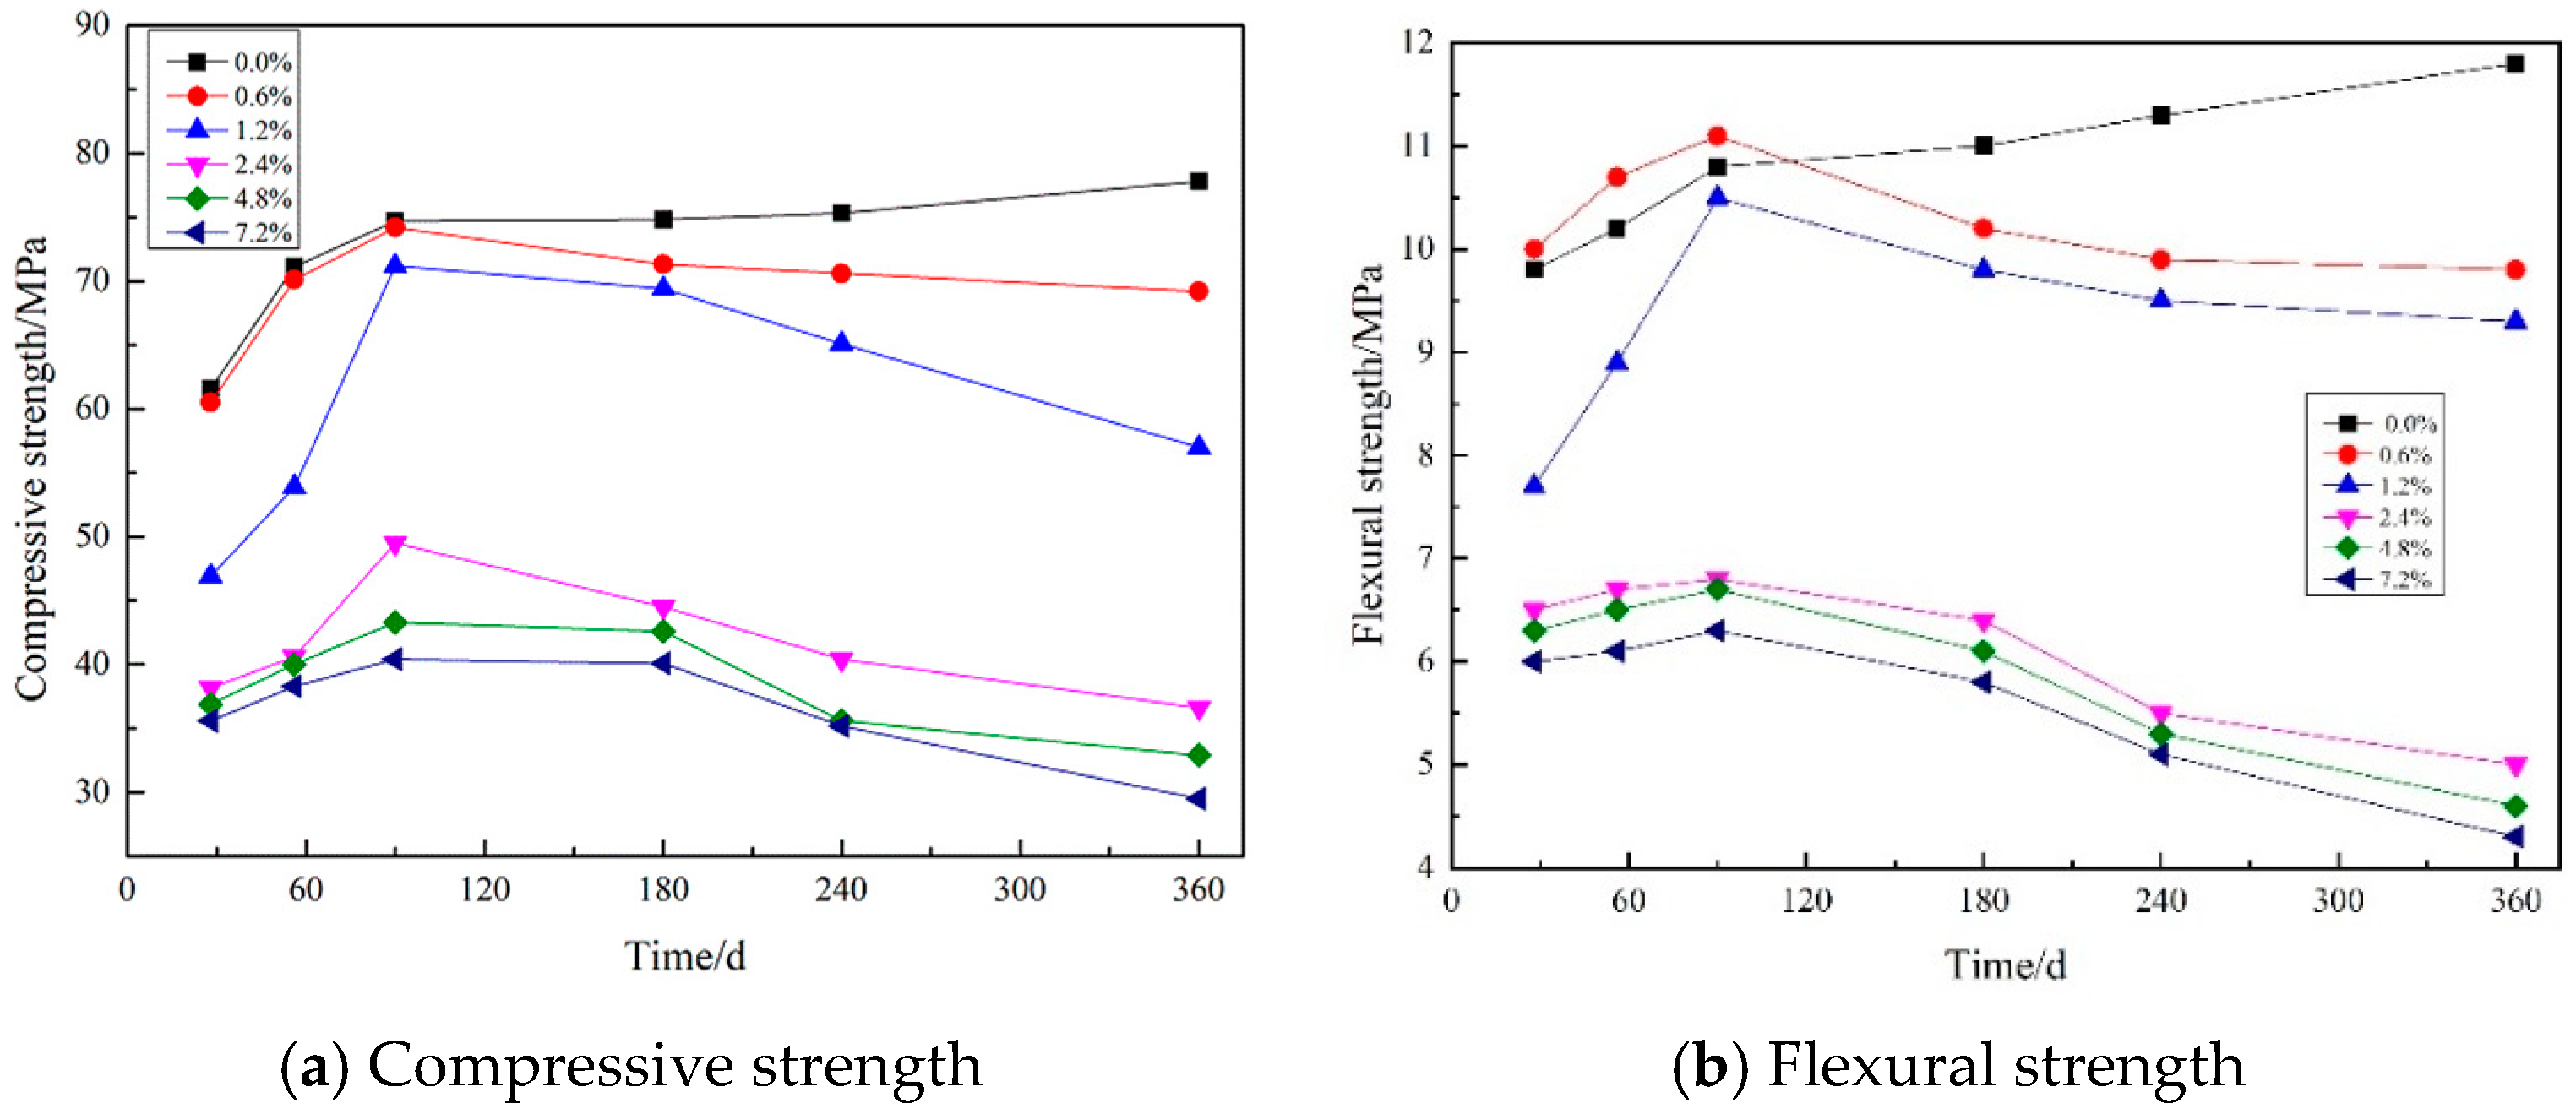
Figure 14.
Ratio of strength change in mortars with different SO3 content in aggregate.
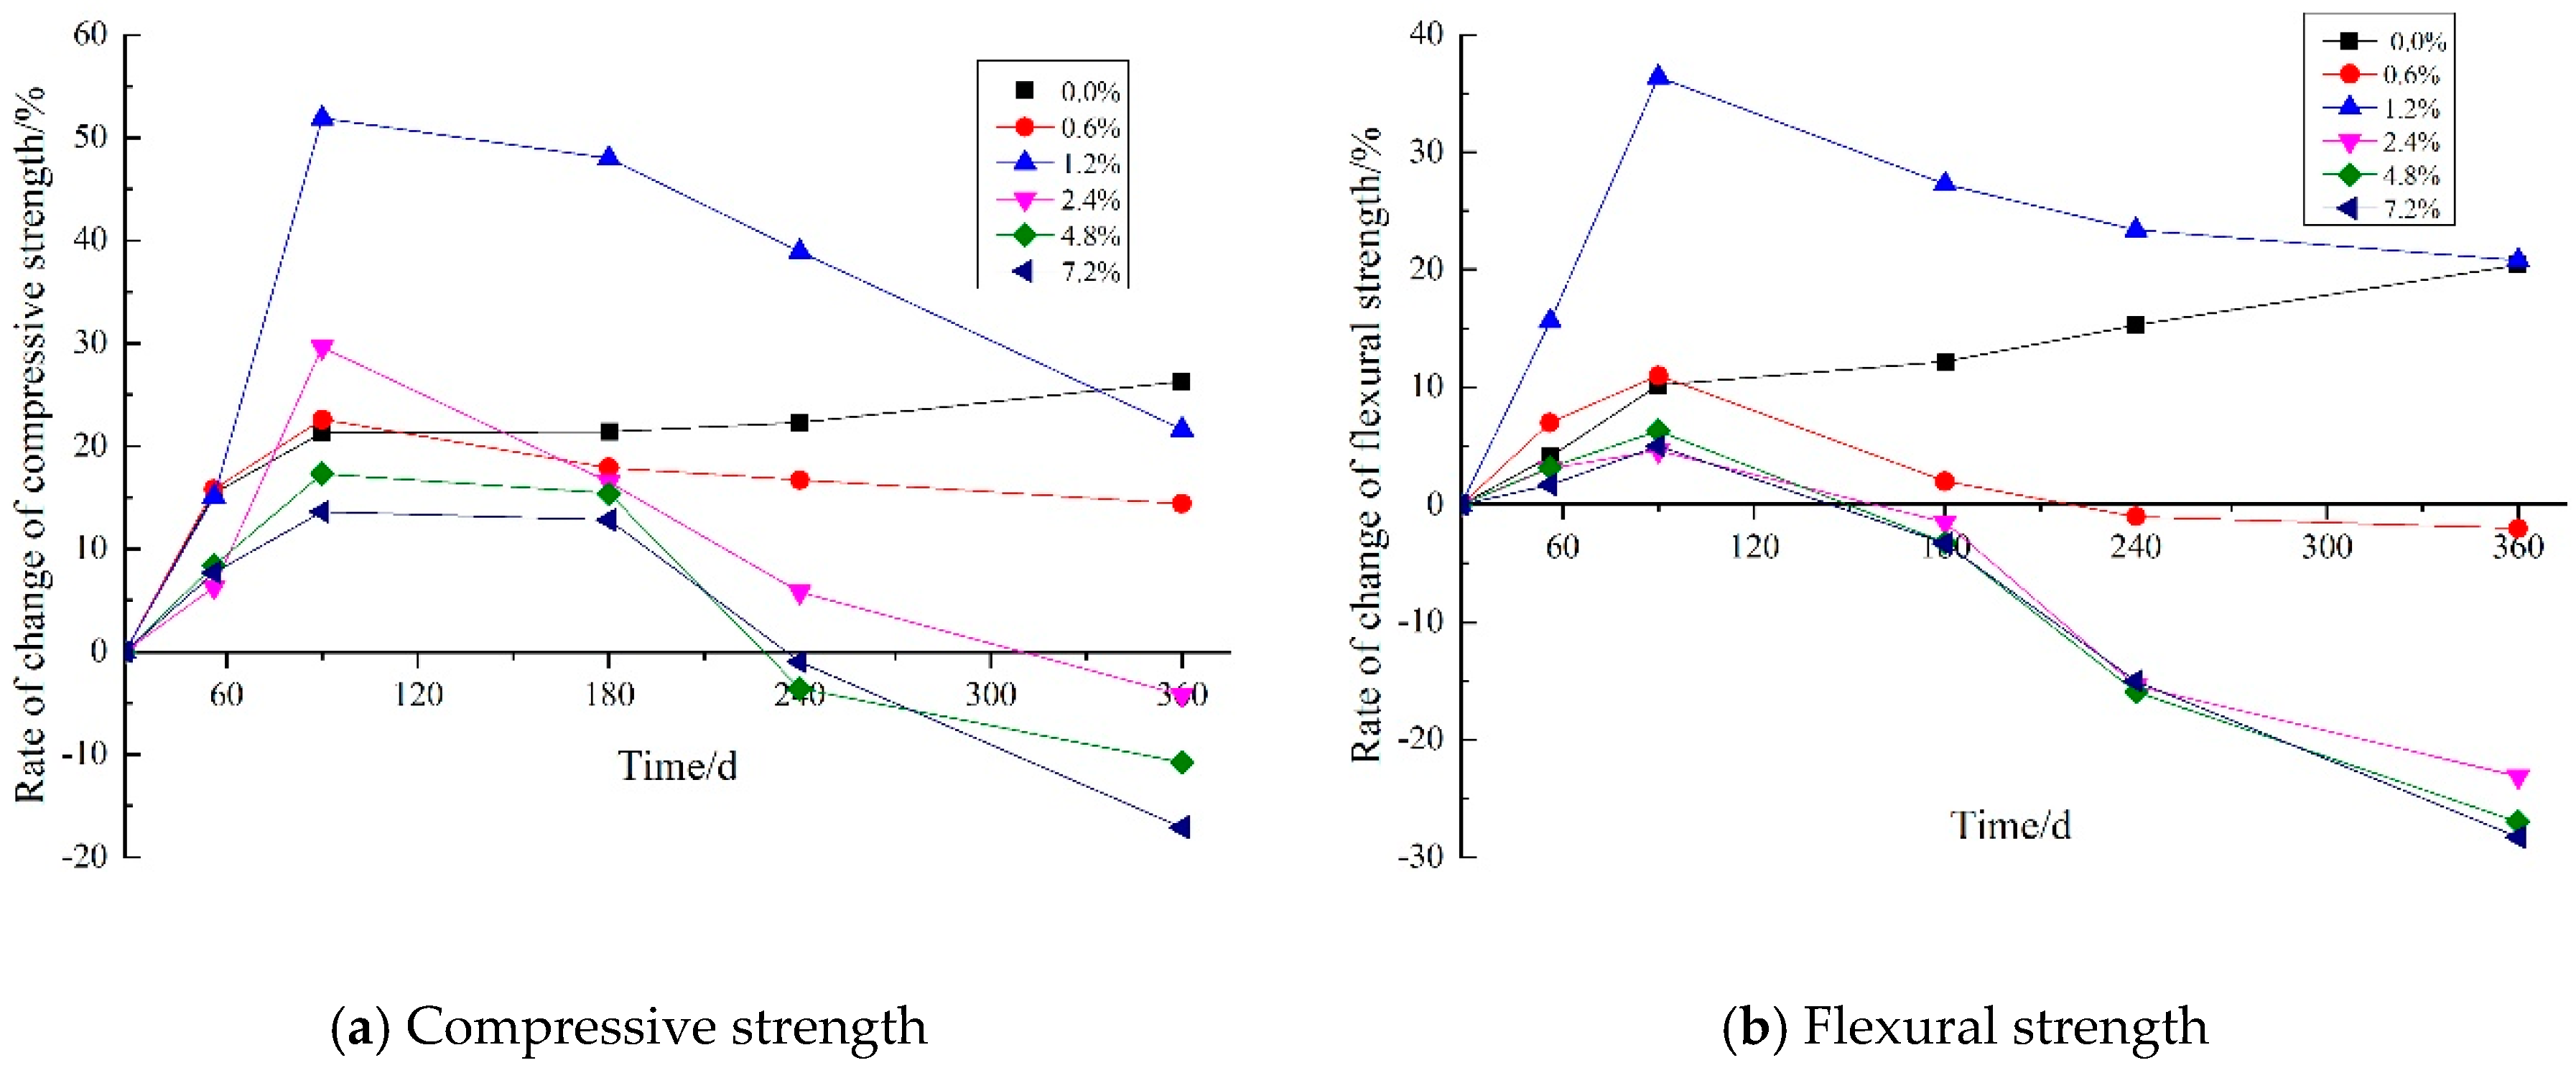
Figure 15.
Strength of mortars added with 4.8% SO3 at different curing temperatures.

Figure 16.
Strength of mortars with different sizes of gypsum aggregate.
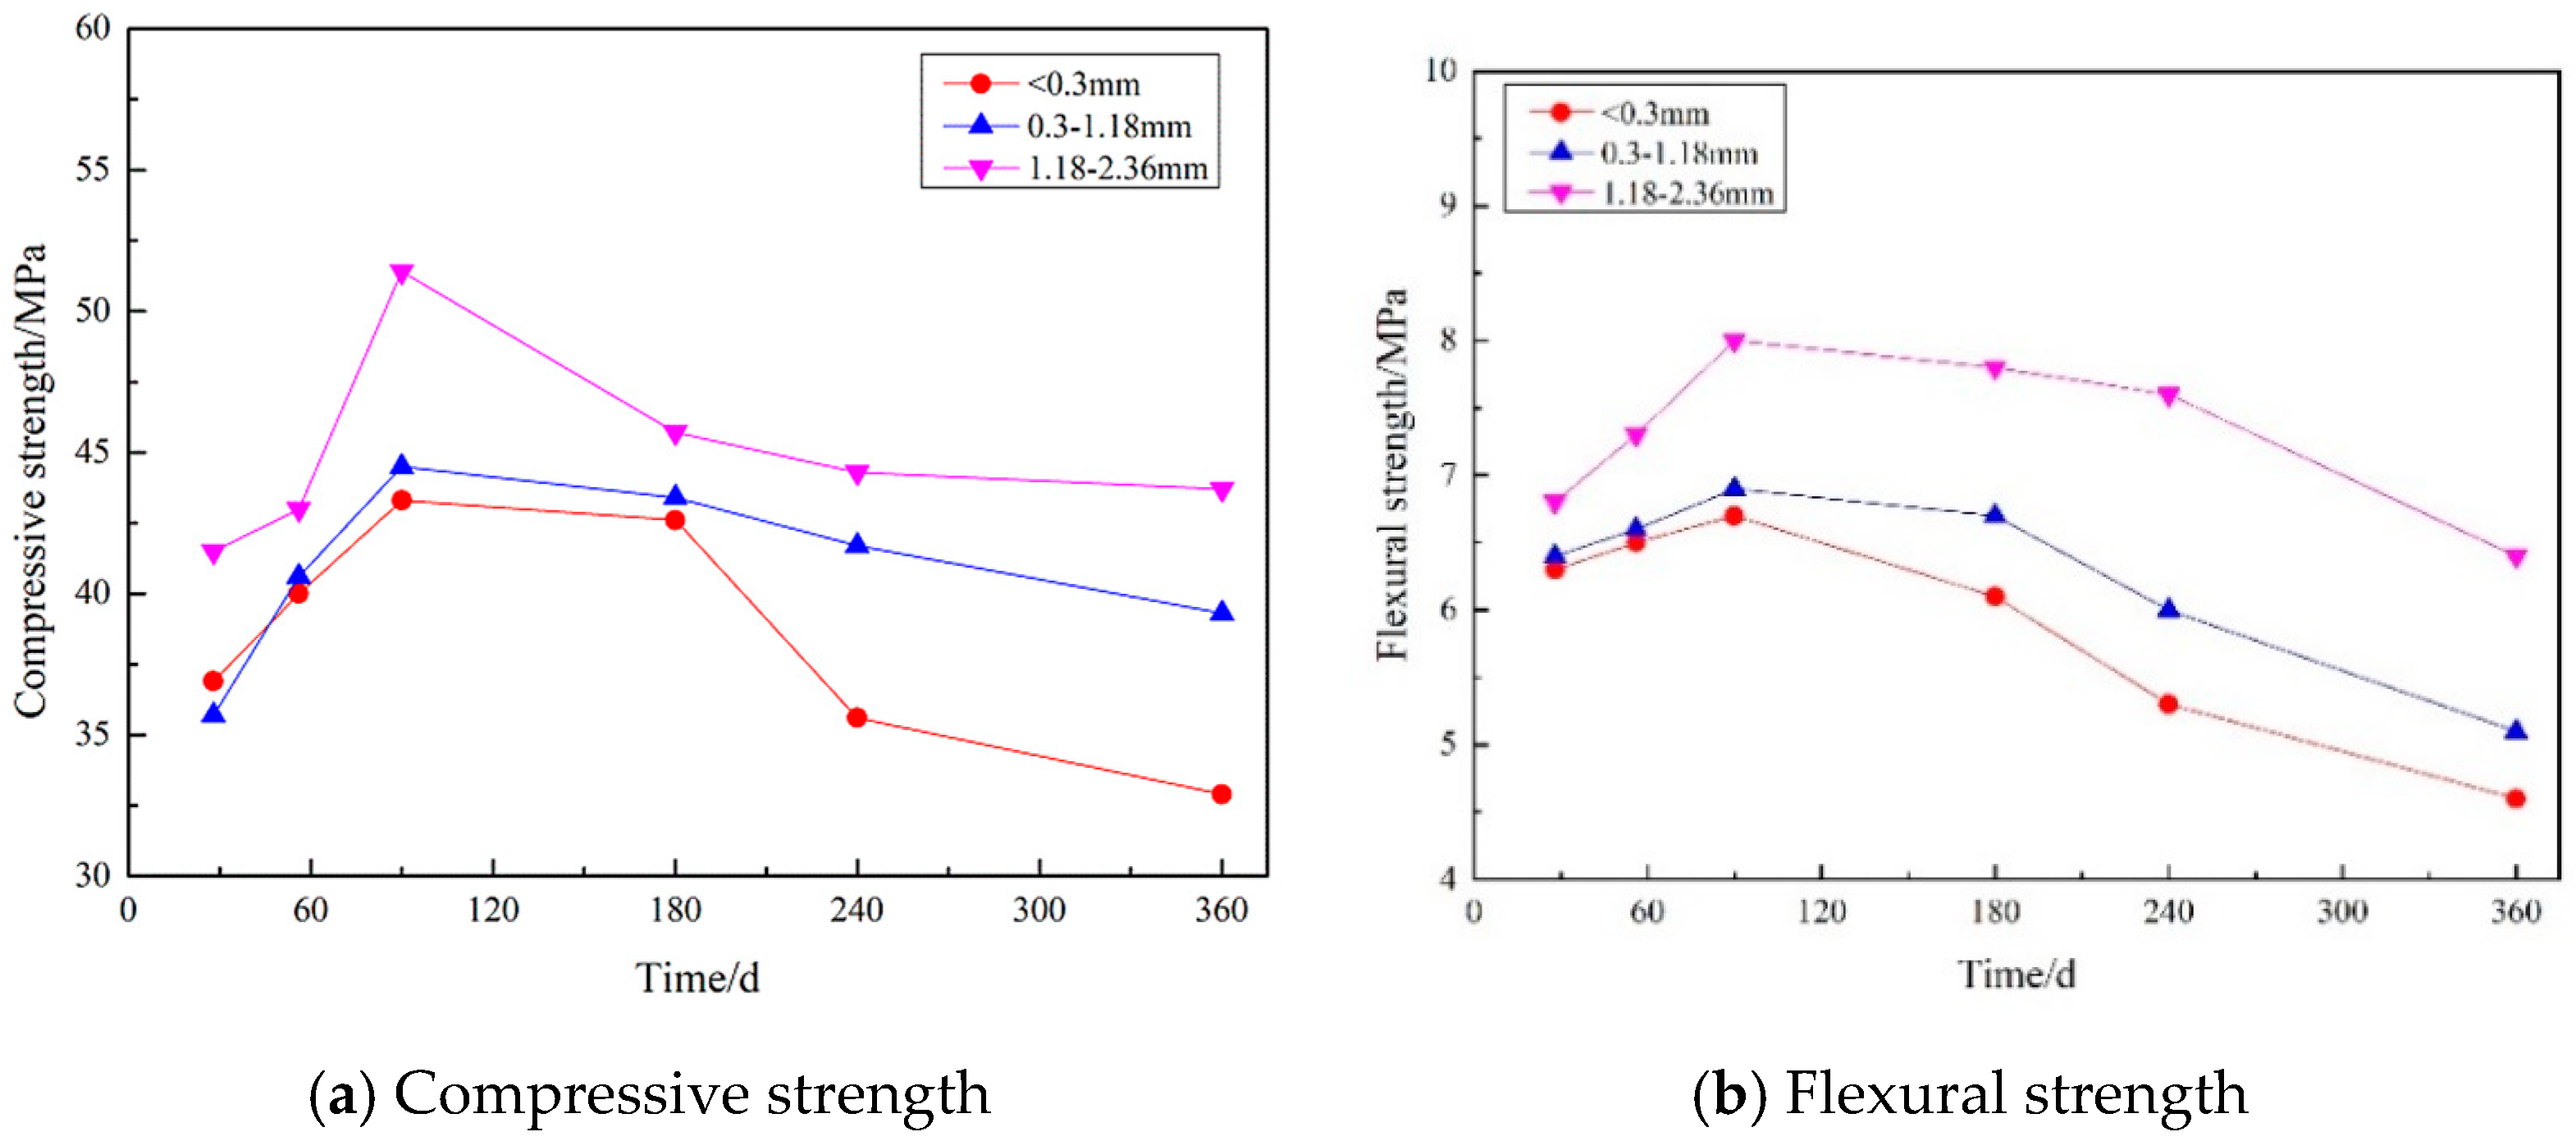
Figure 17.
Microstructure of interface and crack in pastes embedded with gypsum particles greater than 2 mm at 90 d.
Figure 17.
Microstructure of interface and crack in pastes embedded with gypsum particles greater than 2 mm at 90 d.

Figure 18.
Patterns of products at different pH values.
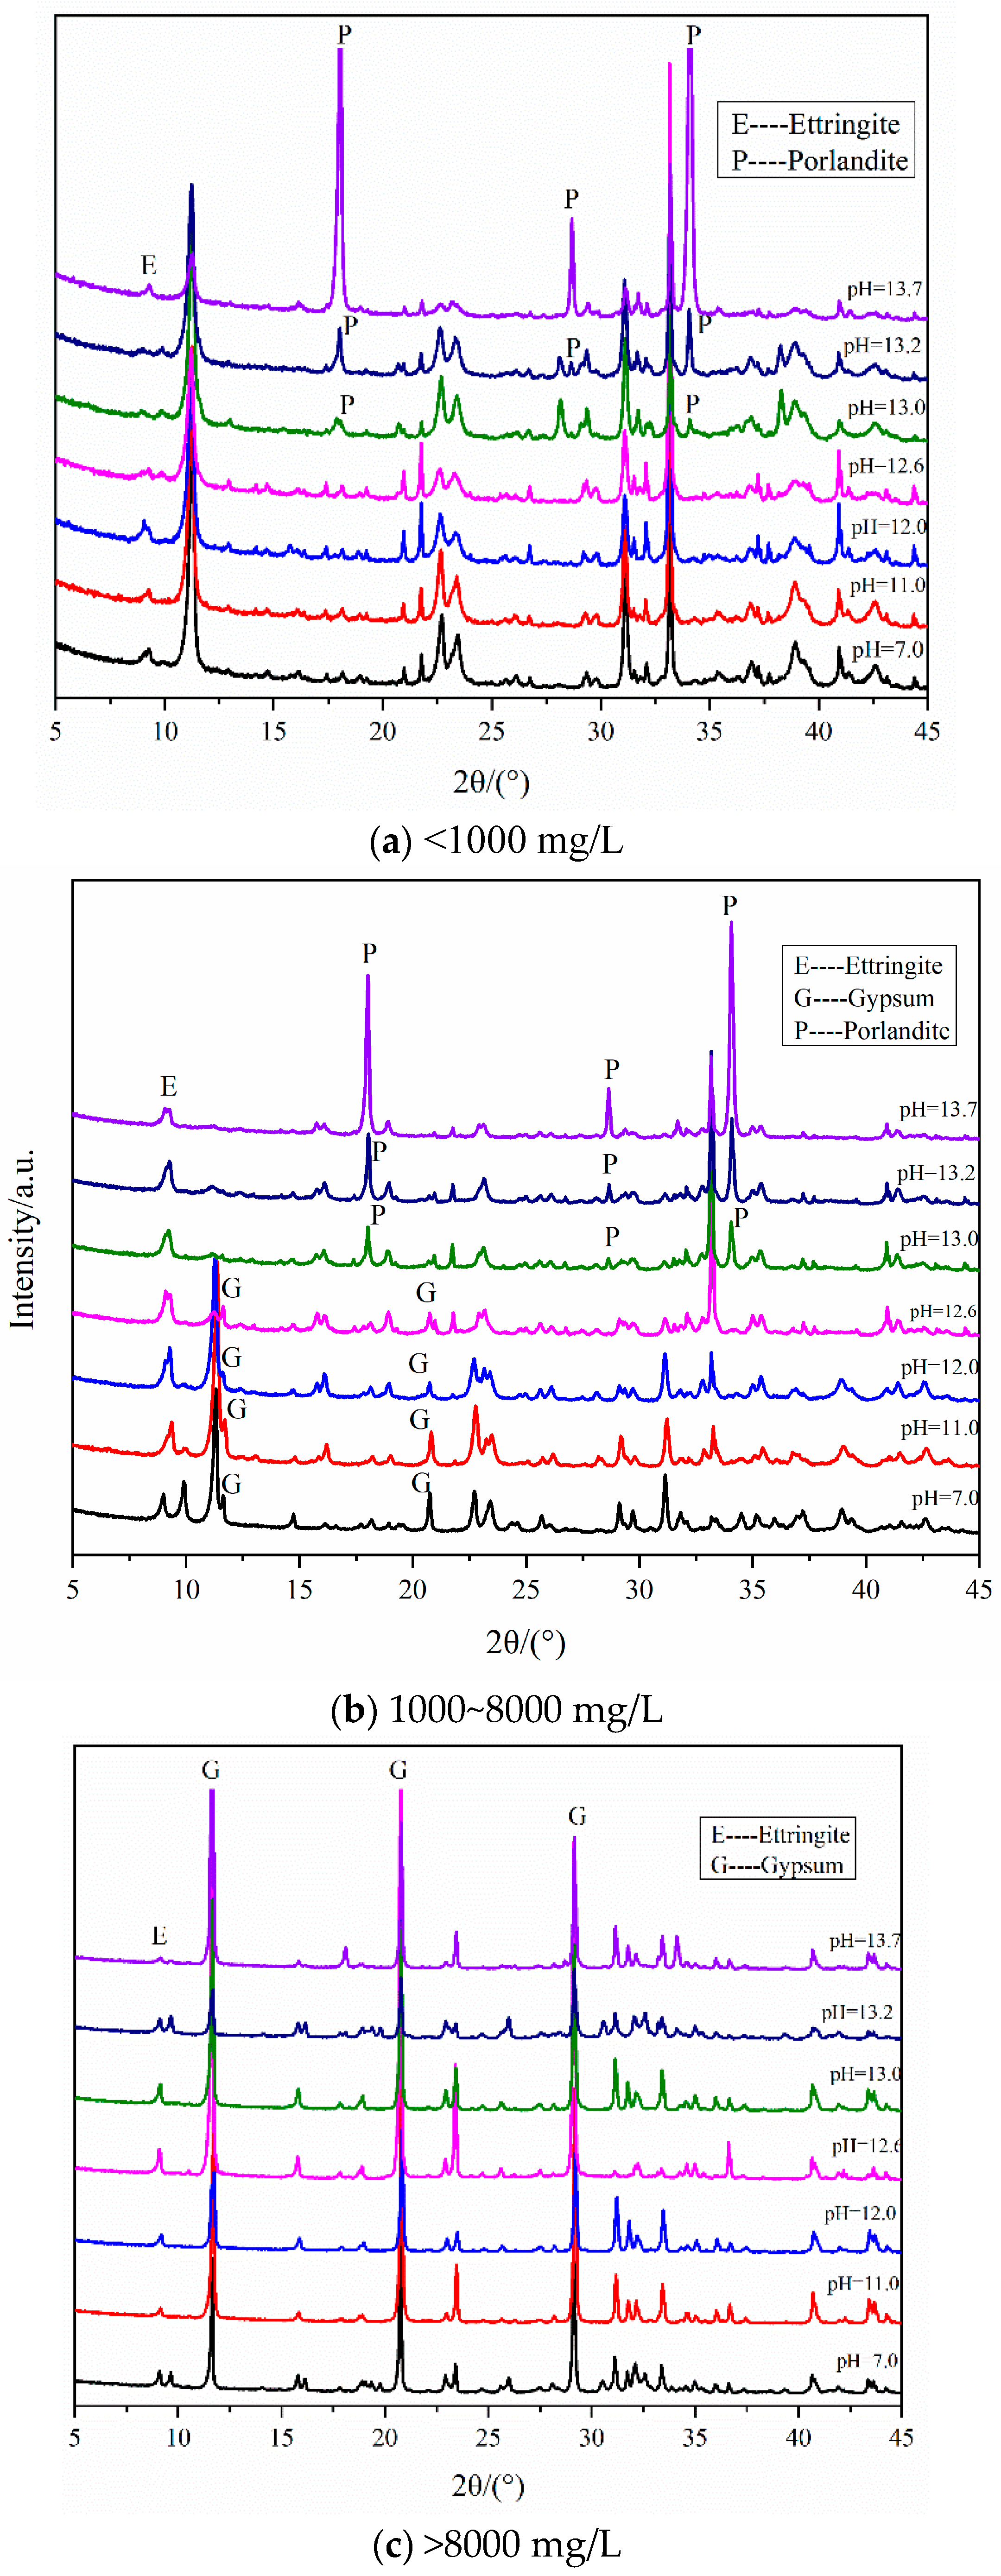
Figure 19.
Concentration of SO42- in solutions at 360 d.
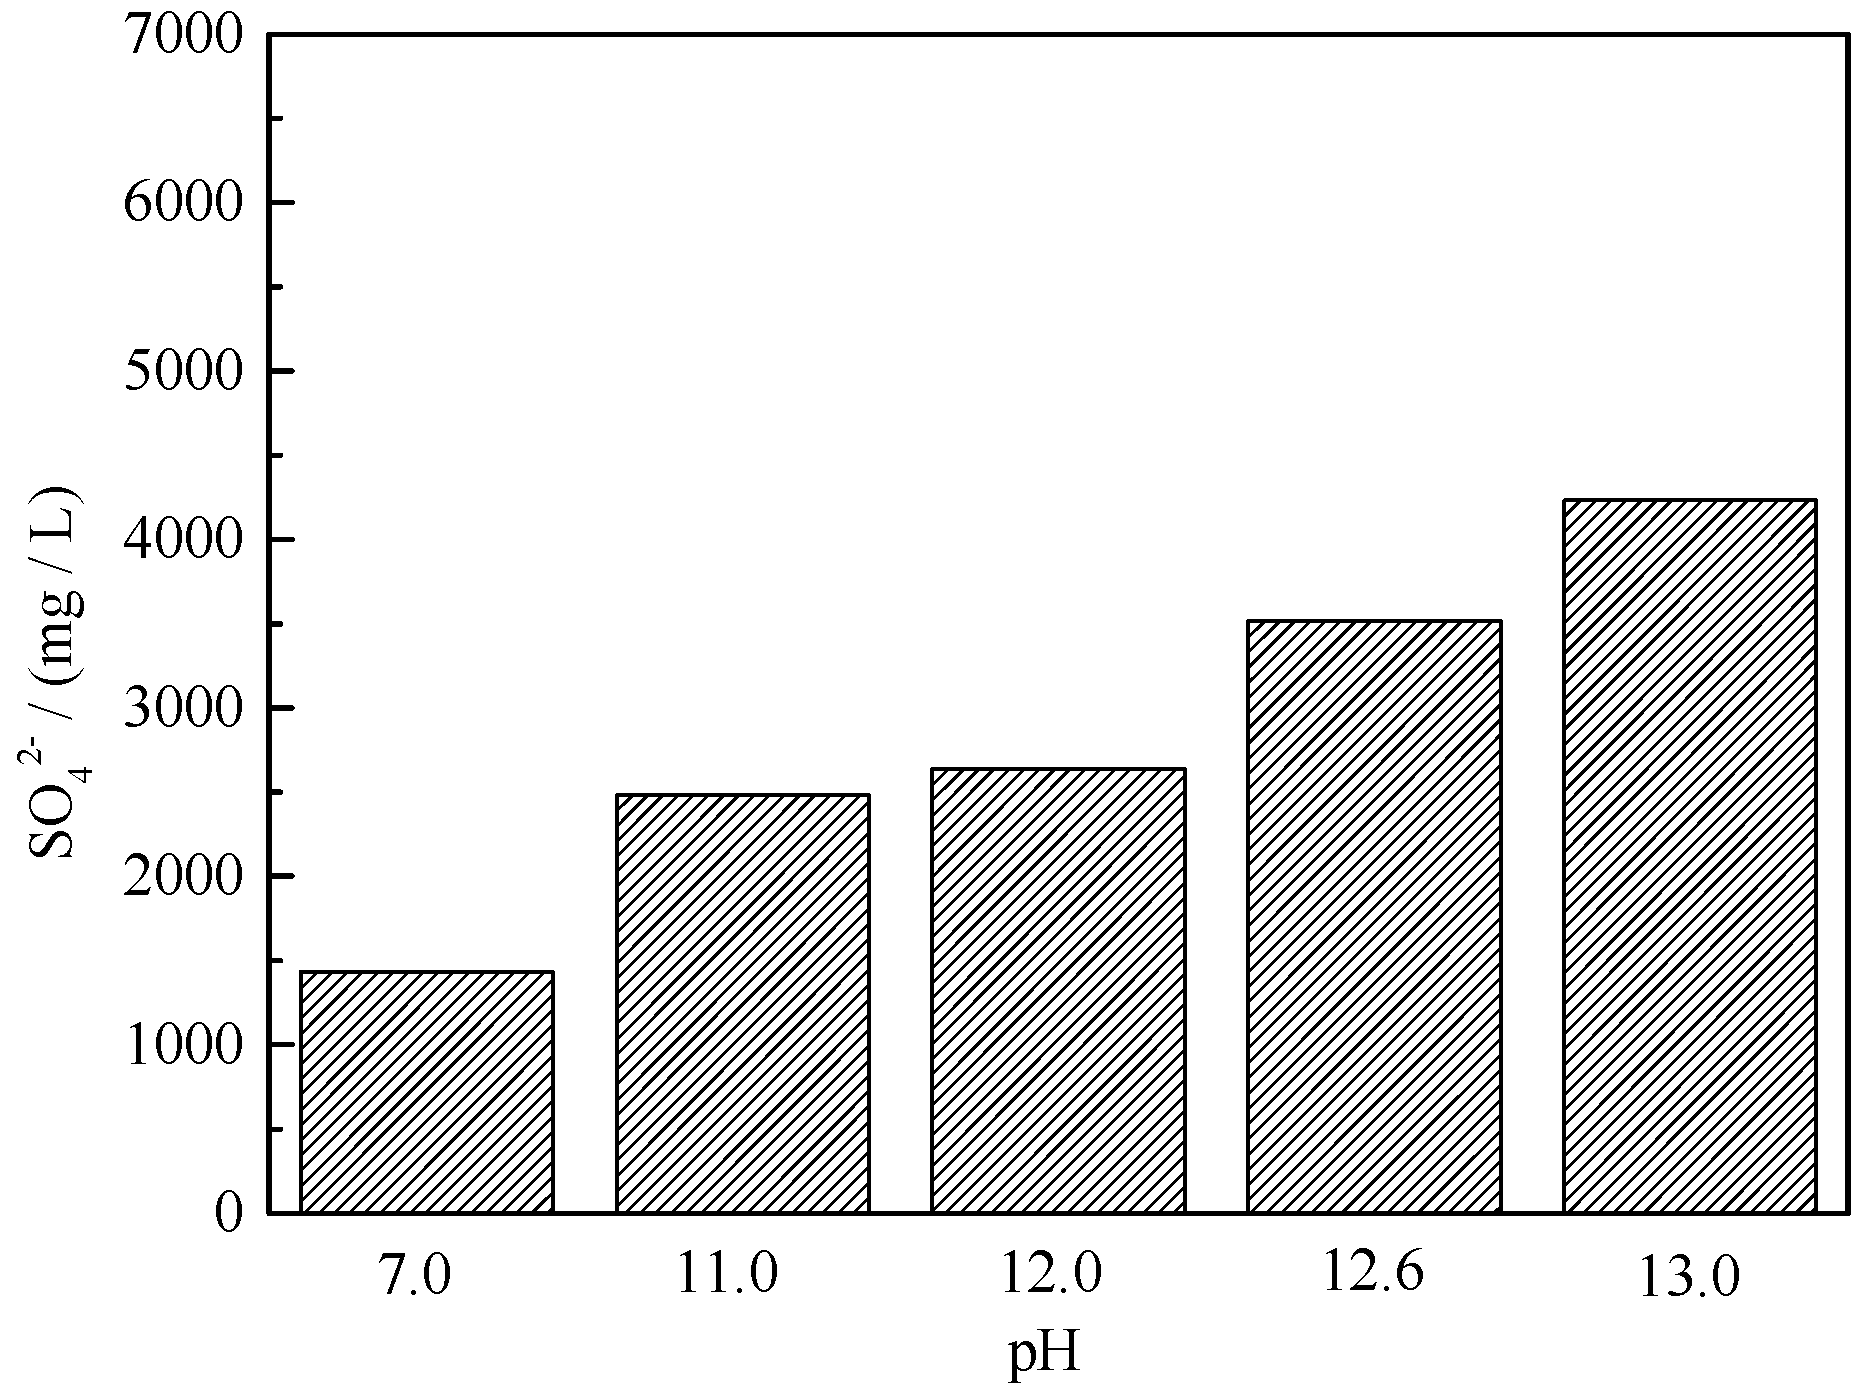
Figure 20.
Effect of gypsum dosing on pH value.

Table 1.
Chemical composition of P·II 52.5 Portland cement/wt%.
| CaO | SiO2 | Al2O3 | Fe2O3 | MgO | SO3 | Loss |
|---|---|---|---|---|---|---|
| 64.00 | 19.46 | 4.73 | 2.96 | 2.35 | 2.59 | 2.81 |
Table 2.
Chemical composition of gypsum/wt%.
| CaO | SiO2 | Fe2O3 | Al2O3 | MgO | SO3 |
|---|---|---|---|---|---|
| 34.52 | 0.14 | 0.00 | 0.33 | 0.11 | 45.65 |
Table 3.
Technical indicators of standard sand.
| Quality Index | ||
|---|---|---|
| SiO2 Content/% | Burning Loss/% | Mud Content/% |
| >96 | ≤0.40 | ≤0.20 |
Table 4.
Particle size of ISO sand.
| Samples | < 0.08 mm | 0.08~0.16 mm | 0.16~0.5 mm | 0.5~1 mm | 1~1.6 mm | 1.6~2 mm | >2 mm |
|---|---|---|---|---|---|---|---|
| ISO sand | 0 | 6.68 | 22.79 | 24.72 | 23.86 | 9.14 | 12.81 |
Table 5.
Mix proportion of cement mortars.
| Samples | SO3/% | W/C | Gypsum Particle Size/mm | Water/g | Cement/g | Sand/g | Gypsum/g |
|---|---|---|---|---|---|---|---|
| M0 | 0 | 0.5 | — | 250 | 500 | 1250 | - |
| M06 | 0.6 | 0.15–0.30 | 250 | 500 | 1233.6 | 16.4 | |
| M12 | 1.2 | 0.15–0.30 | 250 | 500 | 1217.1 | 32.9 | |
| M24 | 2.4 | 0.15–0.30 | 250 | 500 | 1184.3 | 65.7 | |
| M48 | 4.8 | 0.15–0.30 | 250 | 500 | 1118.6 | 131.4 | |
| M72 | 7.2 | 0.15–0.30 | 250 | 500 | 1052.8 | 197.2 | |
| ML1.18 | 4.8 | 0.30–1.18 | 250 | 500 | 1118.6 | 131.4 | |
| ML2.36 | 4.8 | 1.18–2.36 | 250 | 500 | 1118.6 | 131.4 | |
| M48-40 °C | 4.8 | 0.15–0.30 | 250 | 500 | 1118.6 | 131.4 | |
| M48-60 °C | 4.8 | 0.15–0.30 | 250 | 500 | 1118.6 | 131.4 |
Disclaimer/Publisher’s Note: The statements, opinions and data contained in all publications are solely those of the individual author(s) and contributor(s) and not of MDPI and/or the editor(s). MDPI and/or the editor(s) disclaim responsibility for any injury to people or property resulting from any ideas, methods, instructions or products referred to in the content. |
© 2023 by the authors. Licensee MDPI, Basel, Switzerland. This article is an open access article distributed under the terms and conditions of the Creative Commons Attribution (CC BY) license (https://creativecommons.org/licenses/by/4.0/).
Share and Cite
MDPI and ACS Style
Zhong, C.; Huang, B. Deterioration Process of Cementitious Material Properties under Internal Sulphate Attack. Appl. Sci. 2023, 13, 3982. https://doi.org/10.3390/app13063982
AMA Style
Zhong C, Huang B. Deterioration Process of Cementitious Material Properties under Internal Sulphate Attack. Applied Sciences. 2023; 13(6):3982. https://doi.org/10.3390/app13063982
Chicago/Turabian StyleZhong, Chao, and Bei Huang. 2023. "Deterioration Process of Cementitious Material Properties under Internal Sulphate Attack" Applied Sciences 13, no. 6: 3982. https://doi.org/10.3390/app13063982
Note that from the first issue of 2016, this journal uses article numbers instead of page numbers. See further details here.