
Lithium-Ion Battery Aging Analysis of an Electric Vehicle Fleet Using a Tailored Neural Network Structure
Fraunhofer Institute for Transportation and Infrastructure Systems, 01069 Dresden, Germany
*
Author to whom correspondence should be addressed.
Appl. Sci. 2023, 13(7), 4448; https://doi.org/10.3390/app13074448
Submission received: 30 November 2022
/
Revised: 9 December 2022
/
Accepted: 29 March 2023
/
Published: 31 March 2023
(This article belongs to the Special Issue Advances in Lithium-Ion Automobile Batteries)
Abstract
:Featured Application
operational planning of electric vehicle fleets.
Abstract
Within the presented research study we want to estimate the State of Health (SOH) of a fleet of electric vehicles solely using field data. This information may not only help operators during mission planning, but it can reveal causes of accelerated aging. For this purpose, we use a customized neural network that is able to process the data of all fleet vehicles simultaneously. Thus, information between batteries of the different vehicles is transferred and the extrapolation properties are enhanced. We firstly show results with data gathered from a fleet of 25 electric buses. A prediction accuracy of below 5 mV could be obtained for most validation sections. Furthermore, a proof-of-concept experiment illustrates the advantages of the fleet learning approach.
1. Introduction
The battery is the last wearing part of an electric vehicle. It accounts for a significant proportion of its economic and ecological cost. The responsible management of this asset requires both accurate battery sizing and utility assessment. System sizing usually depends on cell manufacturer specifications and accelerated aging tests. Remaining capacity and internal resistance are often the prevailing indicators of the battery’s aging state and hence its utility. These quantities have one common drawback: their measurements rely on bench testing, which is tedious, time-consuming, cell-specific and expensive. The artificial and often uniform test setups rarely reflect the actual usage behavior, a crucial factor in battery aging. Real applications are characterized by different charging and discharging cycles under diverse combinations of current rate, temperature, state of charge (SOC) and voltage, among other factors.
In the FeBaL project [1] (“Felddatenbasierte Batteriediagnose und Lebensdauerprognose”, i.e., “Field data-based battery diagnosis and lifetime prediction”), we take steps to overcome the disadvantages of usual battery measurement campaigns in the laboratory. We use real data recorded during everyday operation and consider the constraints of the usage profile exactly as they occur in practice. In the short term, using field data enables us to analyze the battery aging and detect conspicuous operation behavior. As a side effect, we save time and money by dispensing with laboratory tests. In the long term, we want to predict the application-specific capacity loss and resistance increase as well as the end-of-life (EOL) of batteries by simulating specific usage scenarios and/or usage recommendations.
We have gathered data from multiple vehicle fleets, both buses and passenger cars. This large database offers many usage scenarios, covering a wide variety of input ranges and combinations. It also allows us to develop and examine machine learning (ML) algorithms that go beyond hitherto published approaches.
In this paper, we present our battery model, a neural network tailored to lithium-ion batteries and applied to data generated by electric buses and cars. Originally developed for the analysis of a single vehicle, we extended our method to handle data of a vehicle fleet. This way, we optimize the use of our data based on a simple idea: more buses mean more data which cover larger operation ranges. The additional information can be transferred between vehicles and usage variations can be compensated for.
The paper is divided as follows: after summarizing the contributions of this paper and giving some examples of their possible applications, the first main part highlights the features of our field data. Besides an overview of the different fleets we have at our disposal, we explain the data selection and which criteria must be met to qualify for the neural network training. Following a short review of the current state of research in battery aging diagnostics, we explicate the structure of the neural network model for vehicle fleets in the second part of the paper. We characterize features of the training process, as well. The third part focuses on our findings: we first show that our fleet model is valid, predicting the voltage with a root-mean-square error (RMSE) below 5 mV. Then, we look at the promising results of our transfer learning approach, where using data from across the fleet has improved the error rate. We also use our fleet model to investigate capacity decrease and resistance increase as scaling factors for a more realistic SOH definition. Finally, we give an outlook of our research plans for the fleet model in the future.
2. Contributions
Our research provides both methodological and empirical novelties to the field of battery diagnosis. We are the first to use data of an entire vehicle fleet to train our neural network. We also pave the way to an application-specific SOH and lifetime prediction. These insights can be used in many applications:
- Fleet managers may use the information to optimize task planning. Furthermore, predictive maintenance can be utilized.
- Cell manufacturers gain information on how the lifetime under real-world conditions compares to the rapid aging tests which are commonly performed.
- Battery manufactures can supervise the compliance of warranty conditions. Warranty extensions may be defined and sold subject to specific usage scenarios.
- Due to the holistic analysis of fleet vehicles, anomalies can be observed. This can help detecting critical states and may prevent battery accidents.
3. Research Data
3.1. Data Description
We have access to field data of electric buses provided by several public transport companies. In addition, we have already been logging a car fleet for almost two years. An overview can be found in Table 1.
The data meet a number of criteria necessary to achieve the objectives of the FeBaL project:
- All vehicles operate the same NMC battery type. The difference in energy content of the batteries emerges only from the different number of parallel strings. This warrants comparability of the data.
- The buses use different charging strategies. Whereas some are only charged in the depot at the end of the day, others are charged opportunely, i.e., they are also recharged several times during a shift at fast charging stations (see Figure 1). The charging strategies can typically be characterized as follows:
- ◦
- Depot: several hours charging duration, C-rate of less than 0.2 C,
- ◦
- Opportunity: less than 15 min charging duration, C-rate of more than 1 C.
Looking at both depot and opportunity charges guarantees variation in the data, e.g., small and large Depths of Discharge (DODs), which will lead to different aging rates.
- The vehicles, especially the buses, generate enough monthly energy throughput to ensure a detectable battery aging soon, see Figure 2.
- We can derive the necessary input data from the logged battery signals with the required sample rate, accuracy and resolution.
In a proof-of-concept study, we analyzed the subfleet 3, a bus fleet of opportunity charges, because these vehicles were logged for the longest period, see Table 1.
3.2. Data Selection
Our approaches rest upon the analysis and comparison of different devices as well as battery systems. Since we rely on outside data sources, we occasionally had to deal with missing signals, name changes, change of sampling rate, etc. Thus, we established a canonical data model to ensure reliability and efficiency. All signal names were standardized. We also normalized the battery signals to cell level, such that they can be compared to laboratory tests and valued at specific parameters. This also eases visualizations and comparisons.
Not all sections are suitable for SOH estimation. If there are data gaps at the start of a section, the initial battery state (e.g., SOC) is difficult to determine. Also, sections with small DODs only provide limited information for capacity estimation. Thus, only sections without data gaps and with a minimum DOD are used for SOH estimation. Furthermore, we exclusively use operation/discharge sections. There are three reasons for this: firstly, charge sections usually are not logged, because the BMS is shut down when the vehicle is turned off. Since we want to establish a universal approach, it should be independent of the existence of charge sections. Secondly, the dynamics during operation and charging are very different (strong varying currents vs. constant currents). Capturing both in one model adds unnecessary complexity to the model. Thirdly, this allows us to use charge sections with large DOD to evaluate the capacity estimations.
There is a twofold split of the data (see Figure 3). Firstly, whole sections are partitioned into a training and a validation data set. The validation sections are not used during the training process in any way and solely serve validation and evaluation purposes. Secondly, the data in the training set are once more split into training and validation points. These “training validation points” are used to perform early stopping. This prevents overfitting by terminating the training process if the fit on this second set of validation points does not improve.
4. Neural Network Model and Training
4.1. Current State of Research
Approaches to detect or predict the aging state of a battery can roughly be classified into three categories:
- (1)
- Model-based approaches often use algebraic or differential equations to model the physical and/or electrochemical behavior of battery degradation. In general, they are very accurate, but complex and require special measuring equipment to gather the necessary information.
- (2)
- Data-driven approaches treat the mechanisms within the battery as a black box. Instead, they use historical data to build a mathematical model and evaluate the aging state by statistical or ML methods. They are very flexible, only have to satisfy a few assumptions, but need a lot of data to accurately generate the model.
- (3)
- Hybrid approaches exploit the respective assets of both model-based and data-driven approaches.
A comprehensive review with descriptions, examples, advantages and disadvantages of all categories can be found in Hu et al [2]. Regarding the application to field data an overview can be found in [3].
The electrochemical modeling of batteries achieved many scientific insights about battery behavior and aging processes. Most work is based on the Doyle-Fuller-Newman (DFM) model [4,5]. The Single Particle Model is a simplification of this model and widely used [6,7,8]. It reduces the computational effort and makes it more applicable to state estimation tasks. Like other DFM models, it still requires deep knowledge about electrochemical parameters of the cell. There are only few attempts to apply this model to field data [9].
Several “classic” ML methods have been adapted for and applied to batteries to predict the SOC and SOH, e.g., Bayesian and Gaussian processes, Kalman filters, (Deep) Neural Networks, Random Tree/Forest, Regression, Support Vector Machine and combinations of these. Ng et al. [10] recently published a survey of the mentioned methods.
In hybrid approaches, physical or heuristic models are combined with data driven models. The later update the relevant parameters to simulate aging effects. Using equivalent circuit models (ECMs) together with extended Kalman filters was investigated extensively [11,12]. Current research is focusing on finding most robust estimation approaches [13,14].
Because of its comparatively high flexibility and accuracy, the neural network approach is very popular [15]. However, it is most often applied to lab data, either obtained by measurement campaigns with artificial parameters or synthetic drive cycles [16,17,18,19]. Of the small number of publications which used actual field data [20,21], many analyzed charge sections to diagnose aging [22,23,24].
Working with field data usually entails having little information about the used cell and limited laboratory information. We therefore have chosen a hybrid approach, that uses a structured neural network coupled with an ECM. While there are some examples in the literature which also employ this strategy [25] none have explored how the training of the network could benefit from the additional information of an entire vehicle fleet.
4.2. Fleet Model Structure
The structure of the fleet model is motivated by the following requirements (summarized in Figure 4) and their respective implications:
- Capacity tests cannot be carried out during the conventional operation of a vehicle fleet. The training of the fleet model is thus restricted to the signals measured by the battery monitoring system. We therefore fit the model to the measured voltage and use capacity estimations (for instance from dedicated charging with small currents) only for validation purposes.
- In contrast to existing approaches, we want to create a model that includes multiple devices. Moreover, information transfer between the fleet vehicles should be enabled.
- It should be possible to incorporate existing domain knowledge (for instance open circuit voltage (OCV) curves) and recognized constraints (only increasing resistances/decreasing capacities) into the model.
- The model should be extendible, such that we can couple it with an aging model that not only describes the battery aging of the fleet vehicles but also determines aging stress factors and predicts the aging until EOL.
- We want to perform virtual experiments to analyze the battery’s SOH according to different usage scenarios. The SOH is typically defined as the relative capacity of the battery; in some cases, resistance is also considered. The impact of both parameters on aging strongly depends on the conducted operation. So, in real applications a scenario-based SOH definition might be more relevant, e.g., for the feasibility of a specific usage. This approach leads to a natural weighting of these aging parameters. This can be beneficial for route planning etc.
- The model should be scalable, i.e., it should also work with larger fleets.
These requirements are satisfied by the proposed model structure illustrated in Figure 5.
The model consists of three main parts:
- core battery model: The structure of this core battery model is shown in Figure 6. It consists of a part which describes the OCV as a function of the SOC and a part modeling the overpotential. Using temperature, current and SOC information as well as the actual SOH (given by the scaling factors and ), the battery voltage is predicted. Dynamic effects are taken into account by using multiple low-pass time filters of the current signal. Thus, previous current values are considered. This is inspired by ECMs where this is done using RC-elements. Recurrent neural networks are an alternative implementation, especially with Long Short-Term Memory. Although they are widely employed, our approach reduces the parametrization effort and is more robust as is shown in [26].
- All vehicles of the fleet share this core battery model. Since the neural network is fed with all vehicles, it simulates the average battery behavior. This permits information transfer between different devices, e.g., if some vehicles are only operated at small SOC (or current or temperature) ranges, training the model with the remaining devices enables the extrapolation to a wider SOC (or current or temperature) range.
- aging parameter database: This model part contains the aging information of each vehicle in the fleet and outputs the SOH based on the device’s , the lifetime as well as the total charge throughput. To calculate the SOH, vehicle-specific calendric and cyclic aging rates are stored. An advantage is the easy detection of peculiarly aged batteries by investigating the SOH scaling factors (see Section 4.3).
- soc0 model: Since the SOC given by the BMS is no direct measurement and error-prone, we do not use this signal. Instead, we calculate our own SOC signal. After coulomb counting, we recalibrate the signal with adjusting factors to compensate for measurement errors and data gaps.
The inputs and outputs of the submodels are described in Table 2.
4.3. Training Process
All weight parameters of the fleet model are fitted to the measured voltages . As loss function , a combination of the mean squared error and regularization loss is used:
Here is the total number of training datapoints and is the index of the datapoint. We incorporate constraints for the monotony of the OCV curve using the regularization function and constraints for the SOH parameters and with another regularization function . Using suitable chosen hyperparameters and , the strict satisfaction of the constraints as well as the continuity of can be guaranteed. The following features ensure the convergence of the fit:
- usage of Adam optimization algorithm, which adjusts the learning rate based on first and second moments of the estimated gradients,
- initialization methods for all submodels:
- ◦
- using laboratory cell tests of similar NMC cells for the OCV curve,
- ◦
- pretraining of the overpotential model with ohmic resistance,
- ◦
- estimation of the initial SOC of each section from initial voltage and OCV curve,
- iterative and temporary fixing of some of the model weights,
- early stopping of the training based on validation points (see previous section),
- in the future: detection and elimination of anomalous sections (due to measurement or data transmission errors).
5. Findings
5.1. Model Validation
To validate the model, we look at sections not used during training as mentioned in Section 3.2. The error of the voltage prediction is shown in Figure 7. Most sections have a RMSE below 5 mV, which is very accurate. The error distribution of the validation and training sections have the same mean and variance. This shows that the model is not overfitted and can extrapolate to unseen operation sections. Here and in the following figures, we use different colors for each vehicle. Nevertheless, the main intention of the plots is to illustrate the spread between vehicles. No correlation between a specific vehicle and the RMSE could be observed, i.e., the fleet model works well for all vehicles. (A lower sample rate in the first half of 2022 resulted in higher errors. The sections with high RMSE after May 2022 were individually analyzed and found to be anomalous, i.e., they were corrupted by measurement or transmission errors).
5.2. Transfer Learning
Transfer learning means the extrapolation of information between different devices. It facilitates training with more data. Figure 8 illustrates this. Hypothetically, this improves the model performance, especially for operation ranges that are seldom used. By using all subfleet data, the SOC-vs-temperature region of available data is enlarged, which enhances the extrapolation power of the model.
We examine the validity of our hypothesis with the following strategy:
- We use training data from all devices and evaluate the model on validation sections of a given device.
- Only training data from the device selected in approach 1. is used and evaluated on the same validation sections.
- We compare the results of 1. and 2. for each validation section.
The difference between approaches 1. and 2. is merely the additional training data—and thus information—provided by the other devices of the fleet. The validation is performed on the same validation sections in step 3.
The first proof-of-concept experiment shows promising results: The accuracy on most validation sections is increased by incorporating information from other fleet vehicles (see Figure 9).
The effect is assumed to be even greater in more inhomogeneous fleets, e.g., in a passenger car fleet.
5.3. SOH Investigation
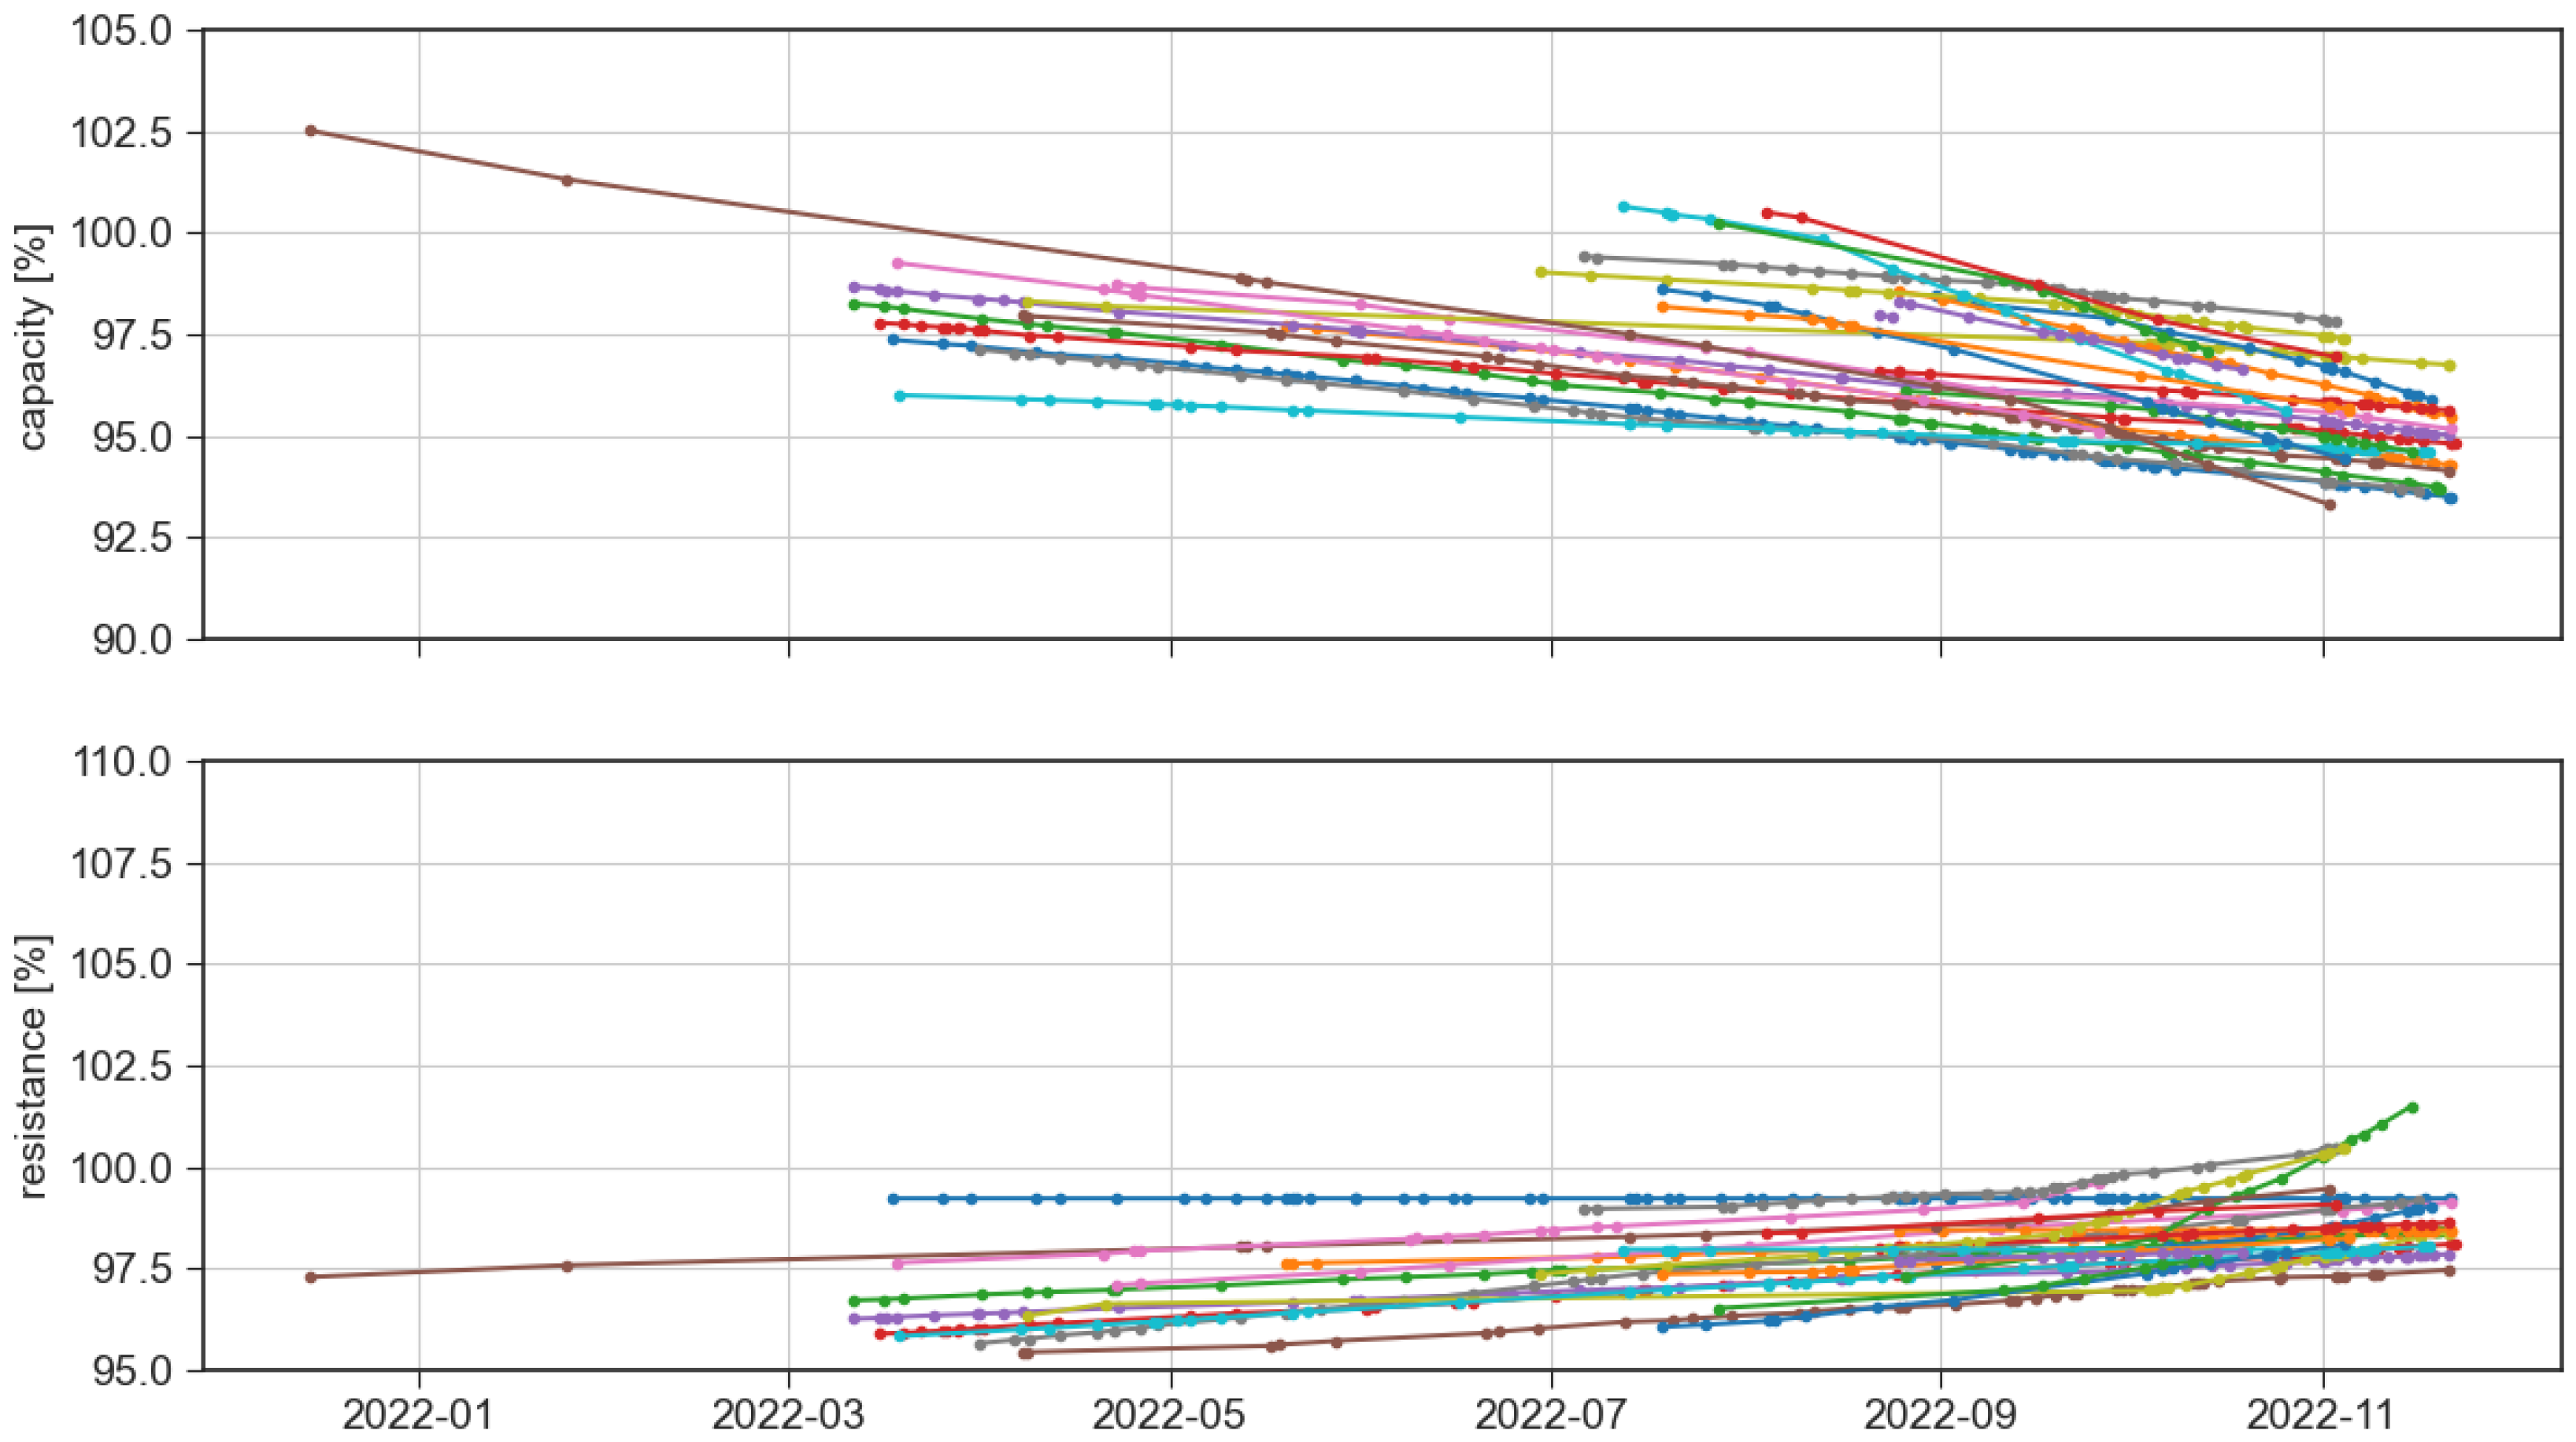
In Figure 10, the estimated SOH scaling factors are shown. Even though we selected the fleet with the longest logging time, their respective battery aging is still in its early stages. Observations are therefore limited. The capacity decrease is within the expected range of about 4% per year. A large spread between batteries already at the beginning of the logging can also be observed. Furthermore, aging rates clearly differ between vehicles.
Nevertheless, none of the analyzed batteries seem to be in a critical state. Their individual differences for resistance and capacity over time are within normal standard deviation. However, if the respective trends should accelerate, we suggest a more detailed inspection, including cell inhomogeneity analysis for the high resistance batteries.
6. Conclusions
Our novel neural network approach with fleet learning offers encouraging findings. The voltage prediction is in good accordance with the measured values. There is no significant difference between training and validation sections, indicating that the model has correctly learned the underlying battery behavior. Within a first proof-of-concept, we have also shown that the fleet model structure enables the information transfer between devices, lowering the RMSE compared to model learning with a single device. The model and training design can also assess capacity and resistance trends and differentiate between devices.
7. Outlook
We will log and observe the vehicle fleets at least until the end of 2023, when the FeBaL project will end. As soon as the vehicles have generated enough charge throughput, we will analyze and continuously (re-) evaluate all fleets. We will derive capacity decrease and resistance increase rates under different operation scenarios. Going one step further, we want to use this degradation information in combination with laboratory aging tests data to parametrize an aging model. This will allow us to predict the remaining battery lifetime. Due to the coupling of the aging prediction with the fleet model, we can develop an application-oriented, scenario-specific definition of the remaining lifetime, which can, for instance, be used to optimize the operation strategy of the vehicles.
Author Contributions
Conceptualization, T.L.; methodology, T.L.; software, T.L. and F.W.; validation, T.L. and F.W.; formal analysis, T.L.; investigation, T.L. and F.W.; resources, T.L. and F.W.; data curation, T.L. and F.W.; writing—original draft preparation, T.L.; writing—review and editing, T.L. and F.W.; visualization, T.L. and F.W.; supervision, T.L. and F.W.; project administration, F.W.; funding acquisition, T.L. and F.W. All authors have read and agreed to the published version of the manuscript.
Funding
We gratefully acknowledge the financial support by Bundesministerium für Bildung und Forschung (BMBF 03XP0308A).
Informed Consent Statement
Informed consent was obtained from all subjects involved in the study.
Data Availability Statement
Not applicable.
Conflicts of Interest
The authors declare no conflict of interest.
References
- BMBF. Battnutzung-Cluster. 2022. Available online: https://www.battnutzung-cluster.de/de/projekte/febal/ (accessed on 29 March 2023).
- Hu, X.; Xu, L.; Lin, X.; Pecht, M. Battery Lifetime Prognostics. Joule 2020, 4, 310–346. [Google Scholar] [CrossRef]
- Zhao, J.; Burke, A.F. Electric Vehicle Batteries: Status and Perspectives of Data-Driven Diagnosis and Prognosis. Batteries 2022, 8, 142. [Google Scholar] [CrossRef]
- Doyle, M.; Fuller, T.F.; Newman, J. Modeling of galvanostatic charge and discharge of the lithium/polymer/insertion cell. J. Electrochem. Soc. 1993, 140, 1526. [Google Scholar] [CrossRef]
- Xia, L.; Najafi, E.; Bergveld, H.; Donkers, M. A Computationally Efficient Implementation of an Electrochemistry-Based Model for Lithium-Ion Batteries. Int. Fed. Autom. Control 2017, 50, 2169–2174. [Google Scholar]
- Safari, M.; Morcrette, M.; Teyssot, A.; Delacourt, C. Multimodal Physics-Based Aging Model for Life Prediction of Li-Ion Batteries. J. Electrochem. Soc. 2008, 156, 145–153. [Google Scholar] [CrossRef]
- Gopalakrishnan, K.; Offer, G.J. A Composite Single Particle Lithium-ion Battery Model through System Identification. IEEE Trans. Control Syst. Technol. 2021, 30, 1–13. [Google Scholar] [CrossRef]
- Rechkemmer, S.K.; Czech, B.; Zang, X.; Zhang, W.; Sawodny, O. Adaptability of Li-Ion Single Particle Model for Lifetime Simulation using LFP and LMO cells. In Proceedings of the Conference on Control Technology and Applications, Copenhagen, Denmark, 21–24 August 2018. [Google Scholar]
- Nascimento, R.G.; Corbetta, M.; Kulkarni, C.S.; Viana, F.A. Li-ion Battery Aging with Hybrid Physics-Informed Neural Networks and Fleet-wide Data. In Proceedings of the Annual Conference of the Prognostics and Health Management Society, Online, 29 November–2 December 2021. [Google Scholar]
- Ng, M.F.; Zhao, J.; Yan, Q.; Conduit, G.J.; Seh, Z.W. Predicting the state of charge and health of batteries using data-driven machine learning. Nat. Mach. Intell. 2020, 2, 167–170. [Google Scholar] [CrossRef] [Green Version]
- Plett, G.L. Extended Kalman filtering for battery management systems of LiPB-based HEV battery packs Part 3. State and parameter estimation. J. Power Sources 2004, 134, 277–292. [Google Scholar] [CrossRef]
- Zhao, S.; Duncan, S.R.; Howey, D.A. Observability analysis and state estimation of lithium-ionbatteries in the presence of sensor biases. IEEE Trans. Control Syst. Technol. 2015, 25, 326–333. [Google Scholar] [CrossRef] [Green Version]
- Meng, J.; Boukhnifer, M.; Diallo, D.; Wang, T. A New Cascaded Framework for Lithium-Ion Battery State and Parameter Estimation. Appl. Sci. 2020, 10, 1009. [Google Scholar] [CrossRef] [Green Version]
- Campestrini, C. Practical Feasibility of Kalman Filters for the State Estimation of Lithium-Ion Batteries; Technische Universität München: Munich, Germany, 2017. [Google Scholar]
- Andre, D.; Nuhic, A.; Soczka-Guth, T.; Sauer, D.U. Comparative study of a structured neural network and an extended Kalman filter for state of health determination of lithium-ion batteries in hybrid electric vehicles. Eng. Appl. Artif. Intell. 2013, 26, 951–961. [Google Scholar] [CrossRef]
- Zhao, R.; Kollmeyer, P.J.; Lorenz, R.D.; Jahns, T.M. A Compact Methodology Via a Recurrent Neural Network for Accurate Equivalent Circuit Type Modeling of Lithium-Ion Batteries. IEEE Trans. Ind. Appl. 2019, 55, 1922–1931. [Google Scholar] [CrossRef]
- Zhang, Y.; Xiong, R.; He, H.; Pecht, M.G. Long Short-Term Memory Recurrent Neural Network for Remaining Useful Life Prediction of Lithium-Ion Batteries. IEEE Trans. Veh. Technol. 2018, 67, 5695–5705. [Google Scholar] [CrossRef]
- Yang, F.; Li, W.; Li, C.; Miao, Q. State-of-charge estimation of lithium-ion batteries based on gated recurrent neural network. Energy 2019, 175, 66–75. [Google Scholar] [CrossRef]
- Savargaonkar, M.; Chehade, A.; Shi, Z.; Hussein, A.A. A Cycle-based Recurrent Neural Network for State-of-Charge Estimation of Li-ion Battery Cells. In Proceedings of the IEEE Transportation Electrification Conference & Expo (ITEC), Chicago, IL, USA, 23–26 June 2020; pp. 584–587. [Google Scholar]
- Hong, J.; Wang, Z.; Chen, W.; Wang, L.Y.; Qu, C. Online joint-prediction of multi-forward-step battery SOC using LSTM neural networks and multiple linear regression for real-world electric vehicles. J. Energy Storage 2020, 30, 101459. [Google Scholar] [CrossRef]
- Jiménez-Bermejo, D.; Fraile-Ardanuy, J.; Castaño-Solis, S.; Merino, J.; Álvaro-Hermana, R. Using Dynamic Neural Networks for Battery State of Charge Estimation in Electric Vehicles. Procedia Comput. Sci. 2018, 130, 533–540. [Google Scholar] [CrossRef]
- Xu, N.; Xie, Y.; Liu, Q.; Yue, F.; Zhao, D. A Data-Driven Approach to State of Health Estimation and Prediction for a Lithium-Ion Battery Pack of Electric Buses Based on Real-World Data. Sensors 2022, 22, 5762. [Google Scholar] [CrossRef] [PubMed]
- Li, K.; Zhou, P.; Lu, Y.; Han, X.; Li, X.; Zheng, Y. Battery life estimation based on cloud data for electric vehicles. J. Power Sources 2020, 468, 228192. [Google Scholar] [CrossRef]
- She, C.; Wang, Z.; Sun, F.; Liu, P.; Zhang, L. Battery Aging Assessment for Real-World Electric Buses Based on Incremental Capacity Analysis and Radial Basis Function Neural Network. IEEE Trans. Ind. Inform. 2020, 16, 3345–3354. [Google Scholar] [CrossRef]
- Li, W.; Chen, J.; Quade, K.; Luder, D.; Gong, J.; Sauer, D.U. Battery degradation diagnosis with field data, impedance-based modeling and artificial intelligence. Energy Storage Mater. 2022, 53, 391–403. [Google Scholar] [CrossRef]
- Heinrich, F.; Lehmann, T.; Jonas, K.; Pruckner, M.; Bäker, B.; Unger, A. Data Driven Approach for Battery State Estimation based on Neural Networks. In Proceedings of the 14. Tagung—Diagnose in Mechatronischen Fahrzeugsystemen, Dresden, Germany, 18–19 May 2021. [Google Scholar]
Figure 1.
Typical usage profile of a bus that uses opportunity charging. Operation sections are shown in green. Charging times are marked blue, idle times are yellow and data gaps are red.
Figure 1.
Typical usage profile of a bus that uses opportunity charging. Operation sections are shown in green. Charging times are marked blue, idle times are yellow and data gaps are red.
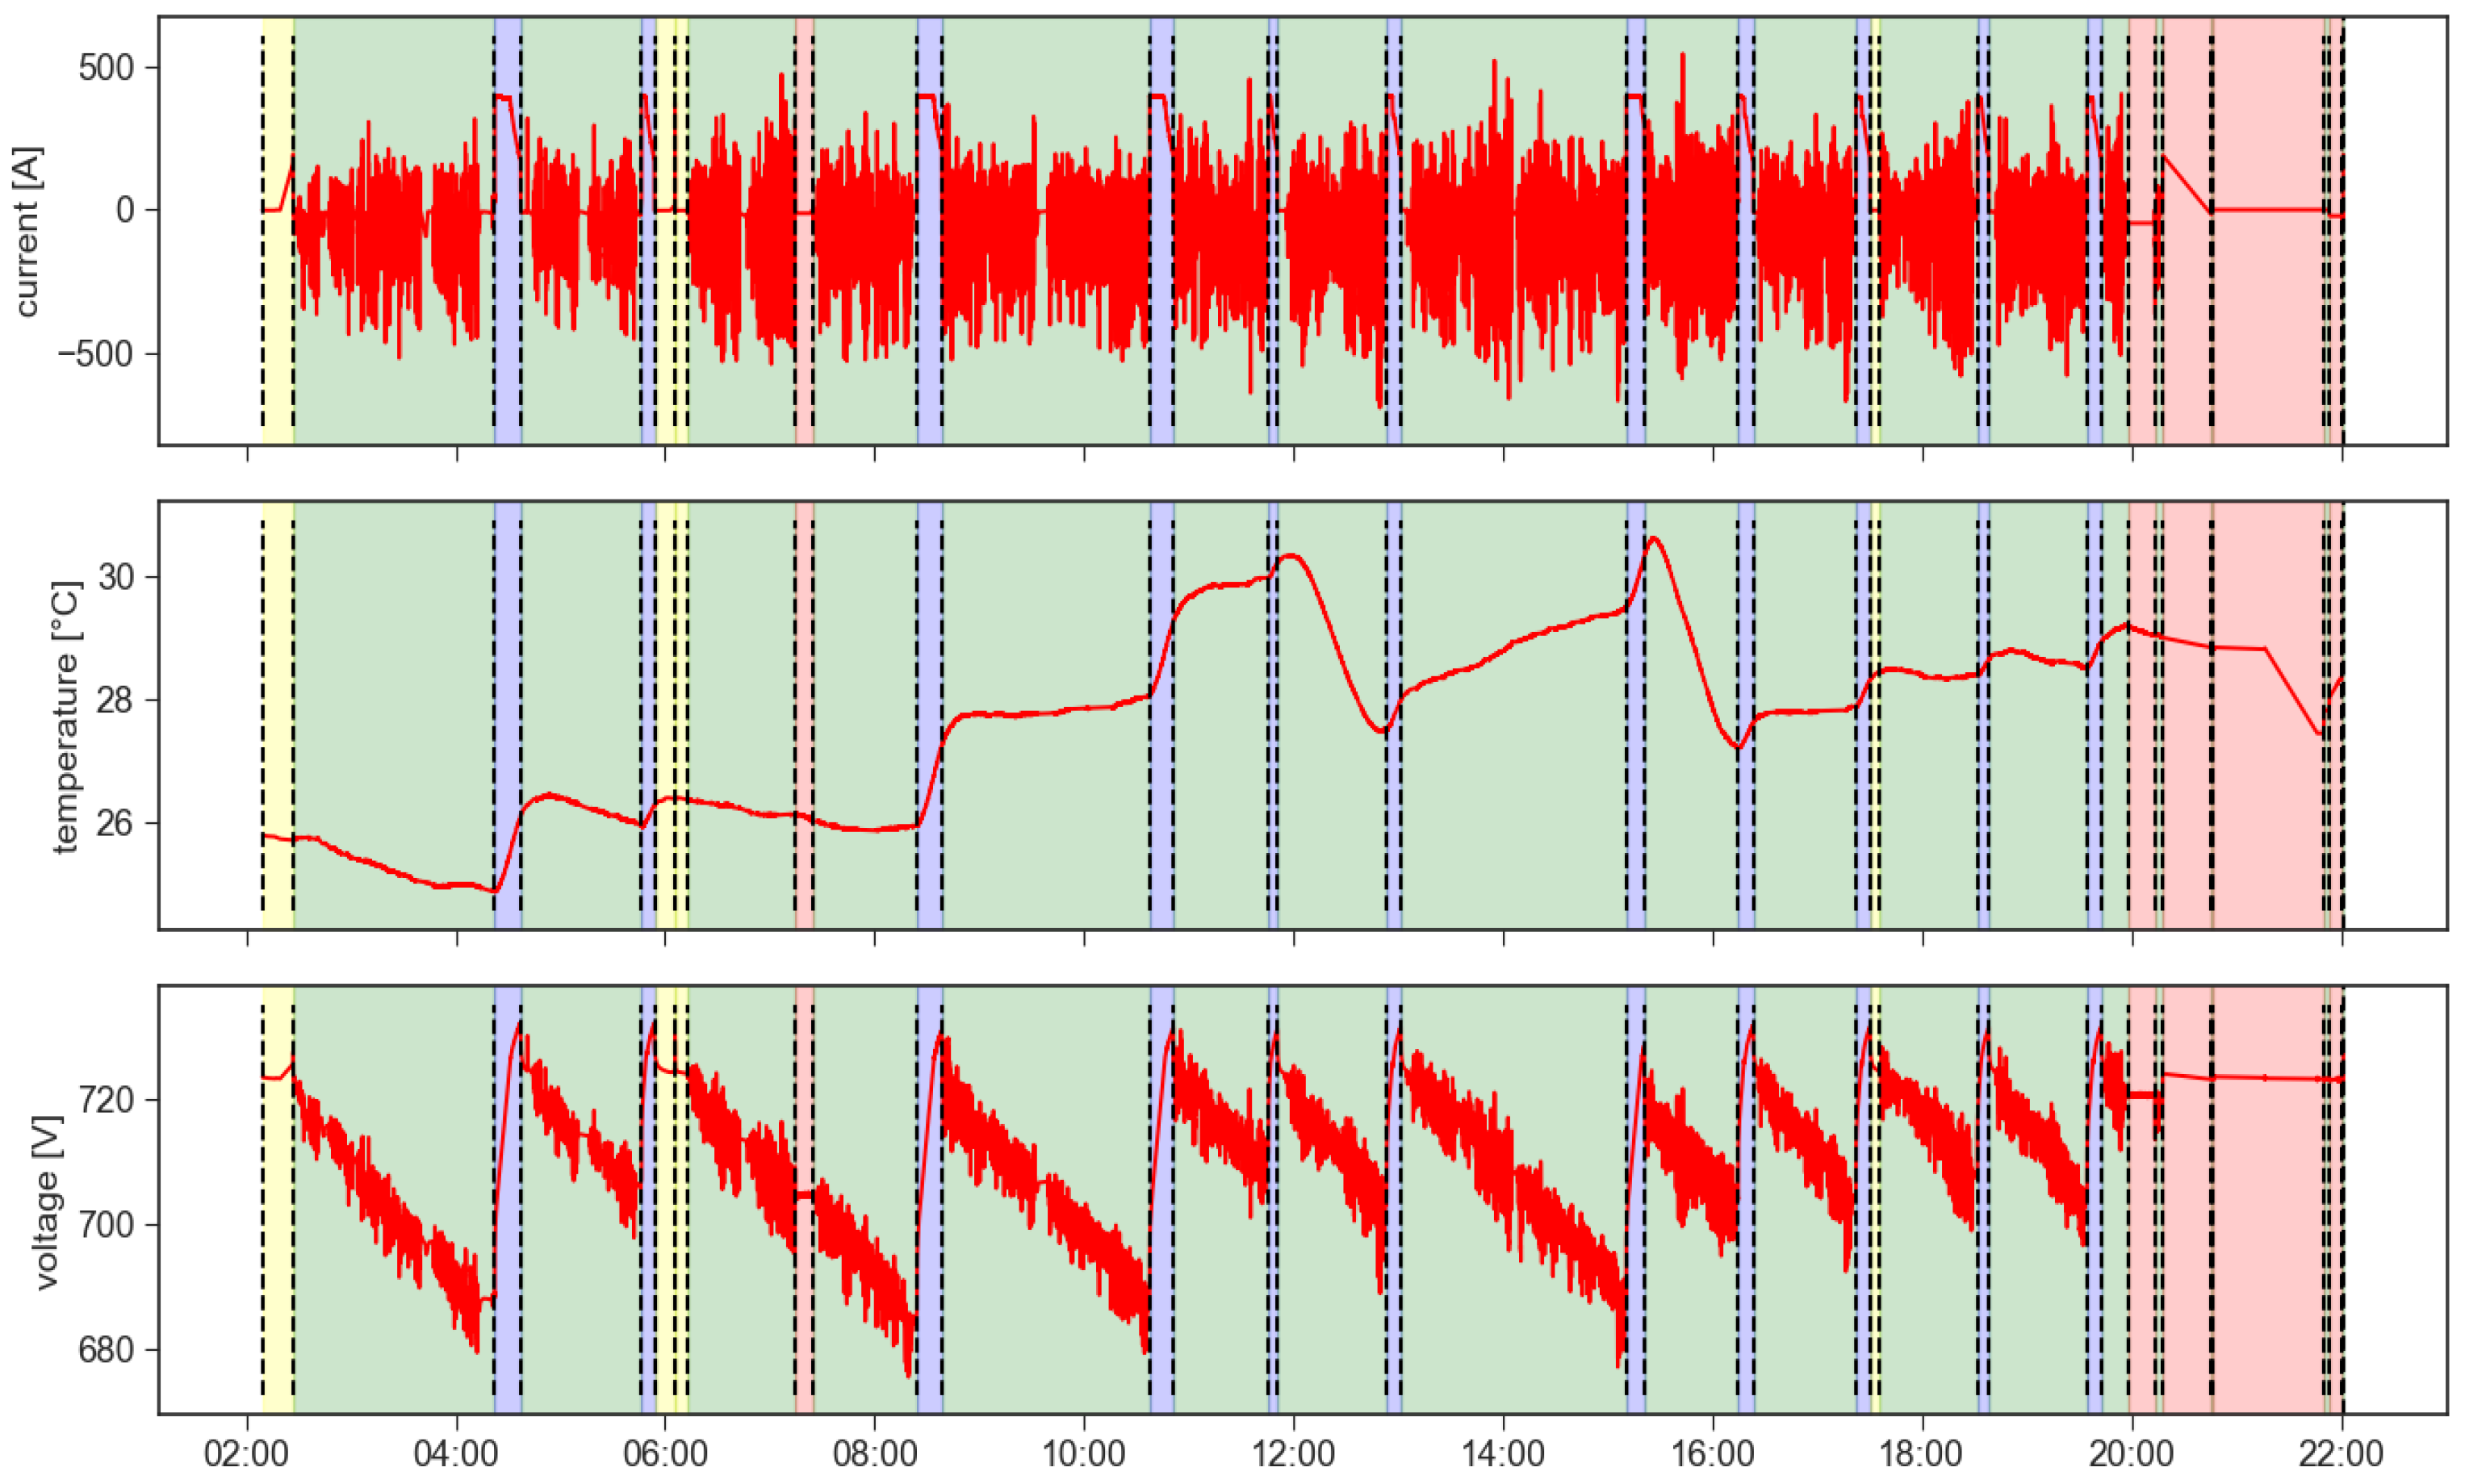
Figure 2.
Logged full cycles of the selected subfleet 3 (one bus per row).
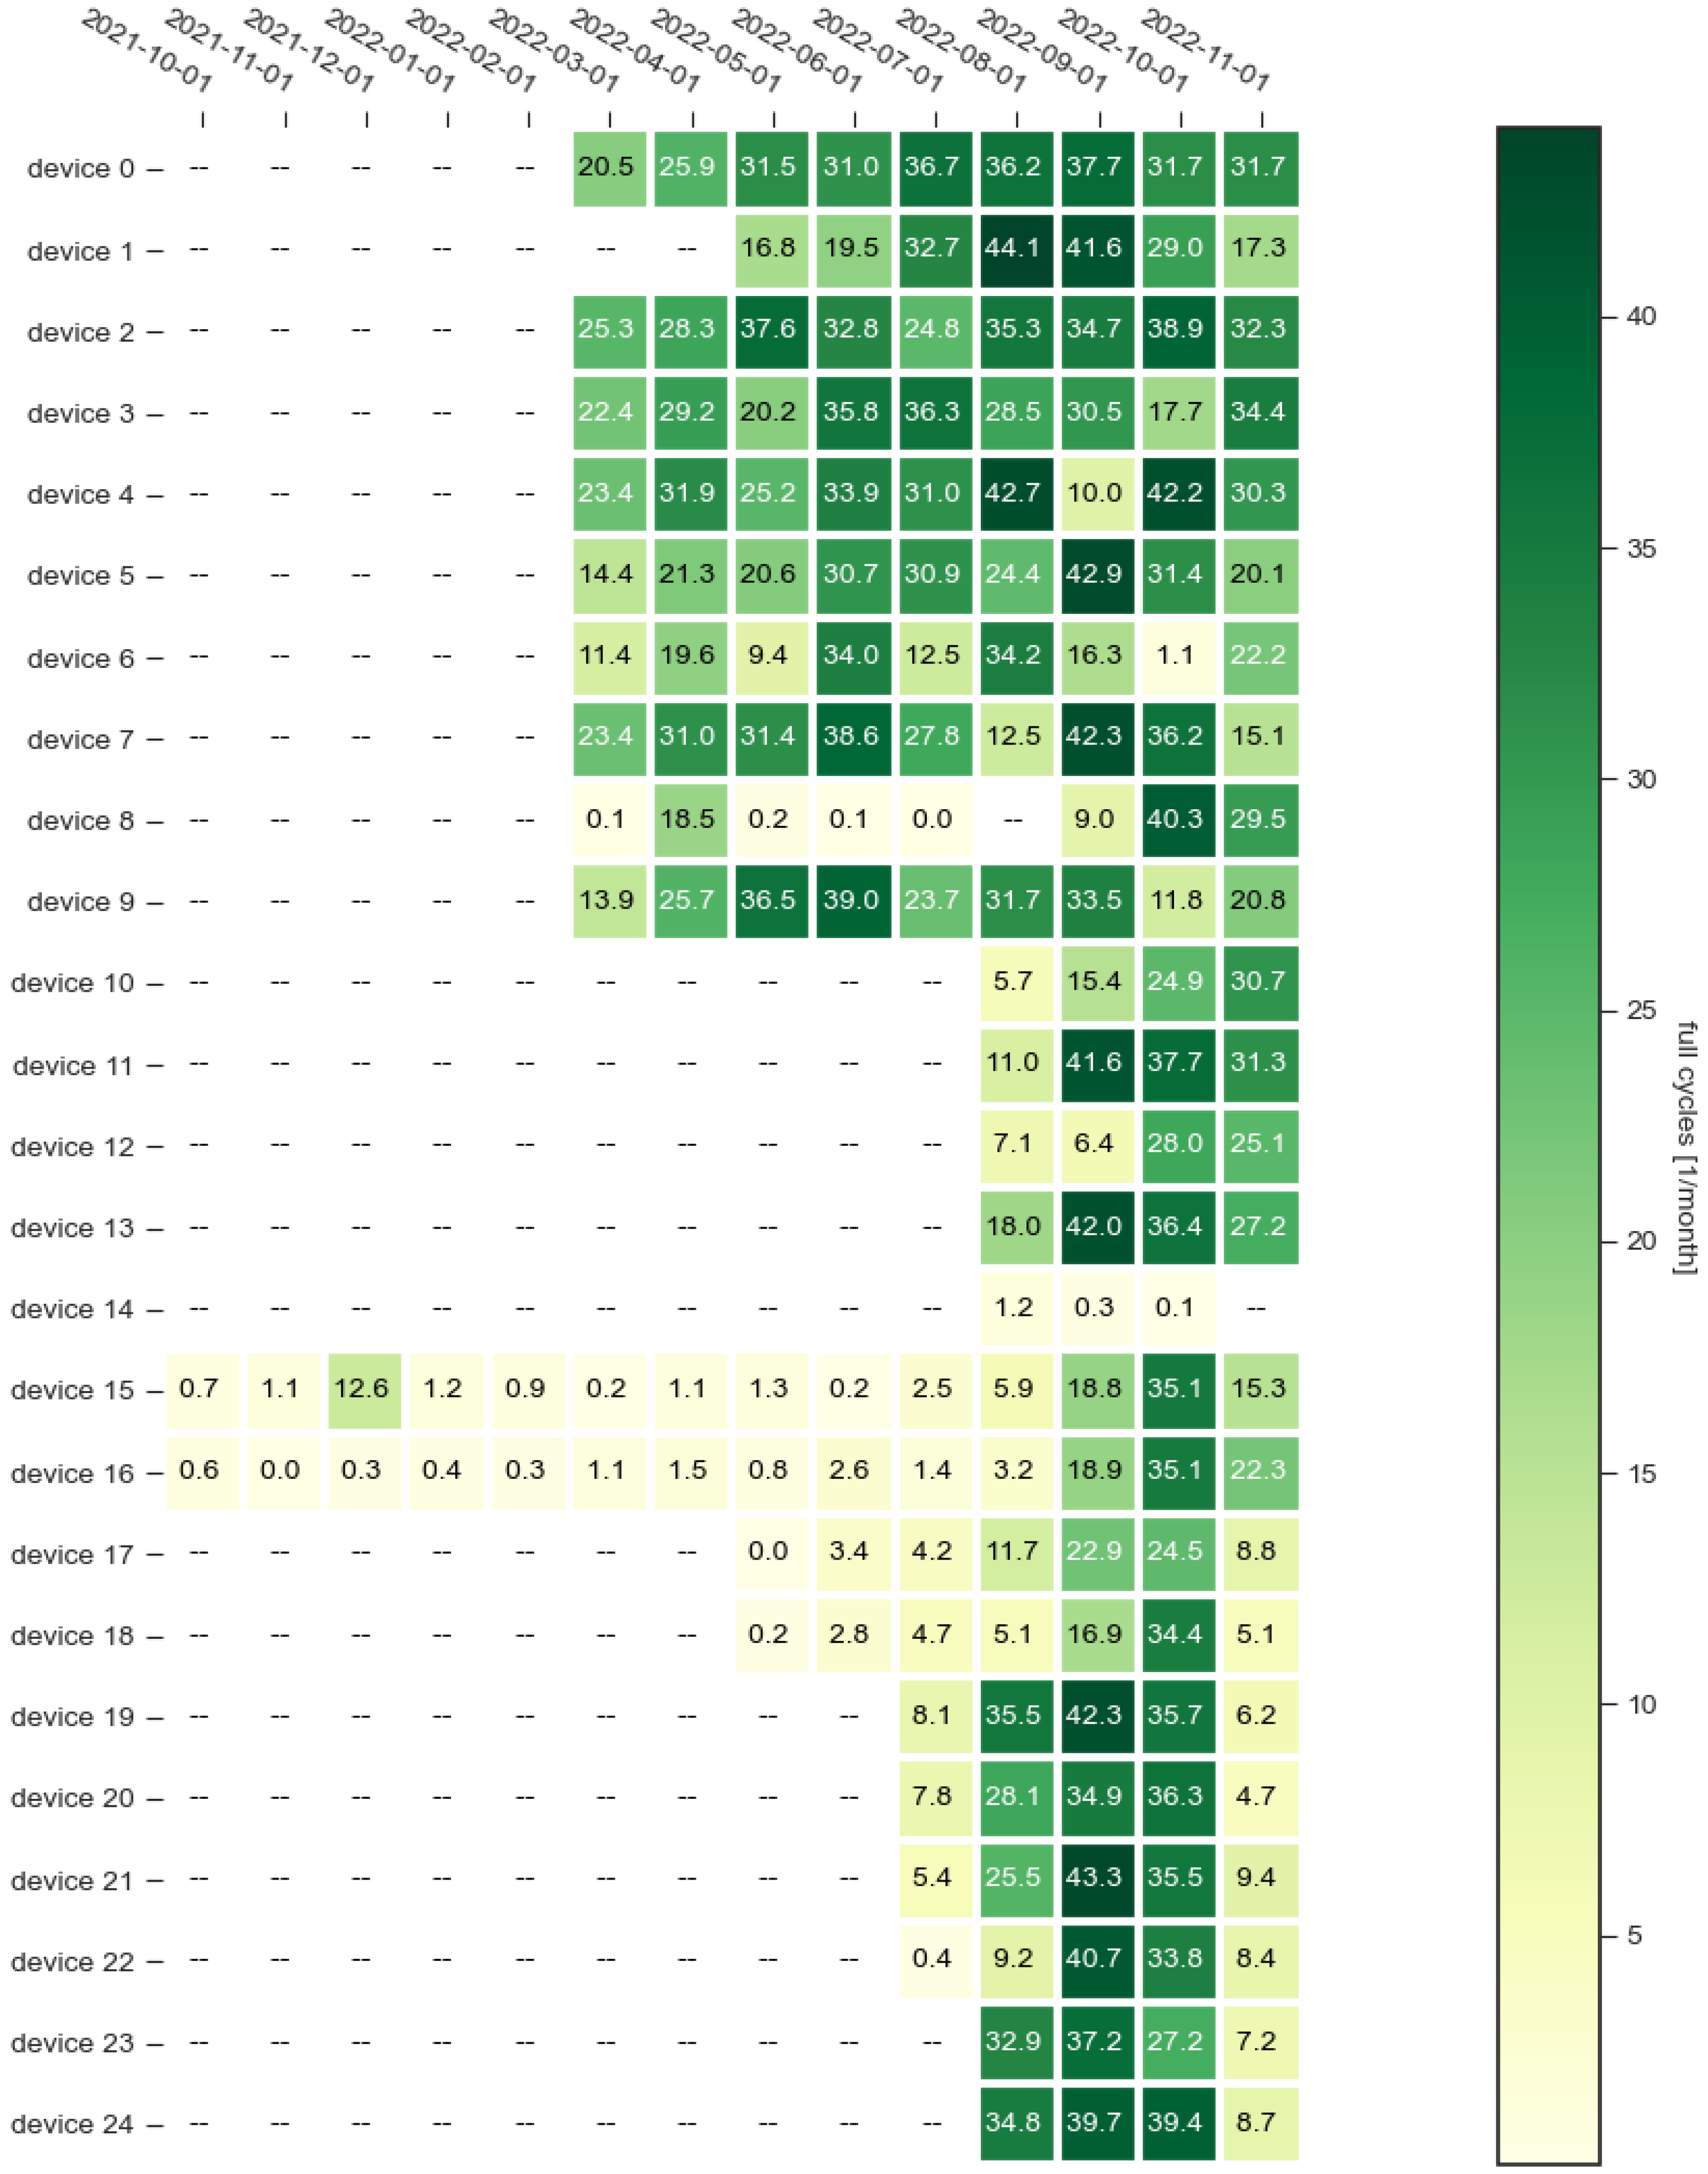
Figure 3.
Data split for model training and validation.
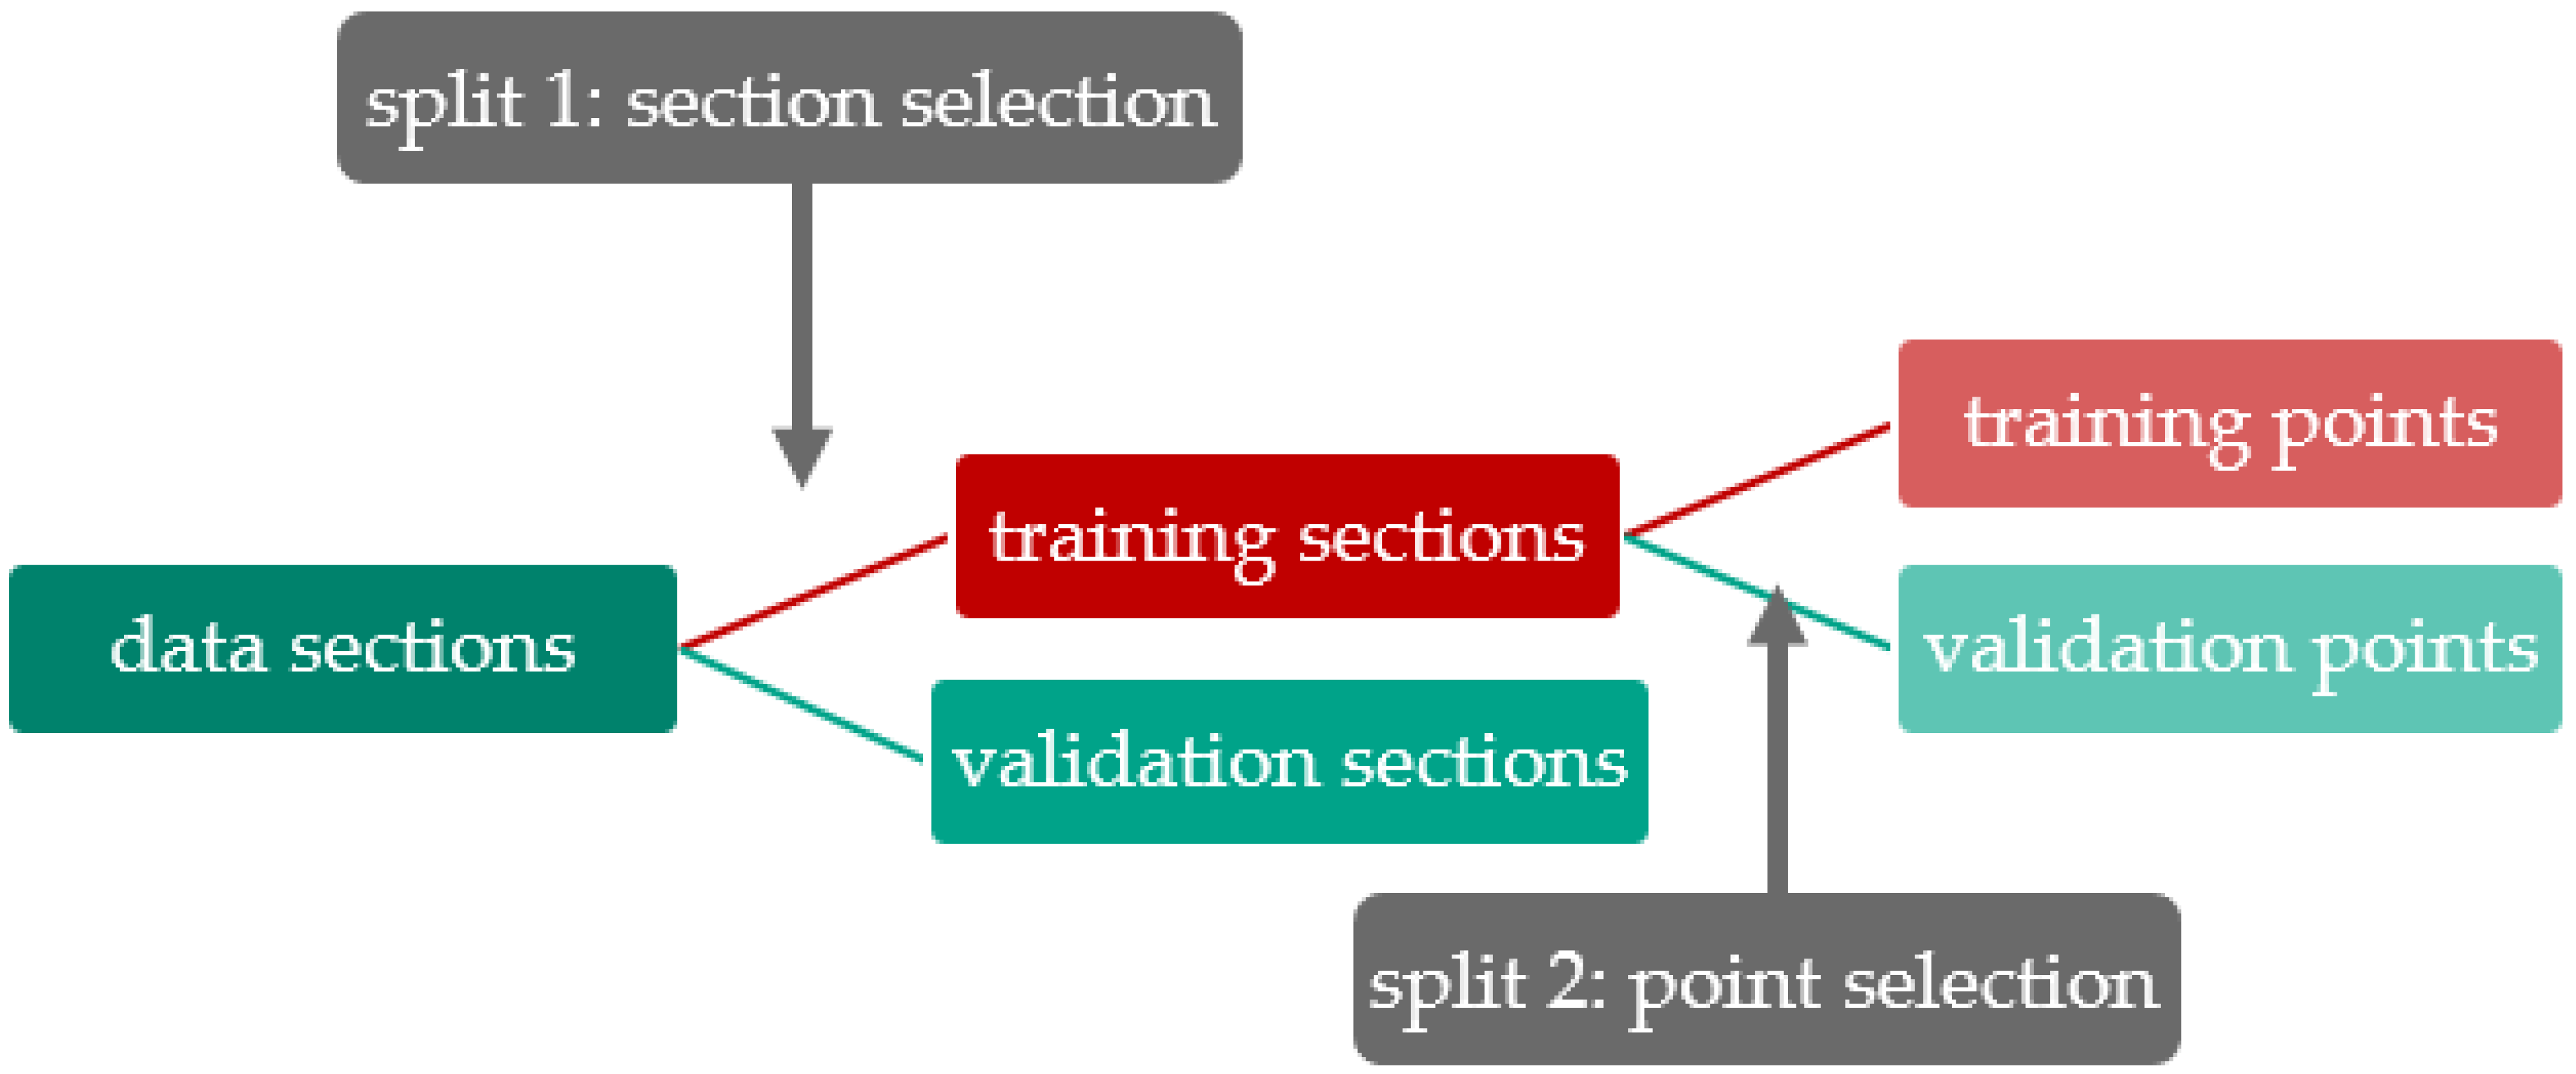
Figure 4.
Requirements of the model invoked by automated field data analysis.
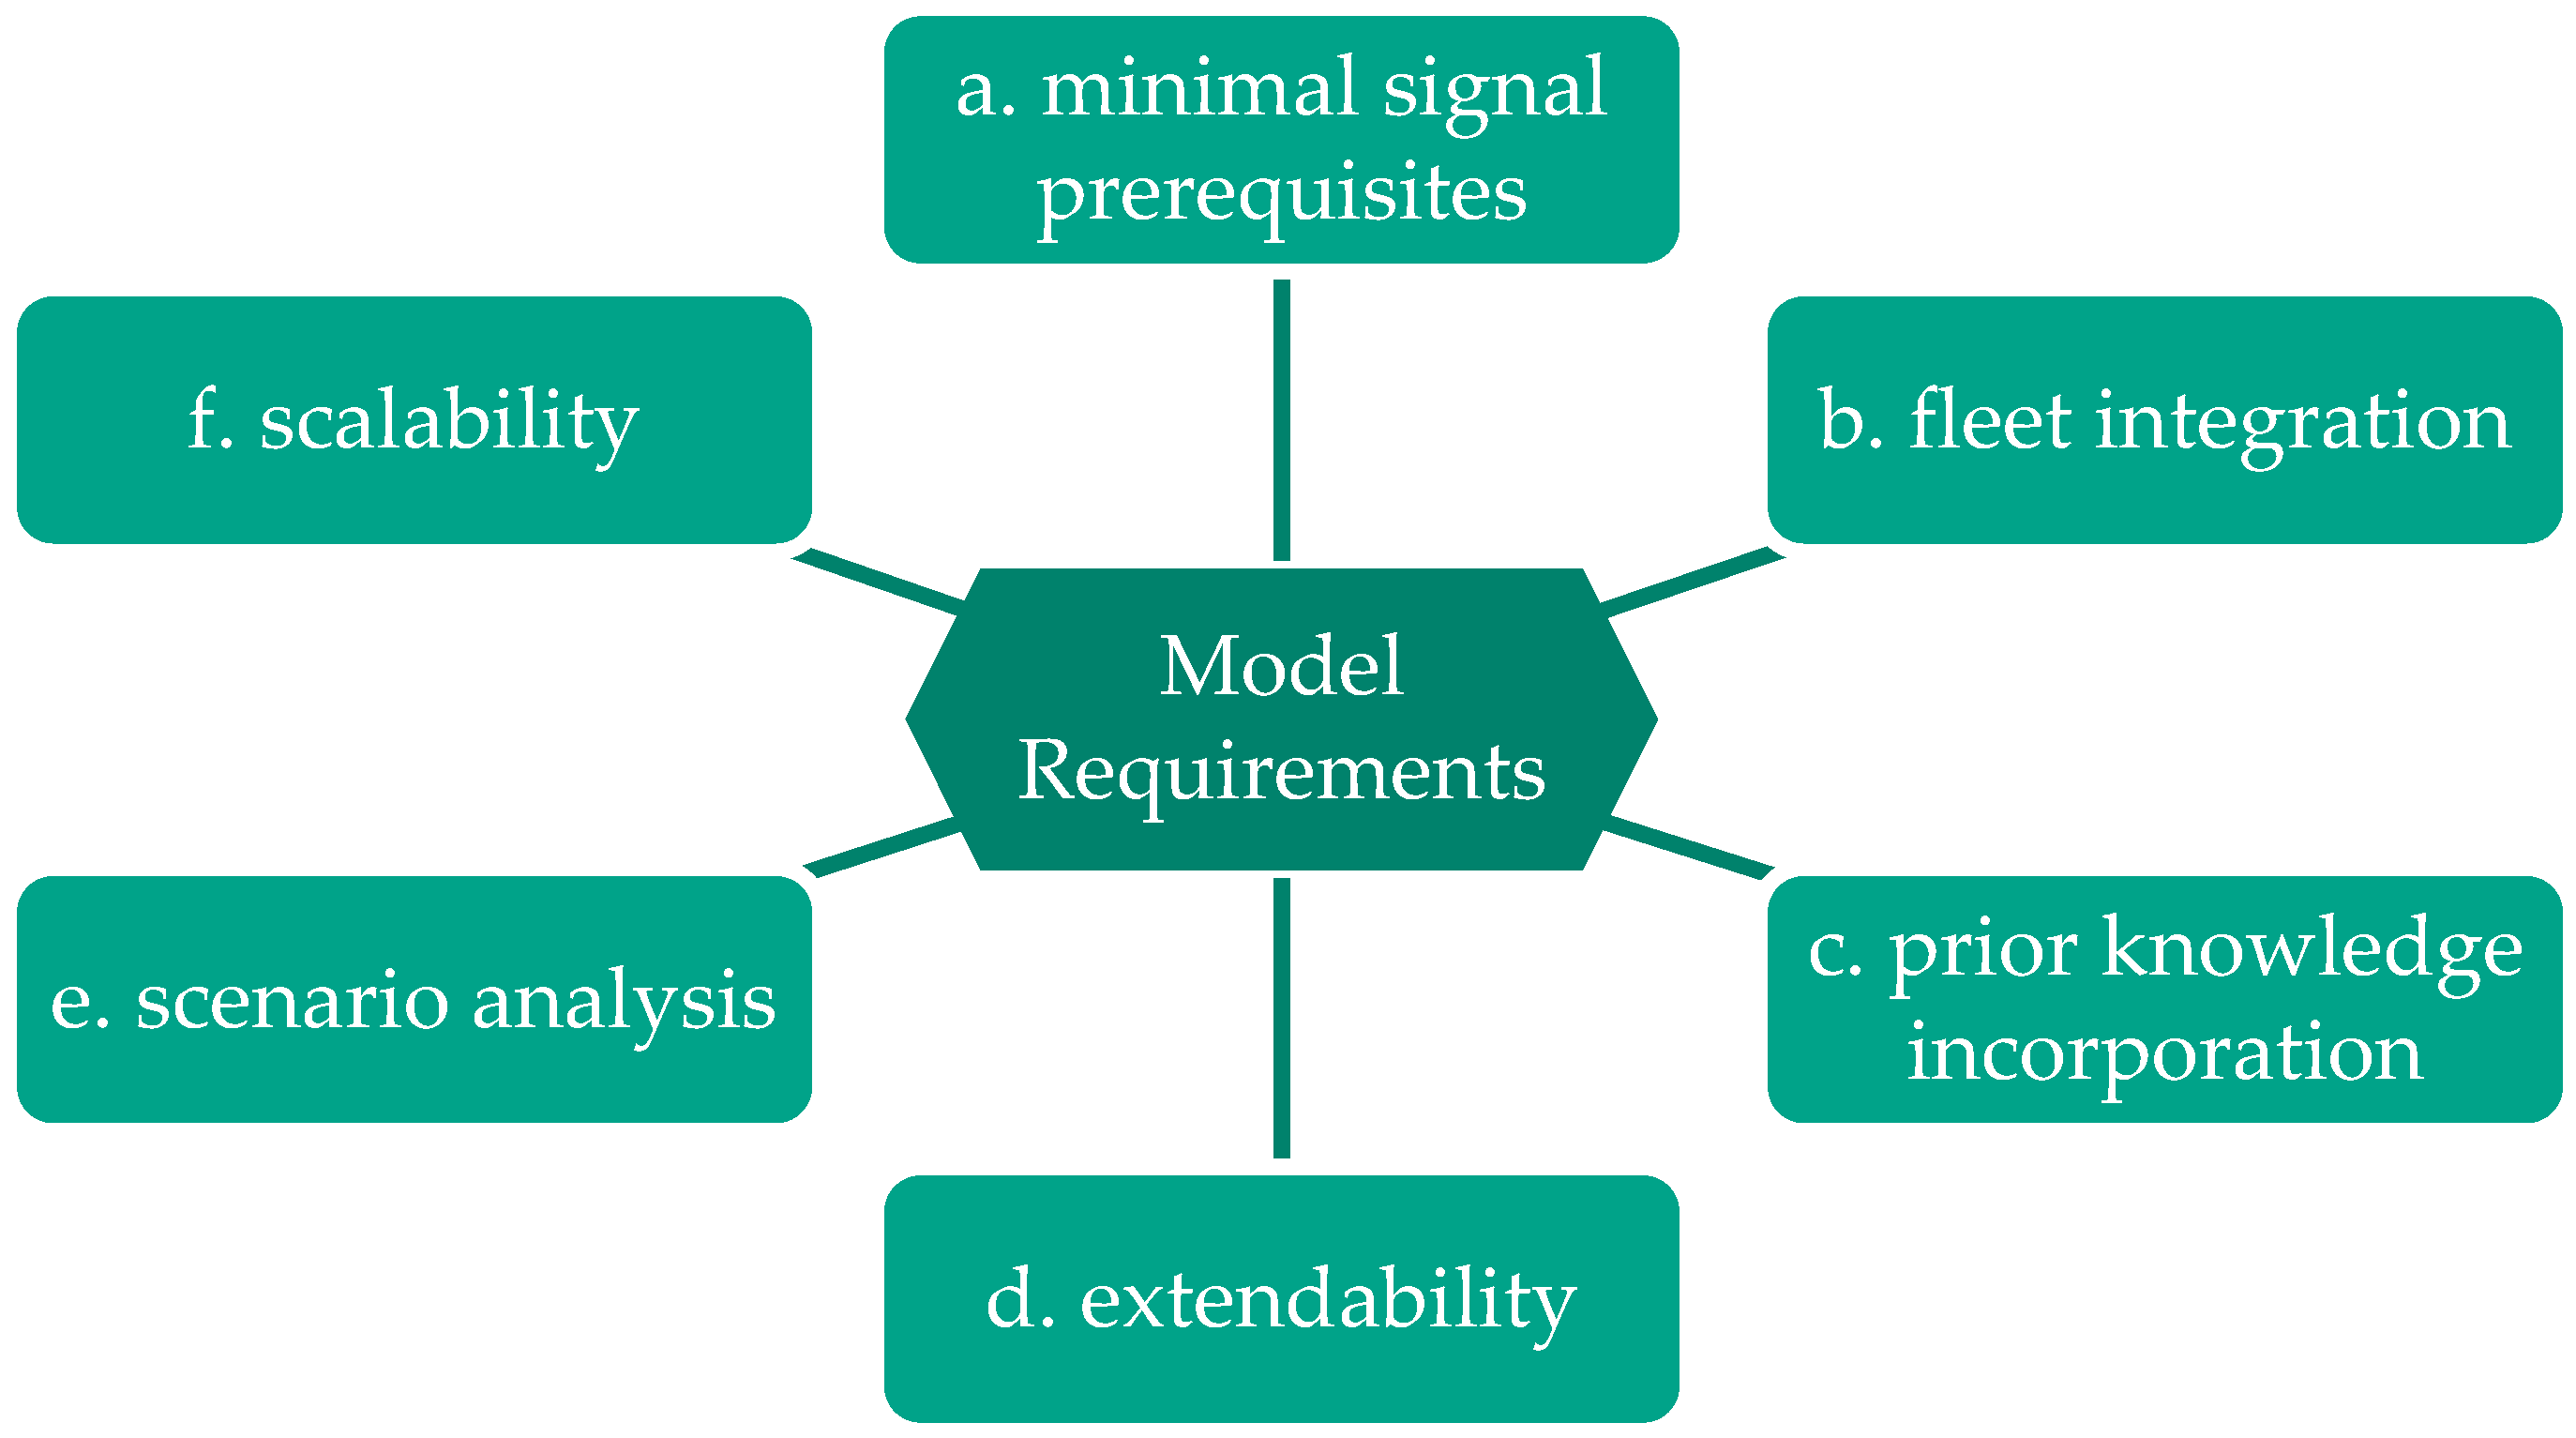
Figure 5.
Structure of the fleet model.
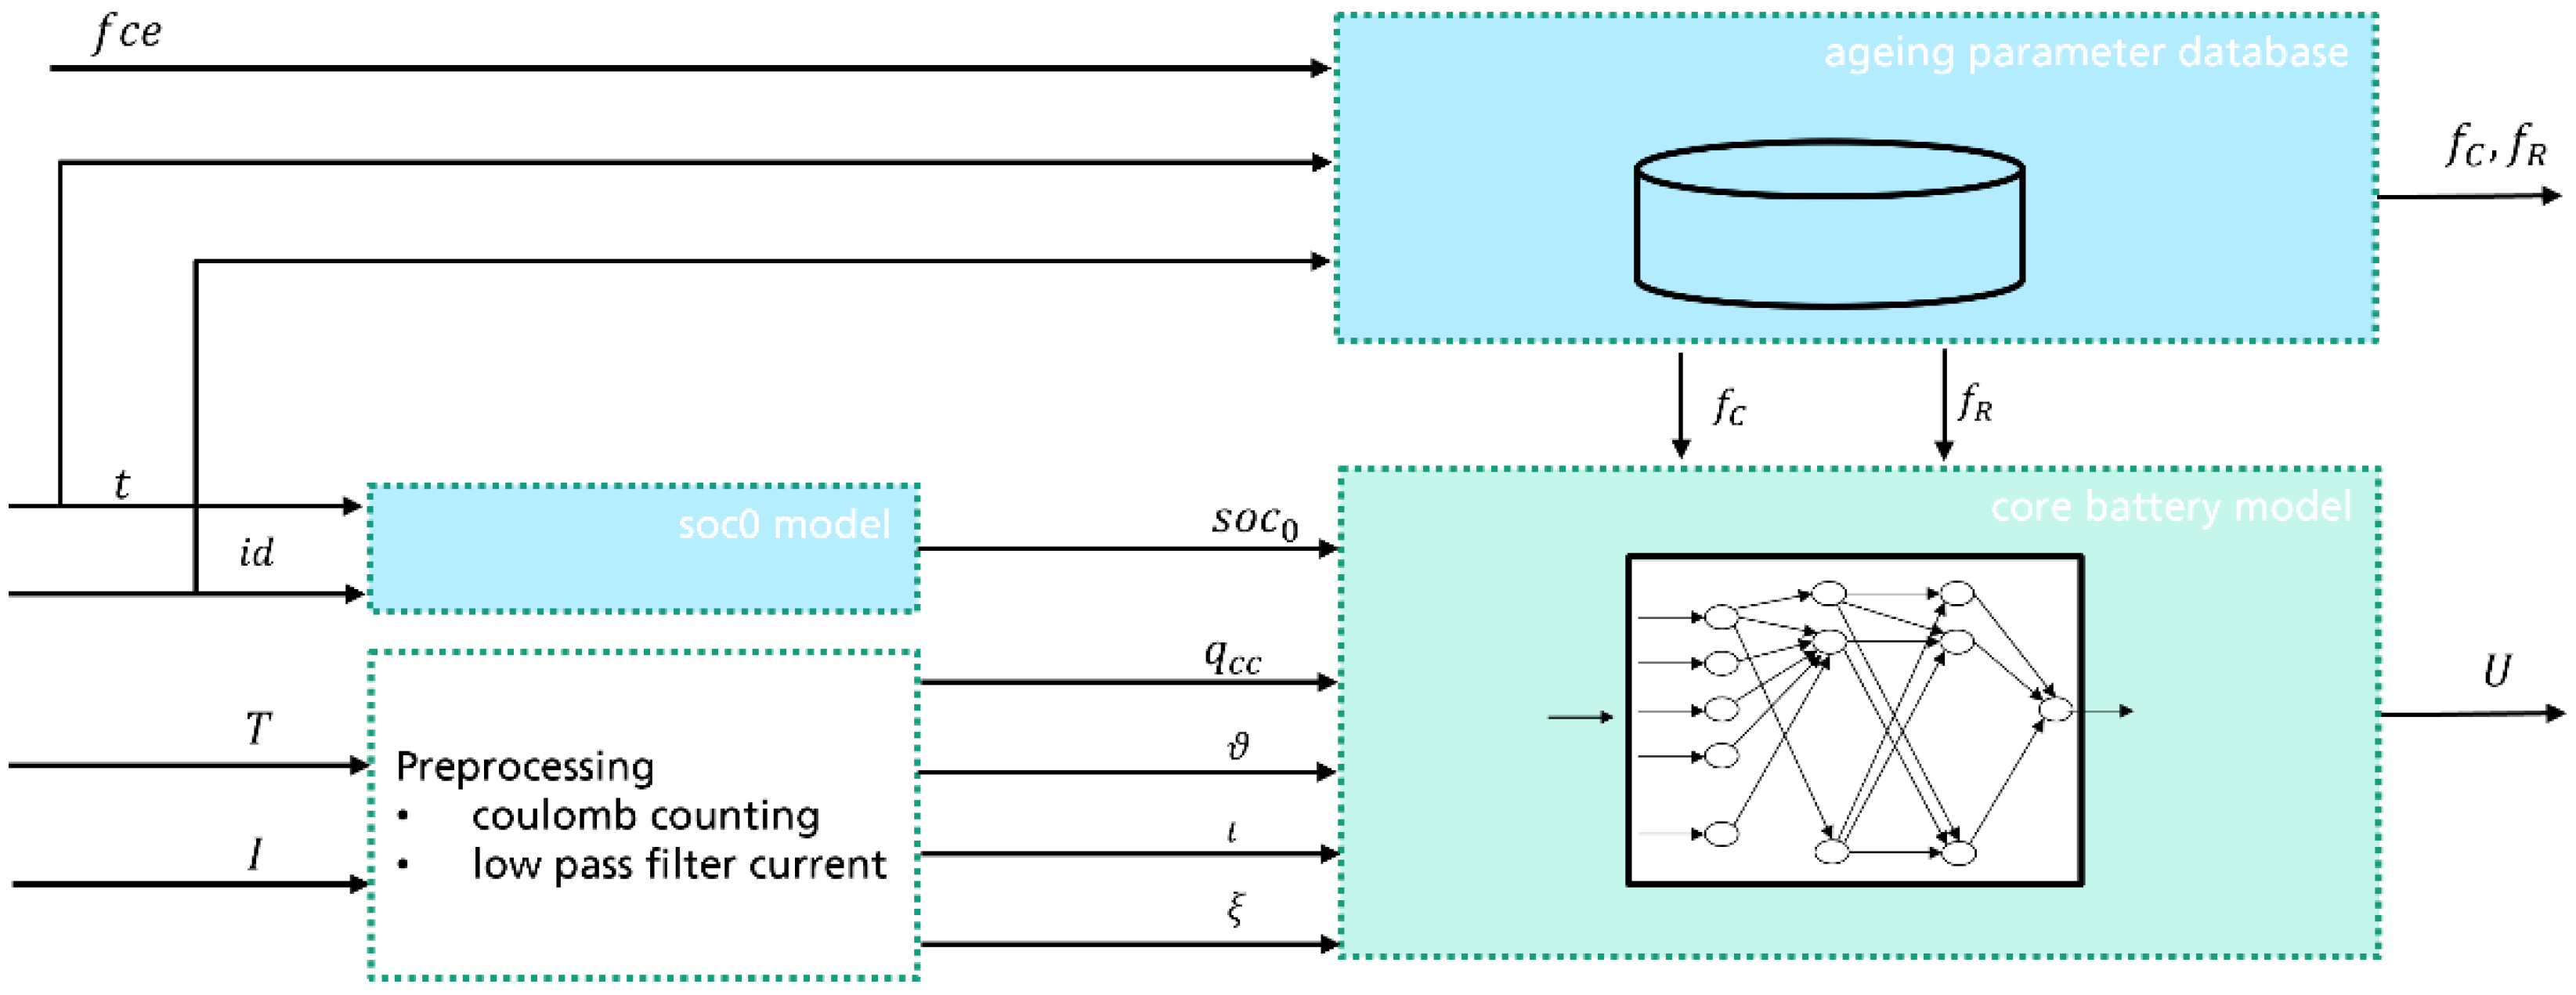
Figure 6.
Structure of the core battery neural network.

Figure 7.
Evaluation of the selected sections (one color per device). The upper plots show the RMSE-vs-time diagram and the corresponding sections-vs-time histogram of the training sections. The lower plots show the same for the validation sections. (See also the remark concerning the change of sampling rate at the end of the section above).
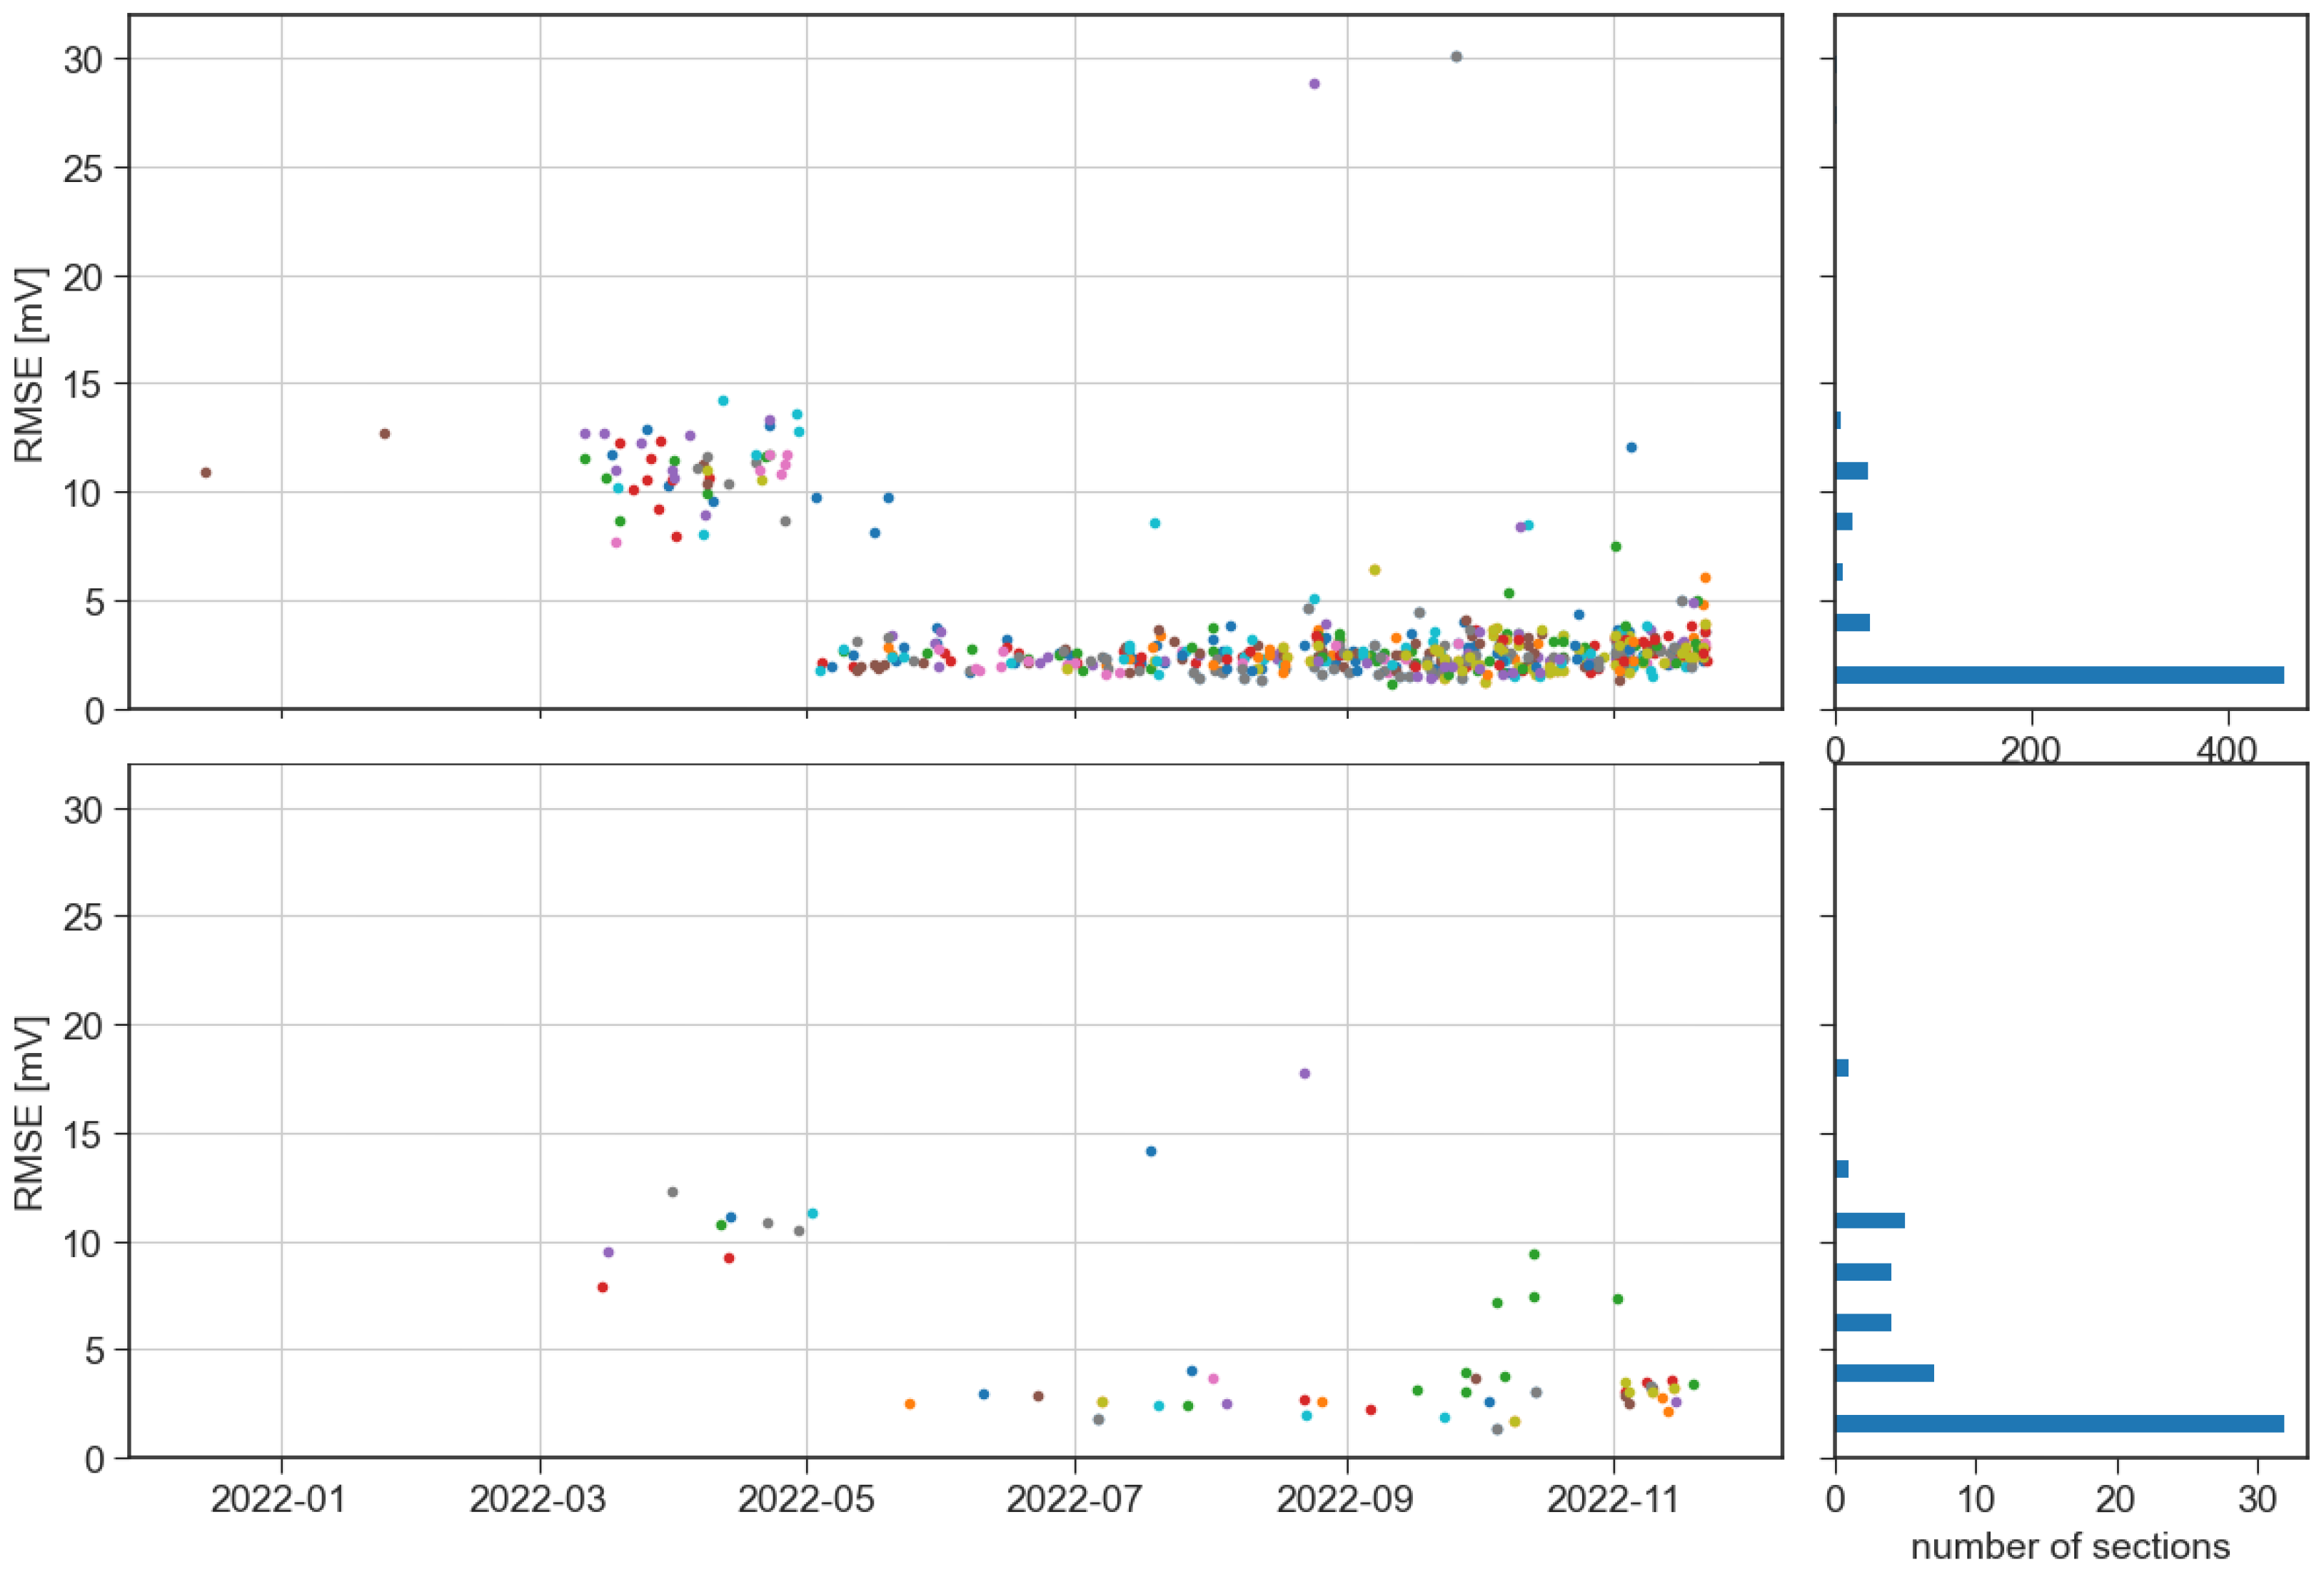
Figure 8.
Available data for each vehicle individually (dashed lines) and for the whole fleet (blue line).
Figure 8.
Available data for each vehicle individually (dashed lines) and for the whole fleet (blue line).

Figure 9.
Comparison of RMSE of validation sections after training with all fleet data (approach 1.) versus training with data from a selected device (approach 2.). The errors could be reduced for most sections.
Figure 9.
Comparison of RMSE of validation sections after training with all fleet data (approach 1.) versus training with data from a selected device (approach 2.). The errors could be reduced for most sections.
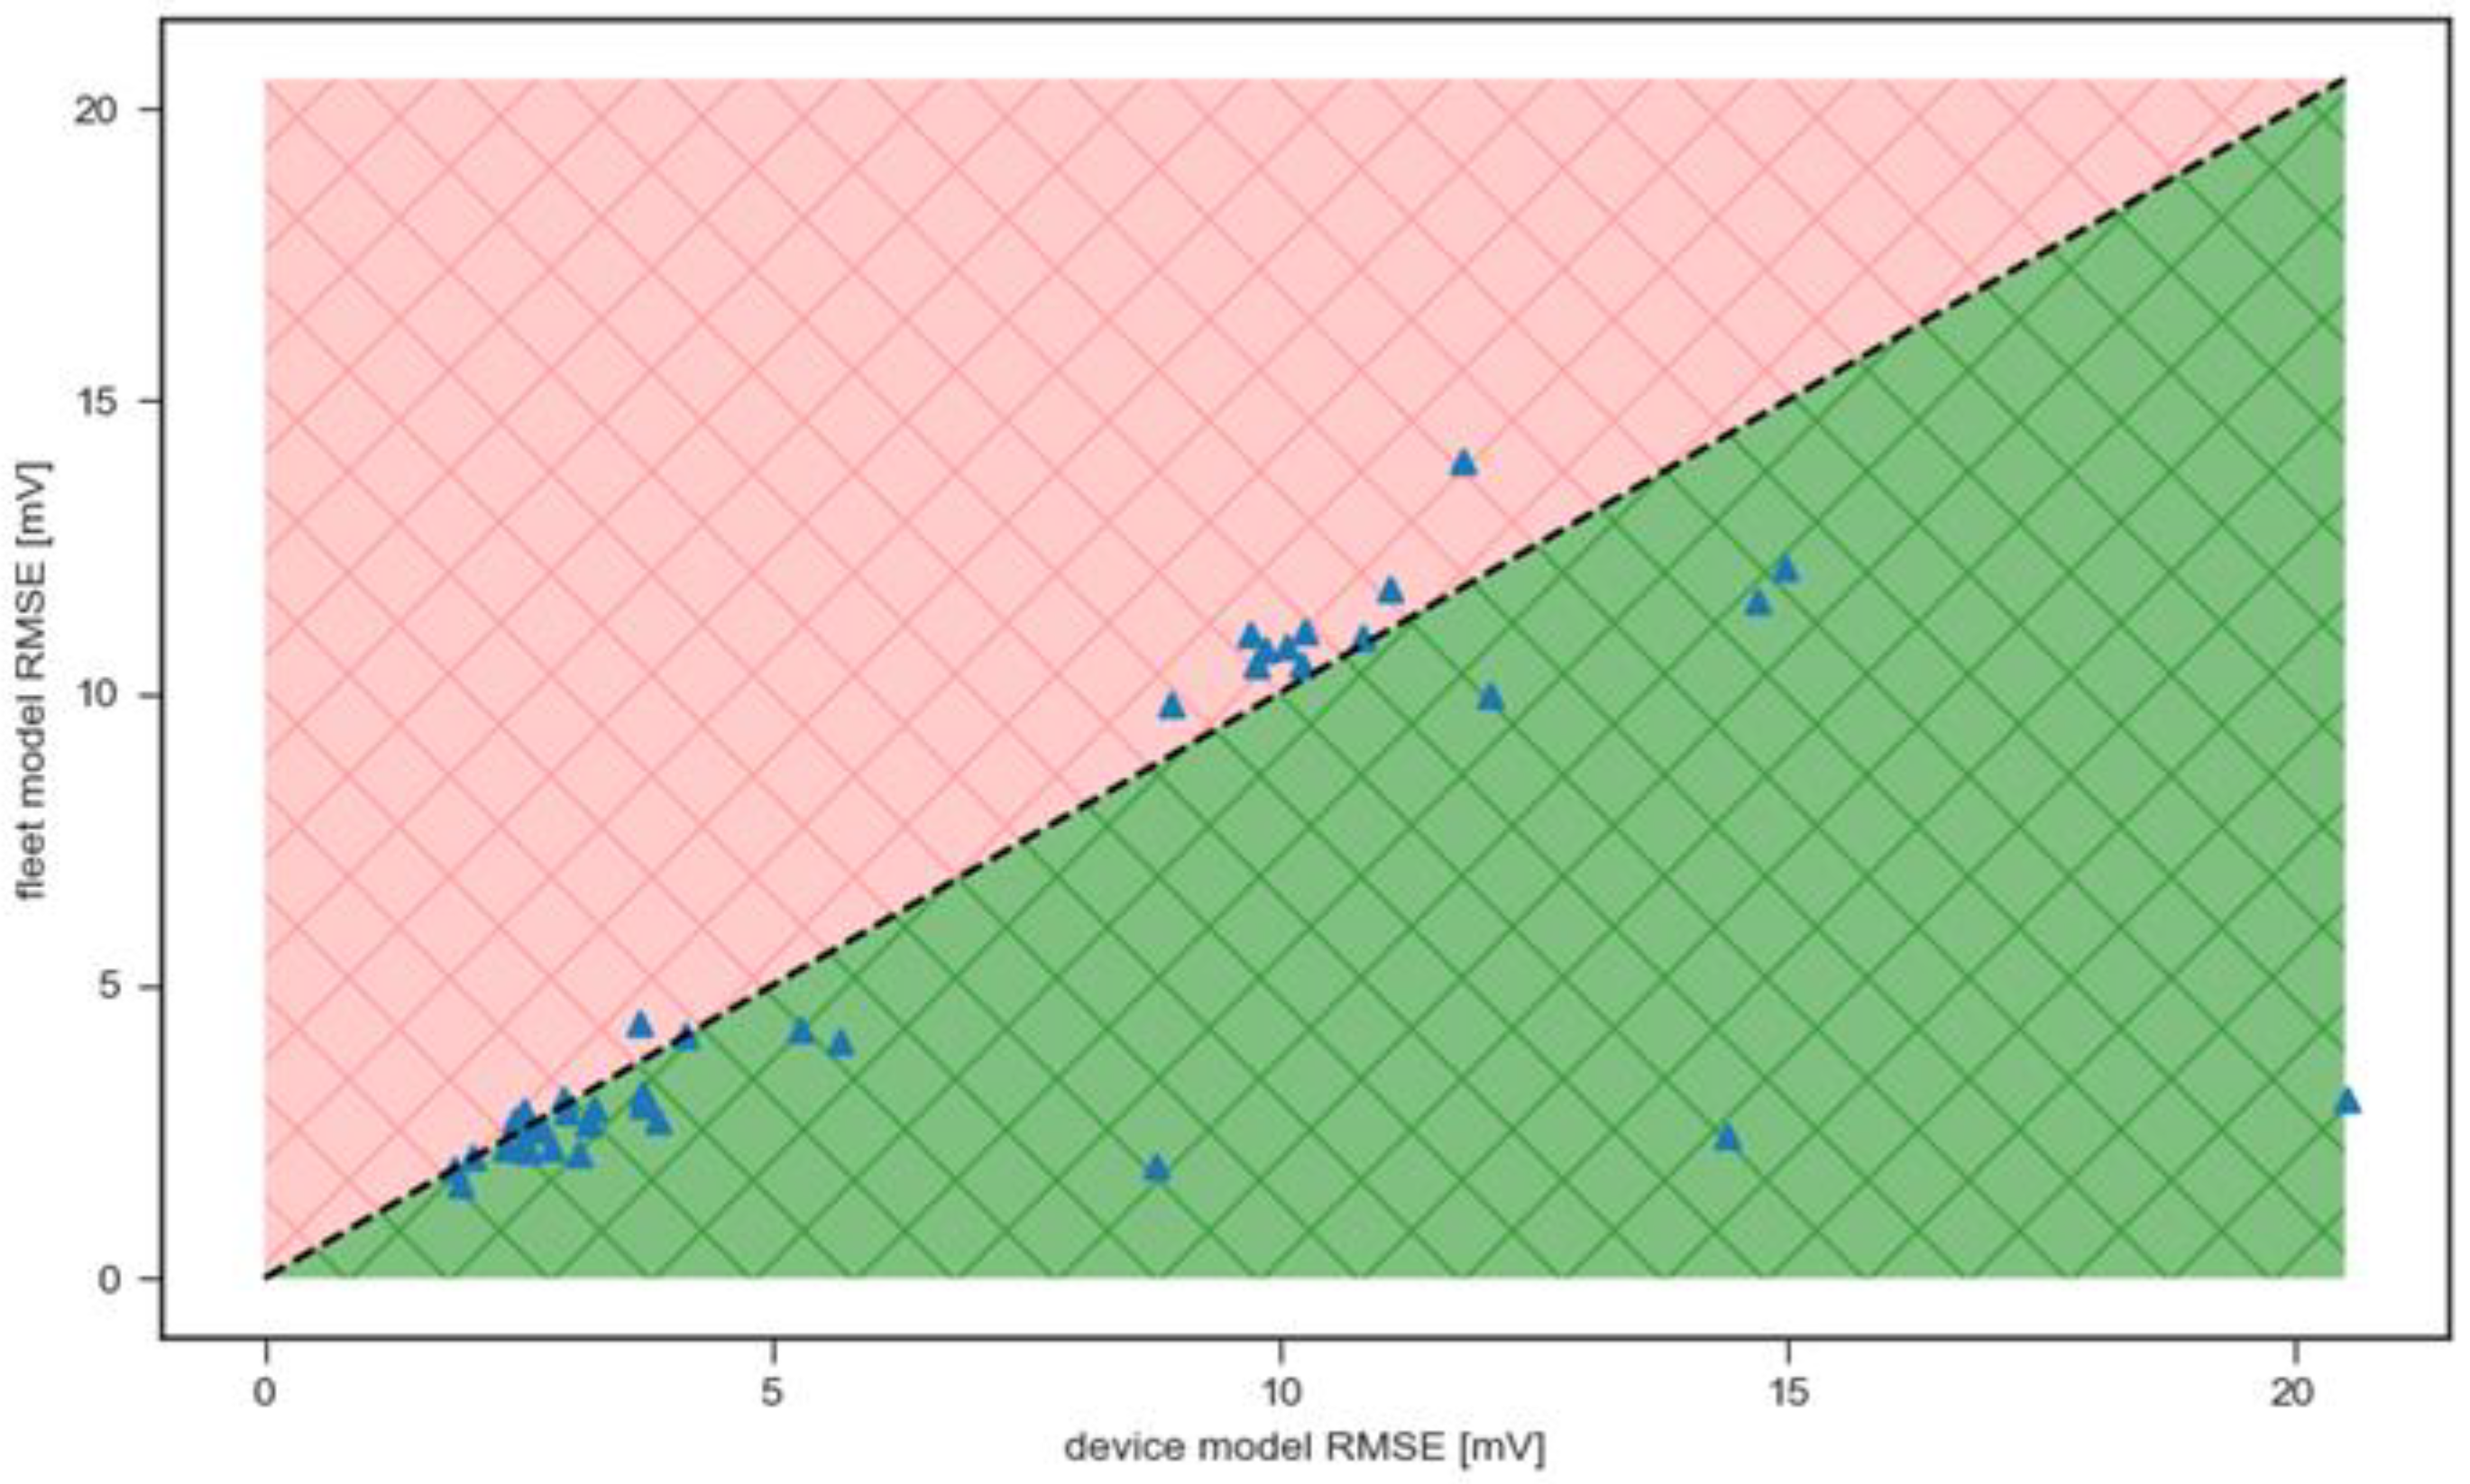
Figure 10.
Estimated SOH scaling factors for capacity decrease and resistance increase for each device. Different colors distinguish the different devices. The figure shows the general SOH trend as well as the spread between devices.
Figure 10.
Estimated SOH scaling factors for capacity decrease and resistance increase for each device. Different colors distinguish the different devices. The figure shows the general SOH trend as well as the spread between devices.

Table 1.
Overview of available fleet data.
| # | Type (Num.) | Battery | Charging Strategy | Monthly Full Equiv. Cycles | Logging Start between |
|---|---|---|---|---|---|
| 1 | Car (19) | NMC, 36 kWh | Depot | 1.0–4.5 | 02.2021–06.2021 |
| 2 | Bus (>15) | NMC V1, 240–330 kWh | Opportunity, Depot | 15.0–50.0 | 11.2021–03.2022 |
| 3 | Bus (25) | NMC V2, 240–330 kWh | Opportunity, Depot | 15.0–45.0 | 11.2021–11.2022 |
Table 2.
Inputs and outputs of the fleet model.
| Inputs/Outputs | Description | Symbol | Unit |
|---|---|---|---|
| core battery model | |||
| current | Current flowing into the battery. Normalized by nominal capacity . | ||
| coulomb_counting | Normalized integrated current. | ||
| low-pass current | Time-filtered current. Since multiple time constants are used, this is a vector of length with one value for each time constant . Time constants are chosen according to the typical usage scenario as well as voltage relaxation times. | ||
| temperature | Temperature as measured by the BMS. This is usually a mean temperature of several sensors built into the battery pack. | °C | |
| voltage | estimated mean cell voltage | V | |
| aging parameter database | |||
| time | Lifetime or rather time since begin of logging. Used to account for calendric aging effects. | y | |
| device-id | Identification number for vehicle | ||
| full cycles | Charge throughput of device normalized by nominal capacity | ||
| relative capacity | estimated normalized capacity | ||
| relative resistance | estimated normalized resistance | ||
| soc0 model | |||
| time | same as above | ||
| device-id | same as above | ||
| initial SOC | estimated SOC at begin of section. Used to adjust the coulomb counting signal. | ||
Disclaimer/Publisher’s Note: The statements, opinions and data contained in all publications are solely those of the individual author(s) and contributor(s) and not of MDPI and/or the editor(s). MDPI and/or the editor(s) disclaim responsibility for any injury to people or property resulting from any ideas, methods, instructions or products referred to in the content. |
© 2023 by the authors. Licensee MDPI, Basel, Switzerland. This article is an open access article distributed under the terms and conditions of the Creative Commons Attribution (CC BY) license (https://creativecommons.org/licenses/by/4.0/).
Share and Cite
MDPI and ACS Style
Lehmann, T.; Weiß, F. Lithium-Ion Battery Aging Analysis of an Electric Vehicle Fleet Using a Tailored Neural Network Structure. Appl. Sci. 2023, 13, 4448. https://doi.org/10.3390/app13074448
AMA Style
Lehmann T, Weiß F. Lithium-Ion Battery Aging Analysis of an Electric Vehicle Fleet Using a Tailored Neural Network Structure. Applied Sciences. 2023; 13(7):4448. https://doi.org/10.3390/app13074448
Chicago/Turabian StyleLehmann, Thomas, and Frances Weiß. 2023. "Lithium-Ion Battery Aging Analysis of an Electric Vehicle Fleet Using a Tailored Neural Network Structure" Applied Sciences 13, no. 7: 4448. https://doi.org/10.3390/app13074448
Note that from the first issue of 2016, this journal uses article numbers instead of page numbers. See further details here.