

Incipient Fault Feature Enhancement of Rolling Bearings Based on CEEMDAN and MCKD
School of Information Science and Engineering, Chongqing Jiaotong University, Chongqing 400074, China
*
Author to whom correspondence should be addressed.
Appl. Sci. 2023, 13(9), 5688; https://doi.org/10.3390/app13095688
Submission received: 1 April 2023
/
Revised: 24 April 2023
/
Accepted: 26 April 2023
/
Published: 5 May 2023
(This article belongs to the Special Issue Signal Analysis and Fault Diagnosis in Mechanical Engineering)
Abstract
:A rolling bearing vibration signal fault feature enhancement method based on adaptive complete ensemble empirical mode decomposition with adaptive noise algorithm (CEEMDAN) and maximum correlated kurtosis deconvolution (MCKD) is proposed to address the issue that rolling bearings are prone to noise in the early stage and difficult to extract feature information accurately. The method uses the CEEMDAN algorithm to reduce the noise of the rolling bearing vibration signal in the first step; then, the MCKD algorithm is used to deconvolve the signal to enhance the weak shock components in the signal and improve the SNR. Finally, the envelope spectrum analysis is performed to extract the feature frequencies. Simulation and experimental results show that the CEEMDAN-MCKD method can highlight the fault characteristic frequency and multiplier frequency better than other methods and realize the characteristic enhancement of incipient fault vibration signals of rolling bearings under constant and variable operating conditions.
1. Introduction
Bearing is a key part in the normal operation of mechanical equipment, but because of its very complex operating conditions, it is prone to failure. Since the obtained vibration signals have a large noise content and a weak fault impact component, it is difficult to filter and analyze the data to properly realize fault detection, especially when incipient bearing problems arise [1]. As a result, it is currently difficult to figure out how to effectively reduce the noise of the collected vibration signal and improve the signal’s weak impact component [2].
When rolling bearings are damaged by incipient faults, the collected vibration signal is non-smooth and non-linear. For the signal in this condition, scholars have proposed many noise reduction methods. Qin et al. [3] achieved incipient fault diagnosis of rolling bearing acoustic signals by an improved empirical wavelet transform method. Yuan et al. [4] successfully implemented bearing incipient fault detection using ensemble noise-reconstructed empirical mode decomposition (ENEMD). Shen et al. [5] used a combination of empirical mode deposition (EMD) and long short-term memory (LSTM) to achieve aircraft hydraulic fault diagnosis in a complex noise environment. Damine et al. [6] combined the improved ensemble empirical mode decomposition (EEMD) with enhanced deconvolution and successfully removed the noise from the early bearing fault signals. To perform the early defect detection of rolling bearings, Zheng et al. [7] improved parameters for fast ensemble empirical mode decomposition and the Maximum Autocorrelation Impulse Harmonic to Noise Deconvolution method. Lin [8] used variational modal decomposition in bearing fault diagnosis and successfully extracted the high-dimensional data features from it. Torres et al. [9] proposed complete ensemble empirical mode decomposition with adaptive noise (CEEMDAN); CEEMDAN can not only effectively suppress the modal mixing phenomenon brought by EMD methods, but also solve the problems of large computation and poor decomposition integrity of EEMD, and this algorithm has been widely used in recent years. Bie et al. [10] used CEEMDAN for noise reduction of the signal and combined it with a particle swarm optimization-support vector machine to achieve fault diagnosis of rolling bearings. Liu et al. [11] used a combination of CEEMDAN and fuzzy entropy to achieve the extraction of fault features for the problem that the wind turbine bearing signal is weak and the fault information is not easily extracted.
The kurtosis can detect anomalous information in the signal and also filter the signal to maximize its impact in the signal [12]. Wiggins [13] proposed a crag-based minimum entropy deconvolution method, which uses the entropy minimization criterion to optimize the FIR filter parameters so that the entropy of the filtered signal is minimized and the fault shock characteristics in the signal are enhanced. Scholars have made use of the algorithm in fault diagnosis and have demonstrated that minimum entropy deconvolution (MED) has good results in noise reduction and highlighted the shock components in the signal. Li et al. [14] used wavelet packet and coordinate transform for fault feature enhancement of rolling bearings. Qiao et al. [15] used improved empirical wavelets and MED to process weak fault signals to achieve bearing fault diagnosis. Ha et al. [16] combined time-synchronous averaging (TSA) with MED to remove noise for fault feature extraction of gearboxes. However, scholars found that the algorithm still has shortcomings [17], the shock component in the rolling bearing signal is periodic, and the MED algorithm can usually deconvolve only a single pulse feature and is prone to trigger modulation phenomena [18]. Mcdonald [19] et al. proposed the maximum correlation kurtosis deconvolution method to solve that problem. This method preprocesses the non-integer fault cycles in accordance with the a priori knowledge of the fault cycles and extracts the shock pulses that occur at each rotation of the rotating machinery fault signal. MCKD has been a popular tool for diagnosing problems with gears, bearings, and other rotating machinery parts in recent years. The reliability of the suggested method was experimentally confirmed by Cui et al. [20], who employed MCKD to improve the reconstructed signal in order to tackle the problem of a weak rolling bearing signal. However, the filter length, shift number, and deconvolution period are easily able to alter the enhancing effect of MCKD. Thus, the literature [21] employed particle swarm optimization (PSO) to optimize the filter length and the fault period in MCKD in order to achieve the extraction of faint-bearing fault features against a noisy environment. How to remove noise from the redundant signal to highlight the fault characteristics is the key to achieving bearing fault diagnosis because the vibration signal has the characteristics of low amplitude, weak shock component, and the amplitude may change significantly in a short period of time when an incipient fault occurs in rolling bearings. Fault feature enhancement methods can filter out the noise in the signal by means of filtering, decomposition reconstruction, deconvolution, etc., highlighting the weak shock components in the signal and extracting the fault features in the signal. Despite the fact that the MCKD algorithm can reveal continuous impulses hidden by loud noise, it is challenging to meet the requirements for fault feature extraction. As a result, the signal can be processed by combining the CEEMDAN and MCKD algorithms, first using CEEMDAN to reduce noise in the contained signal and then using the MCKD algorithm to enhance features, which can obtain more failure shock components, increase SNR, decrease noise interference, and extract fault features.
According to the analysis above, the issue is that it is difficult to extract the tiny defect features of rolling bearings, enhance the components of mild shock, and lessen the impact of noise on fault detection. This paper proposes a strategy for improving incipient fault features based on CEEMDAN-MCKD. Prior to reconstructing the fault signal using the intrinsic mode function (IMF) components chosen based on kurtosis and correlation coefficient selection criteria, the rolling bearing vibration signal is first initially noise reduced using the CEEMDAN algorithm. Afterward, the MCKD algorithm is used to enhance the weak shock components in the reconstructed signal and find the envelope to extract the fault feature frequency to realize feature extraction.
2. Theoretical Basis
2.1. Complete Ensemble Empirical Mode Decomposition with Adaptive Noise
CEEMDAN adds a finite amount of adaptive white noise to the signal at each stage to suppress the mode mixing phenomenon when the signal is decomposed by EMD. At the same time, the CEEMDAN algorithm also has the advantages of low reconstruction error and high decomposition efficiency. The detailed algorithm steps of CEEMDAN are as follows:
Step 1: Let the time series signal of the rolling bearing be , be the added white noise sequence , is the standard deviation of the white noise series, and is the number of trials, and let be the signal after adding white noise. Then, the construction signal is as follows:
Step 2: The signal is decomposed by EMD and the set of components obtained from the decomposition is averaged to obtain .
Step 3: Calculate the first residual component:
Step 4: By adding white noise to , tests are carried out and is decomposed in each test until it is decomposed into first-order components, and is obtained by calculation:
where is the jth order component generated by the EMD method.
Step 5: Calculate the second residual component:
Step 6: Repeat the above steps until the condition of EMD cannot be satisfied, then terminate the decomposition. At this point, components are obtained and the final residual component is denoted as , and the signal can be written as:
2.2. Maximum Correlated Kurtosis Deconvolution
The MCKD method relies on selecting a FIR filter and using correlation kurtosis as the evaluation measure to maximize the kurtosis value of the filtered signal and highlight the periodic shocks obscured by noise. The signal correlation kurtosis is expressed as follows:
where is the number of shifts, , is the period of the shock signal, is the number of samples of the input signal. If the effect of noise on the acquired vibration signal is ignored, MCKD is essentially the recovery of the actual signal to through a filter, namely:
where is the length of the filter, is the original signal, is the transpose.
The objective function of MCKD is as follows:
To find the optimal filter to maximize the correlation kurtosis value, the solution equation is as follows:
The filtering coefficients are obtained as:
With the above description, the iterative solving process of the filter system is as follows:
- Initialization parameters deconvolution period , filter length and shift number , error convergence accuracy , the maximum number of iterations , and filter coefficients ;
- Calculate , , and of the signal ;
- Calculate the filtered signal ;
- Calculate and from ;
- According to Equation (11), calculate the new filter coefficients ;
- Compare the correlation kurtosis difference before and after signal filtering. If is less than threshold , the iteration stops; otherwise, return to step (3) to continue the cycle.
3. Based on CEEMDAN-MCKD Bearing Fault Feature Enhancement Method
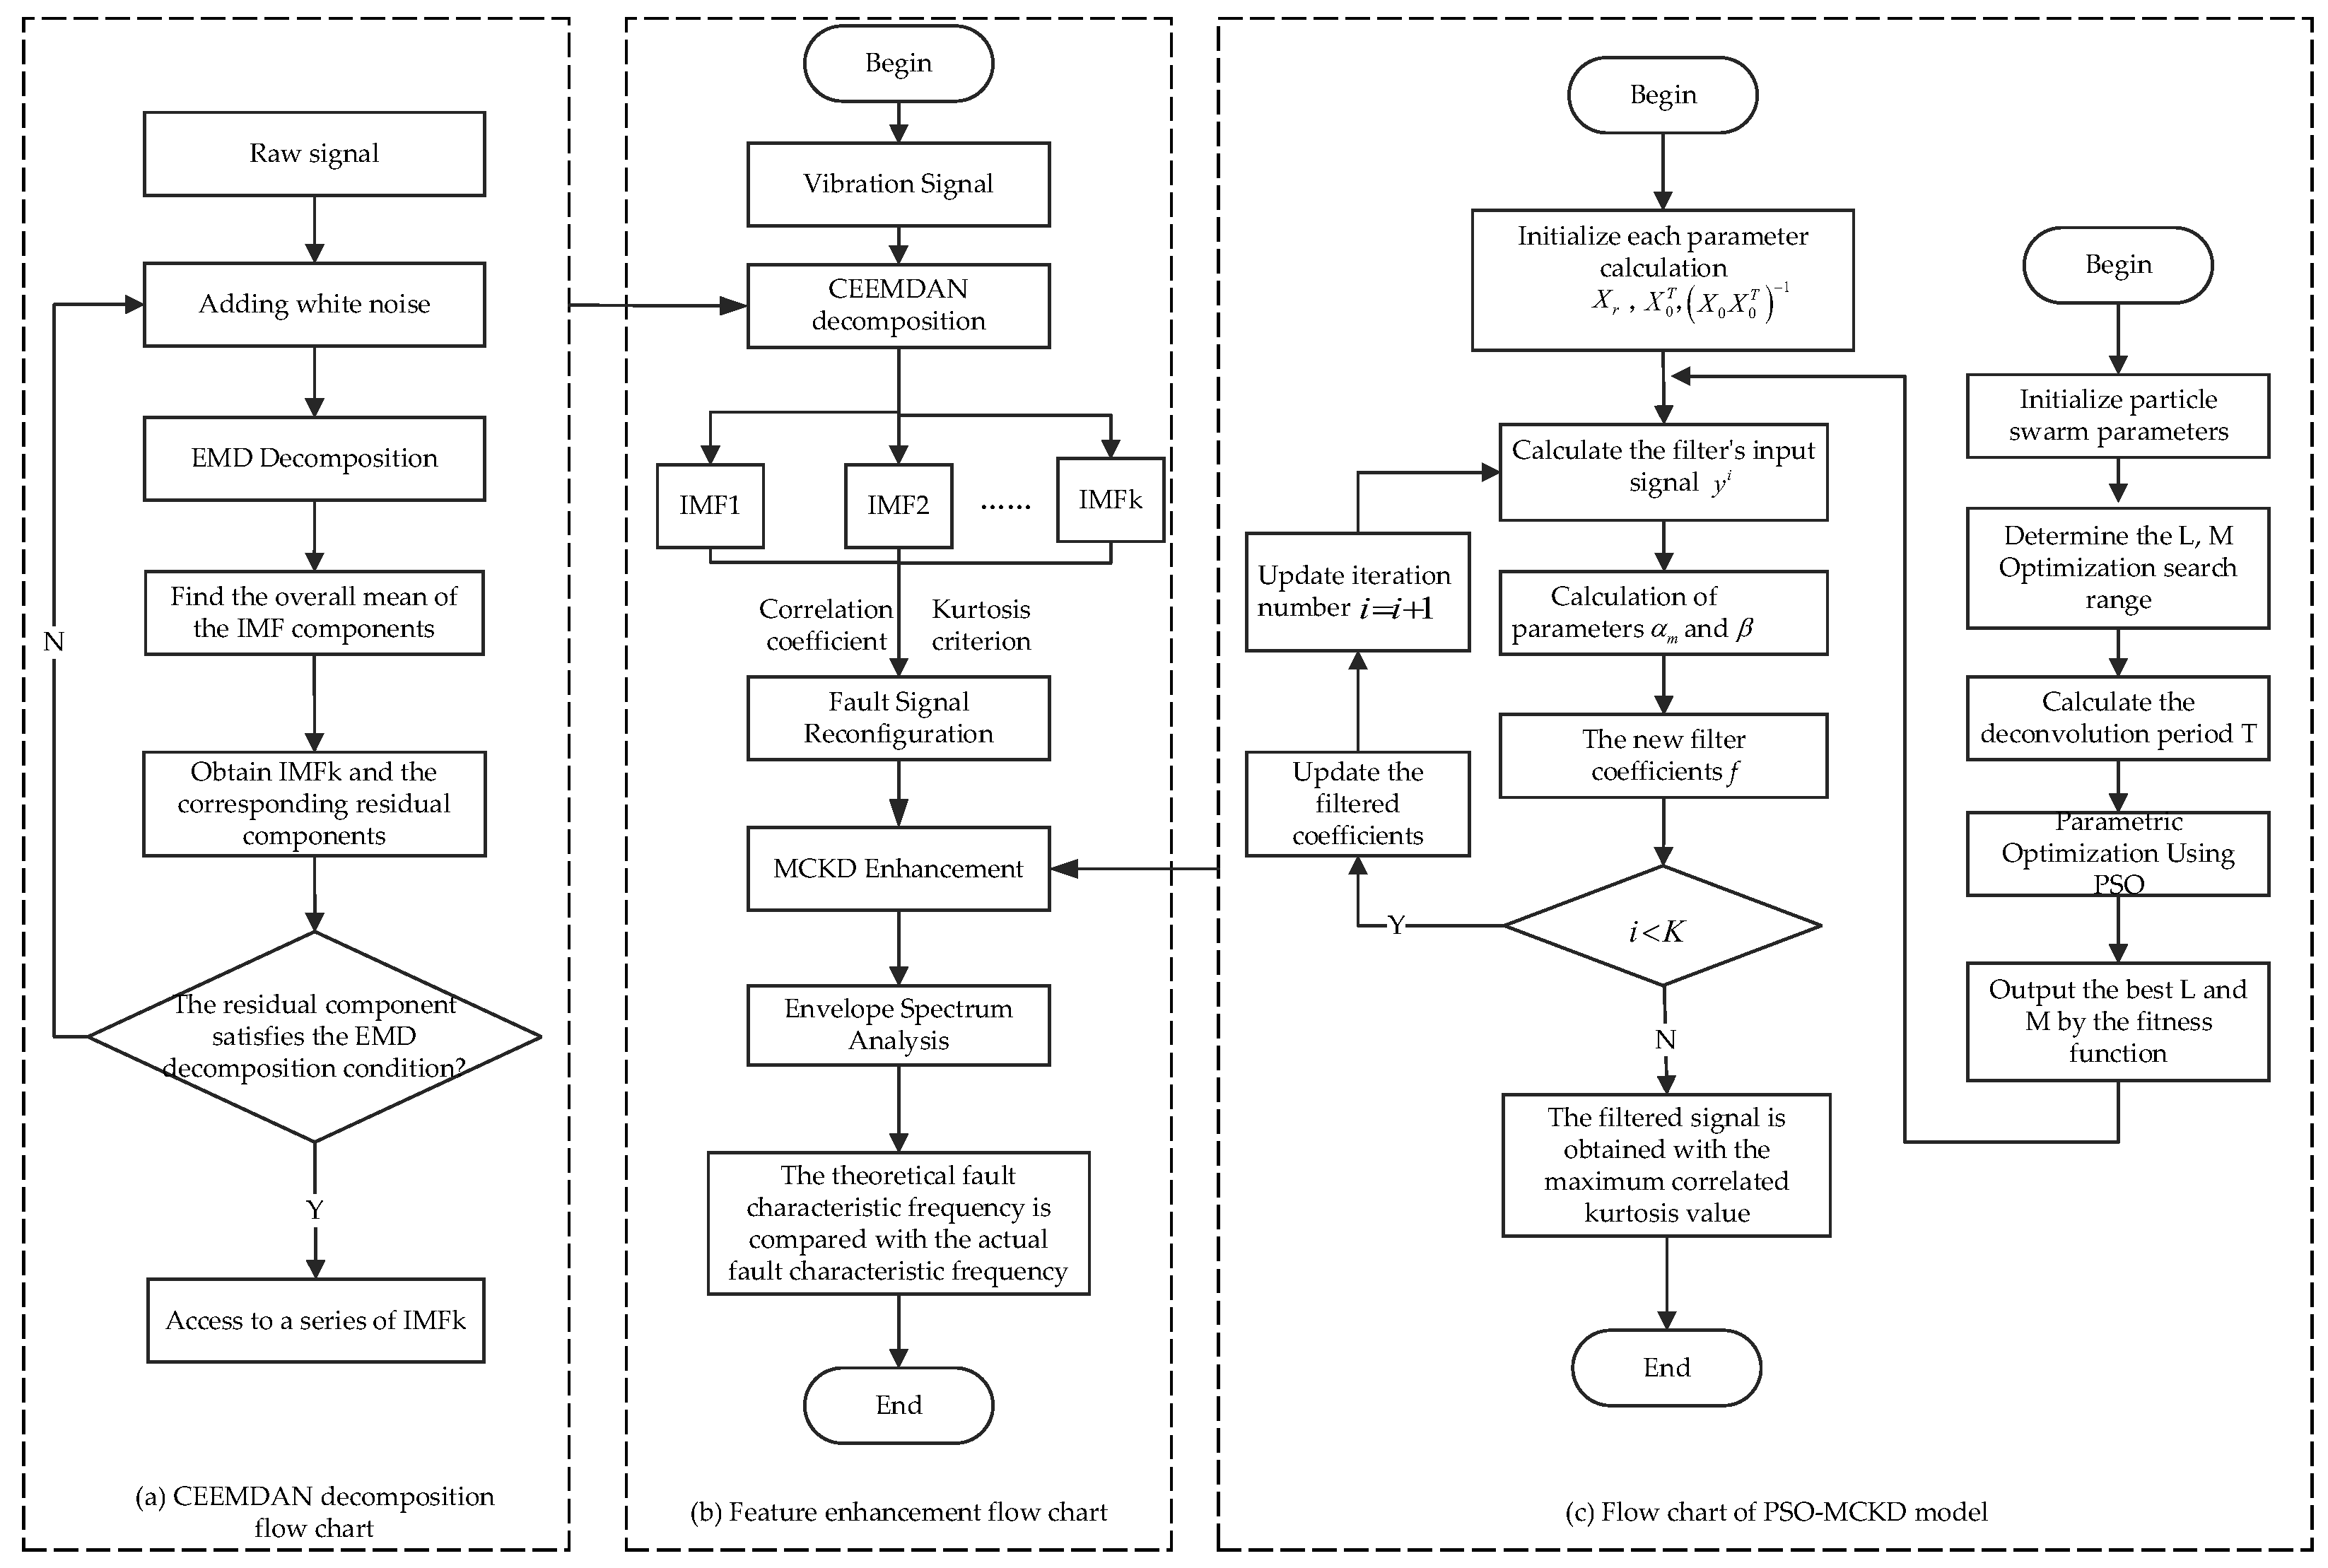
This work proposes a vibration signal rolling bearing failure feature augmentation approach based on CEEMDAN and MCKD, which can successfully reduce noise interference and enhance SNR. The length L, deconvolution period T, and shift number M of the parametric filter have a direct impact on the enhancing effect of MCKD. L and M are optimized by the PSO method for the parameters while T is computed using the bearing parameters. Figure 1 shows the flow diagram of the CEEMDAN-MCKD method, and the specific flow is as follows:
- Initial noise reduction of the original signal using the CEEMDAN method.
- The optimal IMF component is selected based on kurtosis-correlation coefficient selection criterion, and the fault signal is reconstructed.
- Determining the optimization range of parameters L and M and performing parameter optimization for the MCKD algorithm.
Figure 1.
Flow chart of CEEMDAN-MCKD method.
The envelope spectral peak factor [22], a dimensionless indicator, is taken into account when using the particle swarm algorithm for the optimization search to take into account both the period and the intensity of the shock component of the signal, whereas the kurtosis is sensitive to the shock signal. As a result, the fitness function is the multiple of the envelope spectral peak factor and the kurtosis.
where is the envelope spectrum peak factor, signal envelope spectrum amplitude sequence for ; for the envelope spectrum in the frequency, the range of the amplitude is , the value of is greater than the rotation frequency of the shaft where the faulty bearing is located, value should be greater than the maximum fault frequency within the bearing drive system, value of 4~8.
The expression for kurtosis is shown as follows:
where is kurtosis value, is vibration signal, is sampling number, and is root mean square value of signal .
Combining the kurtosis and envelope spectral peak factors, the fitness function is defined as the product of the two:
is selected as the fitness function of PSO algorithm optimization, which can not only consider the existence of the impact component in the signal, but also consider the periodicity and intensity of the impact component in the signal so that more accurate optimization results can be obtained. Before the optimization search, the ranges of L and M are determined to be [50, 700] and [1, 7], respectively, and the deconvolution period T can be calculated according to the equation . The feature frequencies of the failure features of the inner and outer rings of the bearings are calculated as shown in Equations (19) and (20). The optimal combination of the influencing parameters is determined by using PSO for MCKD on the reconstructed signal.
where is the number of rolling elements, is the bearing diameter, is the rolling element diameter, is the speed of the bearing, and is the contact angle.
- 4.
- Deconvolution of the reconstructed signal by bringing the optimal parameters L, M, and T into the MCKD algorithm to weaken the effect of noise on the signal and enhance the impact characteristics.
- 5.
- To achieve the feature extraction of the bearing, envelope processing is implemented on the enhanced signal.
4. Simulation Signal Analysis
To verify the ability of the CEEMDAN-MCKD method to enhance the shock component of the signal and to enhance the feature frequencies of tiny fault signals that are submerged in noise, the bearing is considered as a single-degree-of-freedom linear time-invariant system [23]. The simulation signal expression is as follows:
where intrinsic frequency Hz, damping factor , amplitude , Gaussian white noise is −13 dB, sampling frequency 2000 Hz, sampling points are 2000.
Figure 2 displays the time domain graphs of the simulated signal with and without noise injection. The envelope spectrum of the synthesized signal is shown in Figure 3 without any noise reduction processing, and one can observe from Figure 3 that when no processing is applied to the signal, it is challenging to identify the feature frequencies. CEEMDAN-MCKD is used to process the noise added simulated signal, and the results of the envelope analysis are displayed in Figure 4. As can be observed in Figure 4, the fault feature frequency and the impact of the multiplier frequency are clear and the side frequencies are also effectively suppressed, demonstrating the effectiveness of the CEEMDAN-MCKD approach for the enhancement of bearing fault features.
5. Test Verification
The feature enhancement method suggested in this work was used for the vibration signal characterization of rolling bearing inner rings with incipient flaws to assess the efficiency of the suggested approach. The experiments used two sets of bearing accelerated life data sets: XJTU-SY [24] and laboratory self-tested bearing accelerated life test data.
5.1. Equipment and Data
- XJTU-SY Bearing Data
The test platform of XJTU-SY is shown in Figure 5, which is composed of an AC motor, hydraulic loading system, test bearings, etc. The test rolling bearing model is LDK UER204 and the specific bearing parameters, as shown in Table 1. During the data acquisition, the motor speed of condition 3 was set at 2400 r/min, the bearing was subjected to a radial force of 10 kN, the sampling frequency Fs was 25.6 kHz, and the number of sampling points was 5120. It can be known from the literature [24] that bearing 3_1 is an outer ring failure and bearing 3_4 is an inner ring failure, and the inner and outer ring failure of the bearing is shown in Figure 6. Therefore, these two data are used to verify the effectiveness of the proposed method.
- B.
- Bearing Data Collected in the Laboratory
The multistage centrifuge fault diagnosis equipment used in the second experiment served as the data acquisition unit, as shown in Figure 7. A heavy-duty turntable, bearings, a gearbox, a shaft, a variable speed drive motor, and a speed regulator make up the apparatus. The bearing model used is NTN NU205E, the value of is 25 mm, the value of is 52 mm, and the contact angle is 60°. The vibration signal’s sample frequency was set to Hz, the sampling period was 0.2 s, the speed was 600 r/min, and the bearing used in the experiment contained 8 rolling bodies. Theoretically, 49.6 Hz is the feature frequency of bearing inner ring failure under operating conditions, according to the calculation.
5.2. Experimental Study under Constant Operating Conditions
The method of this paper is used for rolling bearing fault feature enhancement and extraction. Firstly, the incipient fault data of bearing 3_4 in XJTU-SY was analyzed and a noise of −13 dB was added to the signal to highlight the feature enhancement capability of the proposed method in the strong noise background. The bearing inner ring’s time domain diagram during a fault is shown in Figure 8 and the inner ring fault signal’s spectrum without noise addition is shown in Figure 9. The vibration signal has more high-frequency interference noise, as shown in the spectrum. Figure 10 presents the results of the signal’s envelope analysis and illustrates the difficulties in precisely locating the bearing defect characteristic frequency.
CEEMDAN was used to break down the fault signal and 13 components were acquired, with the decomposition results displayed in Figure 11. This improves the SNR and increases the difference of fault characteristics.
To select the modal components that contain the information on the inner ring fault features, the influence of noise is further reduced, and the impact components are enhanced. The correlation coefficient and kurtosis values of each IMF component are displayed in Table 2 after combining the kurtosis and correlation coefficient criteria to choose the IMF components to reconstruct the signal. The correlation coefficient’s standard deviation serves as the threshold value, while 3 serves as the threshold value for kurtosis. This allows for the effect of keeping the fault information in the signal and effectively reducing the noise by taking into account both the impact features of each component and the correlation between each component and the original signal simultaneously in time.
The IMF2, IMF3, IMF4, IMF5, and IMF6, which also meet the value of kurtosis greater than 3 and the value of correlation coefficient greater than 0.1632, were selected to reconstruct the signals. The time domain diagrams of the reconstructed signals and the results of the envelope analysis are shown in Figure 12 and Figure 13. From Figure 12, it can be seen that the shock component in the signal is significantly increased, which indicates that the noise in the signal can be effectively removed by using the CEEMDAN method.
Comparing Figure 10 and Figure 13, it is found that the noise is better suppressed in the envelope of the reconstructed signal, but the fault feature frequency, as well as the multiplier frequency, are still masked. As a result, the signal is feature-enhanced using the method presented in this work. Firstly, the feature frequency of the bearing failure under this condition is calculated as 196.6 Hz according to the formula (19), then T, and then the particle swarm algorithm is used to perform a parameter search for the filter L and shift number M in MCKD. The initial parameters of the particle swarm parameter optimization method are set, the number of particle swarms is 30, the maximum number of iterations is 30, the inertia weight is 1, the acceleration factor is 2, the search range of L is [50, 700], and the M search range is [1, 7]. After optimization, the optimal set of parameters is L = 700 and M = 4. Combined with the parameters T, the optimal set of parameters is formed and inputted into the MCKD algorithm to enhance the signal and then perform envelope analysis.
The time domain signal plot after enhancement is shown in Figure 14, where it can be observed that the fault pulse characteristics have been greatly improved while the majority of the noise has been eliminated. The envelope of the signal after enhancement is shown in Figure 15; it is clear that the pulse characteristics at frequencies of 199.96 Hz, 349.92 Hz, 589.88 Hz, 789.8 Hz, and 984.80 Hz are noticeable. These results almost exactly match the 196.6 Hz fault feature frequency computed theoretically and the multiplier frequency, demonstrating the applicability of the approach for the diagnosis of incipient bearing problems.
To prove the necessity of combining the CEEMDAN algorithm and the PSO optimized MCKD algorithm, the fault signal is not preprocessed with CEEMDAN, and the simulated signal is analyzed based on the PSO optimized MCKD, setting the L and T seeking ranges to [50, 700] and [1, 7]. The envelope analysis is used after the MCKD feature enhancement, and the analysis results are shown in Figure 16.
As can be seen in Figure 16, the shock component is enhanced when the fault features in the signal are enhanced using only the PSO-MKCD method, but there is more interference in the envelope, and it is more difficult to observe the fault feature frequencies from the envelope where the periodic trend exists. There is also more interference near the peak 194.96 Hz and 394.92 Hz. This demonstrates that the noise may be mistaken for the impact component to increase the signal by the MCKD method, lowering the accuracy of feature extraction. The results of the envelope analysis of the fault signal processed by CEEMDAN-MED are shown in Figure 17. From the figure, it can be seen that the two spectral peaks closest to the theoretical value of 196.6 Hz of the inner ring fault frequency are 189.96 Hz and 209.96 Hz, which are far from 196.6 Hz. As a result, the results of the envelope analysis cannot be used to determine whether the bearing’s inner ring is defective. In contrast, the method of CEEMDAN-MCKD is more effective in extracting features for incipient faults in the inner ring.
With regard to the second set of data, Figure 18a demonstrates that the shock component in the signal exhibits periodicity and that noise of −7 dB is added to the signal. Figure 18b displays the temporal domain diagram of the signal following the addition of the noise. Applying this technique to the signal results in an improvement, as shown in Figure 18c, and when compared to Figure 18a, the signal’s shock component has undergone a considerable enhancement. The envelope spectrum before and after the enhancement is acquired to further confirm the enhancement effect. The actual fault signal envelope appears in Figure 19a, although, while having a more prominent feature frequency in the envelope, there is a significant disparity between it and the fault feature frequency, making it challenging to directly extract the fault features. The envelope spectrum after enhancement is shown in Figure 19b, from which the rolling bearing’s fault feature frequency and multiplier frequency can be seen. The prominent frequency is 50 Hz, which is nearly identical to the inner ring fault feature frequency of 49.6 Hz under this working condition, indicating that the method has good effects in the feature enhancement.
The aforementioned experimental investigation demonstrates the viability and efficiency of the CEEMDAN-MCKD method, which is helpful for accurately extracting the fault features.
5.3. Experimental Study under Variable Working Conditions
Considering that the operation of the bearing is not constant, there will be some unpredictable working conditions; the load change of the system input and the change of speed and other factors with the system change of power input and load will change the operating conditions of the bearing. The vibration signals collected under variable working conditions are more complex. To enhance the features and realize the feature extraction for the incipient faults of rolling bearings under different rotational speeds, the fault signals of two different working conditions in XJTU-SY, namely, working condition 1 and working condition 3, are selected to construct a fault signal of the outer ring of the bearing under variable working conditions. The data set in working condition 1 is Bearing1_1 and the data set in working condition 3 is Bearing3_1. The rotational speed of the rolling bearing in working condition 1 is 2100 r/min and the radial force is 12 kN, the rotational frequency of the rolling bearing is 35 Hz, and the theoretical value of the fault feature frequency is 107.94 Hz. The rotational frequency of the rolling bearing in working condition 3 is 40 Hz and the fault feature frequency of the outer ring is 123.94 Hz. The time domain diagram of the fault signal under the corresponding working condition is shown in Figure 20, in which 0.1 s data is intercepted under each working condition, and the sampling frequency is 25,600 Hz.
The rolling bearing’s vibration signal, which switches from working condition 1 to working condition 3 during operation, is built using the time domain waveforms of working conditions 1 and 3. Figure 21 displays the signal’s time domain waveform. A total of −10 dB of noise is introduced to the signal in order to improve the impact component of the signal. The signal’s envelope is analyzed and the results are displayed in Figure 22. According to Figure 22, the two prominent feature frequencies are 244.90 Hz and 494.08 Hz, which are the 2-fold and 4-fold frequencies of the outer ring fault feature frequency 123.36 Hz under working condition 3. However, no additional characteristic frequency information can be obtained, and the fault feature frequency under working condition 1 is not successfully obtained, so the signal is enhanced by CEEMDAN-MCKD.
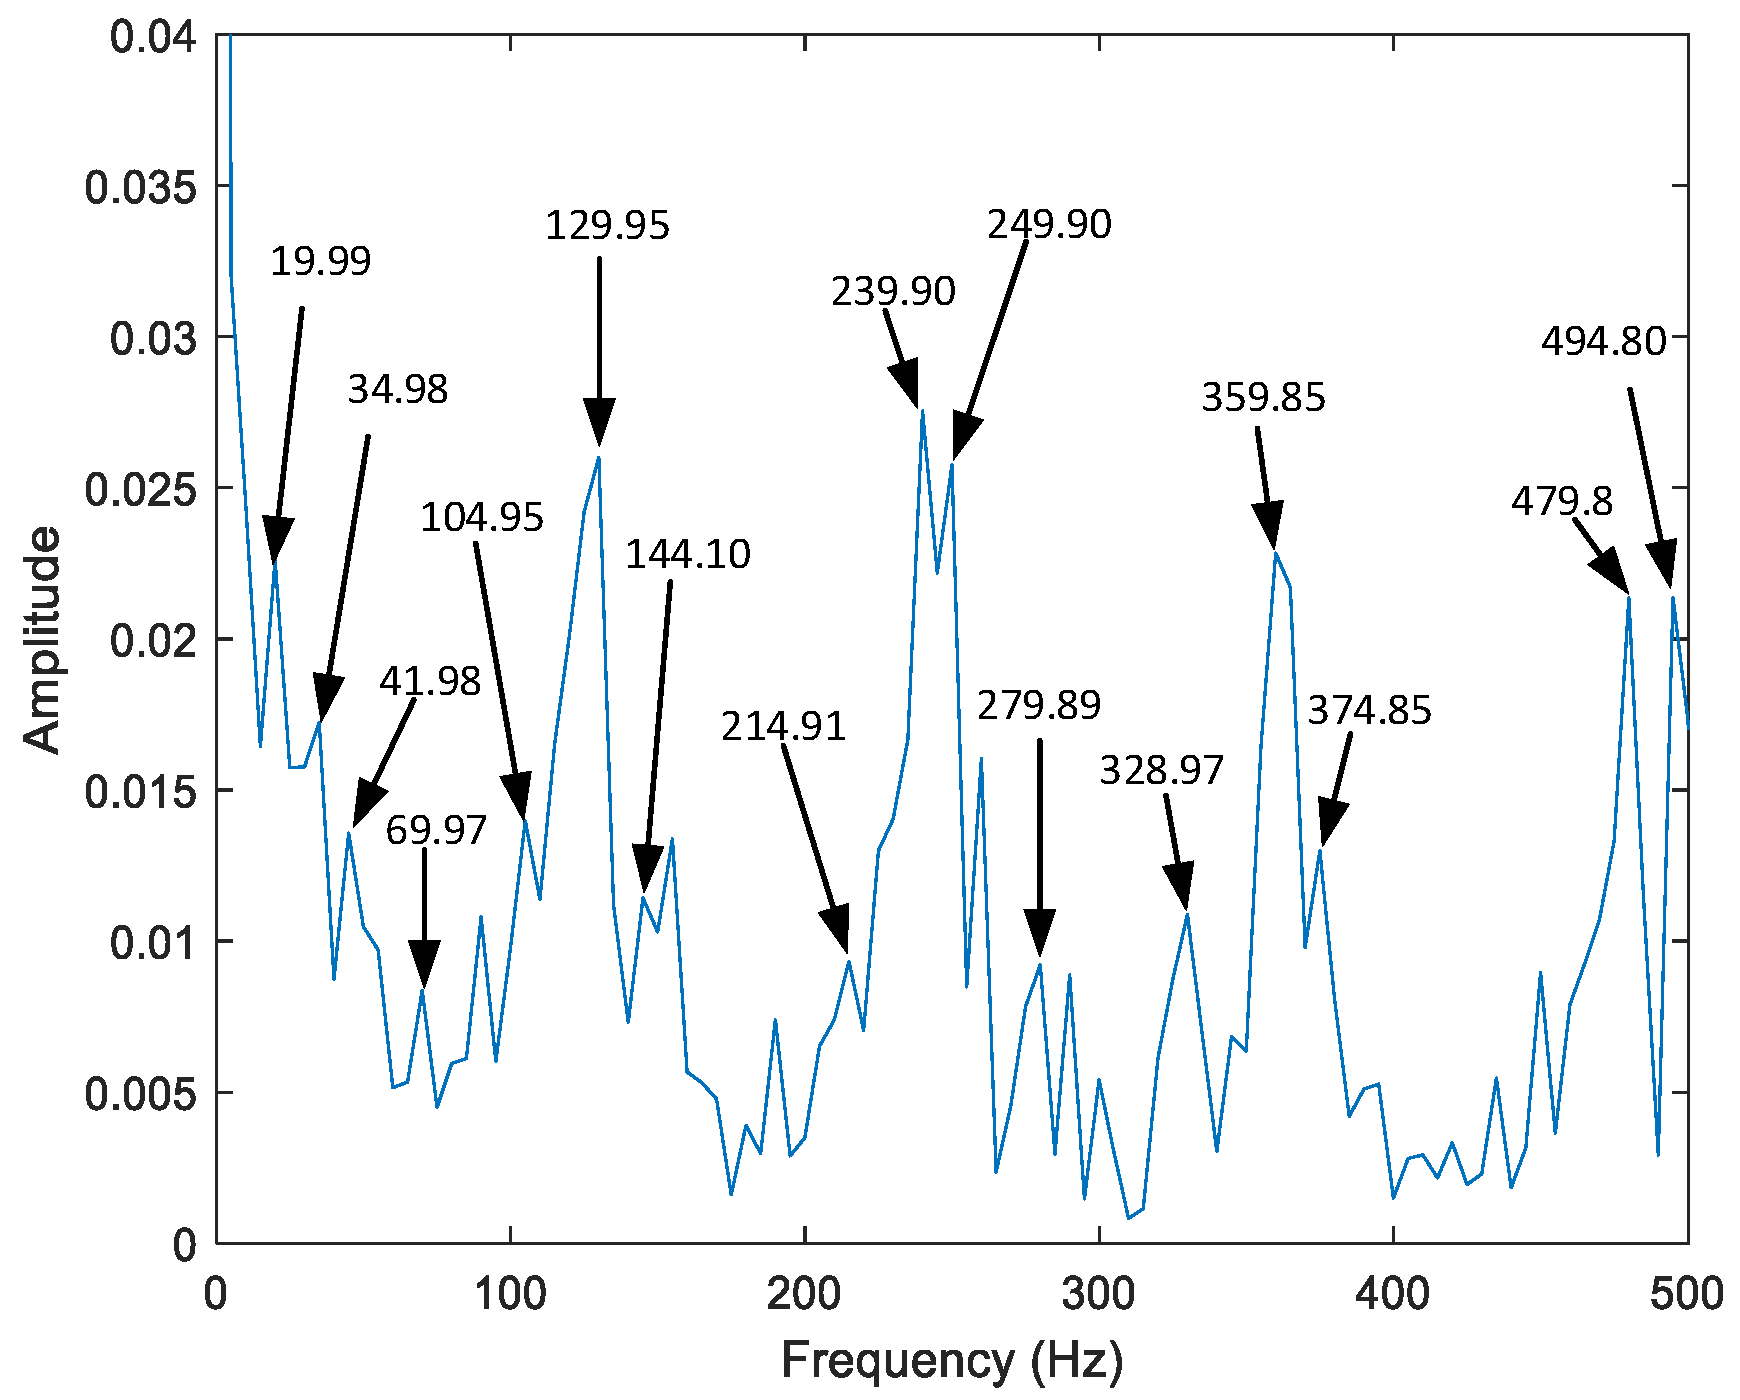
As shown in Figure 23, the signal is divided into 13 components using CEEMDAN. Following the resolution of the kurtosis and correlation coefficients for each component, Table 3 lists the values for the first eight components’ kurtosis and correlation coefficients. Based on the correlation coefficient 0.171 and kurtosis 3 threshold values, the components IMF2, IMF3, IMF4, IMF5, and IMF6 are selected for reconstruction. The reconstructed signals are then obtained and the results of the envelope analysis of the reconstructed signals are shown in Figure 24. The fault feature frequencies of 124.95 Hz, 244.90 Hz of the second octave, and 494.08 Hz of the fourth octave under working condition 3 are highlighted after noise reduction by CEEMDAN decomposition, as can be seen in Figure 24, as well as 109.96 Hz, which corresponds to the theoretical value of 107.94 Hz of the outer ring fault feature frequency under working condition 1. The sole rotational frequency indicated, though, is under working condition 3. The best impact of L and M are achieved as 685 and 4, respectively, using the PSO algorithm to identify the optimal parameters L and M in MCKD in order to extract more fault feature frequencies, as well as rotational frequencies, under various working conditions. In order to increase the signal’s shock component, the values of L and M are introduced into the MCKD. The augmented signal then undergoes envelope analysis and the results are displayed in Figure 25 and Figure 26.
From Figure 26, it can be seen that the prominent amplitudes of 129.95 Hz, 249.90 Hz, 374.85 Hz, and 494.8 Hz correspond to the fault feature frequencies 123.36 Hz, 246.72 Hz, and 370.08 Hz for the second and third octaves and 493.44 Hz for the fourth octave in working condition 3. The rotational frequencies for operating condition 3 are 41.98 Hz, 144.10 Hz, 239.90 Hz, 279.89 Hz, 359.85 Hz, and 479.8 Hz. The more prominent 104.95 Hz, 214.91 Hz, and 328.97 Hz in the figure are exactly 107.94 Hz and 2-fold and 3-fold frequencies of the fault feature frequency of the rolling bearing under working condition 1, while 34.98 Hz, 69.97 Hz, and 105.95 Hz, etc., are exactly in line with the 35 Hz and its multiplier frequency of the rolling bearing under working condition 1.
The comprehensive analysis above shows that CEEMDAN-PSO-MCKD has a good effect on the feature enhancement of the sudden change of incipient fault signals of bearings under variable working conditions.
6. Conclusions
To extract the fault information in the weak fault signal effectively and realize the fault diagnosis, a bearing incipient fault feature enhancement method based on CEEMDAN and MCKD is proposed, and the main conclusions are as follows:
- (1)
- The fault signal is decomposed using the CEEMDAN algorithm to obtain a set of IMF components, and the sensitive IMF components are selected according to the kurtosis-correlation coefficient criterion and the signal is reconstructed, which can effectively remove the noise from the fault signal.
- (2)
- In comparison to the MED method, the MCKD algorithm may emphasize continuous shock pulses in rotating equipment. PSO-MCKD then processes the signal to efficiently improve the signal’s weak shock components after noise reduction.
- (3)
- Envelope analysis is performed on the signal processed by feature enhancement to realize the extraction of bearing incipient fault features. The bearing inner ring faults under constant working conditions and the bearing outer ring faults under varied working conditions are used to demonstrate the method’s usefulness. When compared to the PSO-MCKD and CEEMDAN-MED approaches, it exhibits better feasibility and generality.
Author Contributions
Data curation, X.C., P.L. and J.D.; Writing—original draft, L.Z. and X.C.; Writing—review & editing, L.Z. All authors have read and agreed to the published version of the manuscript.
Funding
This research was funded by the National Natural Science Foundation of P.R. China under Grants (No. 62073051), the Science and Technology Research Project of the Chongqing Municipal Education Commission of P.R. China under Grants (No. KJZD-K 201900704).
Institutional Review Board Statement
Not applicable.
Informed Consent Statement
Not applicable.
Data Availability Statement
Not applicable.
Acknowledgments
The authors would like to thank the Guangdong Provincial Key Laboratory of Petrochemical Equipment Fault Diagnosis of China and Xi’an Jiaotong University Key Laboratory of Education Ministry for Modern Design and Rotor-Bearing System for providing the dataset of the rolling bearings.
Conflicts of Interest
The authors declare no conflict of interest.
References
- Zhang, X.H.; Kang, J.S.; Kang, J.S.; Hao, L.S.; Cai, L.Y.; Zhao, J.M. Bearing fault diagnosis and degradation analysis based on improved empirical mode decomposition and maximum correlated kurtosis deconvolution. J. Vibroeng. 2015, 171, 243–260. [Google Scholar]
- Lv, Z.L.; Tang, B.P.; Zhou, Y.; Meng, J. Early fault diagnosis method for rolling bearings based on grid search method with optimized maximum correlation kurtosis cliff deconvolution. Vib. Shock. 2016, 35, 29–34. [Google Scholar]
- Qin, C.; Wang, D.; Xu, Z.; Tang, G. Improved Empirical Wavelet Transform for Compound Weak Bearing Fault Diagnosis with Acoustic Signals. Appl. Sci. 2020, 10, 682. [Google Scholar] [CrossRef]
- Yuan, J.; Xu, C.; Zhao, Q.; Jiang, H.M.; Weng, Y.H. High-fidelity noise-reconstructed empirical mode decomposition for mechanical multiple and weak fault extractions. ISA Trans. 2022, 129, 380–397. [Google Scholar] [CrossRef]
- Shen, K.; Zhao, D.B. An EMD-LSTM Deep Learning Method for Aircraft Hydraulic System Fault Diagnosis under Different Environmental Noises. Aerospace 2023, 10, 55. [Google Scholar] [CrossRef]
- Damine, Y.; Bessous, N.; Pusca, R.; Megherbi, A.C.; Romary, R.; Sbaa, S. A New Bearing Fault Detection Strategy Based on Combined Modes Ensemble Empirical Mode Decomposition, KMAD, and an Enhanced Deconvolution Process. Energies 2023, 16, 2604. [Google Scholar] [CrossRef]
- Zheng, K.; Luo, J.F.; Zhang, Y.; Li, T.L.; Wen, J.F.; Xiao, H. Incipient fault detection of rolling bearing using maximum autocorrelation impulse harmonic to noise deconvolution and parameter optimized fast EEMD. ISA Trans. 2019, 89, 256–271. [Google Scholar] [CrossRef] [PubMed]
- Lin, S.L. Application combining VMD and ResNet101 in intelligent diagnosis of motor faults. Sensors 2021, 21, 6065. [Google Scholar] [CrossRef] [PubMed]
- Torres, M.E.; Colominas, M.A.; Schlotthauer, G.; Flandrin, P. A complete ensemble empirical mode decomposition with adaptive noise. In Proceedings of the 2011 IEEE International Conference on Acoustics, Speech and Signal Processing (ICASSP), Prague, Czech Republic, 22–27 May 2011. [Google Scholar]
- Bie, F.F.; Miao, Y.; Lyu, F.; Peng, J.; Guo, Y. An improved CEEMDAN time-domain energy entropy method for the failure mode identification of the rolling bearing. Shock. Vib. 2021, 2021, 7461402. [Google Scholar] [CrossRef]
- Liu, L.P.; Wei, Y.; Song, X.Y.; Zhang, L. Fault Diagnosis of Wind Turbine Bearings Based on CEEMDAN-GWO-KELM. Energies 2023, 16, 48. [Google Scholar] [CrossRef]
- Zhang, H.; Chen, X.; Du, Z.H.; Yan, R.Q. Kurtosis based weighted sparse model with convex optimization technique for bearing fault diagnosis. Mech. Syst. Signal Process. 2016, 80, 349–376. [Google Scholar] [CrossRef]
- Wiggins, R.A. Minimum entropy deconvolution. Geoexploration 1978, 16, 21–35. [Google Scholar] [CrossRef]
- Li, H.K.; Zhao, C.S.; Zhou, S.; Guo, Y.J. Fault feature enhancement method of rolling bearing based on wavelet packet—Coordinate transformation. J. Mech. Eng. 2011, 47, 74–80. [Google Scholar] [CrossRef]
- Qiao, Z.C.; Liu, Y.Q.; Liao, Y.Y. Application of improved empirical wavelet transform with minimum entropy deconvolution in railroad bearing fault diagnosis. Vib. Shock. 2021, 40, 81–90. [Google Scholar]
- Ha, J.M.; Youn, B.D. Fault diagnosis of a planetary gearbox by D norm-based time synchronous averaging (DTSA) with roughly estimated phase information under an encoder-less operating condition. J. Sound Vib. 2022, 520, 116546. [Google Scholar] [CrossRef]
- Endo, H.; Randall, R.B. Enhancement of autoregressive model based gear tooth fault detection technique by the use of minimum entropy deconvolution filter. Mech. Syst. Signal Process. 2007, 21, 906–919. [Google Scholar] [CrossRef]
- Ou, L.; Yu, D.; Yang, H. A new rolling bearing fault diagnosis method based on GFT impulse component extraction. Mech. Syst. Signal Process. 2016, 81, 162–182. [Google Scholar] [CrossRef]
- Mcdonald, G.L.; Zhao, Q. Maximum correlated kurtosis deconvolution and application on gear tooth chip fault detection. Mech. Syst. Signal Process. 2012, 33, 237–255. [Google Scholar] [CrossRef]
- Cui, H.; Guan, Y.; Chen, H. Rolling element fault diagnosis based on VMD and sensitivity MCKD. IEEE Access 2021, 9, 120297–120308. [Google Scholar] [CrossRef]
- Zhang, J.; Zhang, J.Q.; Zhong, M.; Zheng, J.D.; Li, X.K. Faint fault diagnosis of wind turbine bearings based on PSO-VMD-MCKD method. Vib. Test Diagn. 2020, 40, 287–296. [Google Scholar]
- Zhang, L.; Xiong, G.L.; Huang, W.Y. Complex wavelet resonance demodulation band optimization method and new metrics. J. Mech. Eng. 2015, 51, 129–138. [Google Scholar] [CrossRef]
- Xiao, J.Q.; Jin, J.T.; Li, C.; Xu, Z.F. Research on rolling bearing fault diagnosis based on IVMD-MCKD. Therm. Power Eng. 2022, 37, 165–173. [Google Scholar]
- Lei, Y.G.; Han, T.Y.; Wang, B.; Li, N.P.; Run, T.; Yang, J. Interpretation of XJTU-SY rolling bearing accelerated life test data set. J. Mech. Eng. 2019, 55, 1–6. [Google Scholar]
Figure 2.
Time domain diagram of the synthesized signal.
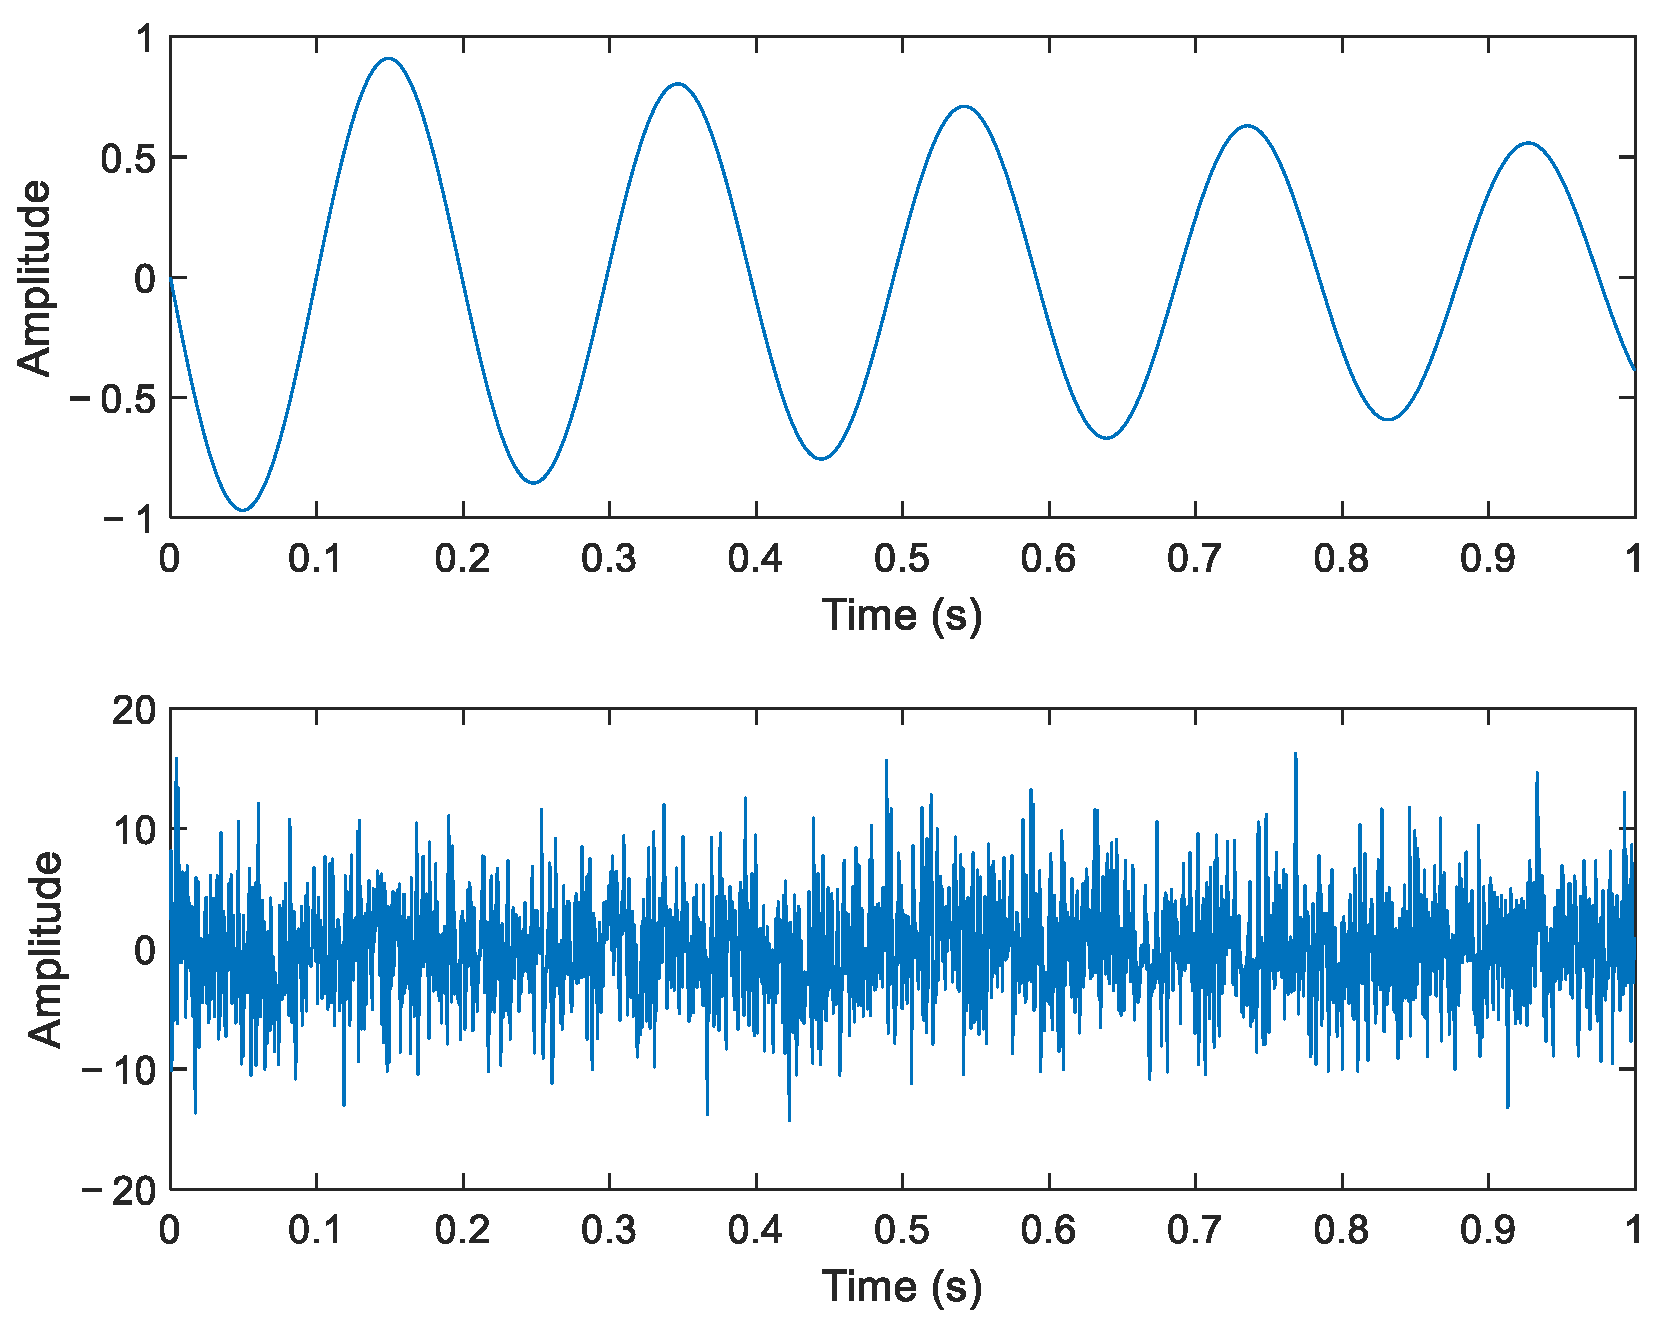
Figure 3.
Envelope spectrum of the noise added signal.

Figure 4.
Envelope spectrum of CEEMDAN-MCKD processed signals.

Figure 5.
Test equipment.
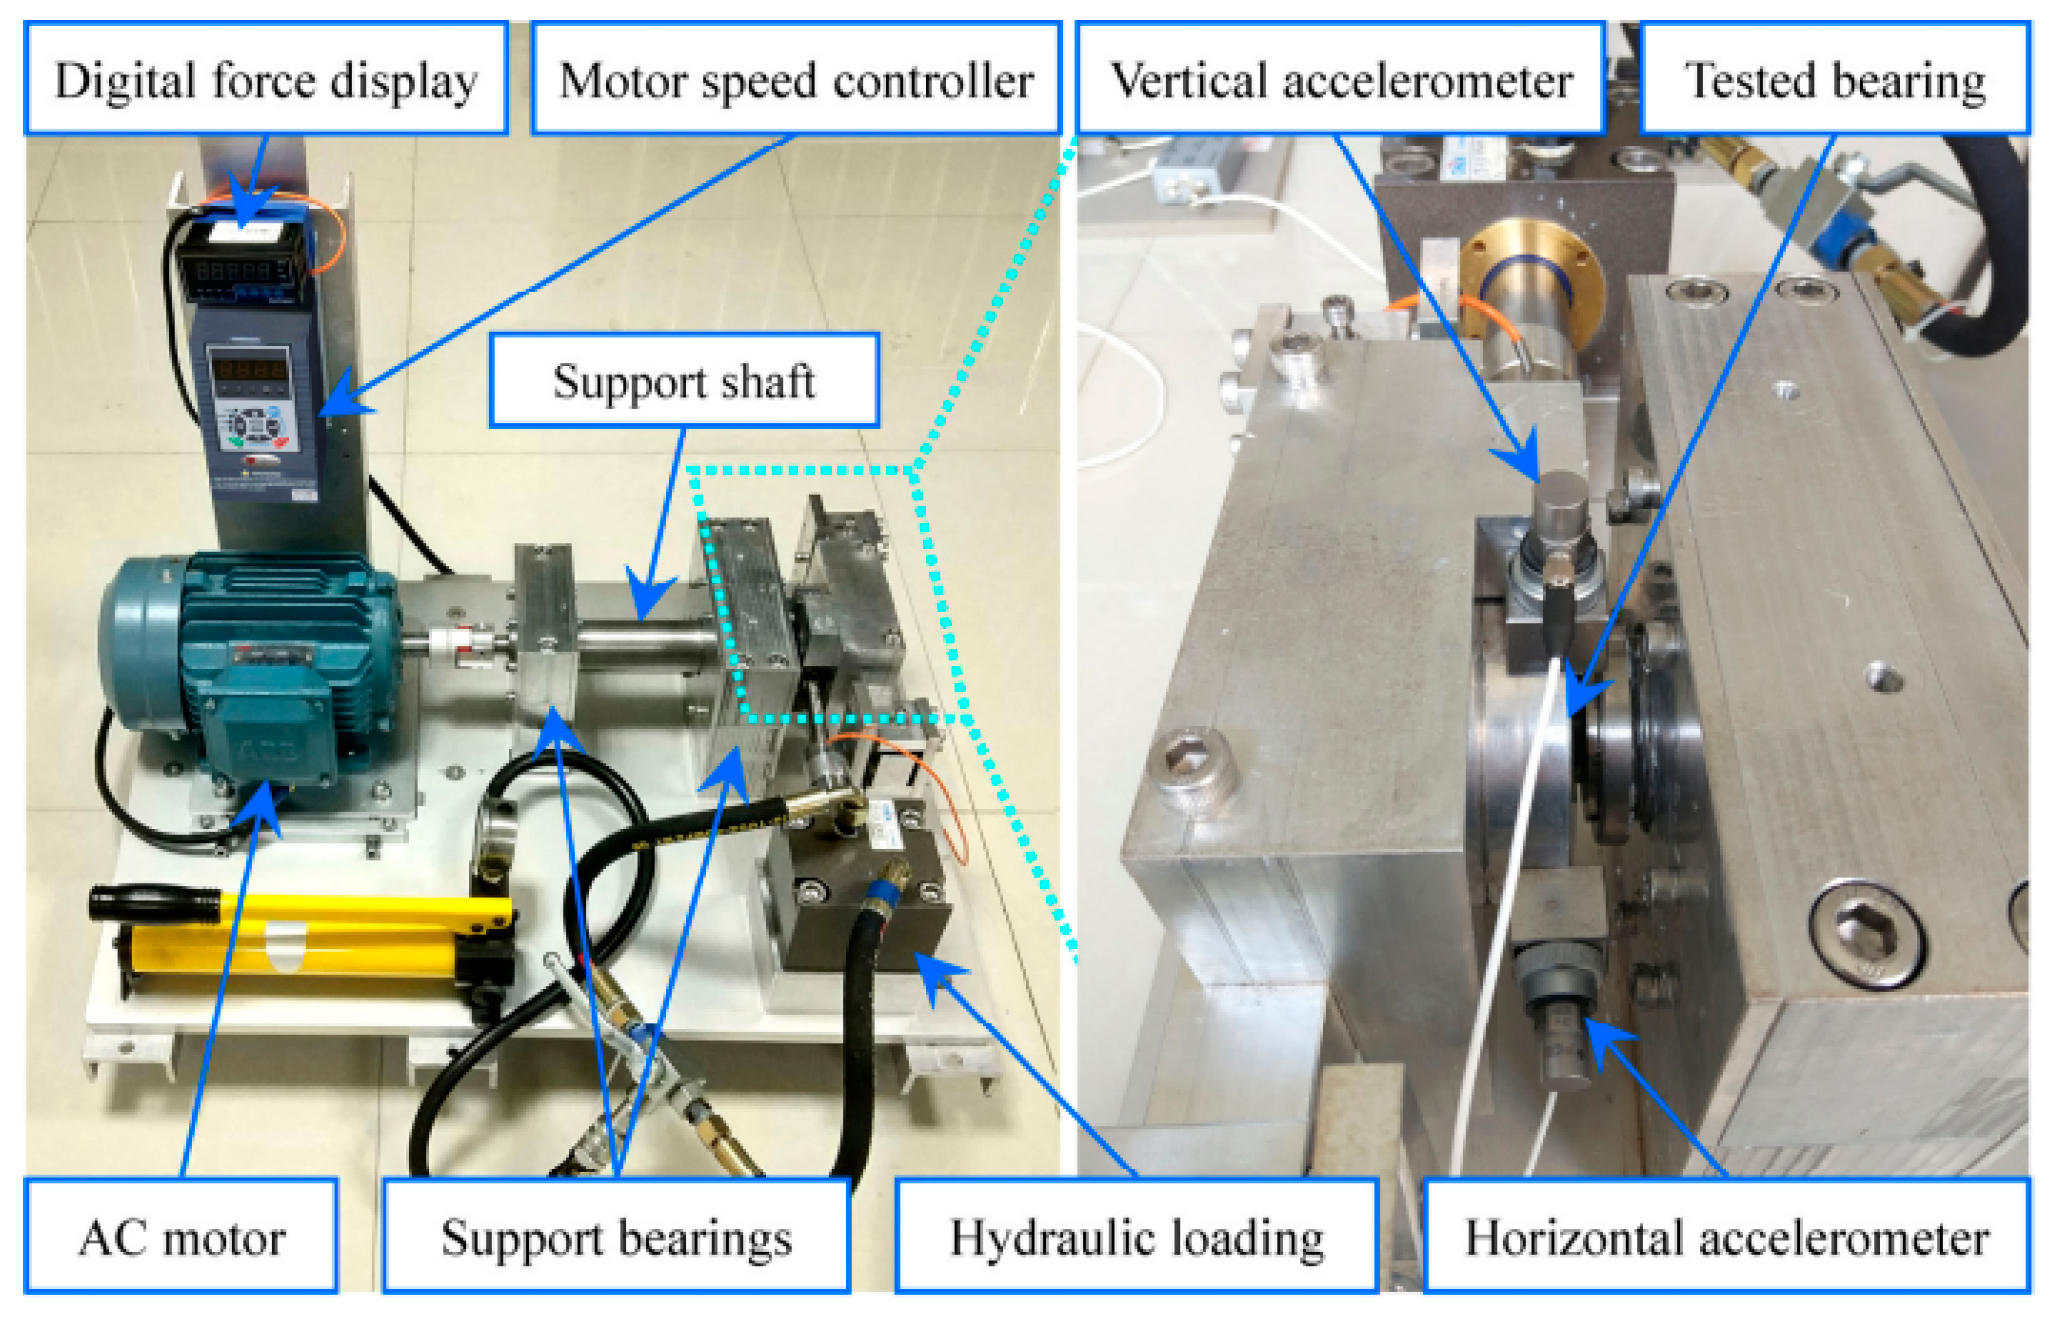
Figure 6.
(a) Wear of bearing inner ring; (b) wear of bearing outer ring.
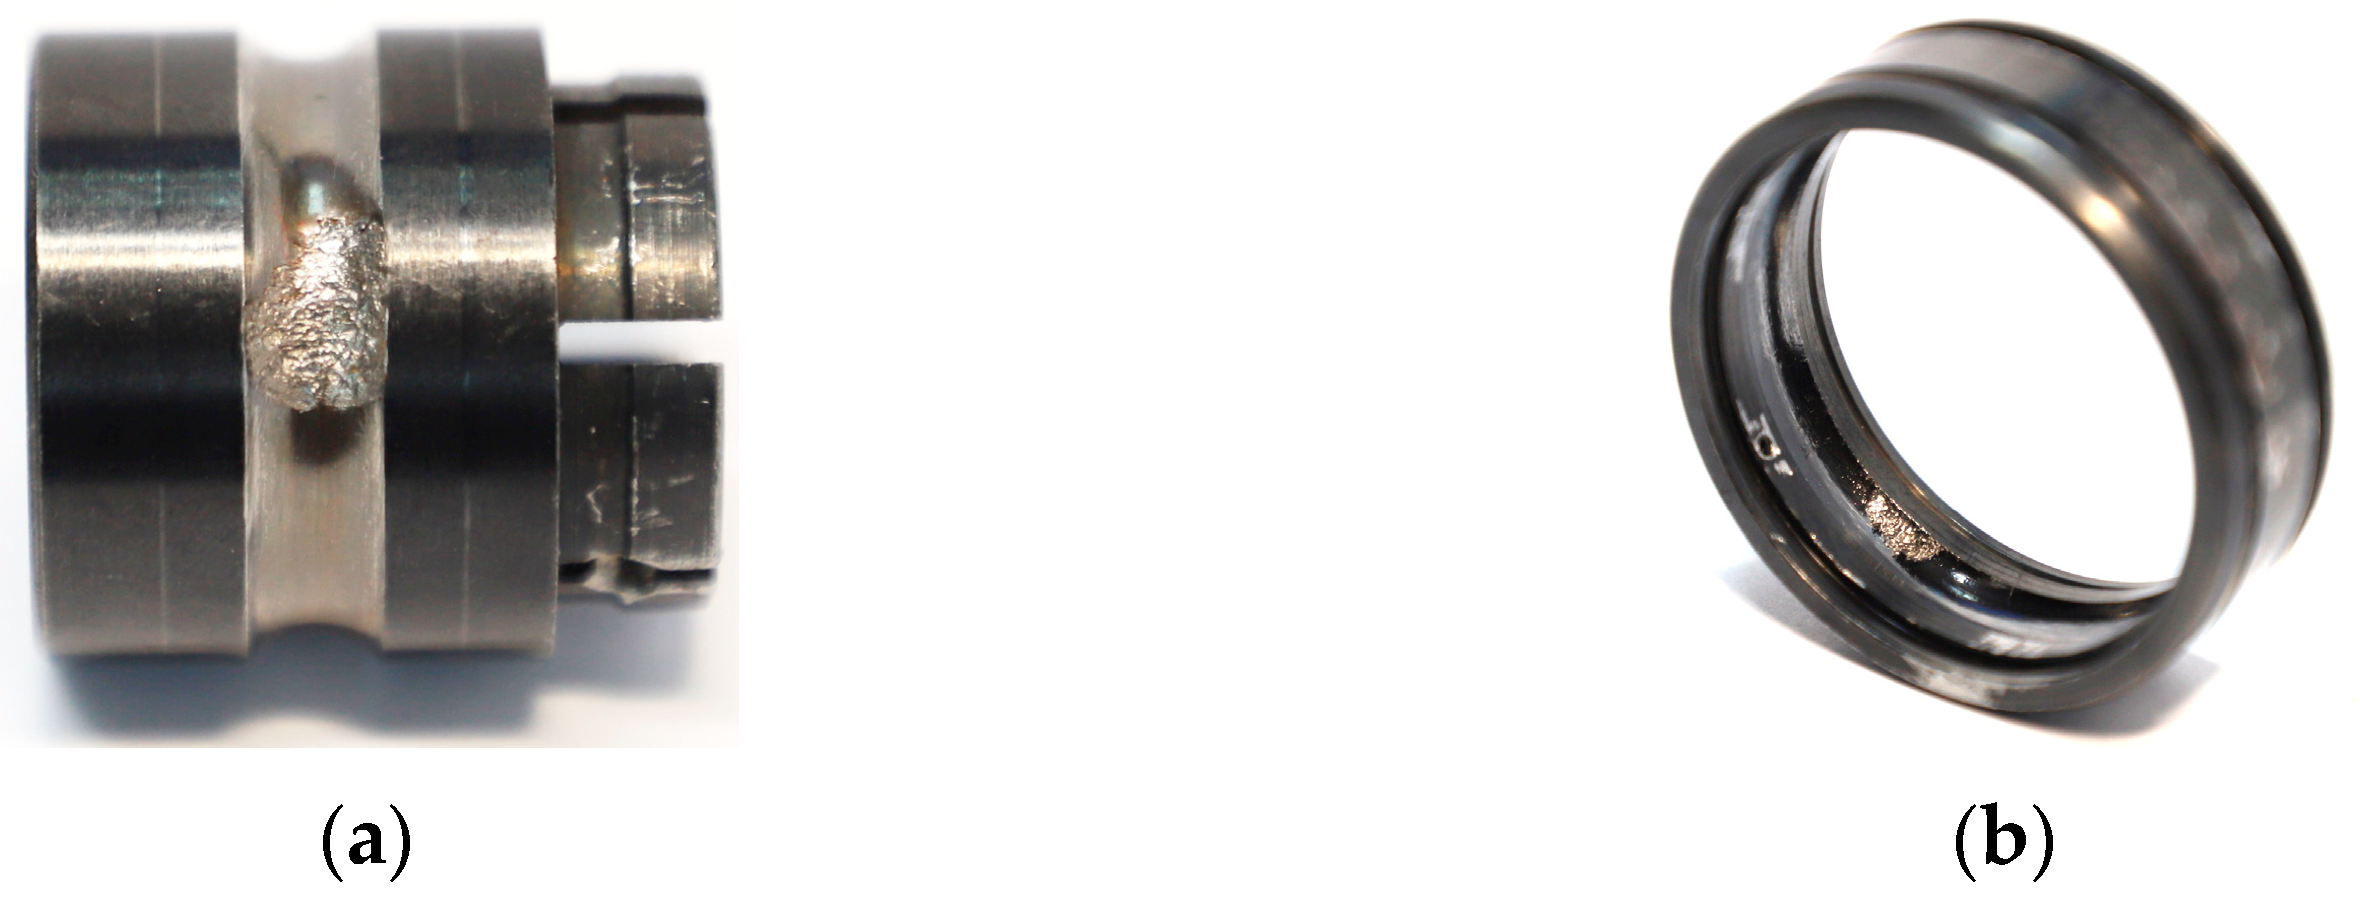
Figure 7.
Data acquisition device.

Figure 8.
Time domain diagram of the inner circle: (a) time domain diagram before adding noise; (b) time domain diagram with noise added.
Figure 8.
Time domain diagram of the inner circle: (a) time domain diagram before adding noise; (b) time domain diagram with noise added.
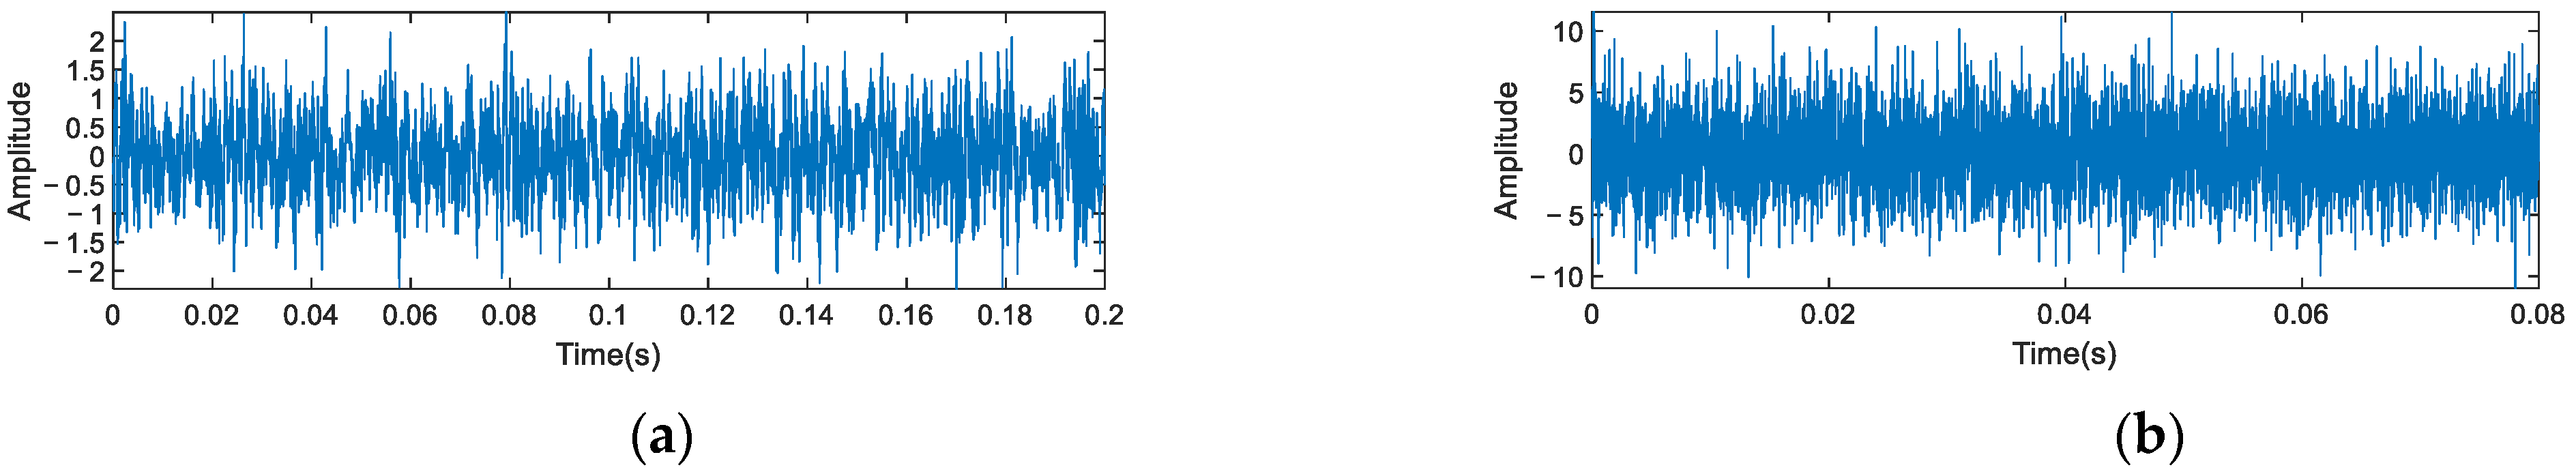
Figure 9.
Inner ring fault signal spectrum before noise addition.

Figure 10.
Inner ring fault signal envelope.

Figure 11.
Time domain diagram of CEEMDAN signal decomposition components.
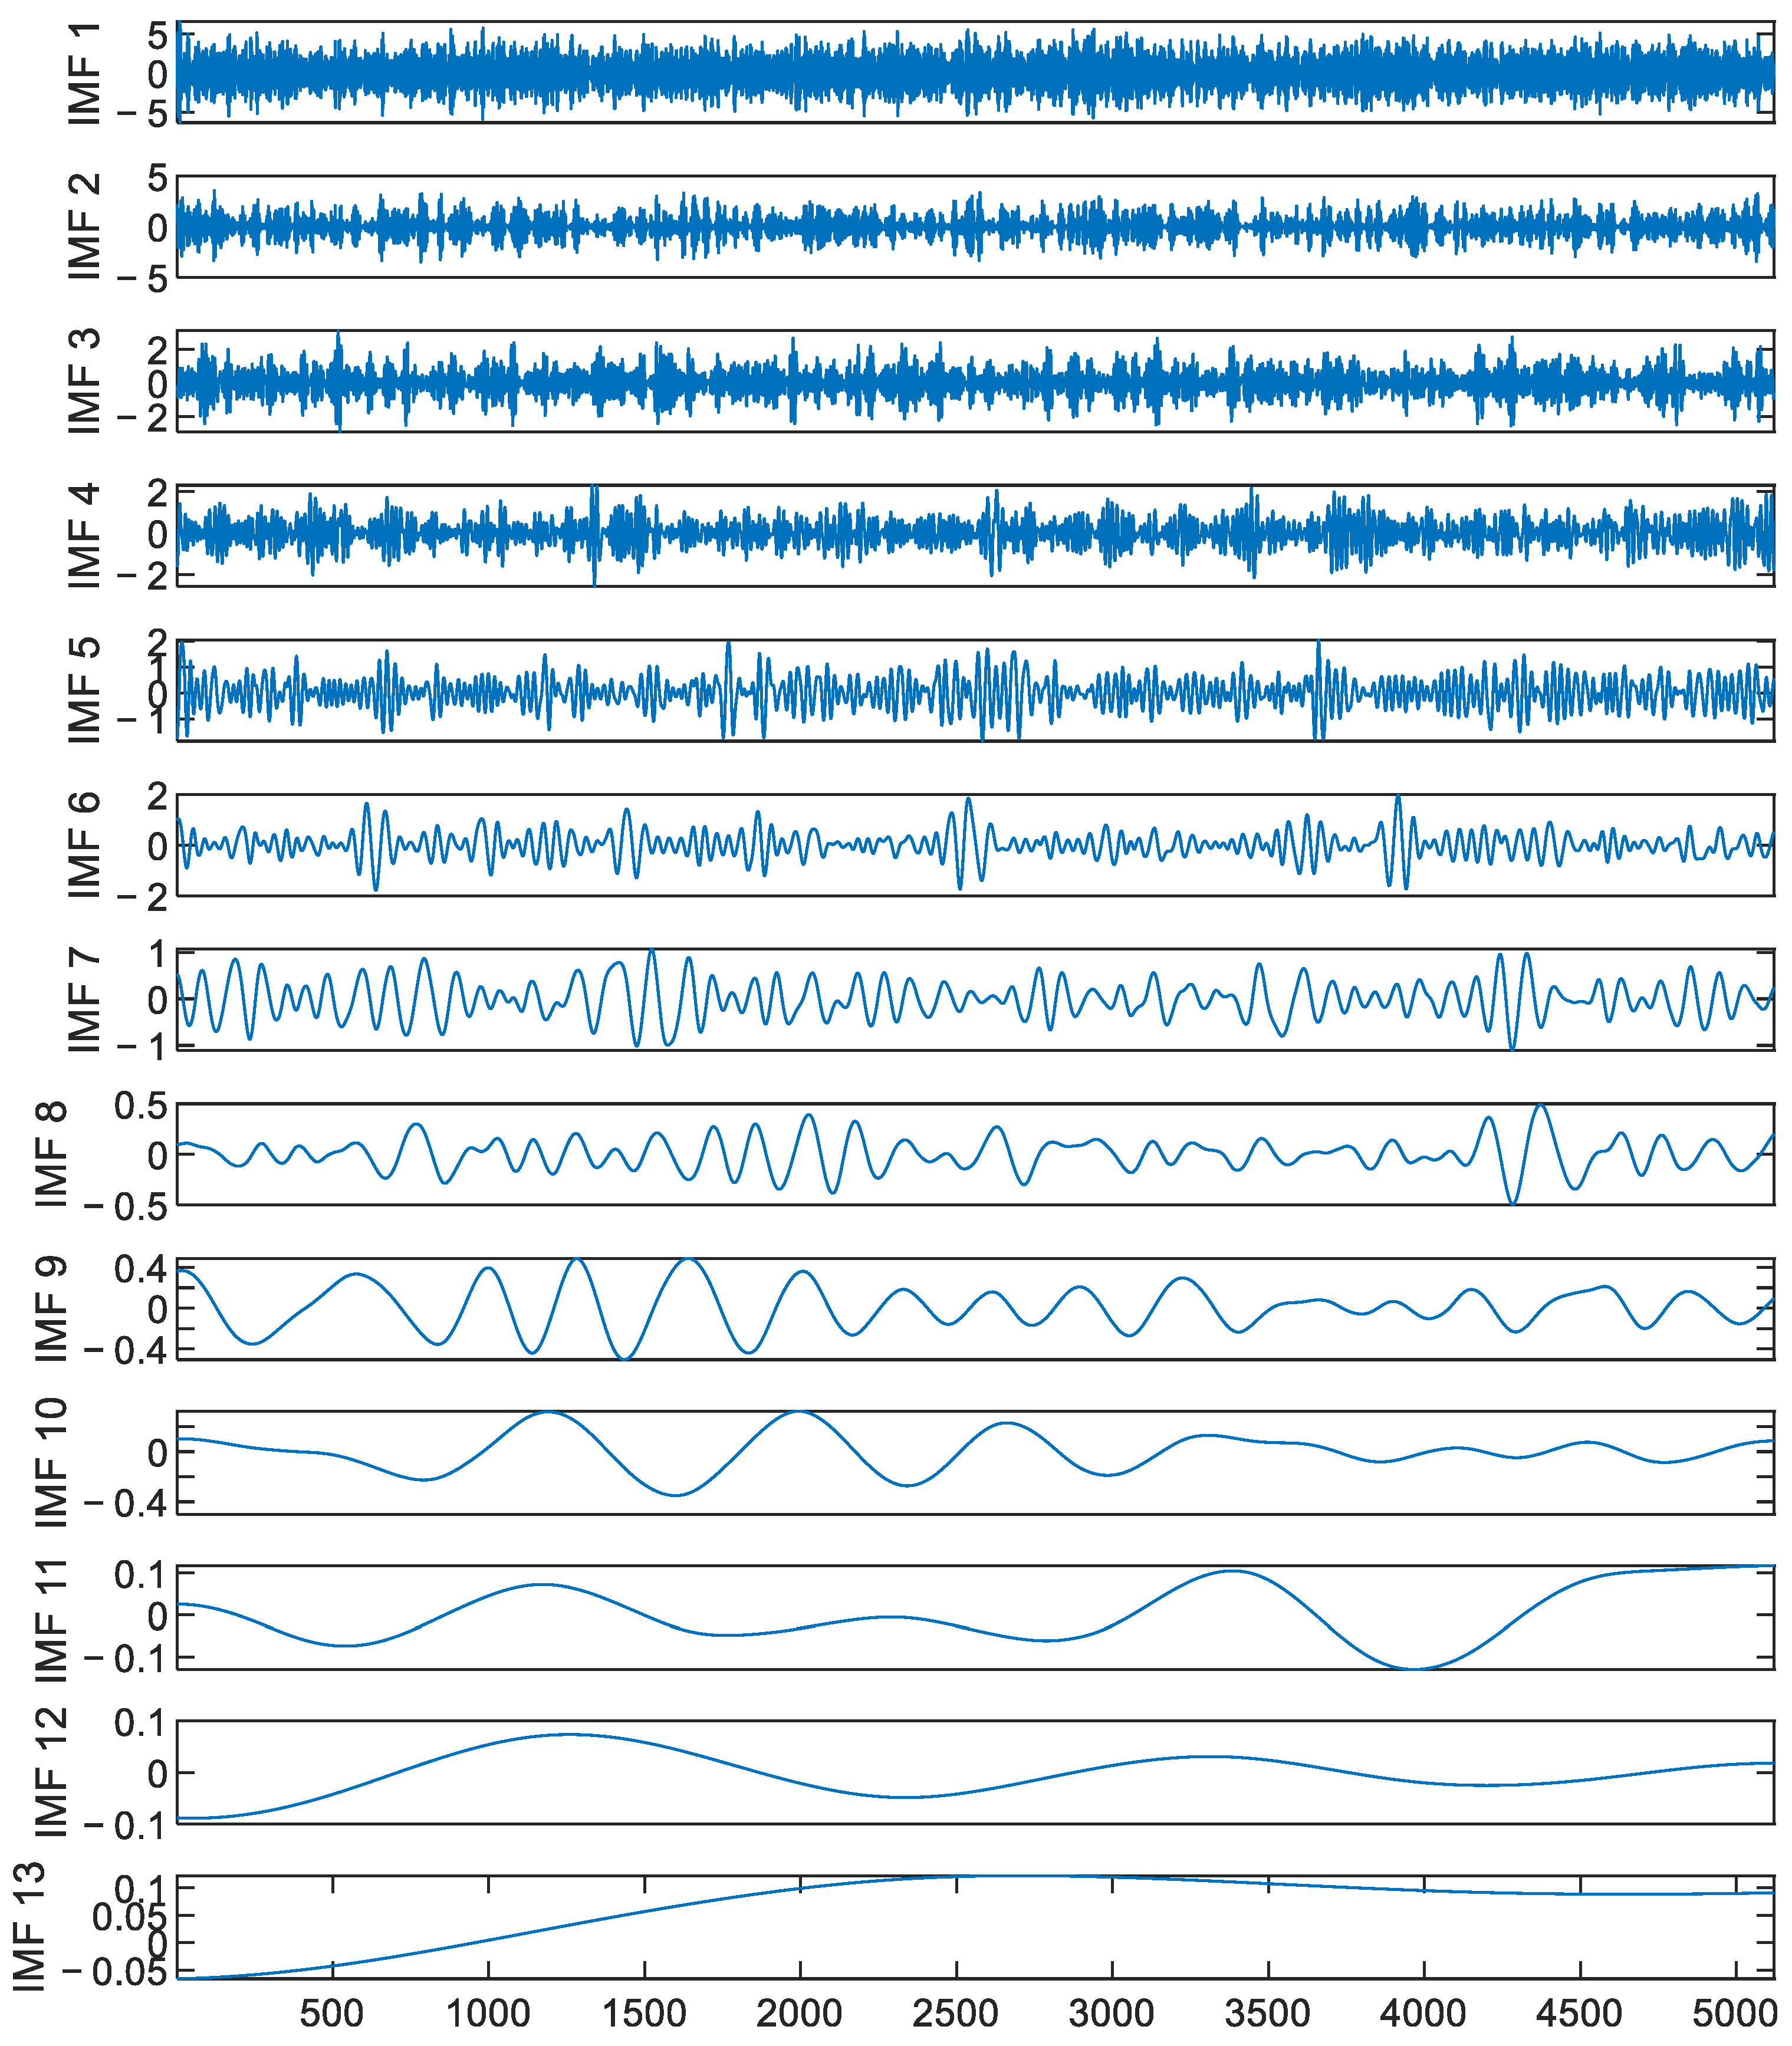
Figure 12.
Time domain diagram of the reconstructed signal.

Figure 13.
Reconstructing the envelope of the signal.
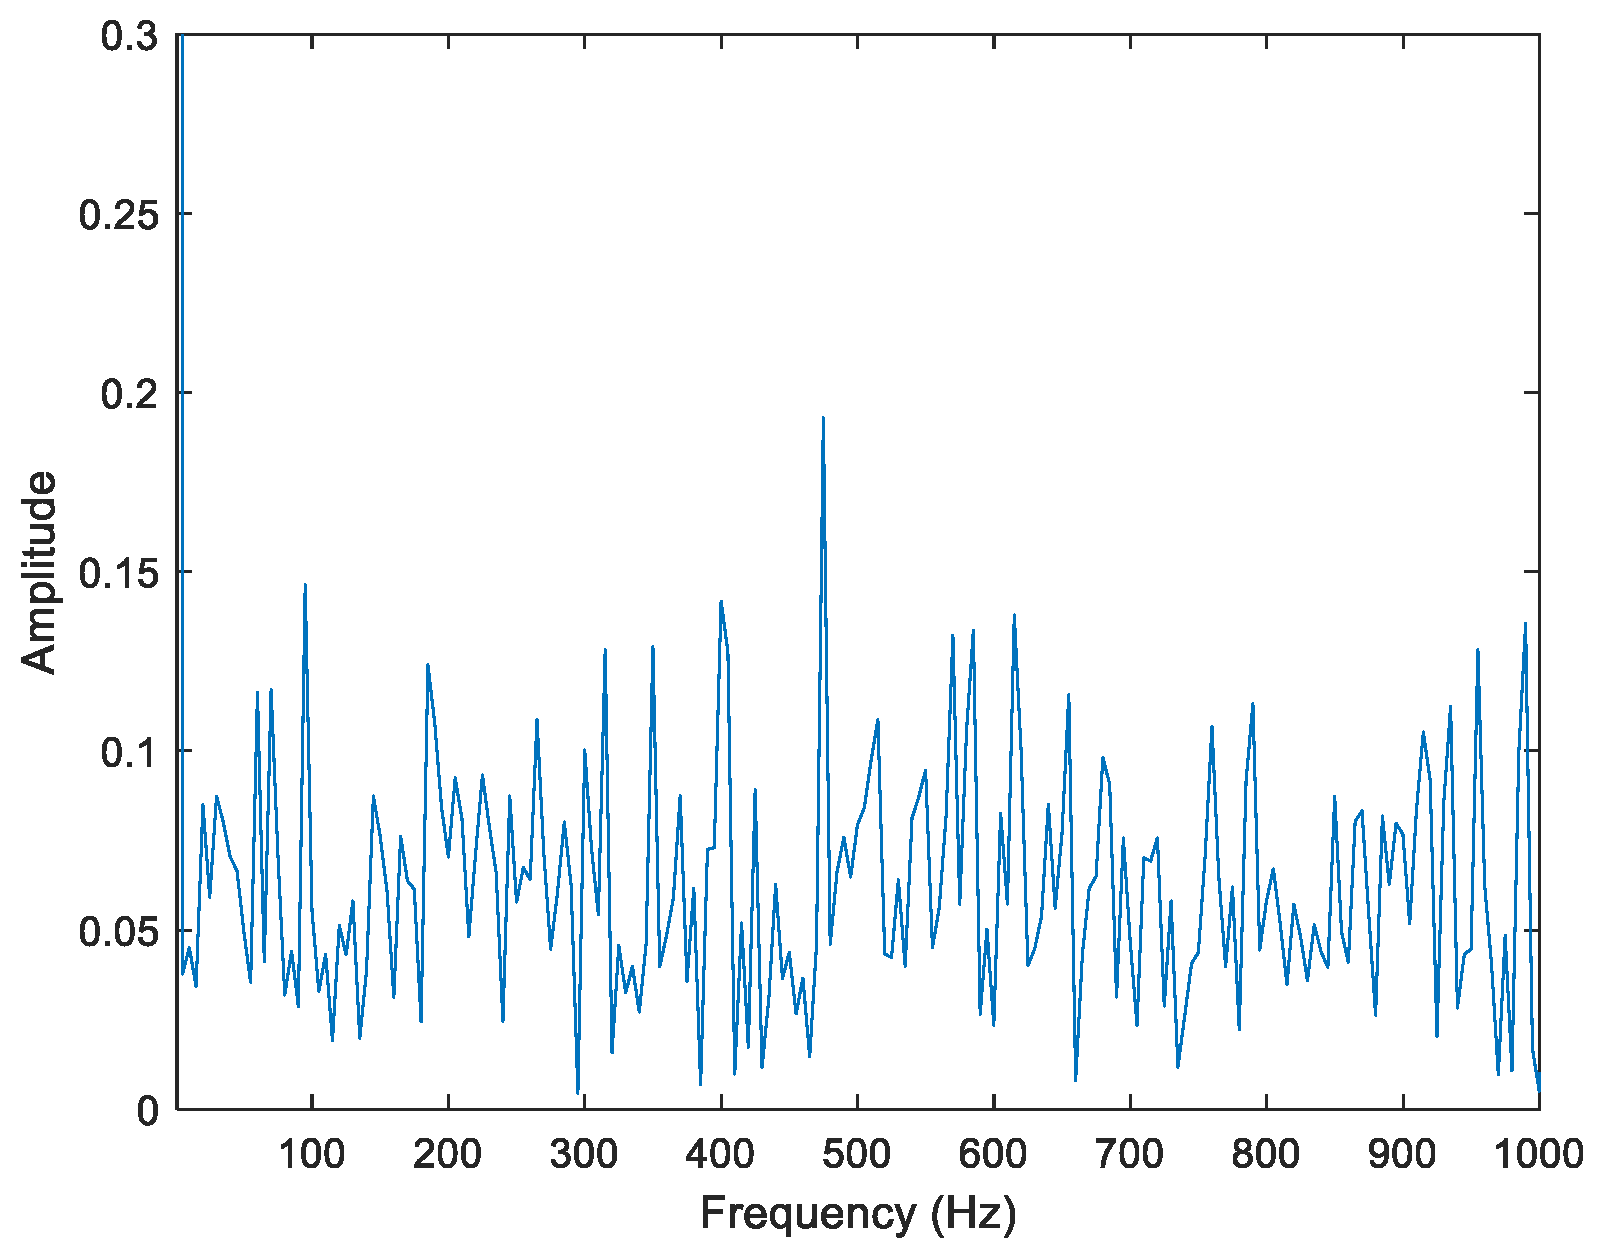
Figure 14.
The signal after MCKD enhancement.

Figure 15.
Envelope spectrum of CEEMDAN-MCKD processed signal.
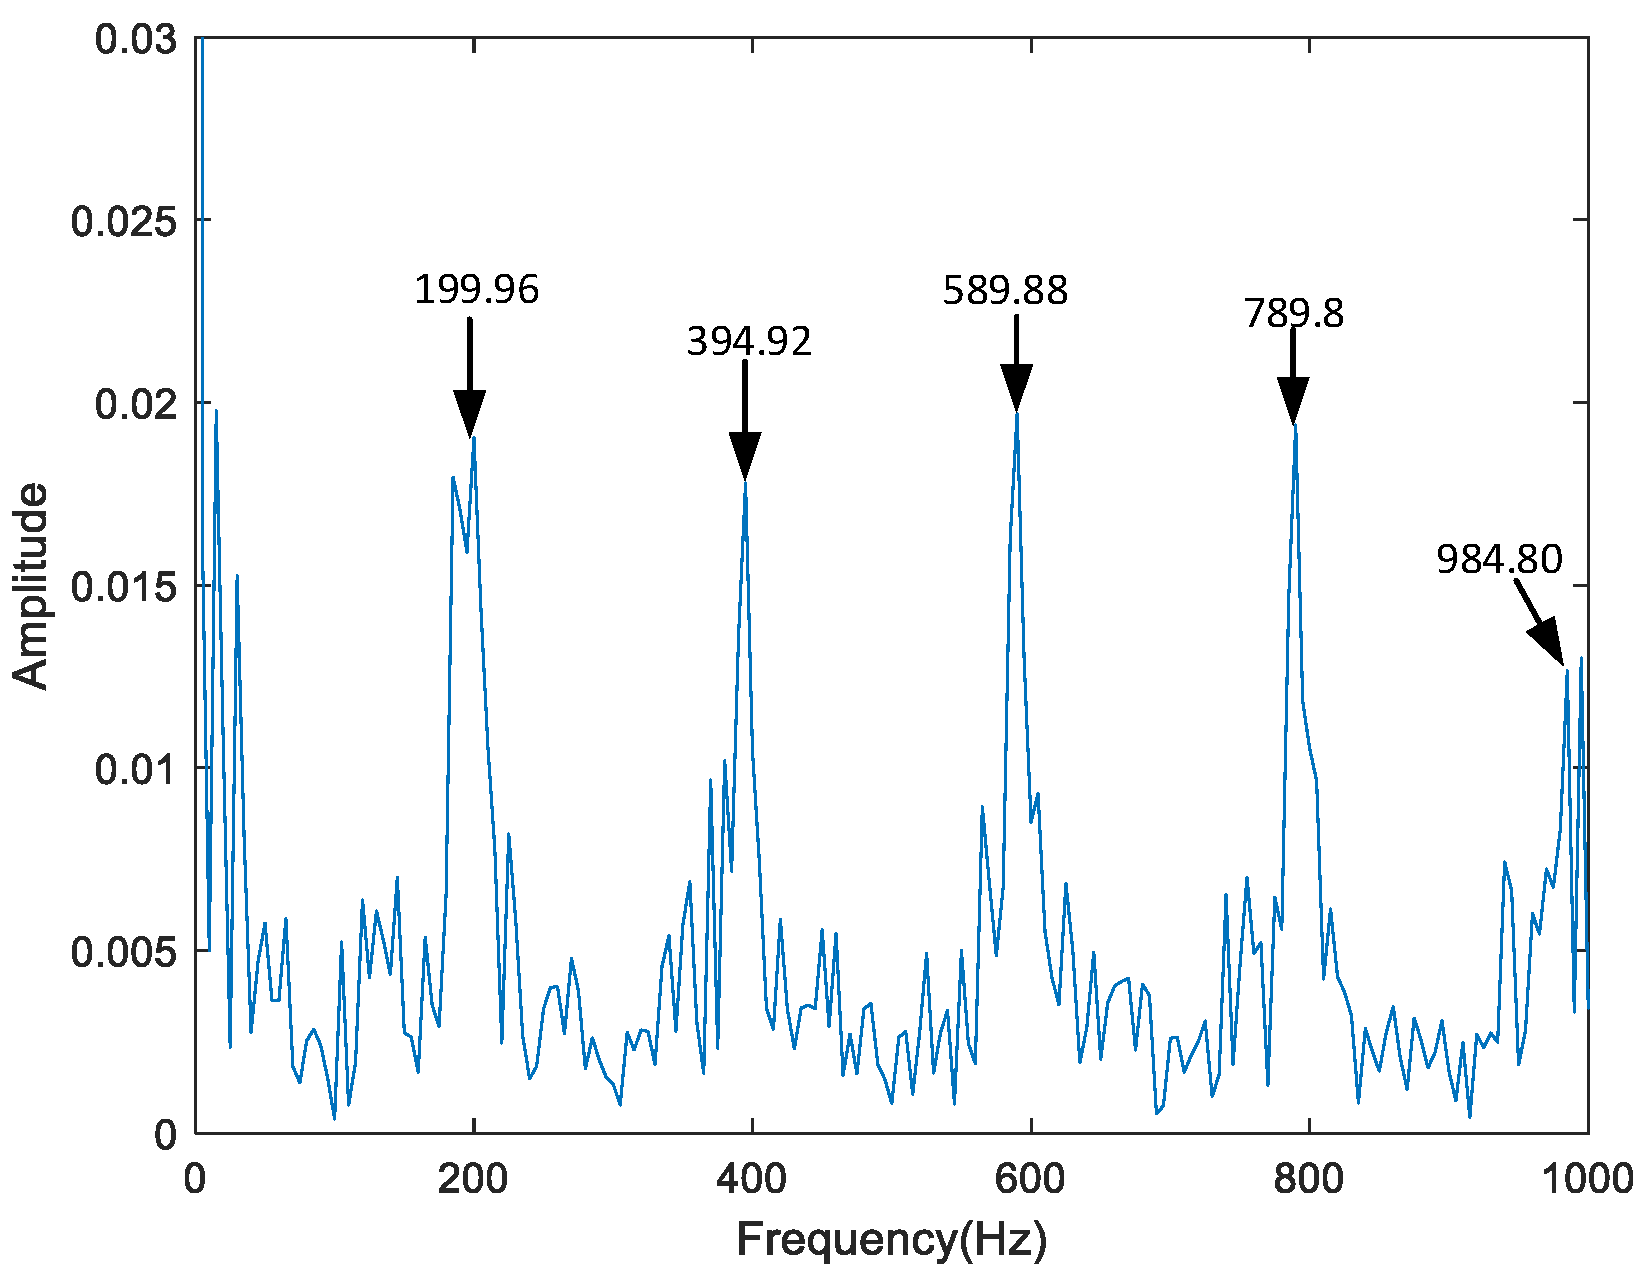
Figure 16.
Envelope spectrum of direct PSO-MCKD processing.
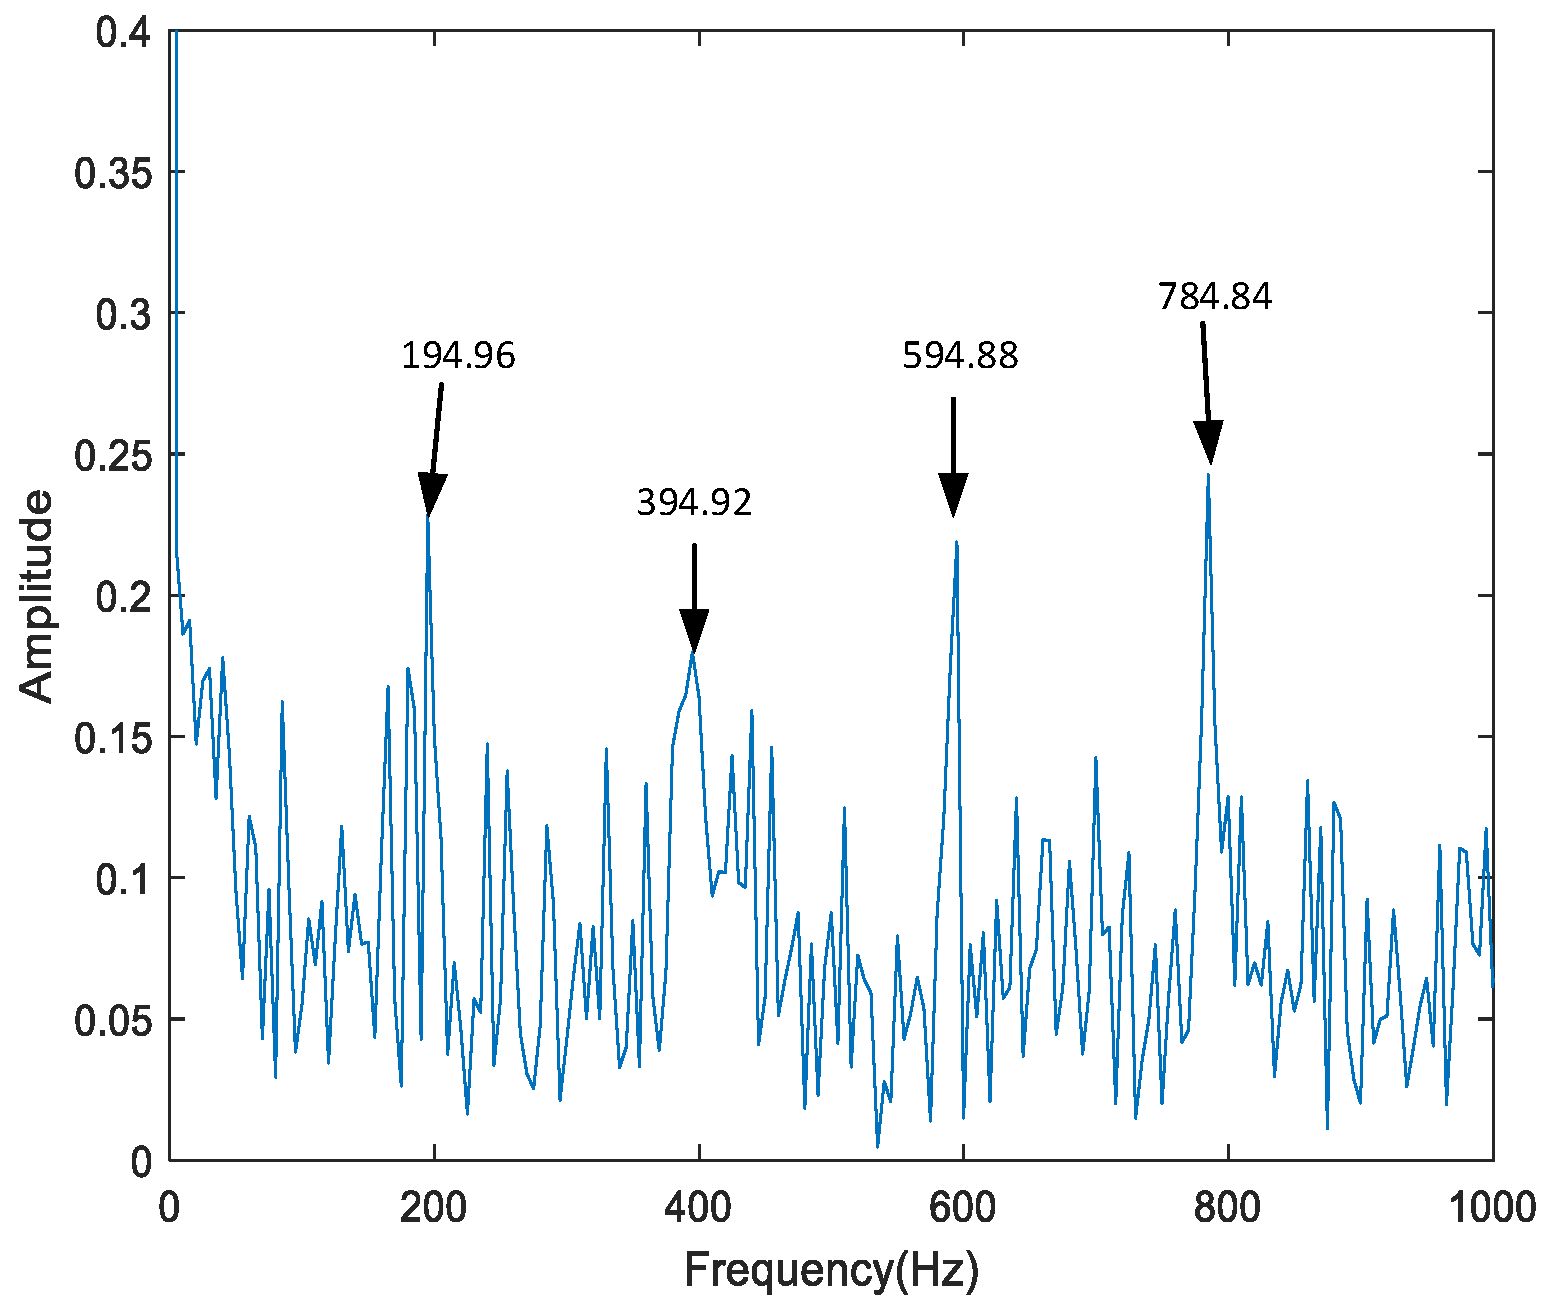
Figure 17.
CEEMDAN-MED processed signal envelope.
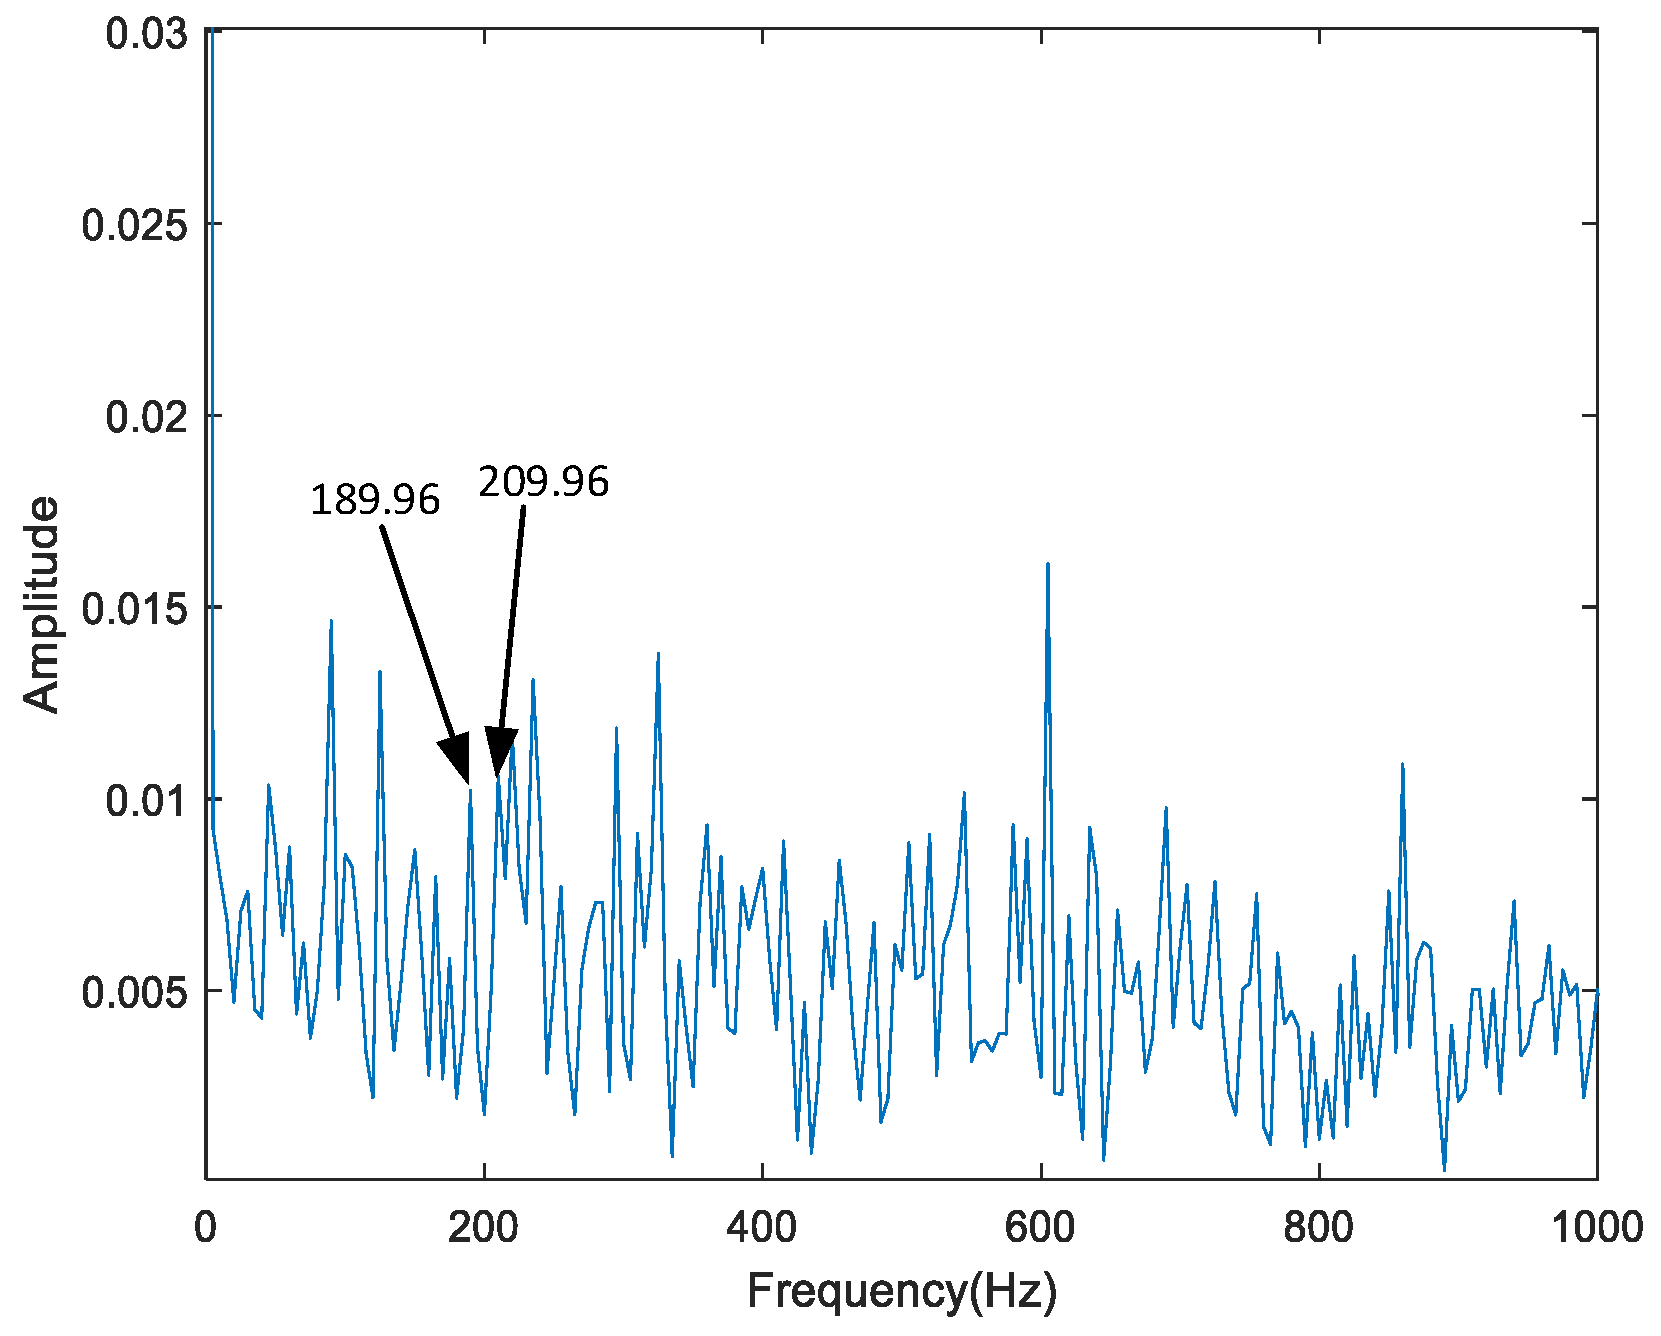
Figure 18.
Rolling bearing inner ring failure signal and enhancement results of this study method. (a) Original signal. (b) Adding noise signal. (c) Signal after enhancement.
Figure 18.
Rolling bearing inner ring failure signal and enhancement results of this study method. (a) Original signal. (b) Adding noise signal. (c) Signal after enhancement.
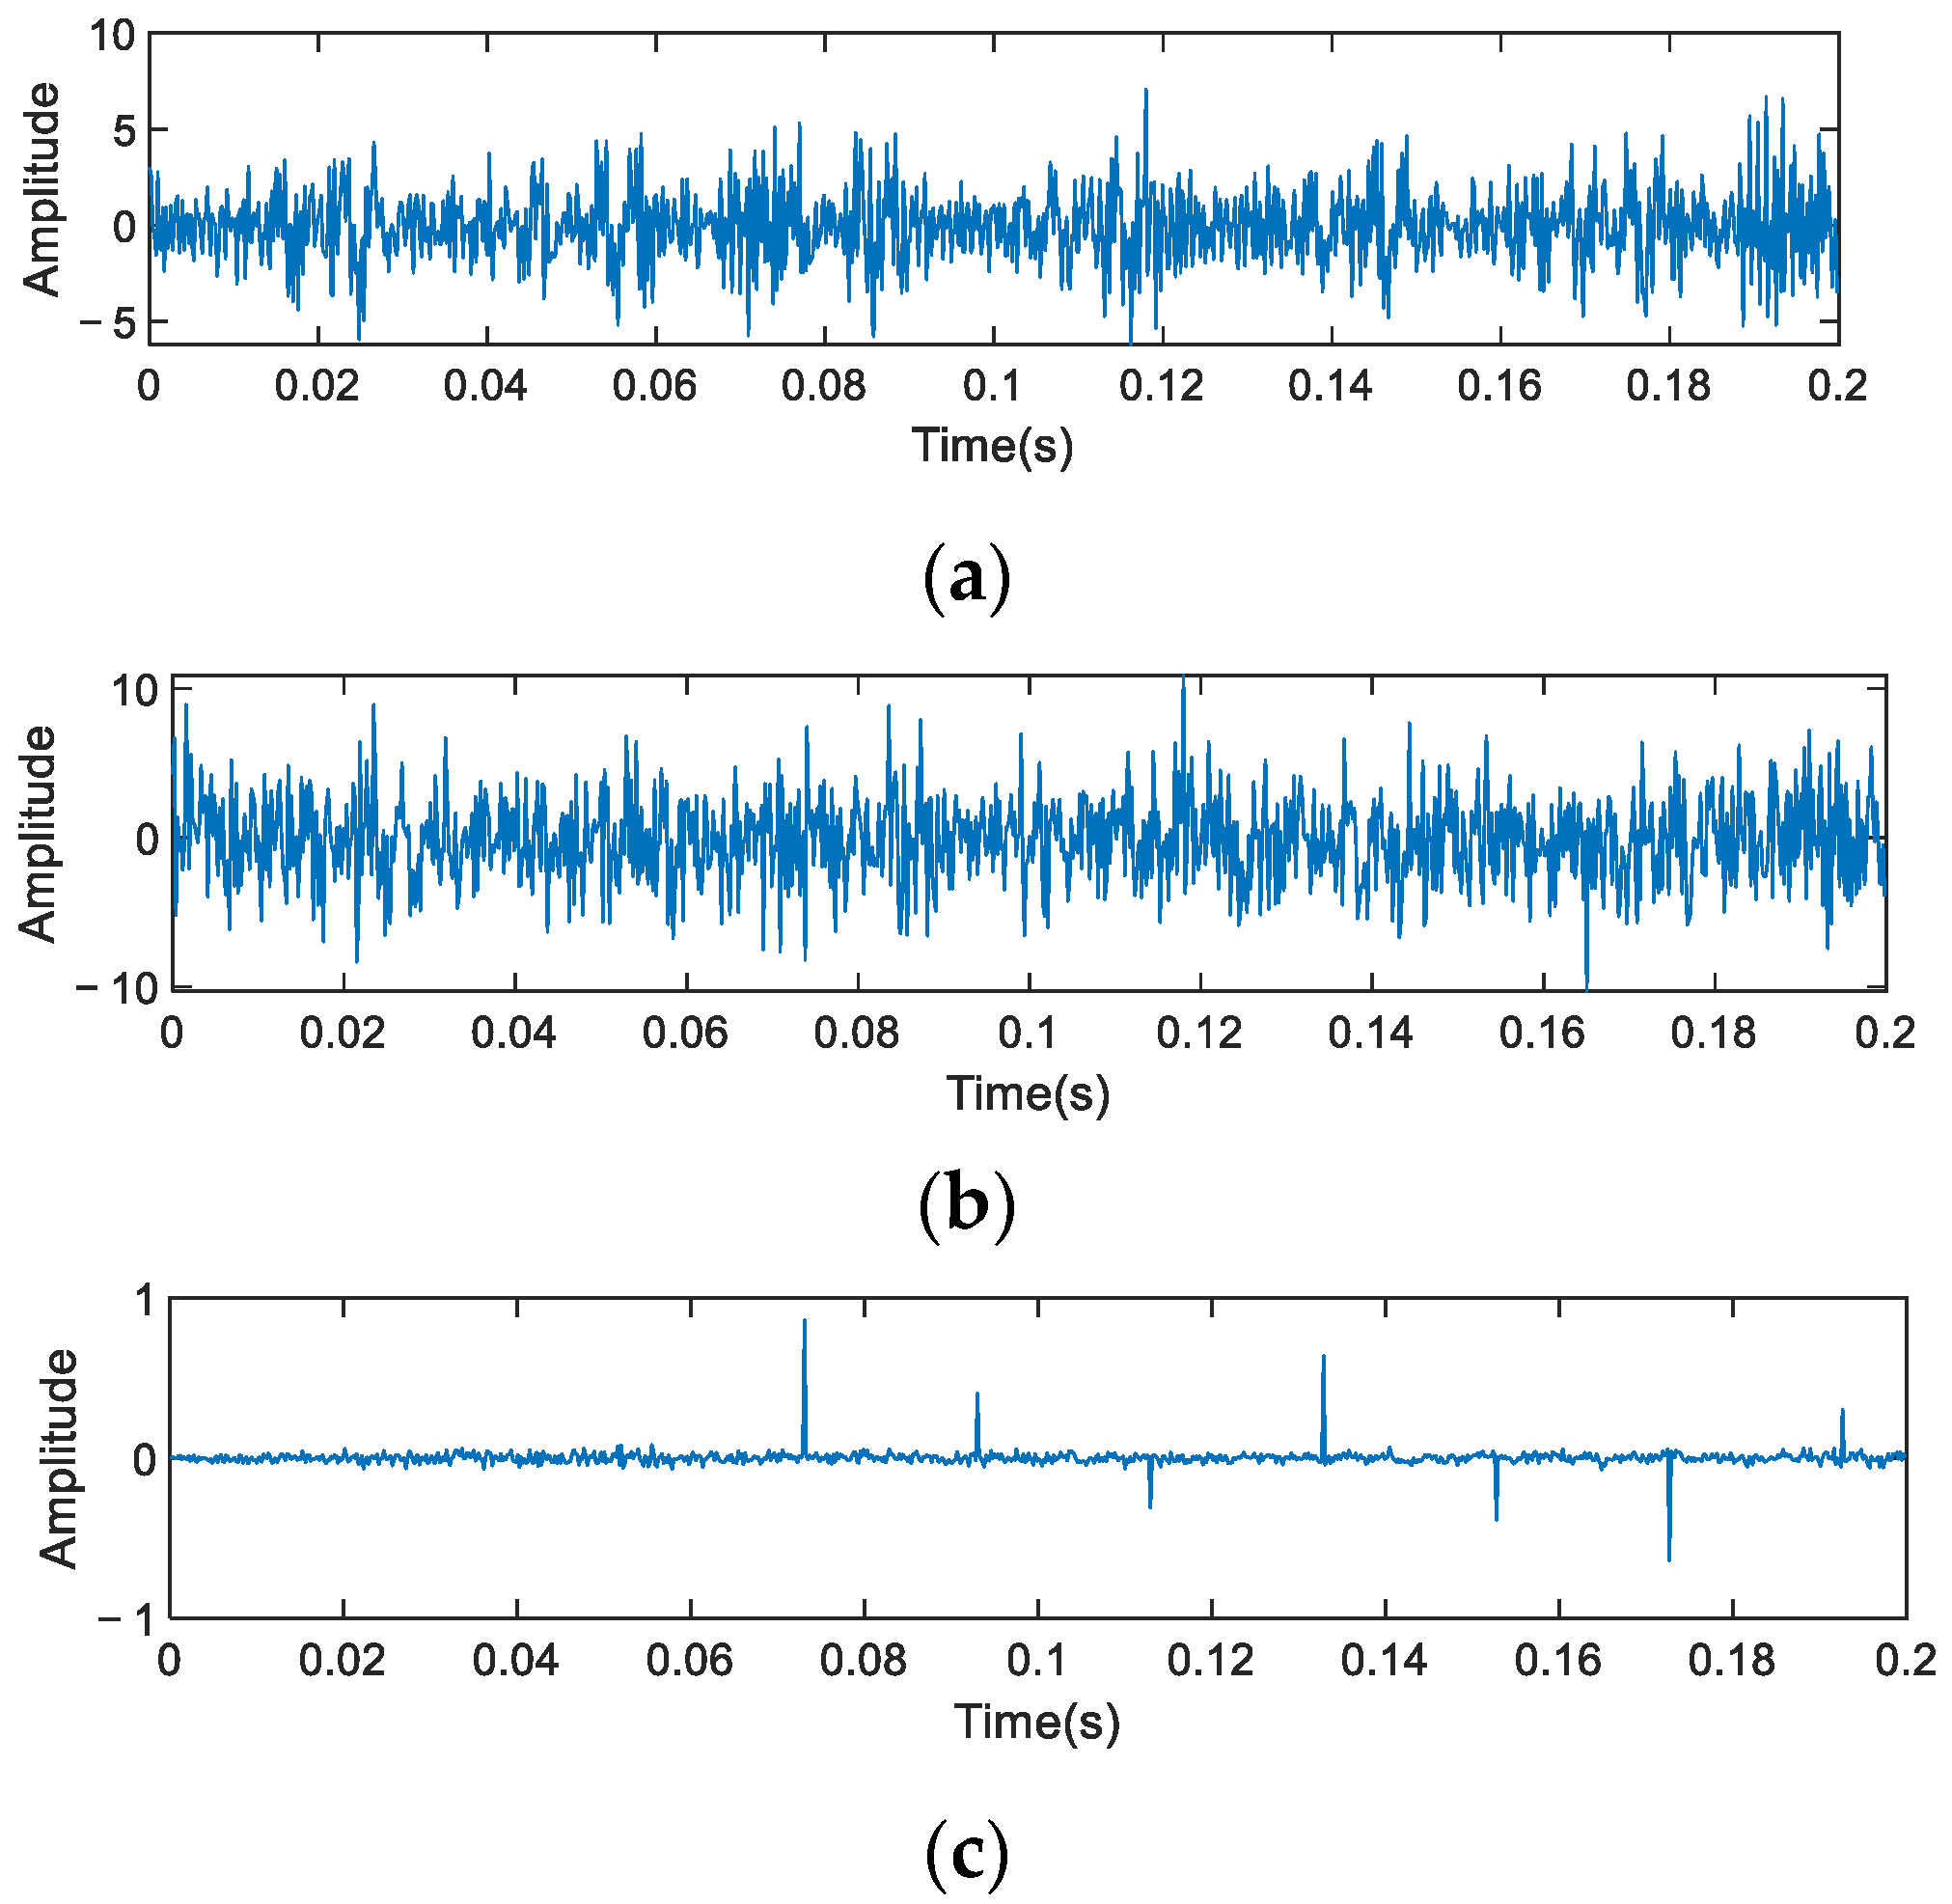
Figure 19.
Rolling bearing inner ring fault signal enhancement before and after envelope: (a) original signal envelope; (b) the enhanced envelope.
Figure 19.
Rolling bearing inner ring fault signal enhancement before and after envelope: (a) original signal envelope; (b) the enhanced envelope.
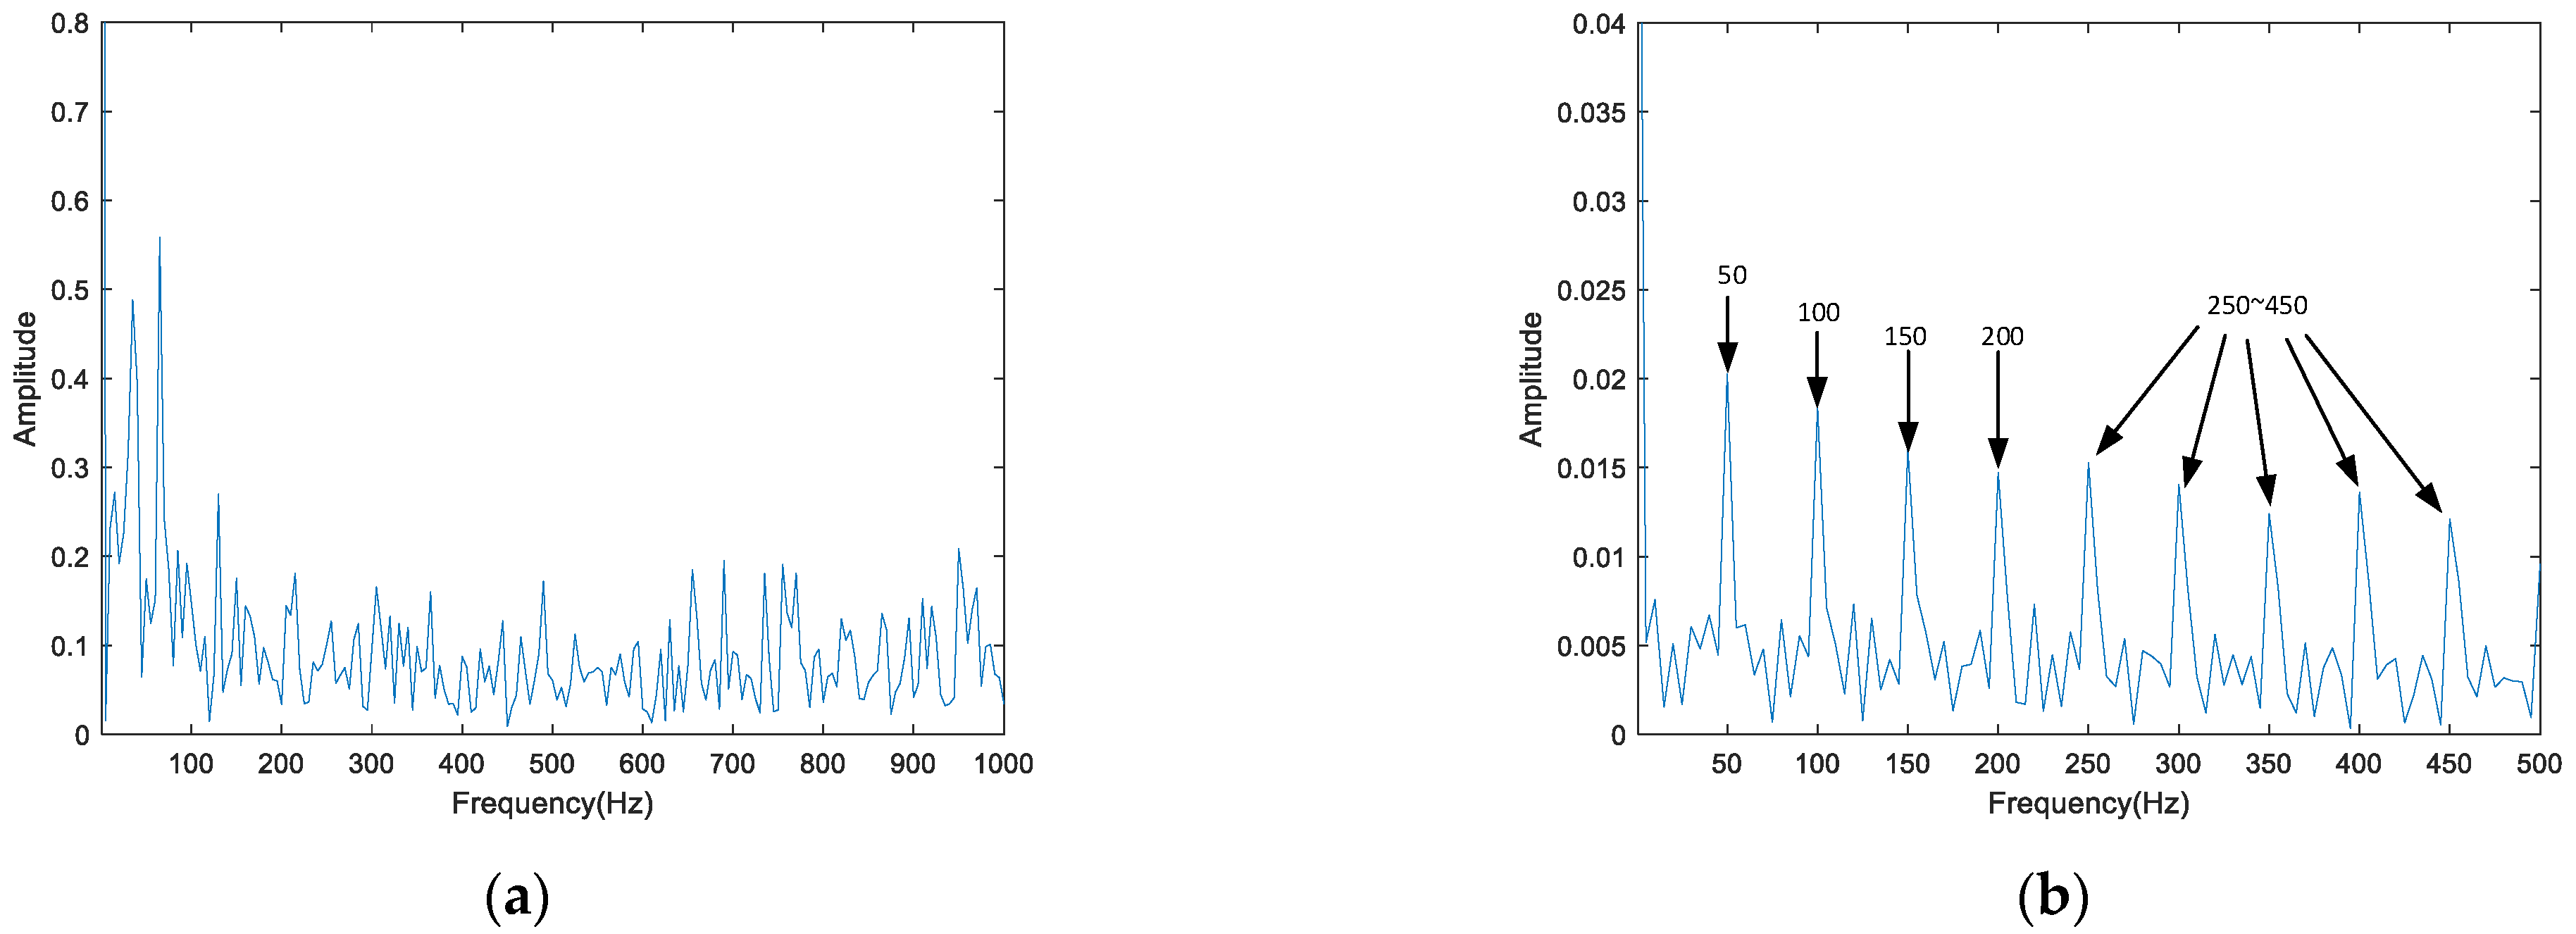
Figure 20.
Time domain waveform of outer ring failure under different working conditions: (a) time domain diagram of outer ring failure under working condition 1; (b) time domain diagram of outer ring failure under working condition 3.
Figure 20.
Time domain waveform of outer ring failure under different working conditions: (a) time domain diagram of outer ring failure under working condition 1; (b) time domain diagram of outer ring failure under working condition 3.

Figure 21.
Time domain waveform of outer ring failure under variable working conditions.
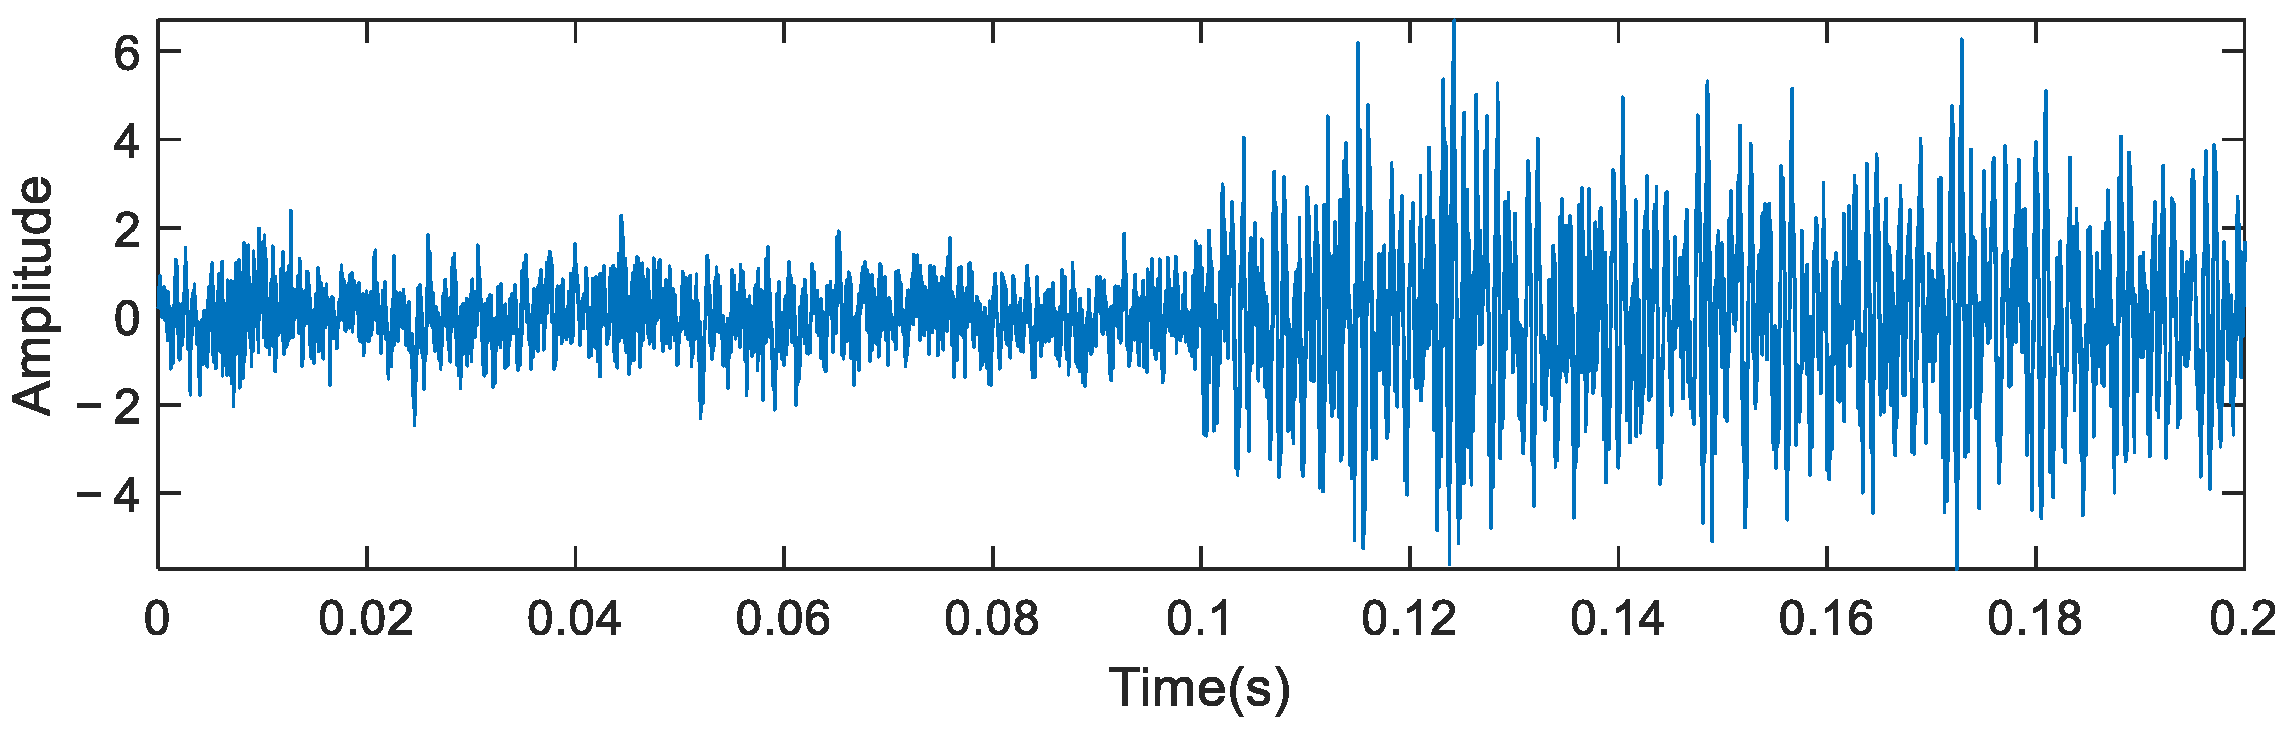
Figure 22.
Signal envelope after adding noise.
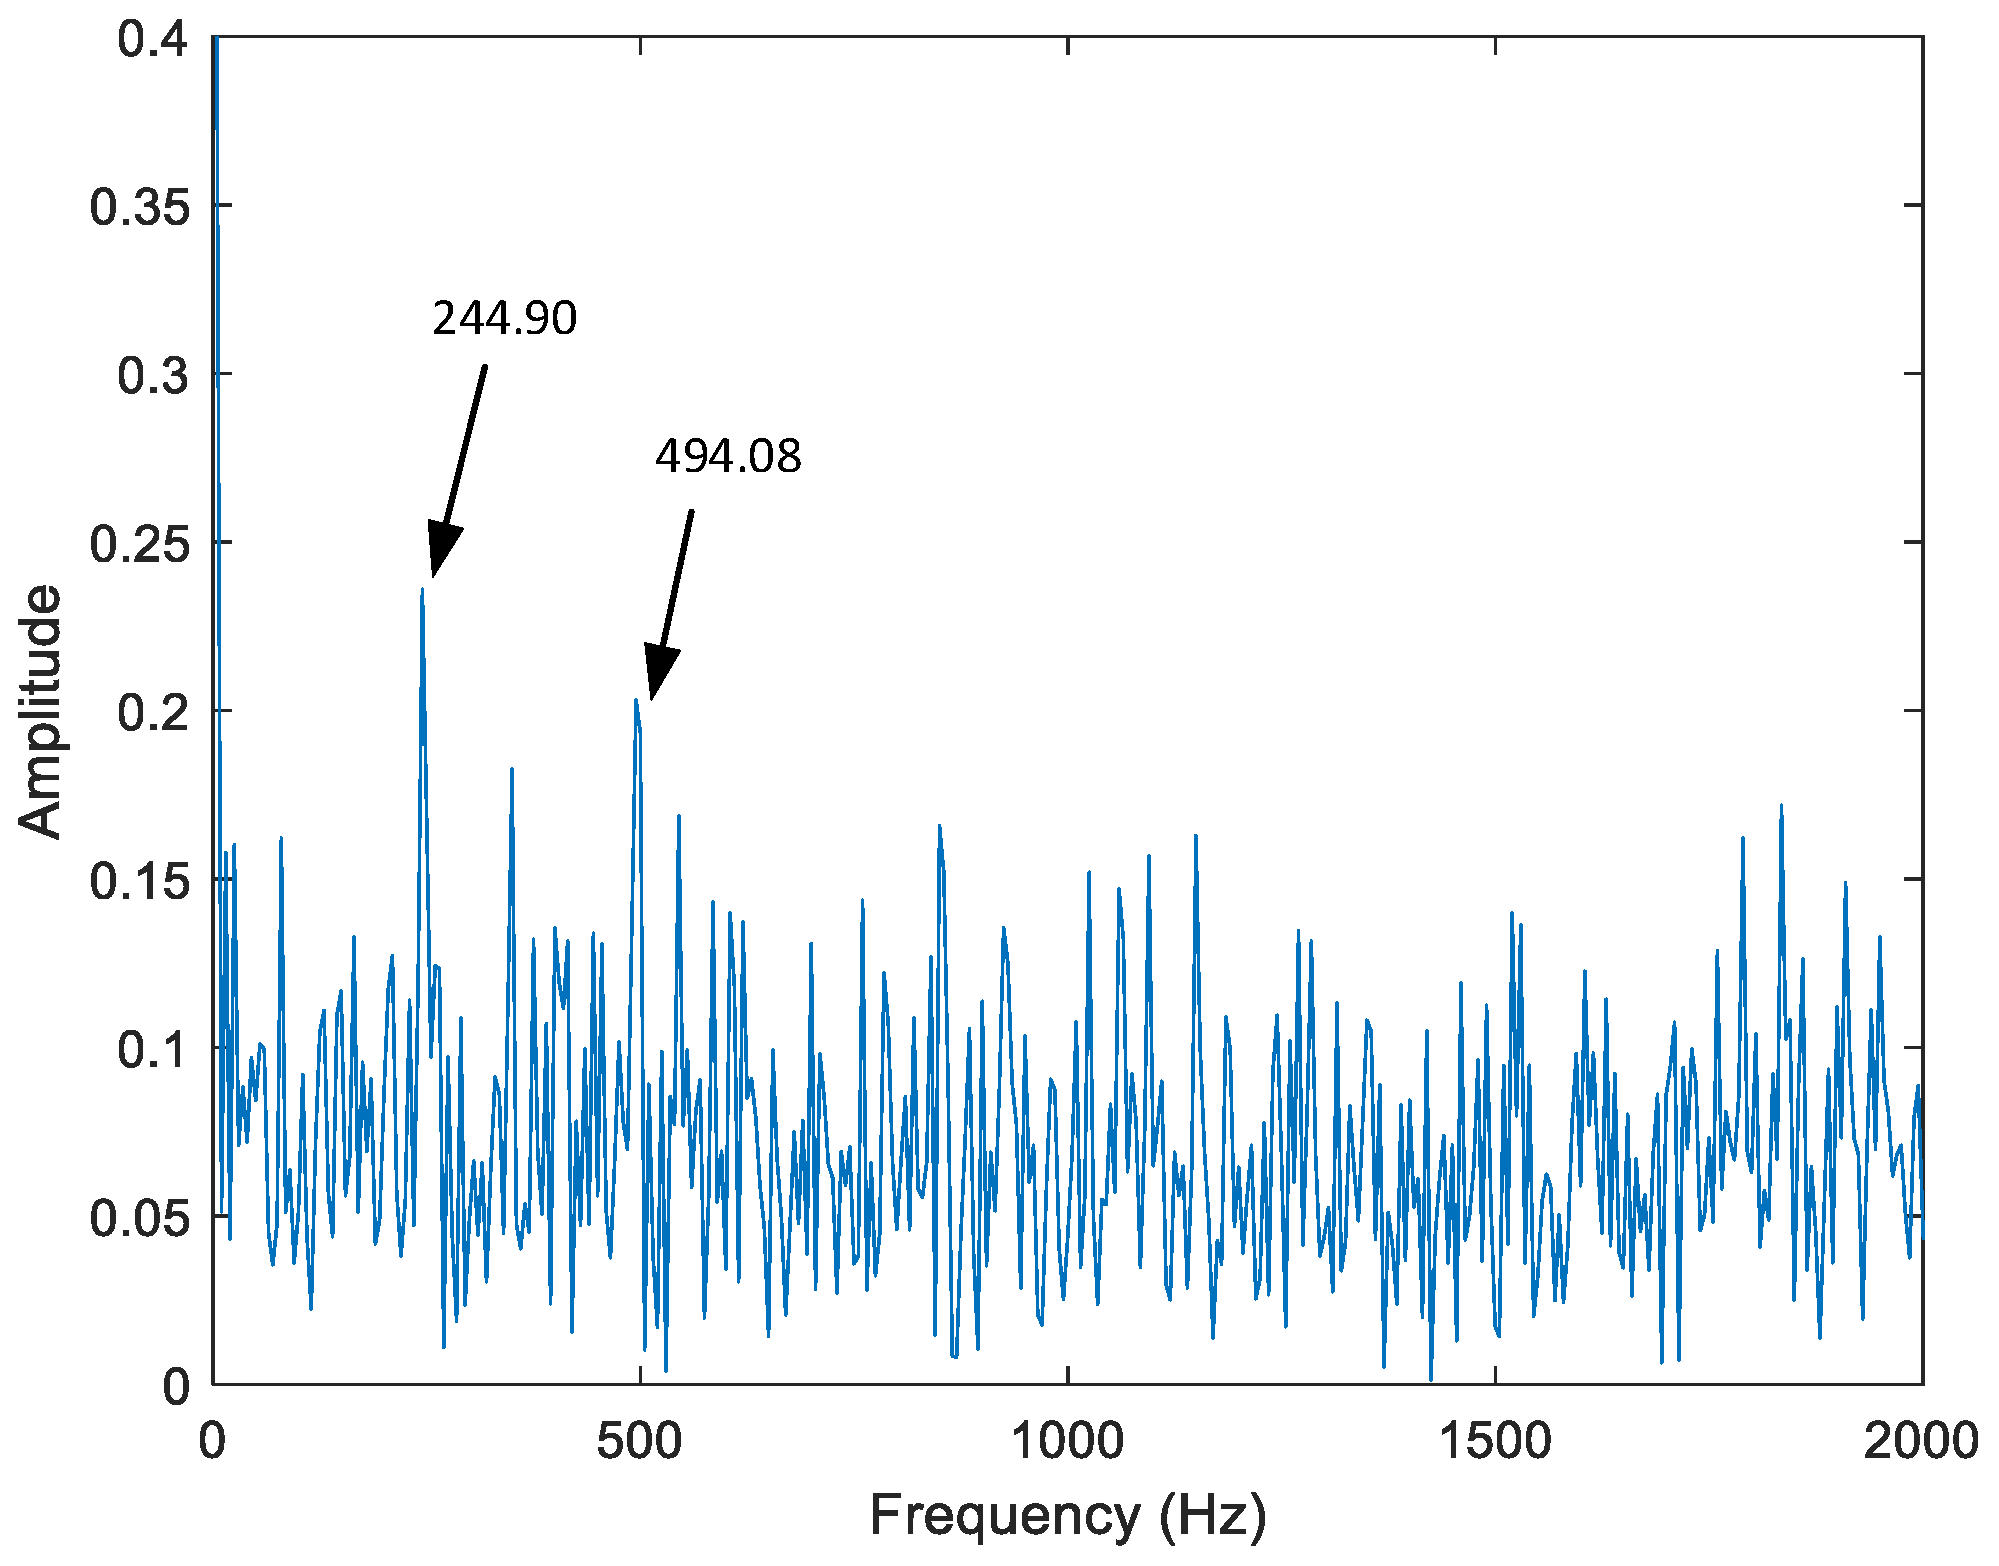
Figure 23.
CEEMDAN decomposition results.

Figure 24.
Reconstructed signal envelope.
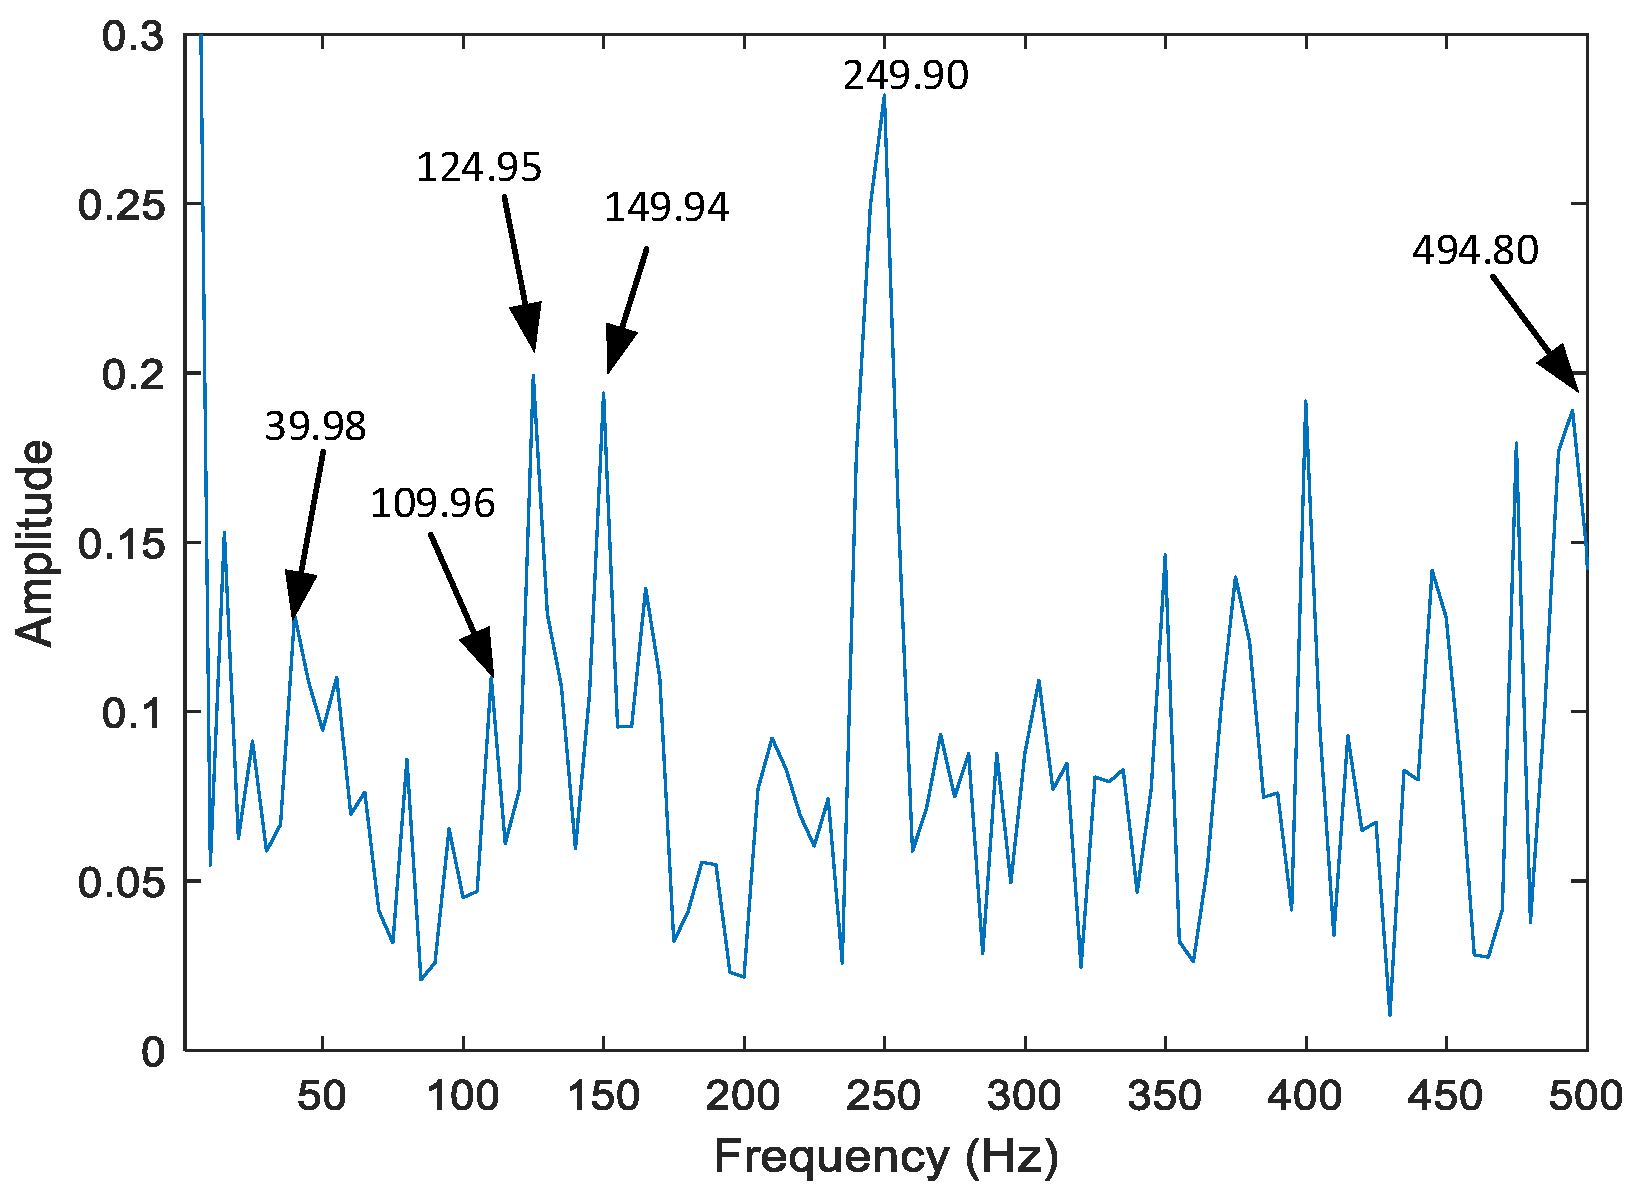
Figure 25.
MCKD processing result.

Figure 26.
Failure envelope spectrum of rolling bearing outer ring under variable working conditions.
Figure 26.
Failure envelope spectrum of rolling bearing outer ring under variable working conditions.

Table 1.
Bearing parameters.
| Bearing Mean Diameter | Ball Diameter | Number of Balls | Contact Angle |
|---|---|---|---|
| 34.55 mm | 7.92 mm | 8 | 0° |
Table 2.
Kurtosis and correlation coefficient of each IMF component of the signal.
| IMF Component | Kurtosis | Correlation Coefficient |
|---|---|---|
| IMF1 | 2.0957 | 0.7370 |
| IMF2 | 3.6166 | 0.4661 |
| IMF3 | 3.4088 | 0.4249 |
| IMF4 | 3.1486 | 0.3420 |
| IMF5 | 3.2082 | 0.2770 |
| IMF6 | 4.5772 | 0.2068 |
| IMF7 | 2.7392 | 0.1573 |
| IMF8 | 3.4486 | 0.0816 |
| IMF9 | 2.5464 | 0.0719 |
| IMF10 | 2.8642 | 0.0612 |
| IMF11 | 2.1216 | 0.0261 |
| IMF12 | 2.6415 | 0.0253 |
| IMF13 | 2.8042 | 0.0274 |
Table 3.
Kurtosis and correlation coefficient of each IMF component.
| IMF Component | IMF1 | IMF2 | IMF3 | IMF4 | IMF5 | IMF6 | IMF7 | IMF8 |
|---|---|---|---|---|---|---|---|---|
| Kurtosis | 2.028 | 3.965 | 3.297 | 4.681 | 3.183 | 3.525 | 3.314 | 3.004 |
| Correlation coefficient | 0.710 | 0.445 | 0.415 | 0.407 | 0.371 | 0.222 | 0.147 | 0.085 |
Disclaimer/Publisher’s Note: The statements, opinions and data contained in all publications are solely those of the individual author(s) and contributor(s) and not of MDPI and/or the editor(s). MDPI and/or the editor(s) disclaim responsibility for any injury to people or property resulting from any ideas, methods, instructions or products referred to in the content. |
© 2023 by the authors. Licensee MDPI, Basel, Switzerland. This article is an open access article distributed under the terms and conditions of the Creative Commons Attribution (CC BY) license (https://creativecommons.org/licenses/by/4.0/).
Share and Cite
MDPI and ACS Style
Zhao, L.; Chi, X.; Li, P.; Ding, J. Incipient Fault Feature Enhancement of Rolling Bearings Based on CEEMDAN and MCKD. Appl. Sci. 2023, 13, 5688. https://doi.org/10.3390/app13095688
AMA Style
Zhao L, Chi X, Li P, Ding J. Incipient Fault Feature Enhancement of Rolling Bearings Based on CEEMDAN and MCKD. Applied Sciences. 2023; 13(9):5688. https://doi.org/10.3390/app13095688
Chicago/Turabian StyleZhao, Ling, Xin Chi, Pan Li, and Jiawei Ding. 2023. "Incipient Fault Feature Enhancement of Rolling Bearings Based on CEEMDAN and MCKD" Applied Sciences 13, no. 9: 5688. https://doi.org/10.3390/app13095688
Note that from the first issue of 2016, this journal uses article numbers instead of page numbers. See further details here.