
How to Find Disruptions in Logistics Processes in the Cold Chain and Avoid Waste of Products?

1
SKK Logistics Data, 30-719 Cracow, Poland
2
Faculty of Mechanical Engineering, Cracow University of Technology, 31-878 Cracow, Poland
Appl. Sci. 2024, 14(1), 255; https://doi.org/10.3390/app14010255
Submission received: 21 November 2023
/
Revised: 22 December 2023
/
Accepted: 25 December 2023
/
Published: 27 December 2023
(This article belongs to the Special Issue Intelligent Logistics and Supply Chain Systems)
Abstract
:This article presents a review of the literature related to the topic discussed and then discusses the system enabling the collection of data for analysis, the components of which are described in the paper. Next, a case study containing analyses of the circulation of logistic containers and the quality of deliveries is presented. Finally, a discussion of the results is presented. Background: This research is instrumental in navigating the intricacies of using these insulated containers of disturbances in the cold supply chain is imperative for ensuring the safety of perishable items, pharmaceuticals, and medical provisions, all of which necessitate precise temperature storage. Moreover, it holds significant sway over the efficacy of logistics, curtails losses, and guarantees adherence to regulatory stipulations and quality benchmarks. Research target: The research aimed to analyze the circulation of isothermal containers and indirectly assess the transportation quality for food products using the example of a 3PL company. Method: The article addresses issues encountered in the transportation of products within the cold supply chain. Using a company as an example, the temperature of coolboxes at the beginning of the logistics cycle, temperature distribution during transportation, and the temperature at the end of delivery were analyzed. The circulation of containers, their utilization over time, cycle durations, and the entire container circulation process were also examined. Results: Based on the collected data, recommendations were formulated to enhance product quality and increase container utilization. This research offers valuable insights into improving the efficiency and quality of logistics processes, specifically within the cold chain transportation industry, and provides recommendations for better managing temperature-sensitive product transportation.
1. Introduction
The term “cold chain” is used in the context of food handling and distribution to describe the process of maintaining suitable conditions for products from the cooling or freezing phase through to the point of sale. This process involves various stages, including transportation, storage, and display.
Detecting disruptions in the cold supply chain is important for several reasons. Firstly, it pertains to the safety of food and other products during transport. For goods that require specific temperature conditions, such as fresh food products, medicines, or medical materials, maintaining the correct temperature is crucial to preserve quality and prevent spoilage or product degradation. Detecting potential temperature disruptions can help avoid the loss of goods and health risks to consumers.
Logistics efficiency is closely tied to maintaining the right conditions in the cold supply chain. Detecting disruptions allows for process optimization, increased transportation efficiency, and minimized losses. Precisely monitoring conditions also enables the optimizing resource utilization, such as isothermal containers or cooling inserts, resulting in cost savings.
Detecting disruptions in the cold supply chain enables compliance with regulatory requirements and quality standards, which is crucial for businesses operating in industries subject to stringent regulations. Monitoring can provide documented evidence that transported goods were stored under the right conditions, which is essential for audits and inspections.
Detecting disruptions in the cold supply chain has become an indispensable management tool, ensuring safety, efficiency, and regulatory compliance.
Companies that process refrigerated and frozen foods make substantial investments in refrigeration equipment, temperature control devices, and monitoring equipment to ensure the preservation of their products. However, it is a well-documented fact that once these products leave the manufacturing facility, they are often exposed to temperature variations and abuse during transportation [1].
Representatives from the Transport-Forwarding-Logistics (TFL) sector identify a significant challenge in their supply chain optimization efforts. This challenge is the inability to effectively analyze the risk of goods damage and the insufficient capability to monitor environmental conditions during distribution.
2. State of the Art
The food industry, including production companies and stores, incurs substantial annual costs resulting from product deterioration before their expiration dates. These costs are not just financial but can also impact a company’s reputation, especially when dealing with large retail chains that uphold strict quality standards. On the other hand, manufacturers fulfilling orders for larger customers may not have full control over the entire logistics chain, as some of the transport may be handled by the ordering party or external companies (Third Party Logistics—3PL).
Monitoring temperature and humidity within vehicles and managing data regarding changes in the ambient conditions are crucial components of the cold chain. Various commercially available hardware, software, and solution providers offer a range of solutions for data recording, storage, and retrieval [2].
Several researchers have focused on monitoring food safety during transportation, including [3,4,5,6,7,8], proposed the design of an intelligent monitoring system based on the Internet of Things, which monitors temperature and humidity inside refrigerator trucks, intelligently identifies the cargo, and tracks the real-time location of refrigerator trucks throughout the transportation process using RFID and sensor technology [8]. IoT devices in the supply chain process track and trace shipments using the latest real-time monitoring technologies, including GPS [9].
Rya [10] identified 15 primary risk areas during food transportation, including refrigeration and temperature control, transportation unit management, packing, loading and unloading, security, pest control, container design, preventive maintenance, employee hygiene, policies, handling of rejected loads, holding, and traceability. Due to these challenges, many supply chains are functioning below the ideal state, leading to approximately one-third of globally produced food for human consumption going to waste [11]. Food waste may be reduced with better temperature management in food cold chains [12]. The pre-warning system aims to assist managers in food manufacturing firms by identifying food safety risks in advance. It provides support decision-support information to uphold the quality and safety of food products [13].
Regardless of the type of food products being transported, they all require several common steps in their journey from the point of origin to the point of use to ensure safe transportation and prevent contamination. Recent trends in food safety focus on the miniaturization of analytical procedures using sensors, biosensors, microchips, lab-on-a-chip devices, or total micro-total analysis systems, enabling rapid detection of possible contamination, especially during transportation [14]. These miniaturized devices can measure various parameters, including temperature, humidity, chemical contaminants, and microbial contaminants [1,15].
While solutions available on the market and research findings allow monitoring of the climate conditions within the trailer, they do not provide insights into the ambient conditions of the product itself. The conditions within a semi-trailer can vary due to uneven air circulation. In many cases, cooling occurs at the front of the semi-trailer, resulting in higher temperatures in the middle part. Placing temperature recorders in the wrong location can lead to inaccurate readings [16]. Furthermore, during waits for unloading or when switching between different means of transport (e.g., from a truck to an airplane), products can experience significant temperature fluctuations. Independent studies by transportation companies have shown temperature differences of up to 25 °C during such situations [17].
While increases in temperature and humidity do not specify the type of contamination that will occur, they serve as indicators of potential issues in various types of food products, such as milk, meat, plants, fruits, and vegetables. Therefore, temperature and humidity can be considered universal parameters for sensor design to monitor a wide range of food products [2]. Combining these sensors with machine learning algorithms, wireless sensing technology, and intelligent devices like manipulators effectively enhances monitoring accuracy [18].
The fruits and vegetables often result in shriveling, which can significantly affect the quality in terms of texture, appearance, and saleable weight during transportation and storage [19]. Recognizing the imperative need for pre-cooling in cold chain development, the paper highlights the evolving technologies of solar and biomass energy. While there are challenges, such as the instability of solar energy and its low energy density, coupled with advancements in phase change energy storage technology, the paper suggests a novel approach—integrating solar and biomass energy in a coupled drive for pre-cooling energy storage processes [20]. Because of the perishability and strong timeliness of distribution of fresh products, inventory costs, penalties, and damage costs need to be considered [21].
Livestock products, comprising over 15% of global agri-food trade, face increased food safety risks due to rising demand. Ensuring their safety necessitates improvements in food quality, cold chain transit, and preservation. Despite authorities’ demand for complete traceability, traditional supply chains often manipulate paperwork, neglecting this requirement. Overhauling supply chains and managing food recalls during safety issues prove expensive and challenging. Traceability-focused food supply chain management explores technologies like IoT, while blockchain shows promise in numerous studies and use cases across regions [22]. The creation of a seamless cold chain supply system undergoes three distinct stages, with blockchain technology serving as a crucial element. The behavioral decisions of the three stakeholders are notably impacted by factors such as the expenses associated with adopting blockchain, government incentives, and potential penalties [23]. Traditional traceability data faces challenges with low cooperation trust and poor authenticity in the supply chain’s data transmission process, causing a crisis of trust among consumers. The blockchain traceability system addresses this by establishing multi-party participation, maintaining a distributed database, and using cryptography and consensus mechanisms to ensure data integrity and high credibility [24].
The paper [25] addresses the challenge of maintaining the freshness of perishable products during transportation in urban areas. It focuses on planning activities to preserve freshness within a specific distance range, utilizing an analytical model involving an online retailer and a third-party logistics service provider. This finding is crucial for management, as accurate prediction and control of freshness by distance range can minimize customer complaints about delivered product quality. Moreover, the use of mobile and desktop applications facilitates paperless operations for shipping, remote monitoring of temperature and humidity, anomaly detection, warnings, and customer interactions [26].
Other research [27] proposes a stochastic hub-and-spoke network model and optimization algorithm to minimize transportation costs by optimizing production, distribution, and transportation networks. This accounts for climate variability and its impact on crop yield, enabling distributors and consumers to find alternative suppliers in different areas to address fluctuations in produce supply.
The field of the route of transportation optimization for cold chains is the area of scope of many researchers. The areas are a two-stage hybrid-heuristic-path-scheme algorithm, incorporating taboo tables, genetic algorithms, optimal-path generation, load capacity constraints, and time window constraints, devised to address the complexity of the model [28]. The paper aims to optimize resource allocation in cold chain logistics, cut transportation costs, improve customer satisfaction, and align with green logistics policies by reducing vehicle transit time and fuel consumption, and promoting energy conservation. The problem is initially formulated as a constraint optimization issue, followed by the introduction of a CC-ant algorithm within the ant colony framework [29]. The other researchers proposed model was solved by the hybrid algorithm of artificial fish-swarm algorithm (AFSA) and ACA (AFSA-ACA hybrid algorithm) [30]. The simulation results and experiments demonstrate that the IACO algorithm exhibits lower convergence speed, logistics transportation distance, and logistics delivery time compared to the chaotic-simulated annealing ant colony algorithm (CSAACO) and the traditional ACO algorithm [31]. The experimental results showed that this method can effectively reduce path planning time, reduce the proportion of path overlap, and effectively improve the effect of logistics deployment path planning [32].
3. Methodology
The research focuses on the thermal and mechanical properties of coolboxes used in cold chain transportation. The target of the research was to analyze the real possibilities of using coolboxes in the transport chain and analyze the problems that appear in real cases. The research helps to deal with the process of using these insulated containers (cooling, cleaning, transport, unpacking, etc.).
The properties of the coolboxes used in research:
| • Outer dim. in mm (L × D × H): | 800 × 1000 × 1900 mm |
| • Inner dim. in mm (L × D × H): | 610 × 820 × 1535 mm |
| • Inner volume: | 768 L |
| • K value: | 0.33 W/m2·K |
| • Unloaded weight: | 130 kg |
| • Insulating material: | Polyurethane foam |
| • Wall material: | Food grade polyethylene |
The coolboxes are reusable, washable, and efficient. Insulated containers combined with cold accumulators or eutectic plates (a self-contained passive cold source) enable you to maintain the temperature of products for 24 h or more, thereby preserving the quality of your products right to their place of consumption. ATP-certified, the insulated container allows travel more than 80 km while carrying out load breaks.
The developed system allows for the monitoring of temperature and other environmental conditions, and it records measurements internally. Data from the measurement devices are retrieved when they come within the range of the gateway receivers and are then transmitted to the cloud. The Hive Web system enables data viewing, while analytical tools like Tableau can be used to prepare substantive reports highlighting disturbances that affect the effectiveness and efficiency of the processes.
Operation of the system:
- Measurement and data collection: Sensors placed inside containers regularly measure and collect data regarding temperature and other environmental conditions;
- Data transmission to the Gateway: When the measurement devices are within the range of gateway receivers, they transmit the gathered data to these receivers. These receivers are part of the SKK Gateway system;
- Data transmission to the cloud: Data received by the gateway receivers are sent to the cloud, enabling storage and further analysis;
- Data viewing via Hive Web: System users can use the Hive Web interface to view the collected data. They can monitor current conditions and measurement history;
- Generating reports using analytical tools: Data stored in the cloud can be processed and analyzed using analytical tools such as Tableau. This allows for report generation and analysis of the effects of any disruptions impacting storage and transportation processes.
The structure of system components is presented in Figure 1 and described in detail in Appendix A.
Collected data set:
- Temperature: For monitoring temperature, the system gathers data from sensors placed inside containers. These data are crucial for monitoring and controlling the storage conditions of temperature-sensitive goods;
- Other environmental conditions: In addition to temperature, the system can collect data related to other conditions, such as humidity, light levels, vibrations, etc. This information may be relevant depending on the type of goods stored in the containers.
This system enables continuous monitoring and analysis of environmental conditions, which can contribute to better control of storage and transportation processes and provide real-time responses to potential issues.
The research was conducted in the following stages and is presented in Figure 2:
- STATGE I—A monitoring technology for storage and transportation conditions of goods based on the BLE (Bluetooth Low Energy) standard was developed—presented in Appendix A;
- STAGE II—A data acquisition system and data storage in the cloud (MS Azure) were developed;
- STAGE III—Disturbances in the process affecting the quality of implemented processes were analyzed using Tableau dashboards.
Results, conclusions, and recommendations for improving processes within the cycle of isothermal container circulation were presented.
4. Case Study—Analysis of Disruptions
In the analyzed case study, real-world research was conducted to monitor the transportation conditions of fresh and frozen products in 40 containers over a period 2 months. The scope of the analysis includes the following:
- Number of containers/sensors: 40 units;
- Measurements: Temperature, light;
- Measurement interval: 10 min;
- Device memory: Up to 8 days of measurements;
- Number of gateway devices: 3 units;
- Analysis period: From 6 May 2022 to 6 July 2022 (2 months);
- Basis for data analysis: Logistic cycle detection algorithm;
- Transported goods:
- ○
- Fresh (from 2 °C to 6 °C);
- ○
- Frozen (below −12 °C)
- Range: Distribution center (DC) plus approximately 150 km.
4.1. Analysis Objectives
- Identification of lost/delayed containers;
- Identification of temperature exceedances during transportation:
- ○
- At the beginning;
- ○
- During transportation;
- ○
- At the end of the cycle.
- Identification of container utilization.
Data collection devices (Gateways) are positioned in the area where containers are received, and goods are dispatched in containers. The arrangement of Gateways is presented below.
In a typical DC, there are three types of stored goods, and the storage areas are colloquially named accordingly:
- Dry: Products stored at room temperature, dry, without the need for temperature control, mainly products with a long shelf life;
- Fresh: Products stored at controlled temperatures, i.e., from 2 °C to 6 °C, referred to as fresh products;
- Frozen: Products stored at controlled temperatures, i.e., below −12 °C (frozen) or −20 °C (deep-frozen).
4.2. Logistics Process of Container Circulation in the Cold Supply Chain
The circulation of containers in the process depends on individual customer requirements. There are no formal requirements specifying how such a process should look, so the process may vary for each customer. Also, the transport temperature and the temperature in specific zones in the distribution center (DC) depend on the customer. This makes it impossible to classify temperature readings without defining the temperature requirements for specific zones and/or goods stored in containers (warm, cold, or frozen).
The logistics cycle in the analyzed warehouse includes various zones with specific requirements for each process (Figure 3). The cleaning and drying of containers are essential parts of the logistics cycle but can vary depending on the company’s internal policies. Cleaning may occur before every cycle, periodically (e.g., once every few cycles), on specific days of the week, or when containers are visibly dirty or emit unpleasant odors.
Container drying can be achieved in the following two ways:
- Drying in a zone (room) with forced air circulation at a higher temperature than the rest of the distribution center;
- Drying in a zone without raising the temperature and without forced air circulation.
In the analyzed warehouse, the following zones are present:
- Loading/Unloading Zone: This is where goods received from suppliers are unloaded, and products destined for customers are loaded. It may have a direct connection to the warehouse through entry gates or an indirect connection via intermediate ramps and sluices, depending on the nature of the stored goods and desired conditions inside the warehouse;
- Receiving Zone: This is where goods are received, and processes include order quantity and quality control, cargo sorting, product labeling, determining storage locations, and possibly subdividing into smaller units. The receiving zone is usually separated from other areas to avoid interference. It may also be connected to the shipping area.
- Storage Zone: This is the primary warehouse area where products are stored. The size and layout depend on factors like the type of stored products, turnover rate, available technological solutions (e.g., shelf type and height, machinery, automation systems), storage method (on the floor, on shelves, in racks, etc.), and other factors. Various equipment and tools, such as forklifts, lifting devices, and cranes, are used in this area;
- Container Cooling Zone: This is where containers are cooled after cleaning and drying. Properly cooled containers are essential for maintaining the required temperature during product transportation;
- Picking Zone: This zone might not exist in every facility but is used for assembling orders. It’s typically found in warehouses serving small distributors or retail customers with diverse orders;
- Shipping Zone: In this area, completed orders are packed, labeled, and then sent to the loading area. Efficient operations in the shipping zone require equipment that aids in packing and labeling cargo and ensures a smooth flow of goods between this zone and the picking and loading areas;
- Service Areas: Every warehouse typically includes service areas such as restrooms, offices, changing rooms, customer service desks, and quality control departments. These areas may also include battery charging stations for electric equipment.
These zones are vital in managing the logistics cycle effectively. The specific processes and requirements in each zone can vary between warehouses based on the nature of the products and the company’s operational policies.
Additionally, in warehouses where there is a circulation of logistic containers, the following zones are present:
- Cleaning Zone: This is where containers are cleaned;
- Drying Zone: Containers are dried in this area;
- Cooling Zone: Containers are cooled here.
The division of zones may not always be present in every warehouse. Some warehouses may have a limited division of zones, for example:
- The Receiving/Dispatch Zone may also serve as the Loading/Unloading Zone;
- The Storage Zone may also serve as the Picking Zone.
Additionally, there are service zones in the warehouse, such as restrooms, offices, dressing rooms, customer service points, and battery charging areas.
Special zones, such as the cleaning/drying zones, may be integrated into the typical receiving zone, while cooling zones may not exist, and containers are cooled in the storage zone. The processes carried out in the zones are presented in Table 1.
4.3. Results Analysis, Conclusions, and Recommendations
The result of the system’s operation was the generation of a report containing logistics process statistics and information about detected irregularities (deviations from the assumptions). Below are excerpts from the results (Figure 4).
During the analyzed period, 874 cycles were identified, with 34.5% of them being fresh cycles and 65.5% being frozen cycles.
In the analyzed company, shipments are sent seven days a week. The company sends more frozen deliveries than fresh, and on weekends, deliveries tend to have a more supplemental nature rather than regular (Figure 5). This results from underestimating the demand, as most stores place orders with the DC for goods in quantities that match the in-store demand for stock.
The duration of cycles is challenging to determine because the actual cycle time does not correspond to what is recorded by the TMS (transport management system). The cycle time for delivery is measured by TMS systems as follows: the start time of the cycle corresponds to the time the container/order is scanned when the goods are dispatched from the DC to the delivery vehicle. The end time of the cycle, on the other hand, refers to the re-scanning of the container/order when it is unloaded at the store.
Most entrepreneurs understand and analyze the delivery cycle in this way. However, this approach is incorrect because this interpretation is characteristic only for deliveries other than the cold chain, such as dry food product deliveries. Cold chain deliveries, on the other hand, have the cycle starting from the moment the loaded container is sealed until it is reopened during unloading. This is because the goods inside the container must be transported under specific temperature conditions from the end of loading, marked by closing the container’s doors, to the moment unloading begins, marked by opening the doors.
As a result, in the analyzed company, the study has shown that the actual cycle is significantly longer, around 13 h for fresh deliveries and about 10 h for frozen deliveries (Figure 6). According to the company, the delivery time should be around 6 h. The difference is that because the company does not include the waiting time for transportation from the moment the goods are loaded into the container to the moment of their release, which is the time spent in the delivery area. This waiting time is approximately 4 h. The results of the analysis of the delivery cycle duration are presented in the chart below.
Furthermore, the company is unable to determine how long the containers with goods wait for unloading at the stores. The unloading time at the stores is not enforced by the delivery—the containers are returned to the distribution center (DC) during the next delivery opportunity. So, store employees have time to unload, which usually occurs when there is less store traffic, and employees can attend to the delivered goods. It might also happen that employees intentionally delay the unloading to make use of the cooling system inside the container, which is supposed to maintain the proper conditions inside. By delaying the unloading, they are lowering the costs of cooling and maintaining the newly delivered goods in the store. However, they are risking potential damage to the goods due to the breach of transport conditions, and they would also require more energy to cool it. Therefore, these savings might be misleading. If store employees were informed about the right time for unloading, the goods wouldn’t be damaged due to transport condition violations, and the company could save on energy costs during the maintenance of proper conditions in the store. These three components of delivery time—waiting time for a loaded container at the gate, transport time, and unloading time—make up the actual delivery time shown in the figure above.
Another important aspect regarding process quality was the analysis of the hours during which container shipments are carried out. This is significant because the isothermal containers are transported in standard vehicles, not isothermic ones, so the ambient temperature has a significant impact. The hours of container shipments are presented in Figure 7.
As shown in the above figure, shipments are carried out almost continuously for fresh deliveries, while frozen deliveries are mainly sent from 5 p.m. to 11 p.m. It is worth noting that the company avoids shipments during the hours from 9 a.m. to 3 p.m. when the outside temperature is highest, and delivery times could be extended due to traffic congestion in the city. This is a very effective company policy.
Analyzing the collected data, the circulation of containers was also examined, i.e., lost or delayed containers. Normally, containers should return to the distribution center (DC) with the next delivery, typically within 24–30 h. Thanks to the installation of gateways in the reception area of the DC, which allowed for the detection of returning containers, it was possible to determine which containers had been unaccounted for longer than two days. The analysis of lost and delayed containers is presented in Figure 8.
It turns out that out of the 40 containers examined, a staggering 8 containers were outside the distribution center (DC) for more than 2 days. Some containers did not return to the DC for a month or two. This means that stores often hold containers for extended periods or lose them. This is a significant problem for container owners, as unused containers in the transportation system significantly increase operational costs. Proper management of container uses is recommended to reduce these costs and eliminate waste. Proper management means that containers should be assigned to the transport’s tasks based on the technical state, readiness (clean and cooled to the required temperature for products), and frequency of use.
The monitored containers were subjected to an analysis to determine how often they are used, i.e., whether their usage is consistent. The chart showing the most frequently used containers, with the container with the highest number of logistics cycles as the reference container, is presented in Figure 9.
During the analysis of container utilization, it was noticed that:
- 26 containers are used correctly (above 70% utilization);
- 6 containers have low rotation rates, with utilization between 30% and 70%, and among them, 2 containers are considered lost;
- 8 containers are considered lost or have malfunctioning sensors (no data collected for over 10 days).
The next step was to analyze the frequency of container utilization in an aggregated view. To achieve this, logistics cycles were distributed across weeks (Figure 10). The results are presented in the figure below. Due to incomplete weeks, data for weeks 20 and 28 were omitted from the analysis. The median number of cycles for the remaining weeks was 104, averaging 3.2 cycles per container per week (excluding the 8 lost containers). This confirms previous results that containers are often held for over 24 h, most commonly more than 2 days. As a result, container use is nearly twice as low as its maximum potential. Improving the use of containers is possible through better management of logistic processes. To achieve this, it is necessary to shorten the lengthening processes within the warehouse, such as waiting for loading, extended container cooling times, and long product picking times. Additionally, it is advisable to increase control over stores and motivate their employees to unload goods promptly upon delivery, as employees often delay unloading, assuming that the goods in the container are not subject to warming/thawing. This is a common mistake in store management.
The analysis of the overall service quality in an aggregated view, presented in the figure below, shows that the transportation occurred within the required temperature range, i.e., between the lower and upper limits (Figure 11).
The average temperature for Fresh products remained within the required temperature range—between 2 and 6 °C (Figure 12). However, the temperature distribution analysis in the cycles proves that there were instances of exceeding this range (41%)—see the figure below. In total, 39.7% of measurements were over the required transport conditions, and 1.4% of measurements were under the low required temperature. That means sometimes products are over-cool, which can damage the products like lettuce; what is more, over-cool generates extra costs that can be omitted.
The above chart illustrates that it’s necessary to analyze each cycle individually, and aggregating values is not possible because it leads to inaccurate results. To determine the cause of disturbances, the focus was on analyzing the initial temperature of the container at the beginning of the delivery cycle. This temperature indicates the readiness of the container for loading. The analysis (Figure 13) showed that almost all containers for Fresh deliveries were adequately prepared, i.e., 96% of cycles (including more than 3.7% of containers with temperatures below the required level). Chilling fruits and vegetables can lead to a range of undesirable effects, negatively impacting their quality and shelf life. Low temperatures can cause water crystallization in plant cells, resulting in damage to cell structure and changes in texture and consistency. Additionally, chilling can affect the taste by inhibiting the activity of enzymes responsible for flavor development. Swelling, changes in color, increased risk of damage, and condensation of water on the surface are further negative effects of chilling. Consequently, chilling poses a significant challenge in the context of storing and managing the logistics of food products, threatening the integrity, flavor, and durability of fruits and vegetables.
As a result of this, there was a satisfactory temperature at the end of the cycle, i.e., at the time of unloading. This temperature was correct for 94% of deliveries (including 50% of deliveries that were too cold) (Figure 14). The over-cooling of deliveries is because the used eutectic inserts are cooled to a temperature 10 °C lower than the minimum requirement. This allows for a longer maintenance of a low temperature inside the container. If stored fruits and vegetables undergo freezing, it may necessitate their removal from stocks, generating additional costs associated with product loss. Moreover, the need for employing more sophisticated temperature-controlled storage systems can increase overall operational expenses. Freezing can impact the efficiency of logistical processes, requiring more advanced transportation and storage means to prevent product damage during movement through the supply chain. Frozen fruits and vegetables can harm a producer’s reputation, affecting consumer trust in the brand. Quality concerns may lead to customer loss and a decline in sales.
The situation looked much worse for frozen deliveries. Even the analysis of average temperatures during the cycle showed that the required temperature was never maintained (Figure 14).
Since the average temperature for frozen products did not fall within the required temperature range, a detailed analysis was conducted, revealing that only 32% of measurements during deliveries were correct (Figure 15). Improper storage of frozen foods can create conditions conducive to the growth of microorganisms, such as bacteria or molds. This, in turn, can lead to product spoilage and pose a health risk to consumers. These products may more easily succumb to spoilage, thereby increasing the risk of product loss and generating additional costs associated with replacing spoiled inventory. Prolonged improper storage of frozen foods can result in the loss of nutritional value. Temperature increases can impact the content of vitamins, minerals, and other nutritional components.
The analysis of the temperature distribution shows that 67% of measurements in cycles were disturbed. Therefore, the next step, similar to the case of fresh deliveries, was to analyze the temperature (Figure 16) at the beginning of the cycle. It showed that in 98% of cases (Figure 17), it was incorrect, meaning the containers were cooled to temperatures lower than fresh but not to the target −12 °C. Uncooled coolboxes will gradually lose their ability to maintain low temperatures. As a result, frozen products inside the coolbox will begin to thaw, leading to a loss of quality, especially in terms of texture, taste, and aroma. If the temperature rises above a certain point, perishable food items may exceed the safe temperature range, promoting the growth of bacteria and microorganisms. The temperature increase in the coolbox creates an environment conducive to bacterial growth, increasing the risk of food poisoning when consuming products that have undergone microbiological degradation. To avoid these issues, it is important to cool them before use, marking the initiation of the logistic cycle.
Despite the use of cooling inserts at the initial temperature of −22 °C, the final temperature was not reached in 80% of cases, as shown in Figure 18. The final temperature depends on the amount of coolant inside the coolboxes. This case proves that there is a significant problem with maintaining the required temperature. The following several factors influence the proper dosing of dry ice:
- Temperature requirements of the products: Different food products or other goods may require different temperature ranges to stay fresh, chilled, or frozen. Therefore, the amount of dry ice used should be adjusted to the specific temperature requirements of the stored products;
- Size of the thermally insulated container: Thermally insulated containers vary in size, affecting the amount of space available for placing dry ice. Dosage must be adapted to the container’s capacity to maintain a balance between cooling and the occupied space;
- Duration of transport or storage: The length of the journey or storage period is crucial. Depending on whether it is a short trip or an extended storage period, it may be necessary to adjust the amount of dry ice to maintain the desired temperature throughout the entire journey or storage period;
- Insulation of the container: The quality of insulation in thermally insulated containers affects the efficiency of cooling or freezing. Better insulation requires less dry ice to maintain a stable temperature inside;
- Weather conditions: Ambient temperature and weather conditions, such as sunlight, can influence the rate of dry ice sublimation. In higher temperatures or intense sunlight, it may be necessary to increase the amount of dry ice;
- Type of products: Products with different densities, structures, or initial temperatures may require adjusting the amount of dry ice. Products that are already chilled may require less dry ice than those at room temperature.
Accurate dosing of dry ice requires consideration of these factors and precise monitoring of the temperature inside the thermally insulated container to ensure the effective cooling or freezing of stored products. Regular checks of conditions and adjustments to the amount of dry ice as needed are crucial for maintaining the quality and safety of stored food.
However, such cooling of the inserts allows further reduction in the temperature inside the container during the cycle. The key factor is to ensure proper preparation of the container—cooling it to the required transport temperature before loading the products. Suppliers who fail to adhere to the transport conditions specified in contracts or regulations may encounter compliance issues with customer requirements, leading to the loss of contracts and business partners. Improper transport conditions can violate food safety regulations and standards, potentially resulting in financial penalties, legal sanctions, and damage to the supplier’s reputation.
Therefore, maintaining appropriate transport conditions for food products is crucial to ensure quality, safety, and compliance with regulations. Food suppliers should adhere to rigorous standards, monitor transport conditions, and operate by industry regulations to minimize the risk of the aforementioned consequences.
5. Conclusions
Temperature control in the transportation of food products brings a range of benefits. Primarily, it is crucial to ensure food safety by preventing the growth of bacteria, mold, and other microorganisms that can lead to product spoilage. Additionally, maintaining a stable temperature positively impacts the quality of products, preserving their freshness, taste, and texture. Temperature control is also significant in the context of complying with legal standards for the storage and transportation of food, minimizing the risk of fines and legal sanctions.
The temperature at the beginning of the logistics cycles is appropriate for fresh, often even too low (21%). The end temperature is too low in 18% of cases, indicating an excessive dosage of the cooling agent.
For frozen, the temperature at the beginning of the logistics cycles is too high, disrupting 67% of the transport time in the cycles. Moreover, the end temperature is correct in only 10% of cases, highlighting inadequate container preparation (insufficient cooling).
Containers can be better assigned to tasks. Currently, containers with poor temperature maintenance are often assigned to tasks more frequently than higher-quality containers.
The three components of delivery time—waiting time for the loaded container at the gate, transport time, and unloading time—constitute the actual delivery time. To ensure the shortest delivery time and minimize the risk of violating transport conditions, it’s crucial to minimize the time containers with ready products spend in the shipping zone, especially if the container’s temperature is higher than required for transport. Additionally, it’s essential to ensure that stores promptly perform unloading.
Frozen deliveries should be sent between 5 p.m. and 11 p.m., and it’s advisable to avoid shipments between 9 a.m. and 3 p.m. when external temperatures are highest, and delivery times can be extended due to city traffic.
If containers are frequently held for more than two days, container use is nearly half of its maximum potential. Therefore, it is recommended to invoice stores for containers held for more than a day to balance losses from underutilized containers and the need to purchase more containers to meet order quantities.
By ensuring optimal storage conditions, temperature control also contributes to minimizing food waste, extending the shelf life of products. In the supply chain, precise temperature control aids in optimizing processes, increasing the efficiency and reliability of the entire logistics system. Moreover, attention to appropriate temperature conditions translates into a positive brand image, building trust and customer loyalty. As a result, temperature control in the transportation of food products is a key element for public health, efficient supply chain management, and the maintenance of food quality. The study also revealed the significance of proper control over the container use process. Containers must be cooled to the transport temperature, cooling agents must have a temperature lower than the lower limit of the required transport temperature, and the cycle’s duration should not be disrupted by goods held in containers for longer than necessary.
Funding
This research was funded by project POIR.01.01.01-00-0035/22 “SKK Hive Analysis—Logistics Process Optimization based on Internet of Things and Artificial Intelligence”.
Institutional Review Board Statement
Not applicable.
Informed Consent Statement
Not applicable.
Data Availability Statement
The data are not publicly available due to the data constitutes a trade secret.
Conflicts of Interest
Author Augustyn Lorenc was employed by the company SKK S.A. The author declare that this study received funding from MCP. The funder had the following involvement with the study POIR.01.01.01-00-0035/22 “SKK Hive Analysis—Logistics Process Optimization based on Internet of Things and Artificial Intelligence”.The funders had no role in the design of the study; in the collection, analyses, or interpretation of data; in the writing of the manuscript, or in the decision to publish the results.
Appendix A. System Components
- Gateway
The gateway is a BLE receiver, which is an element of the system responsible for communication with sensors and sending the collected data to the Hive Server module.
Hive Gateway is a device that automatically communicates with the sensors by sending data to the Hive Server module. It is a receiver in the BLE communication protocol. The device is fully automatic, and configuration by the user is not required. The operation and configuration of the Hive Gateway are managed automatically by the Hive Server.
The SKK Smart Logistics Unit Gateway is one of the fundamental technical components of the system, enabling cooperation with multiple SLU sensors simultaneously. The device collects data from transmitters within its radio range, which is then gathered, preprocessed, and sent to the server in the subsequent step.
The device operates in a plug-and-play configuration, requiring no user configuration or hardware intervention. The gateway offers the option of using power over ethernet (PoE) or a 230 V network power supply. Additional accessories include an antenna, allowing for customization to meet specific specifications and operational characteristics.
The key parameters of the SKK Gateway are presented in Table A1.

Table A1.
The key parameters of the SKK SLU Gateway.
| Parameter | Value |
|---|---|
| Radio System Frequency | 2.4 [GHz] |
| Maximum Operating Range | 15 [m] |
| Temperature Range | 0–40 [°C] |
| Humidity Range | 10–90 [%] |
| IP (Ingress Protection) Rating | IP54 |
| Wi-Fi Interface | 802 b/g/n 150 Mbps |
| Network Interface | Port Ethernet 10/100 Mbps |
| Power Supply | 230 [V], PoE |
| Operating System | Linux |
The gateway (Figure 1) device is designed to facilitate wireless communication between the data server and SLU Sensor devices. In the physical layer, the communication between the SLU Gateway and SLU Sensors will use Bluetooth Low Energy technology, while communication with the SLU Server will occur over a local LAN network.
In real-world conditions, the device should be designed to operate reliably in production areas, warehouses, and, in some cases, office settings. The most common environment will be warehouse installation. To achieve the maximum wireless range, it is necessary to select an appropriate mounting location for the SLU Gateway. The nature of Bluetooth Low Energy technology requires a stable direct line of sight connection (without objects between devices). Therefore, a convenient/optimal mounting location for SLU Gateway devices can be the ceiling. For such installation locations, particularly adverse environmental conditions should be taken into account, including high temperature, humidity, and the risk of flooding.
To ensure an extended operating range for SLU Gateway devices, the use of dedicated antennas is necessary, hence the requirement for antenna connectors in SLU Gateway devices.
- Sensor
The Sensor is a configurable device based on BLE technology responsible for measuring and recording environmental parameters. The SKK Hive Sensor is a small wireless measuring device and a fundamental technical component of the Hive System. The device features non-volatile memory and built-in sensors for recording environmental data, including light, temperature, humidity, and vibration. The effective operating range of the device at standard settings is 15 m, with a maximum standard range of 25 m. Exact distances depend on the environment, device configuration, and selected accessories (e.g., antennas).
The Hive Sensor works exclusively with the SKK Hive Gateway and SKK Hive Mobile App. These devices enable data retrieval and configuration changes. They are responsible for communication with the sensors, including data download and configuration adjustments.
The key parameters related to the operation of the device are presented in Table A2.
Table A2.
The key parameters of the SKK Sensor.
| Parameter | Value |
|---|---|
| Operating Temperature | −40 ÷ 85 [°C] |
| Operating Voltage | 2.4 ÷ 3.6 [V] |
| Memory | 1000 ÷ 5000 cells of memory on the sensor |
| Radio Power | −12 ÷ 3 [dBm] |
| Measurement Interval | 1 ÷ 1800 [s] |
The SLU Sensor device will be mounted inside reusable containers such as Iceboxes or transport bins. In real-world conditions, the SLU Sensor will operate in relatively unfavorable environmental conditions for electronics, including high humidity and a wide temperature range. Additionally, these reusable containers undergo periodic disinfection and cleaning procedures using detergents and pressure washers. The specific working environment for SLU Sensor devices necessitates the design of a dedicated enclosure, with construction and materials that guarantee the device’s durability.
In BLE technology, data exchange occurs in the following two modes: active and passive. SKK Smart Logistics Unit utilizes both modes for data transmission with the receiving device.
In the case of the broadcast mode, called Advertisement, these devices do not use any popular beacon-type protocol standards. Instead, a custom standard was designed that uses BLE mechanisms to transmit measurement data and additional information required by the system. Dedicated BLE protocol-defined services were not used. As a result, some universal scanners may report errors or provide incomplete encoded data from the SKK SLU Sensor.
There are currently many popular data encoding standards for Beacon Advertisement, which define appropriate values and positions in the broadcasted byte array. The most commonly used ones are presented in the diagram—Figure A1.
Figure A1.
BLE Standards [33].
Figure A1.
BLE Standards [33].
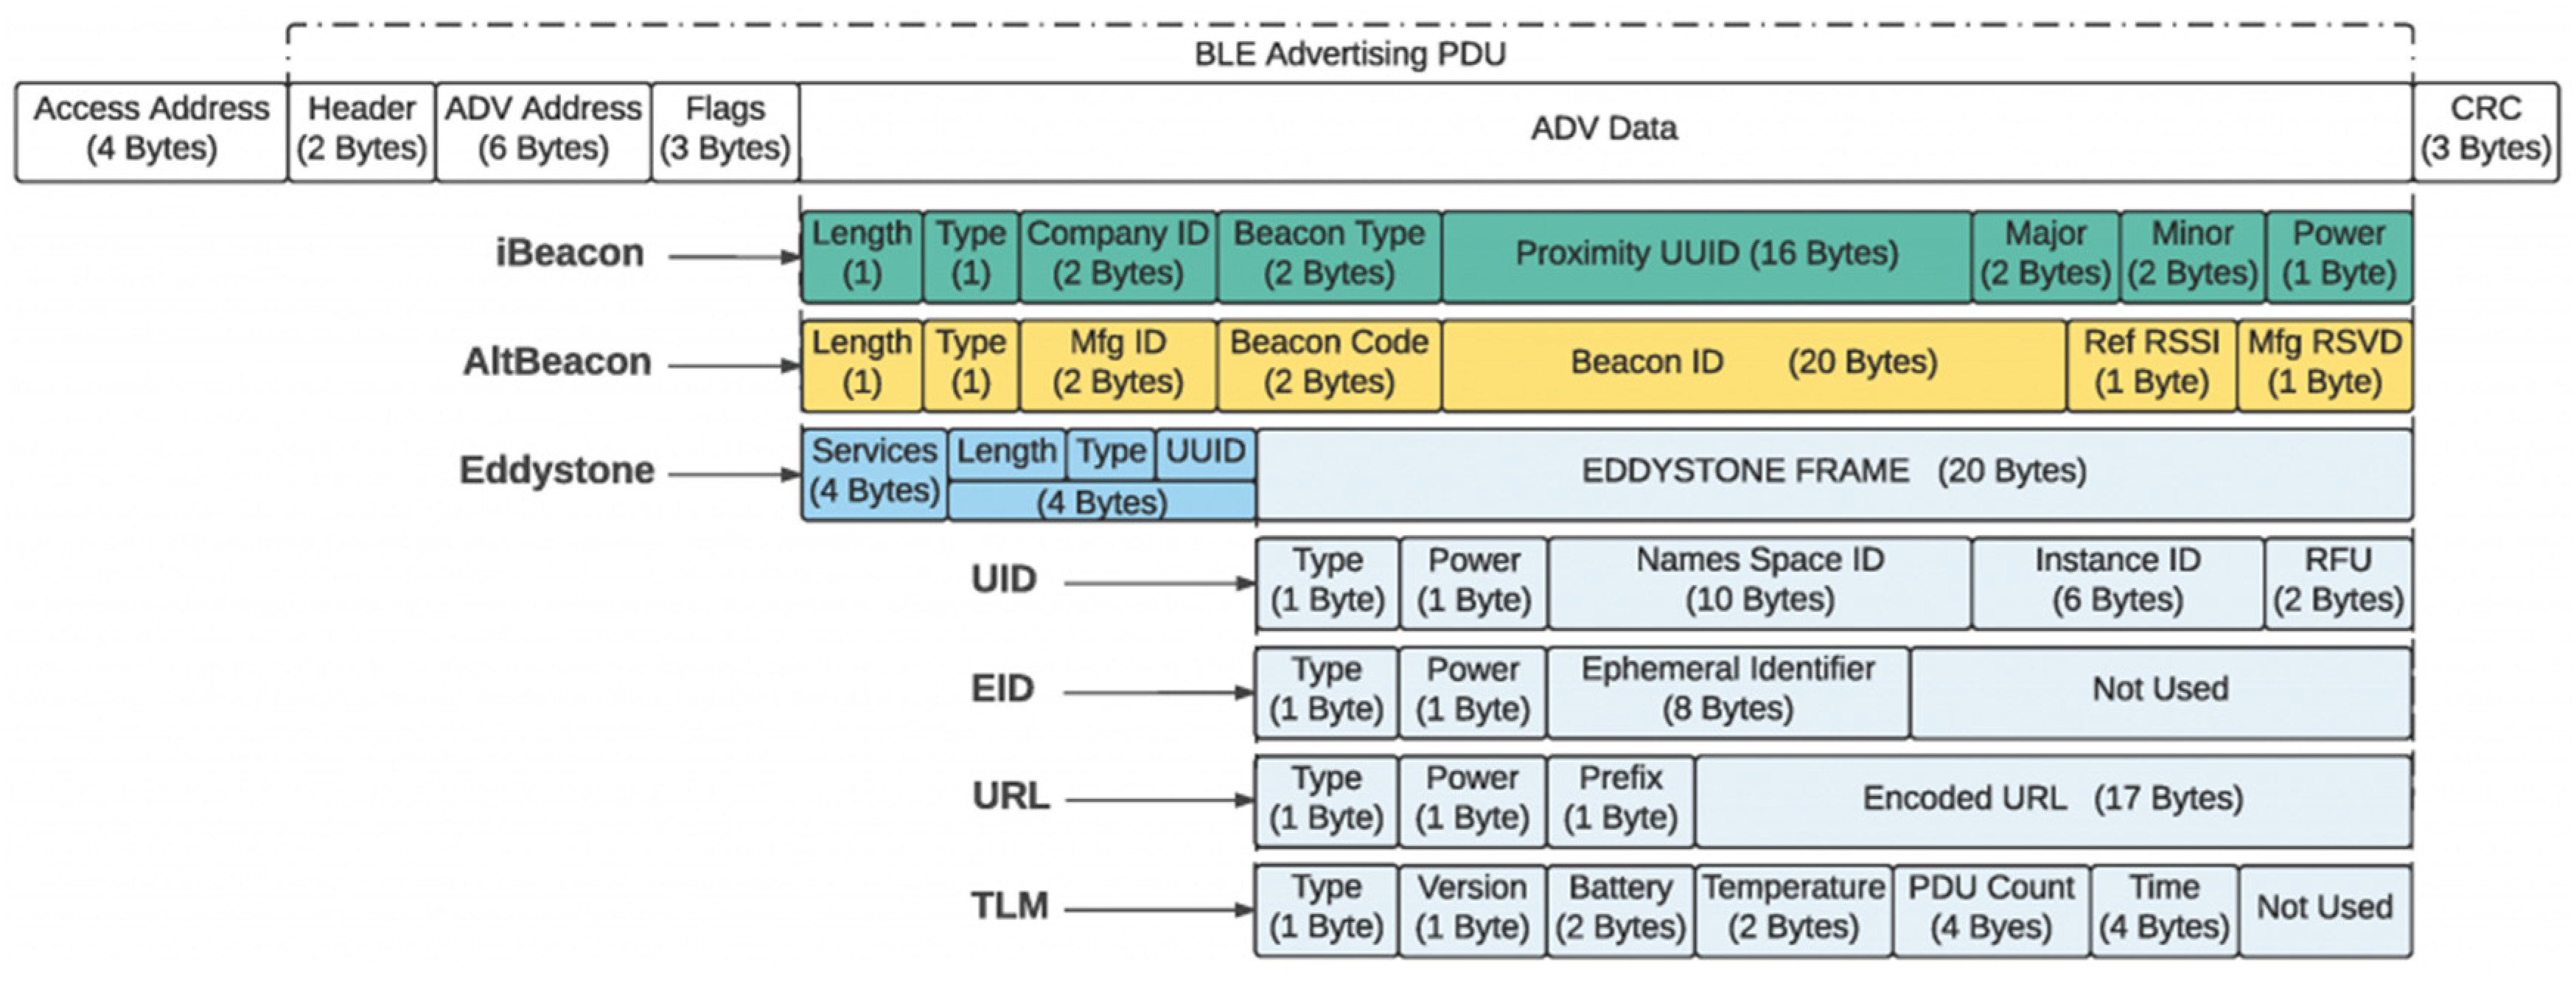
Each BLE device typically has a profile that includes service groups composed of characteristics. Services are described and defined in the Bluetooth Low Energy specification in the GATT (General Attribute Profile) section. They constitute the protocol and framework for data exchange between two devices in this standard.
The SKK SLU Sensor profile consists of the SLU Service, which enables the following operations through appropriate characteristics and data encoding:
- Changing sensor operation parameters (activating sensors, changing measurement intervals);
- Controlling the transmission of sensor measurement data;
- Managing the transmission of the current sensor configuration.
Additionally, the manufacturer’s module CC2640R2F service is used, allowing remote programming of the device. The profile also includes a standard profile describing basic device information, such as hardware or software version, as shown in the table below.
- Data collections—Server
The Hive Server is a distributed application that runs in a Docker environment. It includes microservices designated to manage Hive Sensors and Hive Gateway devices and to collect, store, and manage measurement data received from Hive Gateway devices. The application allows the following:
- Saving measurement data in real-time;
- Access to historical data;
- Tracking Hive Sensor location;
- Measurement and technical data visualization;
- the possibility of creating designated dashboards;
- Management of the Hive Sensor;
- Access and management of Hive Gateway devices;
- Configuration of system actions (e.g., an alert) after meeting defined conditions;
- Exporting measurement data to an external database or other data source;
- Provide data for external software to integrate with other Big Data solutions.
- Hive Web
The Hive Web is a web application module allowing for real-time browsing and historical measurement data from Hive Sensors stored in the Hive Sensors system including the following:
- The possibility to create customizable dashboards;
- Visualization of temperature, light, humidity, and acceleration measurements in graph and table form for the selected Hive Sensor for the last 7 days with information about the minimum, maximum and average value for a given time range;
- Real-time value for selected sensors;
- Information about the last known location of the Hive Sensor;
- Information about the number of sensors within the range of a given Hive Gateway device;
- List of Hive Sensors with the date of adding to the system and the date of the last update.
Appendix B. ATP Agreement
ATP Agreement—Agreement on the International Carriage of Perishable Foodstuffs and on the Special Equipment to be Used for Such Carriage (ATP), signed in Geneva on 1 September 1970. The agreement is applied if the loading and unloading locations of the cargo are in two different countries and the unloading location is within the territory of one of the parties to the agreement.
The ATP Agreement is applied to every carriage of the following:
- Deep-frozen or frozen foodstuffs;
- Foodstuffs, even if they are not deep-frozen or frozen.
Frozen products should be transported and stored at temperatures not exceeding:
- Frozen or deep-frozen cream and fruit juice concentrates: −20 °C;
- Frozen and deep-frozen fish, fish products, mollusks, and crustaceans, as well as all other frozen and deep-frozen foodstuffs: −18 °C;
- Any other deep-frozen foodstuffs: −18 °C;
- Frozen butter and other fats: −14 °C;
- Frozen offal, egg yolks, poultry, and game: −12 °C;
- Frozen meat: −10 °C;
- Ice cream: −20 °C;
- Butter: −10 °C;
- All other frozen foodstuffs (except butter): −12 °C.
Fresh products should be transported and stored at temperatures not exceeding, depending on the type as follows:
- Butter: +6 °C;
- Milk in tankers (raw or pasteurized) for direct consumption: +4 °C;
- Industrial milk: +6 °C;
- Dairy products (yogurt yoghurt, kefirs, cream, and curd cheese): +4 °C;
- Fish (should always be transported on ice): +2 °C;
- Ready meat products: +6 °C;
- Meat (excluding offal): +7 °C;
- Poultry and rabbits: +4 °C.
References
- Keener, L.; Jerry, R. The Squeaky Wheel: Is Transportation the Watershed for Food Safety and Food Defense? Available online: https://www.food-safety.com/articles/4426-the-squeaky-wheel-is-transporation-the-watershed-for-food-safety-and-food-defense (accessed on 16 October 2023).
- Maksimović, M.; Vujović, V.; Omanović-Mikličanin, E. A Low Cost Internet of Things Solution for Traceability and Monitoring Food Safety During Transportation. In Proceedings of the 7th International Conference on Information and Communication Technologies in Agriculture, Food and Environment, Kavala, Greece, 17–20 September 2015. [Google Scholar]
- Zhang, H.; Sun, X.; Liu, Y. Food Safety and Technological Implications of Food Traceability Systems. In IFIP Advances in Information and Communication Technology, Proceedings of the CCTA 2010: Computer and Computing Technologies in Agriculture IV, Nanchang, China, 22–25 October 2010; Springer: Berlin/Heidelberg, Germany, 2011; Volume 345, pp. 1–10. [Google Scholar]
- Zhang, Y.; Chen, B.; Lu, X. Intelligent Monitoring System on Refrigerator Trucks Based on the Internet of Things. In Lecture Notes of the Institute for Computer Sciences, Social Informatics and Telecommunications Engineering, Proceedings of the ICWCA 2011: Wireless Communications and Applications, Sanya, China, 1–3 August 2011; Springer: Berlin/Heidelberg, Germany, 2012; Volume 72, pp. 201–206. [Google Scholar]
- Vinodini Ramesh, M.; Narayanadas, R. A Public Transport System Based Sensor Network for Fake Alcohol Detection. In Lecture Notes of the Institute for Computer Sciences, Social Informatics and Telecommunications Engineering, Proceedings of the ICWCA 2011: Wireless Communications and Applications, Sanya, China, 1–3 August 2011; Springer: Berlin/Heidelberg, Germany, 2012; Volume 72. [Google Scholar]
- Fangchun, Y.; Wang, S.; Li, J.; Liu, Z.; Sun, Q. An Overview of Internet of Vehicles. Commun. China 2014, 11, 1–15. [Google Scholar] [CrossRef]
- Hopper, L.; Womble, P.; Moore, R.; Paschal, J.; Payne, F.; Thompson, C.; Crist, W.; Luck, B.; Tabayehnejab, N.; Stombaugh, T.; et al. A Wireless Electronic Monitoring System for Securing Milk from Farm to Processor. In Proceedings of the 2008 IEEE Conference on Technologies for Homeland Security, Waltham, MA, USA, 12–13 May 2008; pp. 525–529. [Google Scholar]
- Martins, F.; Lopes, L.; Paulino, H. Sensor Systems and Software: Third International ICST Conference, S-Cube 2012, Lisbon, Portugal, June 4–5, 2012, Revised Selected Papers; Springer: Berlin/Heidelberg, Germany, 2012; ISBN 978-3-642-32777-3. [Google Scholar]
- Taj, S.; Imran, A.S.; Kastrati, Z.; Daudpota, S.M.; Memon, R.A.; Ahmed, J. IoT-Based Supply Chain Management: A Systematic Literature Review. Internet Things 2023, 24, 100982. [Google Scholar] [CrossRef]
- Ryan, J.M. Guide to Food Safety and Quality during Transportation; Elsevier: Amsterdam, The Netherlands, 2017. [Google Scholar]
- Badia-Melis, R.; Mc Carthy, U.; Ruiz-Garcia, L.; Garcia-Hierro, J.; Robla Villalba, J.I. New Trends in Cold Chain Monitoring Applications—A Review. Food Control 2018, 86, 170–182. [Google Scholar] [CrossRef]
- Ndraha, N.; Hsiao, H.-I.; Vlajic, J.; Yang, M.-F.; Lin, H.-T.V. Time-Temperature Abuse in the Food Cold Chain: Review of Issues, Challenges, and Recommendations. Food Control 2018, 89, 12–21. [Google Scholar] [CrossRef]
- Wang, J.; Yue, H. Food Safety Pre-Warning System Based on Data Mining for a Sustainable Food Supply Chain. Food Control 2017, 73, 223–229. [Google Scholar] [CrossRef]
- Pratap, S.; Jauhar, S.K.; Gunasekaran, A.; Kamble, S.S. Optimizing the IoT and Big Data Embedded Smart Supply Chains for Sustainable Performance. Comput. Ind. Eng. 2024, 187, 109828. [Google Scholar] [CrossRef]
- Gajewska, T.; Grigoroudis, E. Estimating the Performance of the Logistics Services Attributes Influencing Customer Satisfaction in the Field of Refrigerated Transport. Int. J. Shipp. Transp. Logist. 2017, 9, 540–561. [Google Scholar] [CrossRef]
- Gajewska, T.; Lorenc, A. The Impact of Trailer Conditions on the Quality of Refrigerated Food Transport Services—A Case Study. Transp. Probl. 2019, 14, 97–107. [Google Scholar] [CrossRef]
- Jamme, H.-T.; Connor, D.S. Diffusion of the Internet-of-Things (IoT): A Framework Based on Smart Retail Technology. Appl. Geogr. 2023, 161, 103122. [Google Scholar] [CrossRef]
- Xia, J.; Huang, W.; Wang, X.; Zhu, Z.; Zhang, M.; Zhang, X. Flexible Sensing Technology for Fruit Quality Control in the Cold Chain: Characterization, Application, and Improvement. Food Control 2023, 154, 109976. [Google Scholar] [CrossRef]
- Zhang, L.; Zhang, M.; Law, C.L.; Ma, Y. Effect of Vibration and Broken Cold Chain on the Evolution of Cell Wall Polysaccharides during Fruit Cucumber (Cucumis sativus L.) Shriveling Under Simulated Transportation. Food Packag. Shelf Life 2023, 38, 101126. [Google Scholar] [CrossRef]
- Xiang, B.; Zhang, X. Advancements in the Development of Field Precooling of Fruits and Vegetables with/without Phase Change Materials. J. Energy Storage 2023, 73, 109007. [Google Scholar] [CrossRef]
- Liu, Z.; Guo, H.; Zhao, Y.; Hu, B.; Shi, L.; Lang, L.; Huang, B. Research on the Optimized Route of Cold Chain Logistics Transportation of Fresh Products in Context of Energy-Saving and Emission Reduction. Math. Biosci. Eng. 2021, 18, 1926–1940. [Google Scholar] [CrossRef] [PubMed]
- Patel, A.S.; Brahmbhatt, M.N.; Bariya, A.R.; Nayak, J.B.; Singh, V.K. Blockchain Technology in Food Safety and Traceability Concern to Livestock Products. Heliyon 2023, 9, e16526. [Google Scholar] [CrossRef] [PubMed]
- Bai, Y.; Wu, H.; Huang, M.; Luo, J.; Yang, Z. How to Build a Cold Chain Supply Chain System for Fresh Agricultural Products through Blockchain Technology—A Study of Tripartite Evolutionary Game Theory Based on Prospect Theory. PLoS ONE 2023, 18, e0294520. [Google Scholar] [CrossRef] [PubMed]
- Liu, S.; Yu, Z. Modeling and Efficiency Analysis of Blockchain Agriculture Products E-Commerce Cold Chain Traceability System Based on Petri Net. Heliyon 2023, 9, e21302. [Google Scholar] [CrossRef] [PubMed]
- Liu, C.; Hou, P. Dynamic Modelling of Cold Chain Logistics Services under Budget Constraints for the Delivery of Fresh Products in an Urban Area. Appl. Math. Model. 2024, 125, 809–835. [Google Scholar] [CrossRef]
- Wu, W.; Shen, L.; Zhao, Z.; Harish, A.R.; Zhong, R.Y.; Huang, G.Q. Internet of Everything and Digital Twin Enabled Service Platform for Cold Chain Logistics. J. Ind. Inf. Integr. 2023, 33, 100443. [Google Scholar] [CrossRef]
- Hernandez-Cuellar, D. An Stochastic Cold Food Supply Chain (CFSC) Design. In Proceedings of Cyber-Physical Systems and Internet of Things Week 2023; ACM: New York, NY, USA, 2023; pp. 391–394. [Google Scholar]
- Xu, B.; Sun, J.; Zhang, Z.; Gu, R. Research on Cold Chain Logistics Transportation Scheme under Complex Conditional Constraints. Sustainability 2023, 15, 8431. [Google Scholar] [CrossRef]
- Yin, X.; Gu, C.; Fan, Z.; Huang, H. Routing Optimization in Distribution of Cold Chain Logistics. In Proceedings of the 2017 10th International Symposium on Computational Intelligence and Design (ISCID), Hangzhou, China, 9–10 December 2017; pp. 171–176. [Google Scholar]
- REN, X.Y. Path Optimization of Cold Chain Distribution with Multiple Distribution Centers Considering Carbon Emissions. Appl. Ecol. Environ. Res. 2019, 17, 9437–9453. [Google Scholar] [CrossRef]
- Xiong, H. Research on Cold Chain Logistics Distribution Route Based on Ant Colony Optimization Algorithm. Discret. Dyn. Nat. Soc. 2021, 2021, 6623563. [Google Scholar] [CrossRef]
- Liu, Y. Design of Dynamic Programming Model for Multi-Objective Cold Chain Logistics Deployment Path Based on Meme Algorithm. Iran. J. Sci. Technol. Trans. Civil. Eng. 2022, 46, 2553–2560. [Google Scholar] [CrossRef]
- Adding an IoT Protocol to Beacons. Available online: https://www.beaconzone.co.uk/blog/adding-an-iot-protocol-to-beacons (accessed on 15 October 2023).
Figure 1.
Technical architecture diagram.
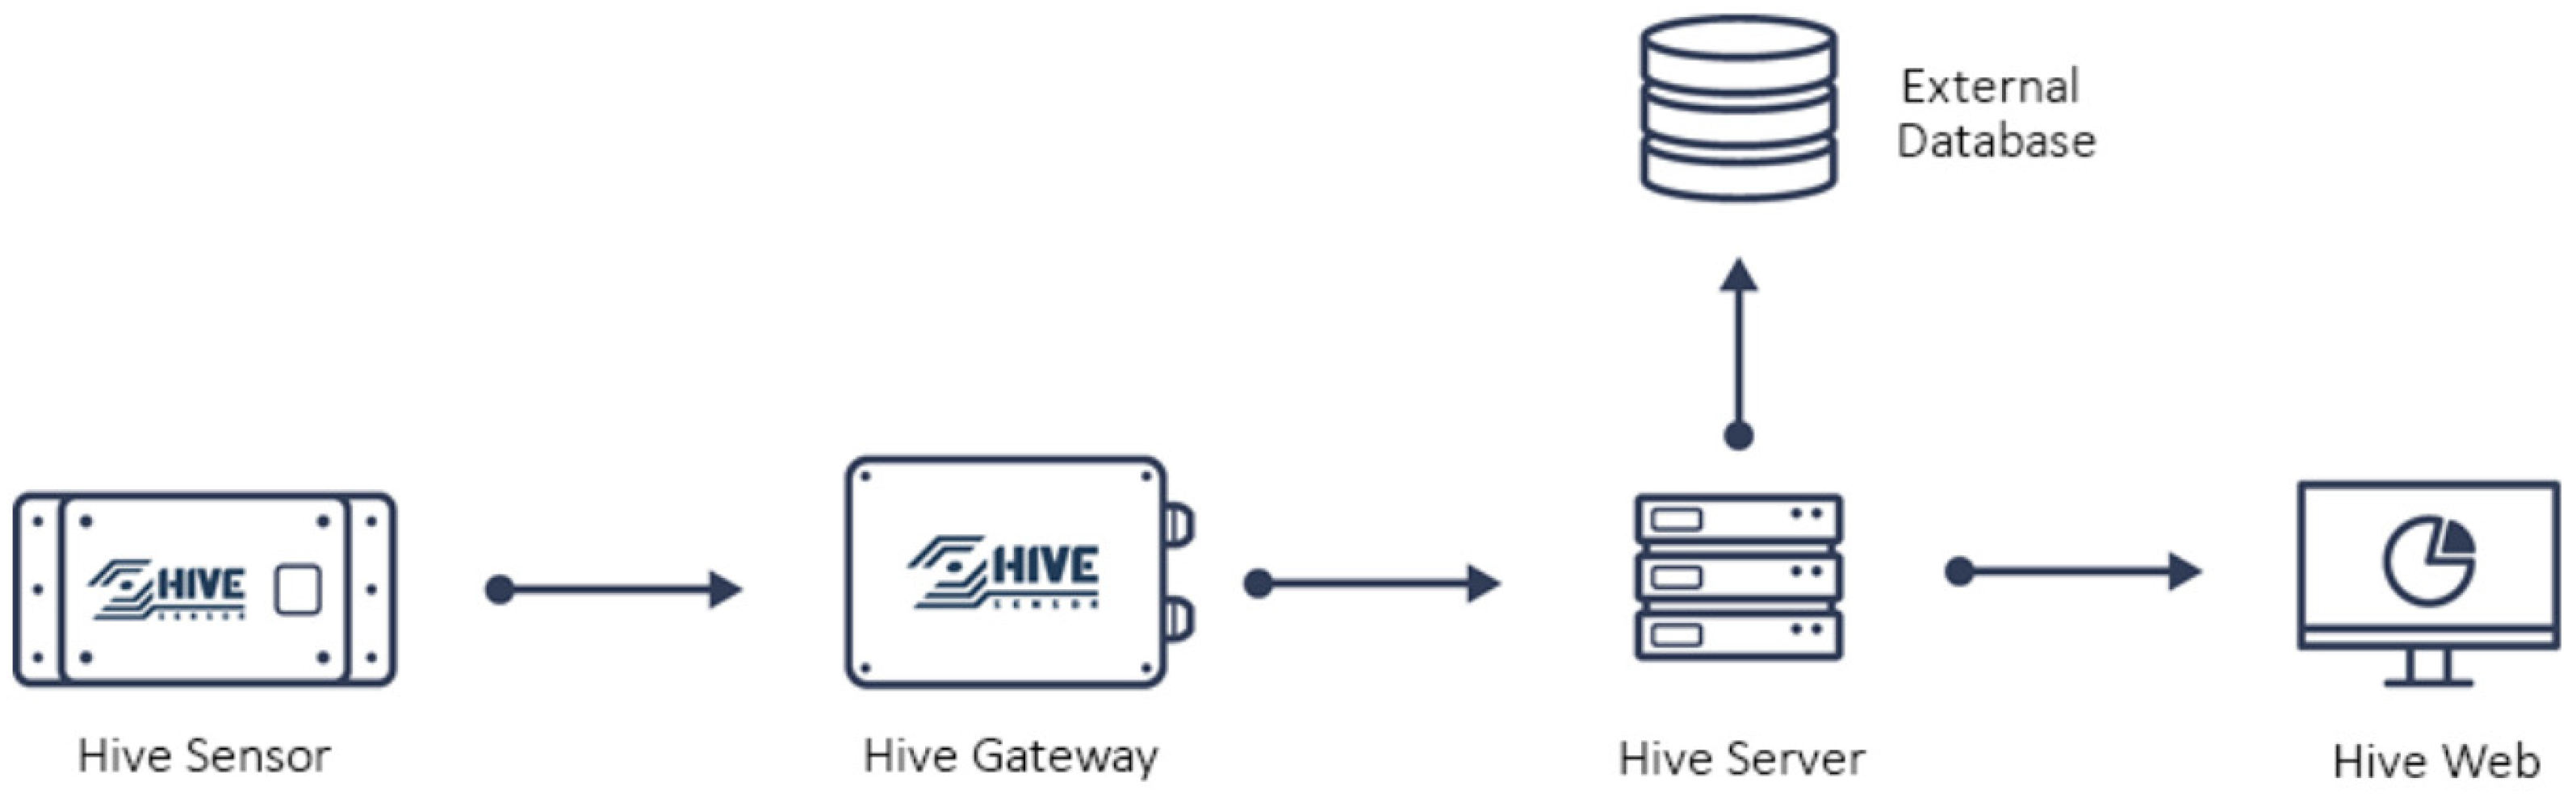
Figure 2.
Diagram of the methodology.
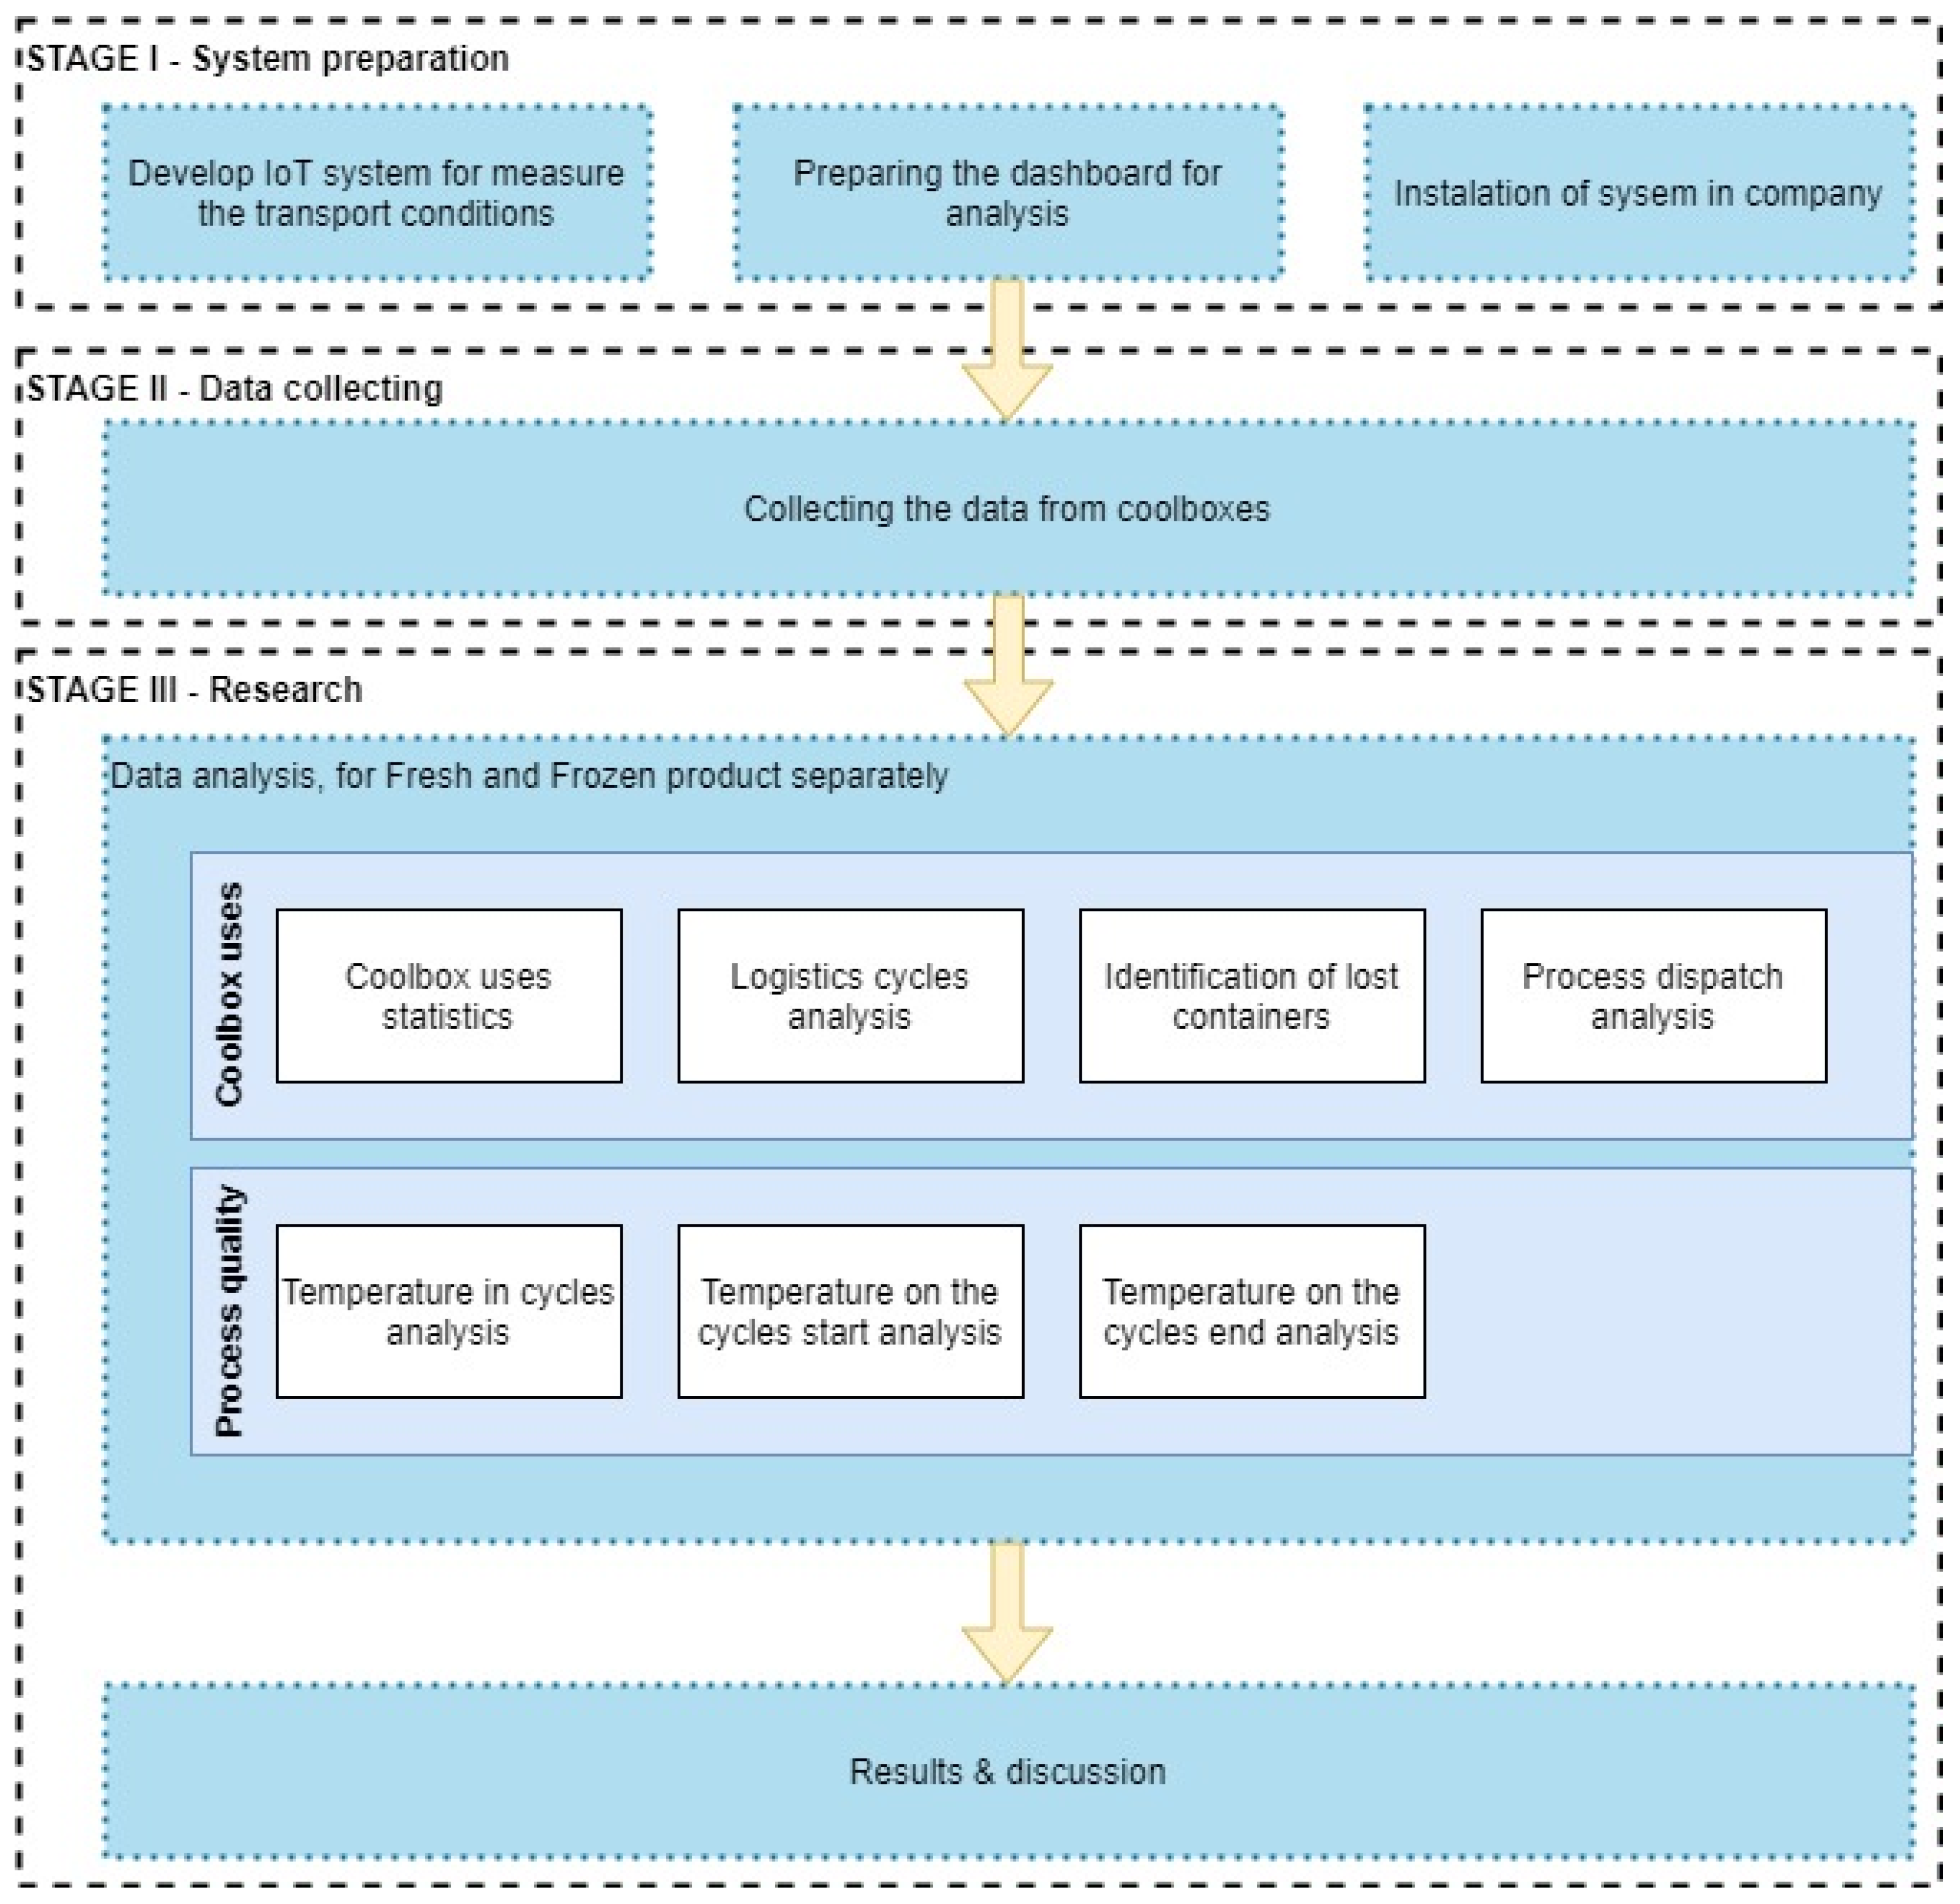
Figure 3.
A general schematic of the logistics cycle.
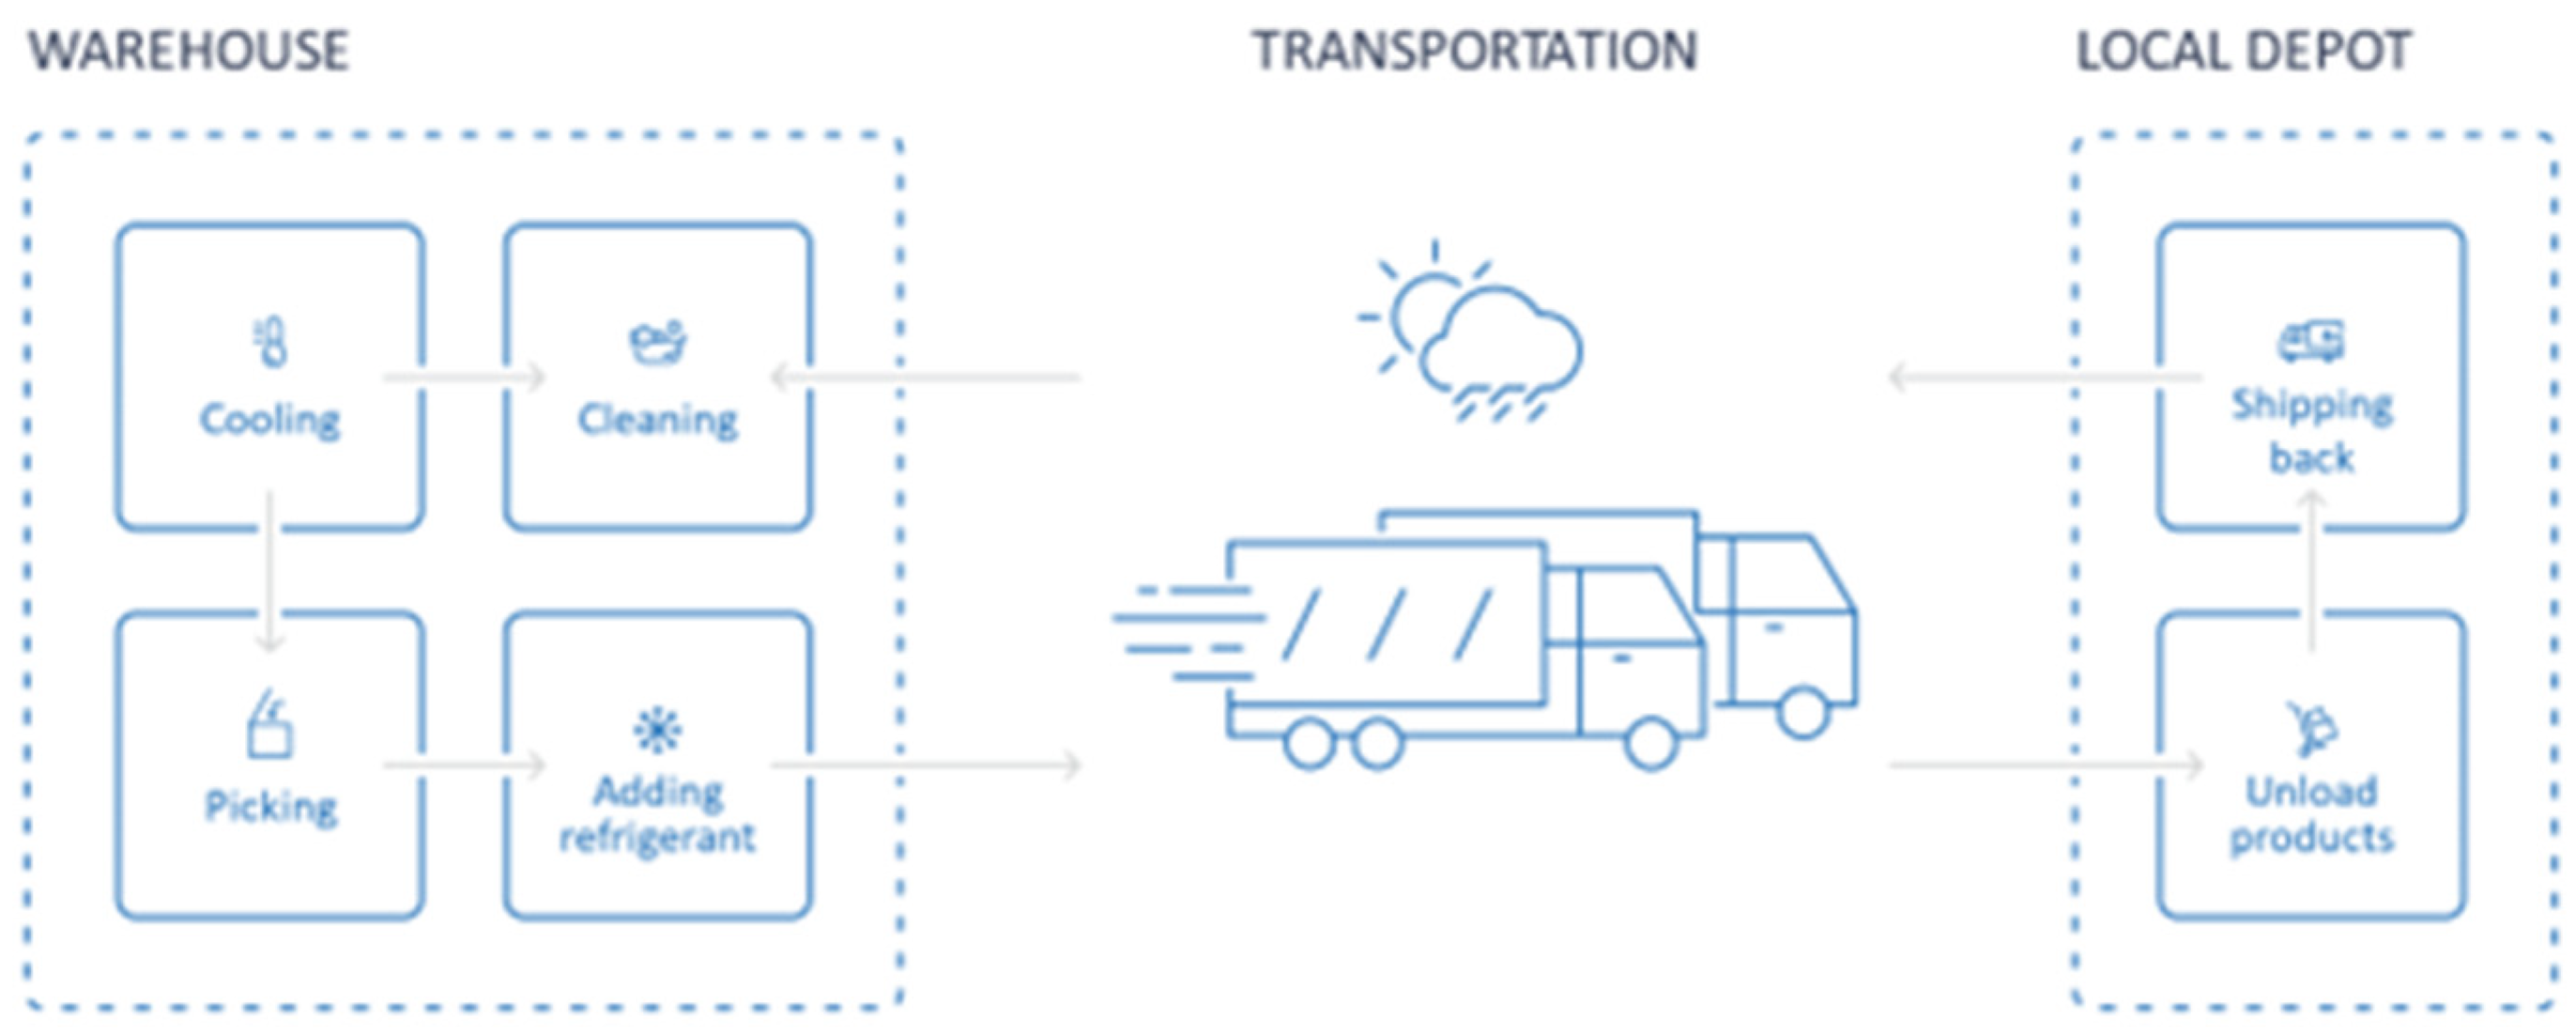
Figure 4.
Container uses statistics—weekly.
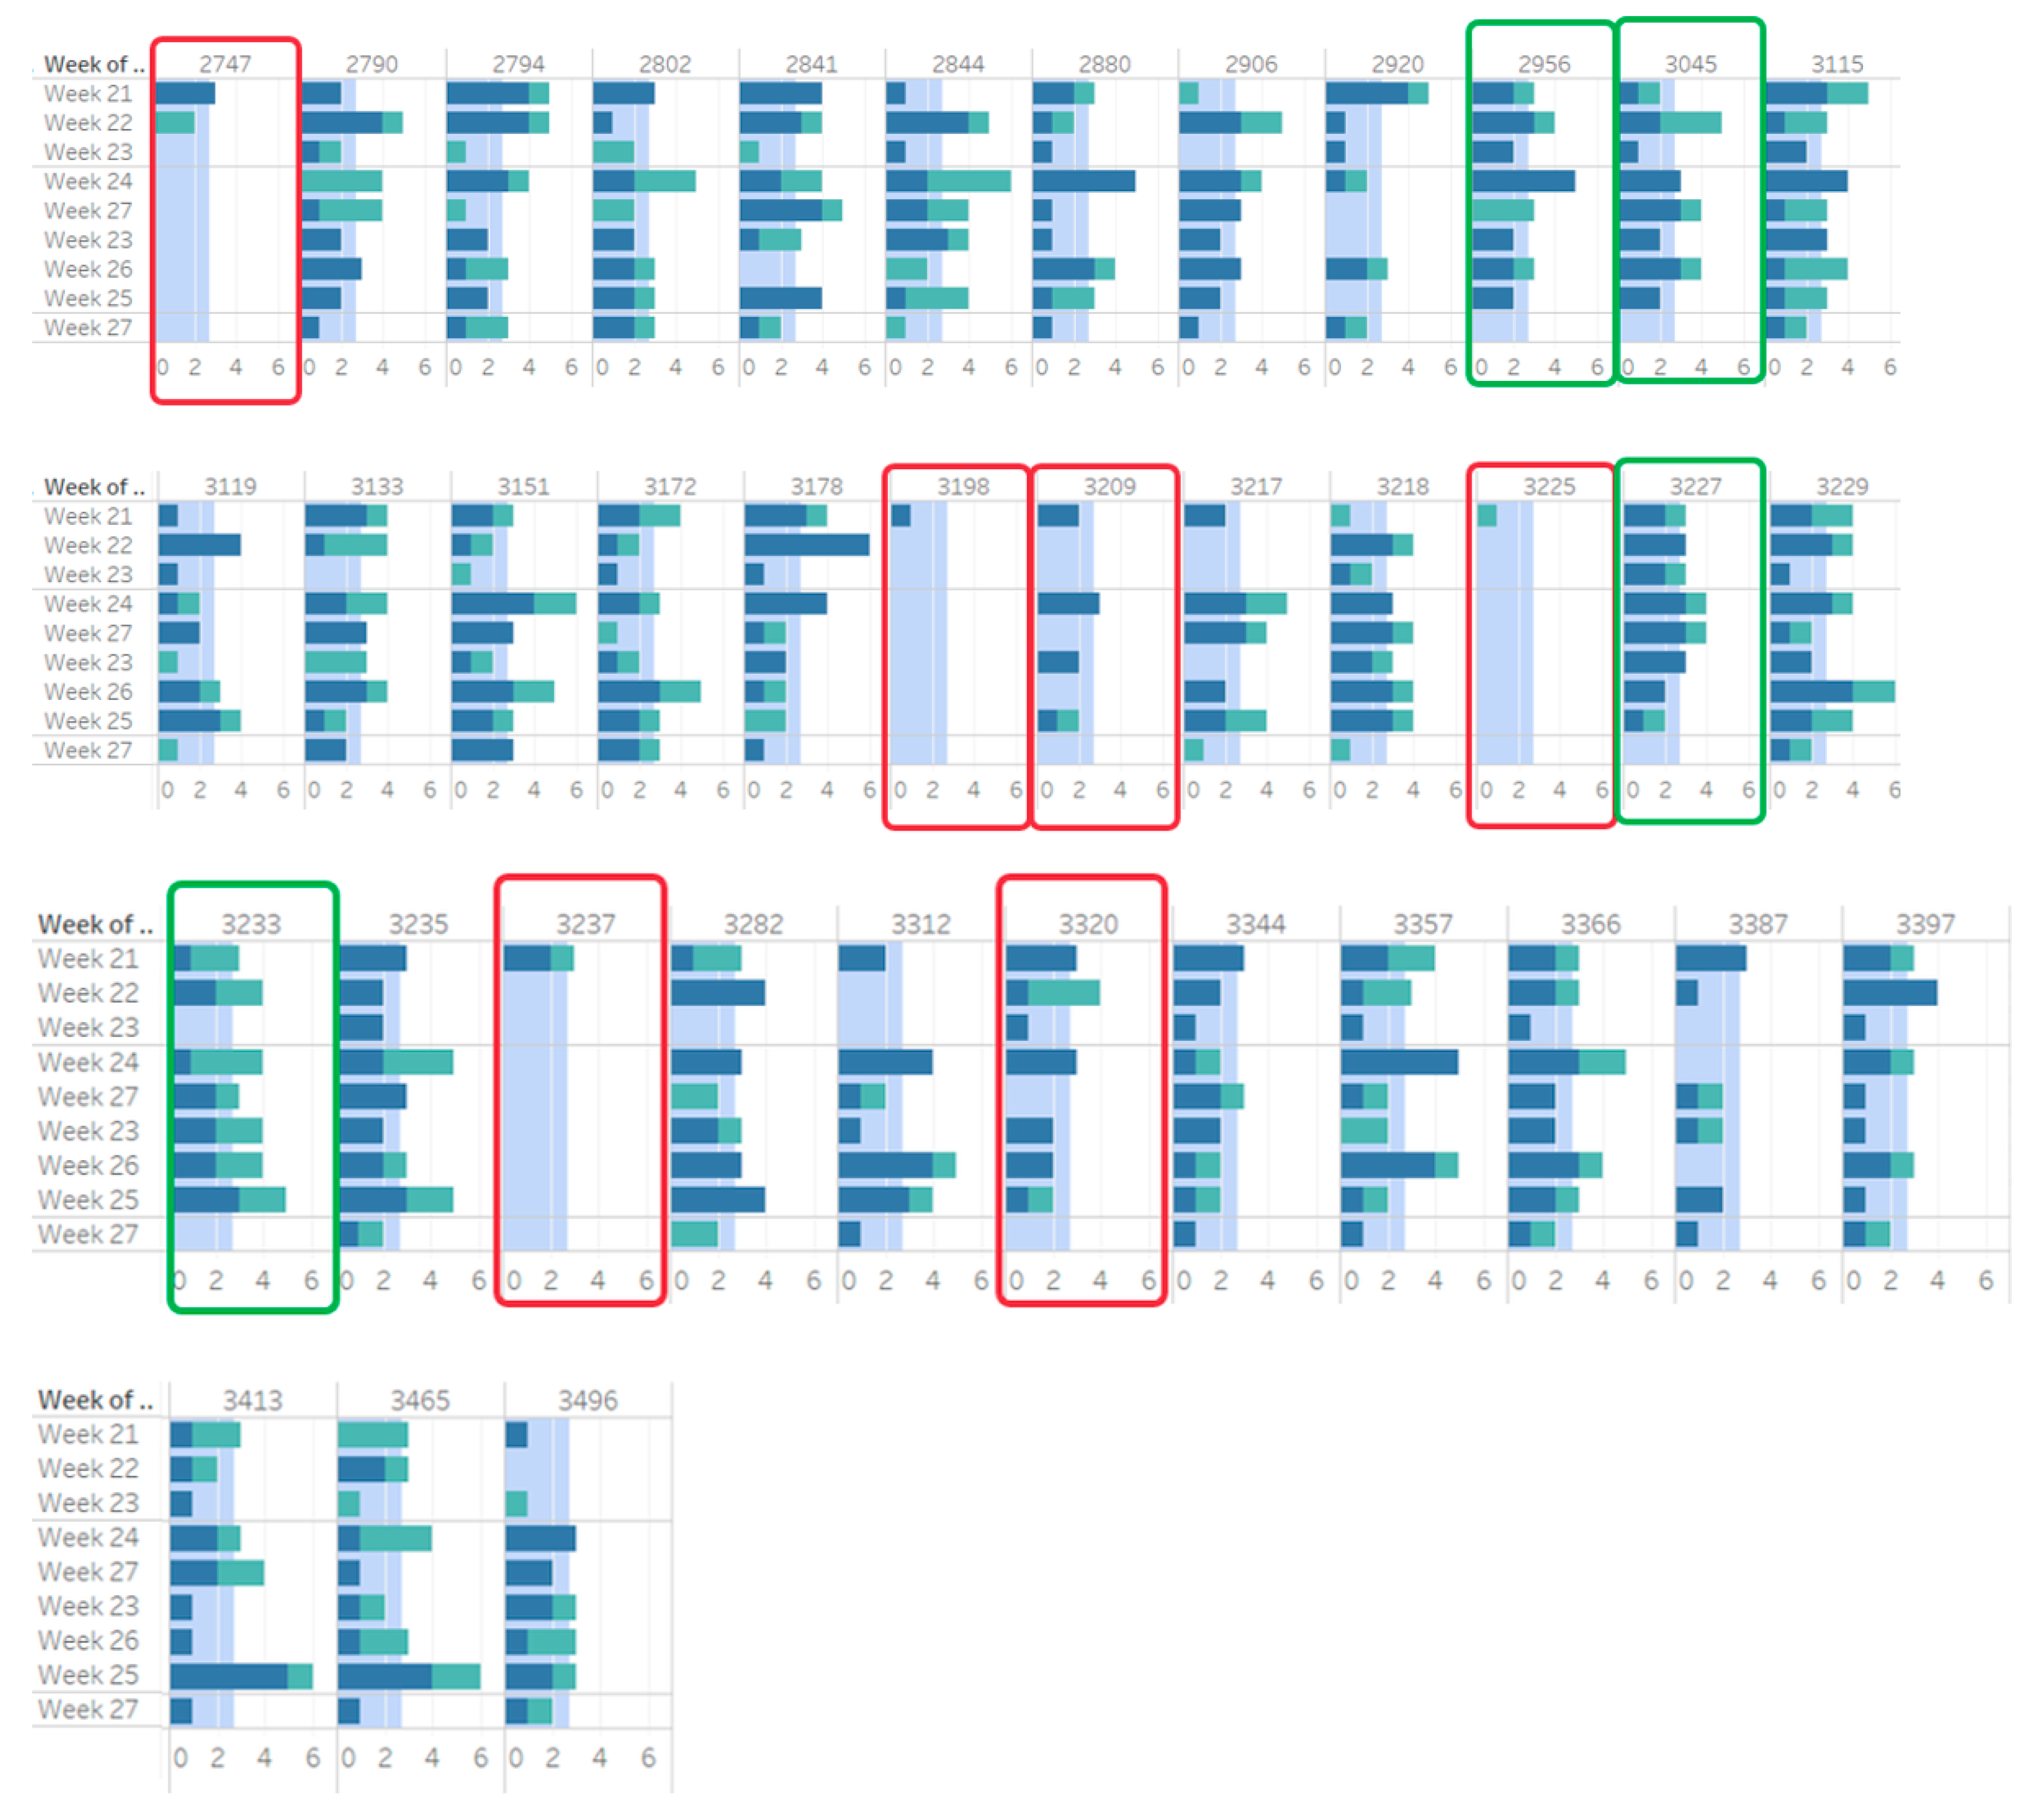
Figure 5.
The average number of cycles on different days of the week (from Monday on the left bar to Sunday on the right bar).
Figure 5.
The average number of cycles on different days of the week (from Monday on the left bar to Sunday on the right bar).

Figure 6.
The duration of logistic cycles.

Figure 7.
Start times of cycles.

Figure 8.
Identification of lost containers.

Figure 9.
Frequency of container use—compared by the most often used.

Figure 10.
Container uses statistics.

Figure 11.
Average temperatures in cycles in a given week—fresh.
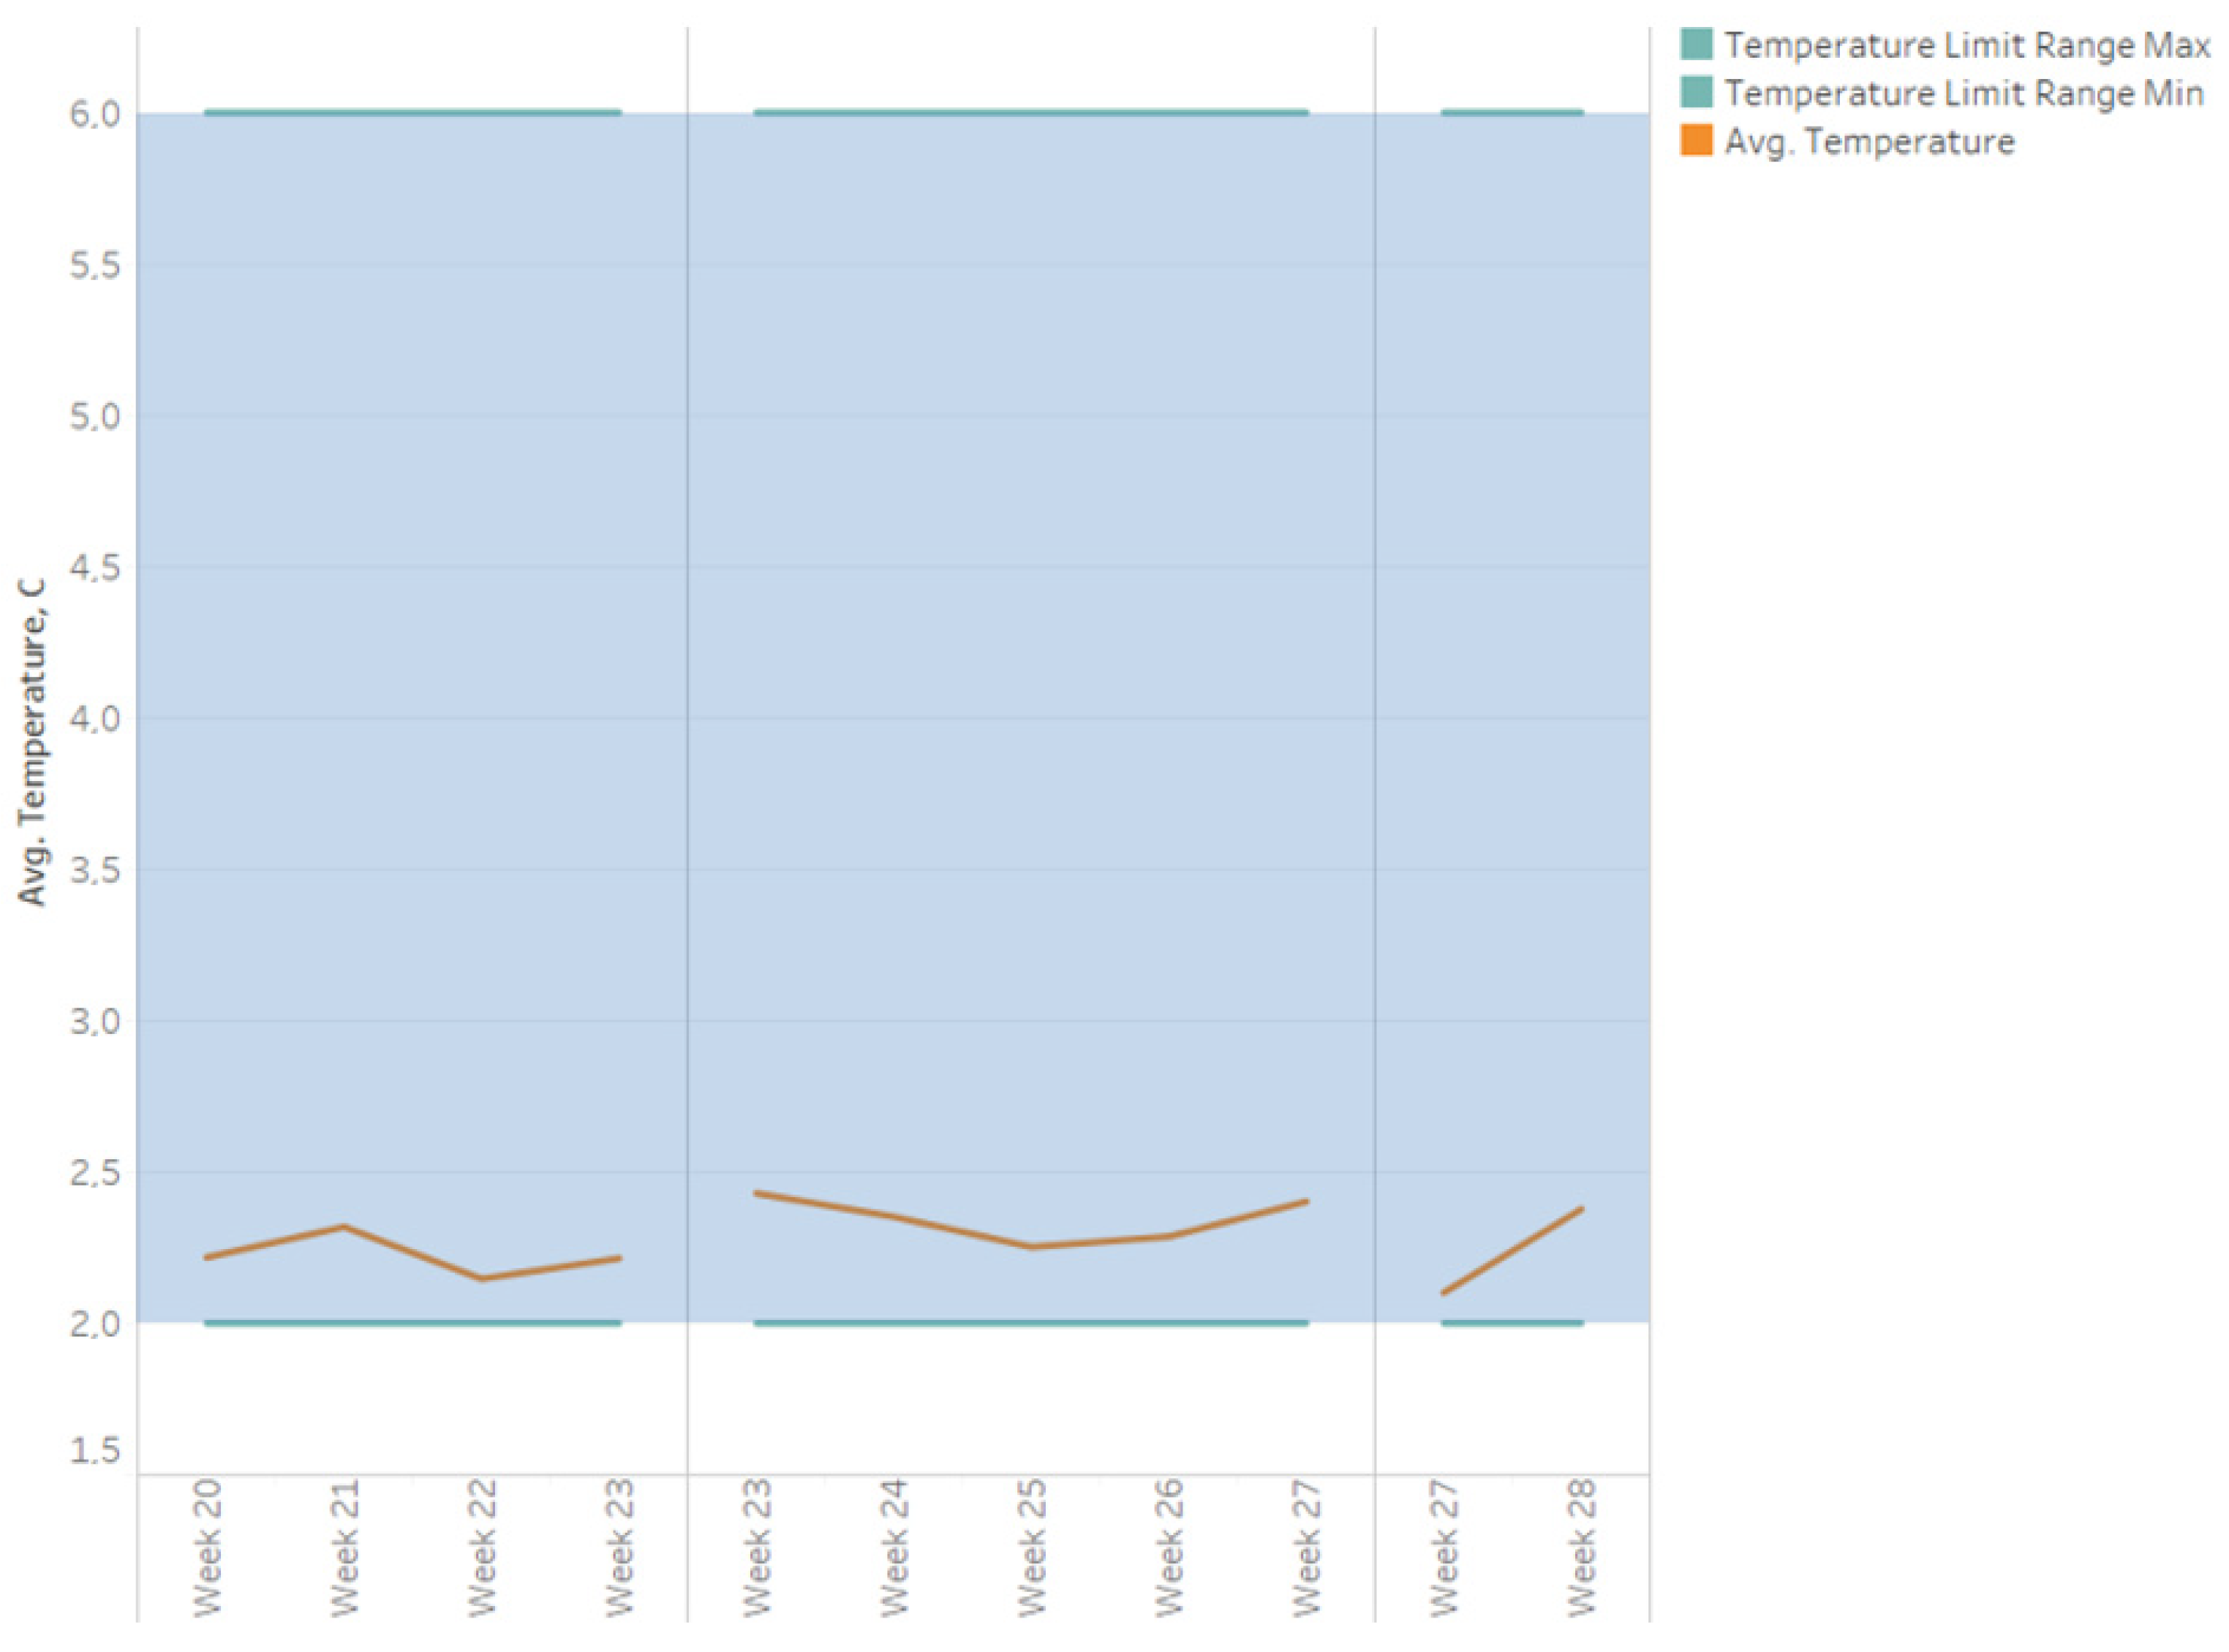
Figure 12.
Temperature distribution in cycles—fresh.
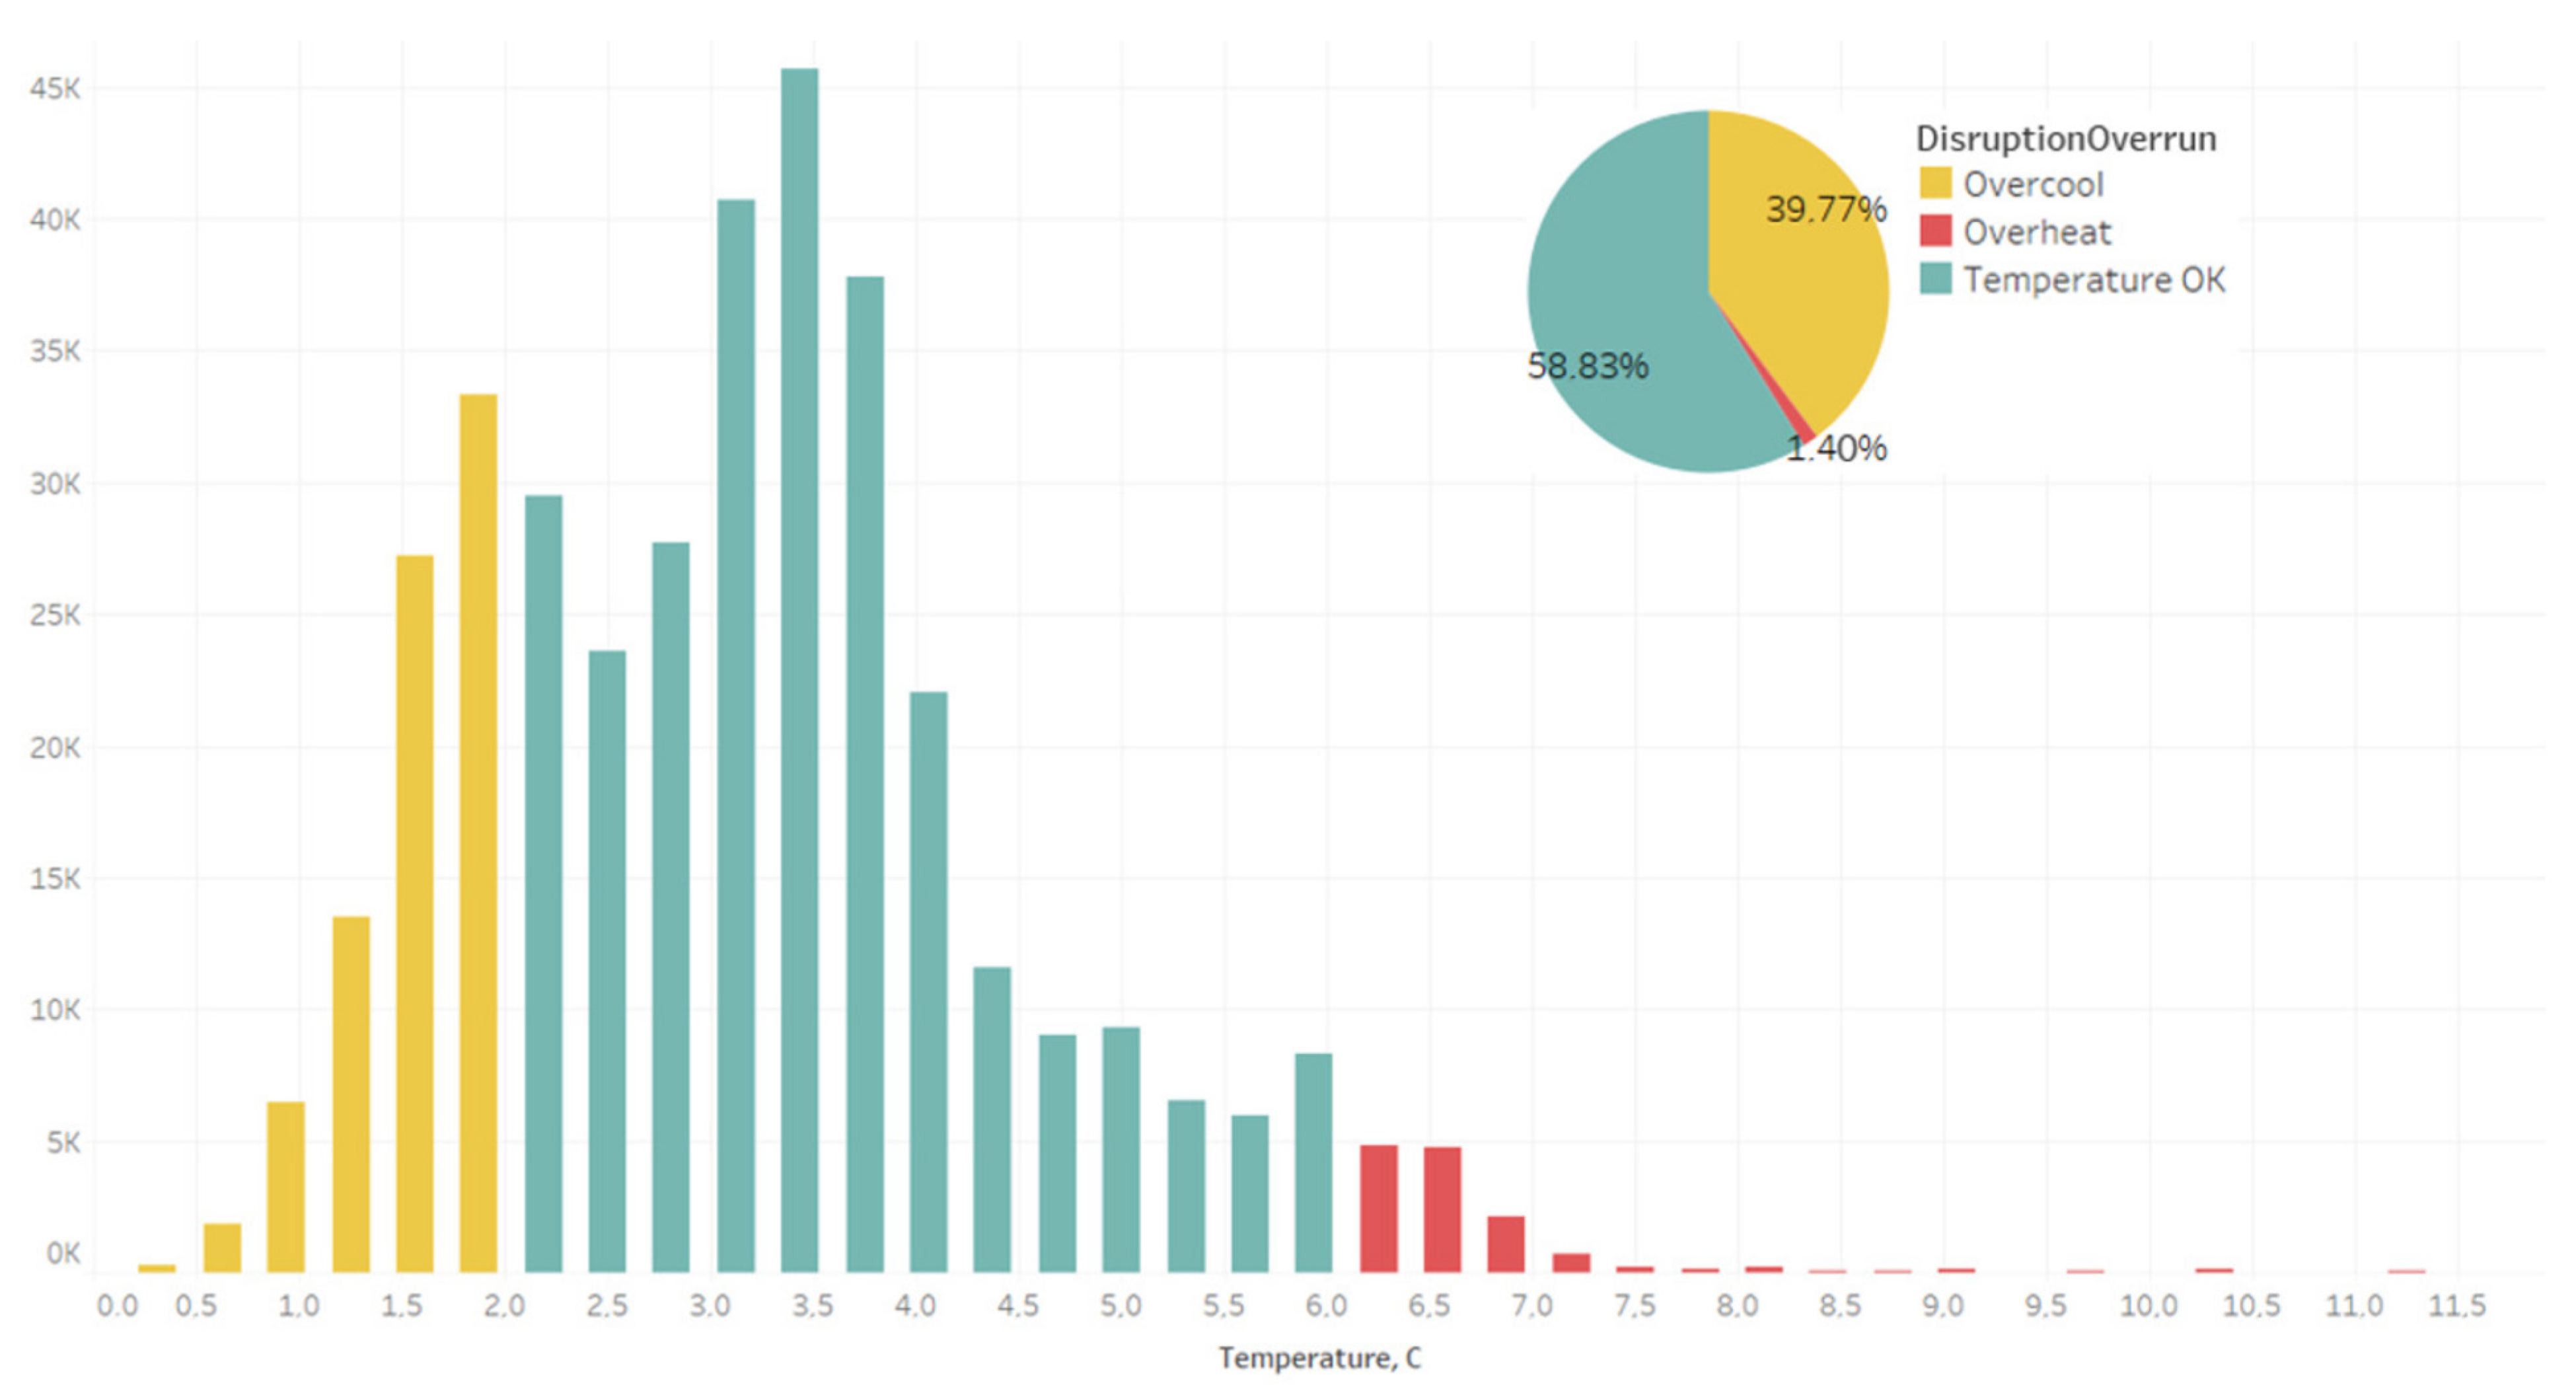
Figure 13.
Temperature distribution at the beginning of the logistic cycle—fresh.
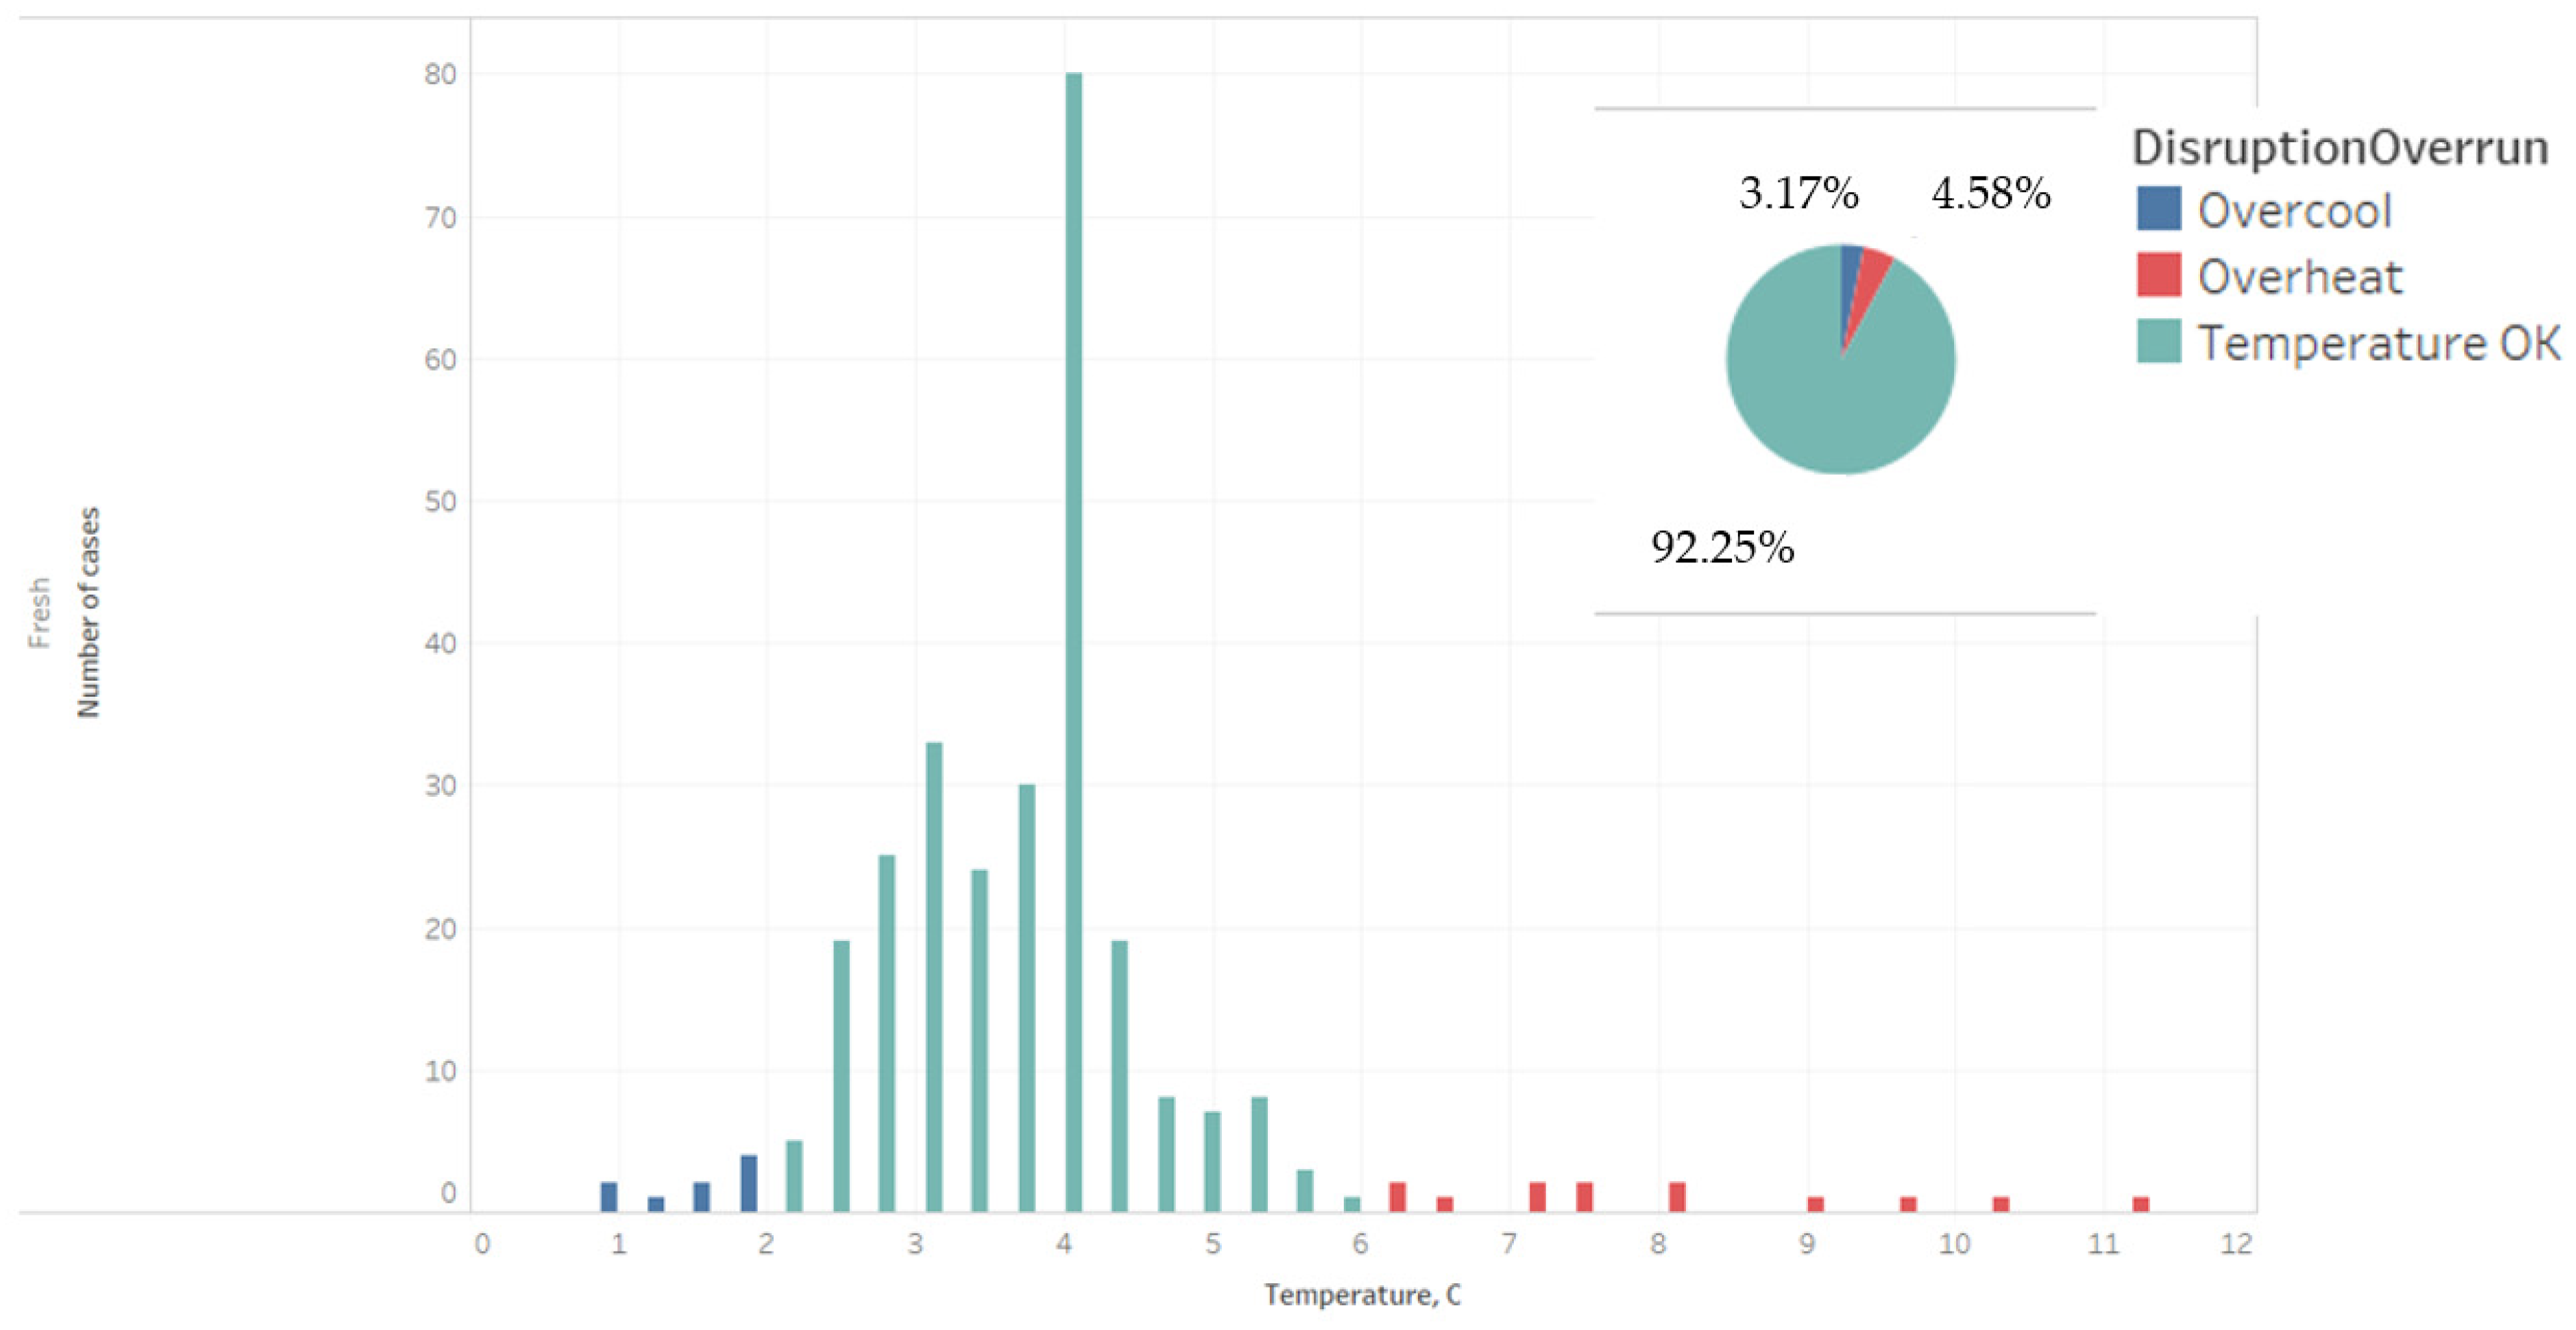
Figure 14.
Temperature distribution at the end of the logistic cycle—fresh.
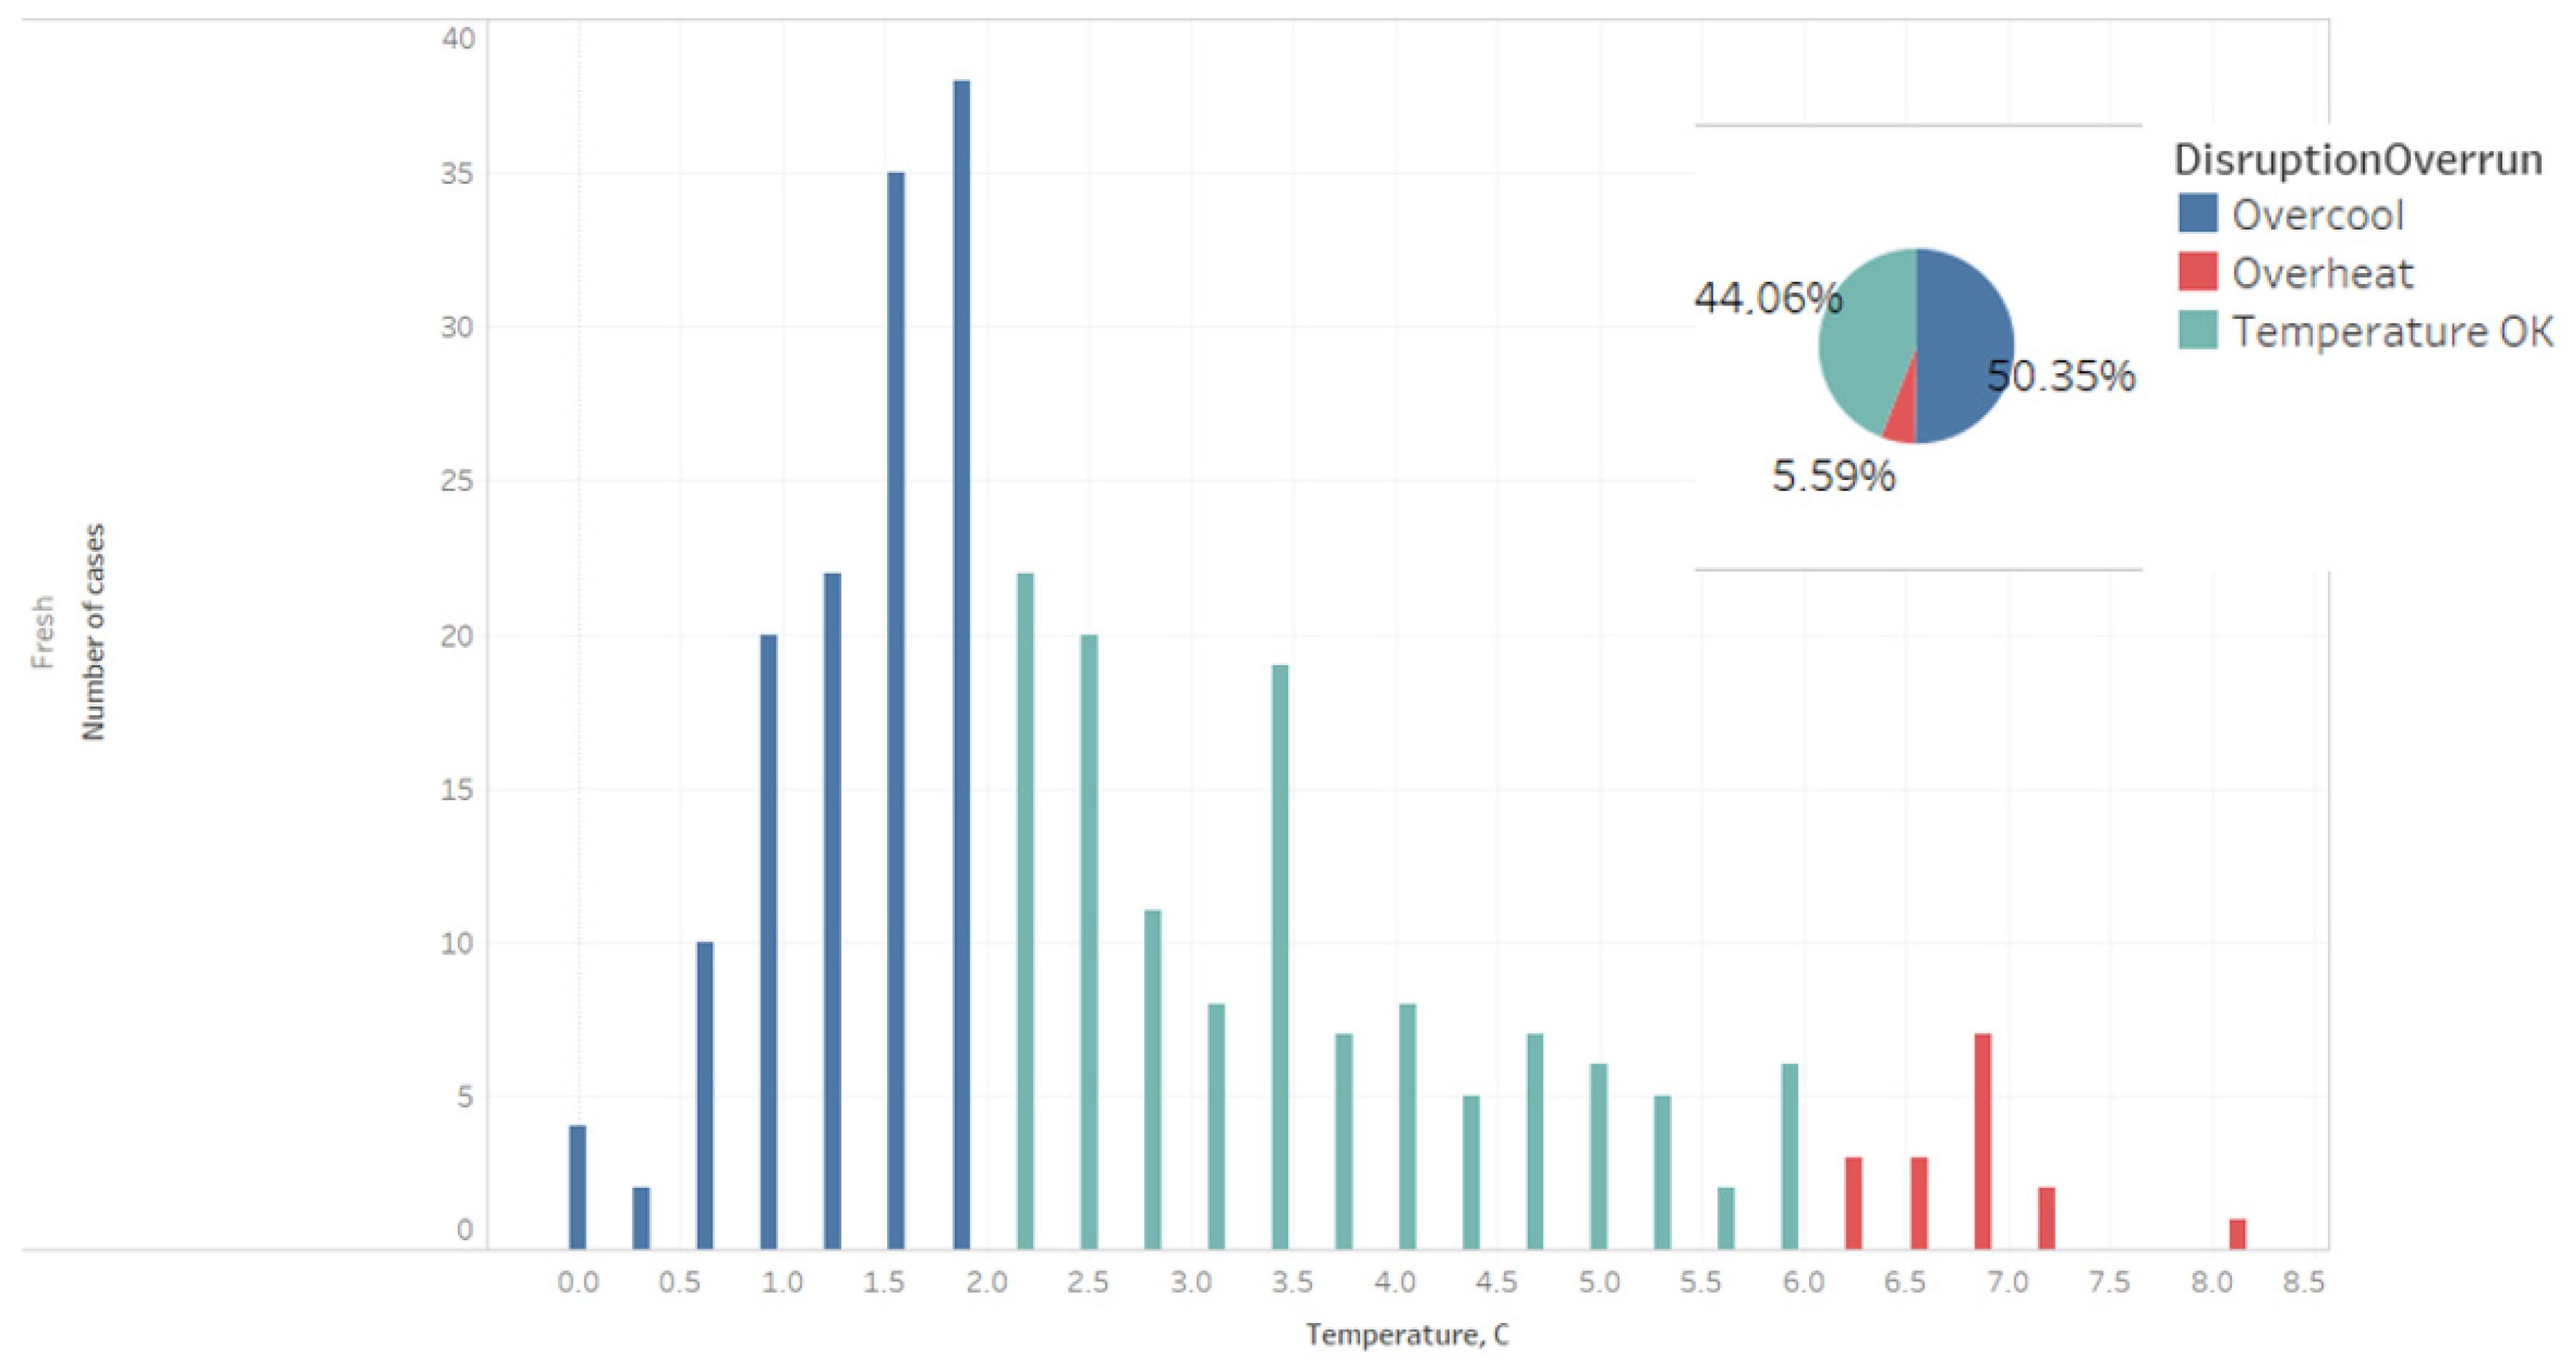
Figure 15.
Average temperatures in cycles for a given week—frozen.
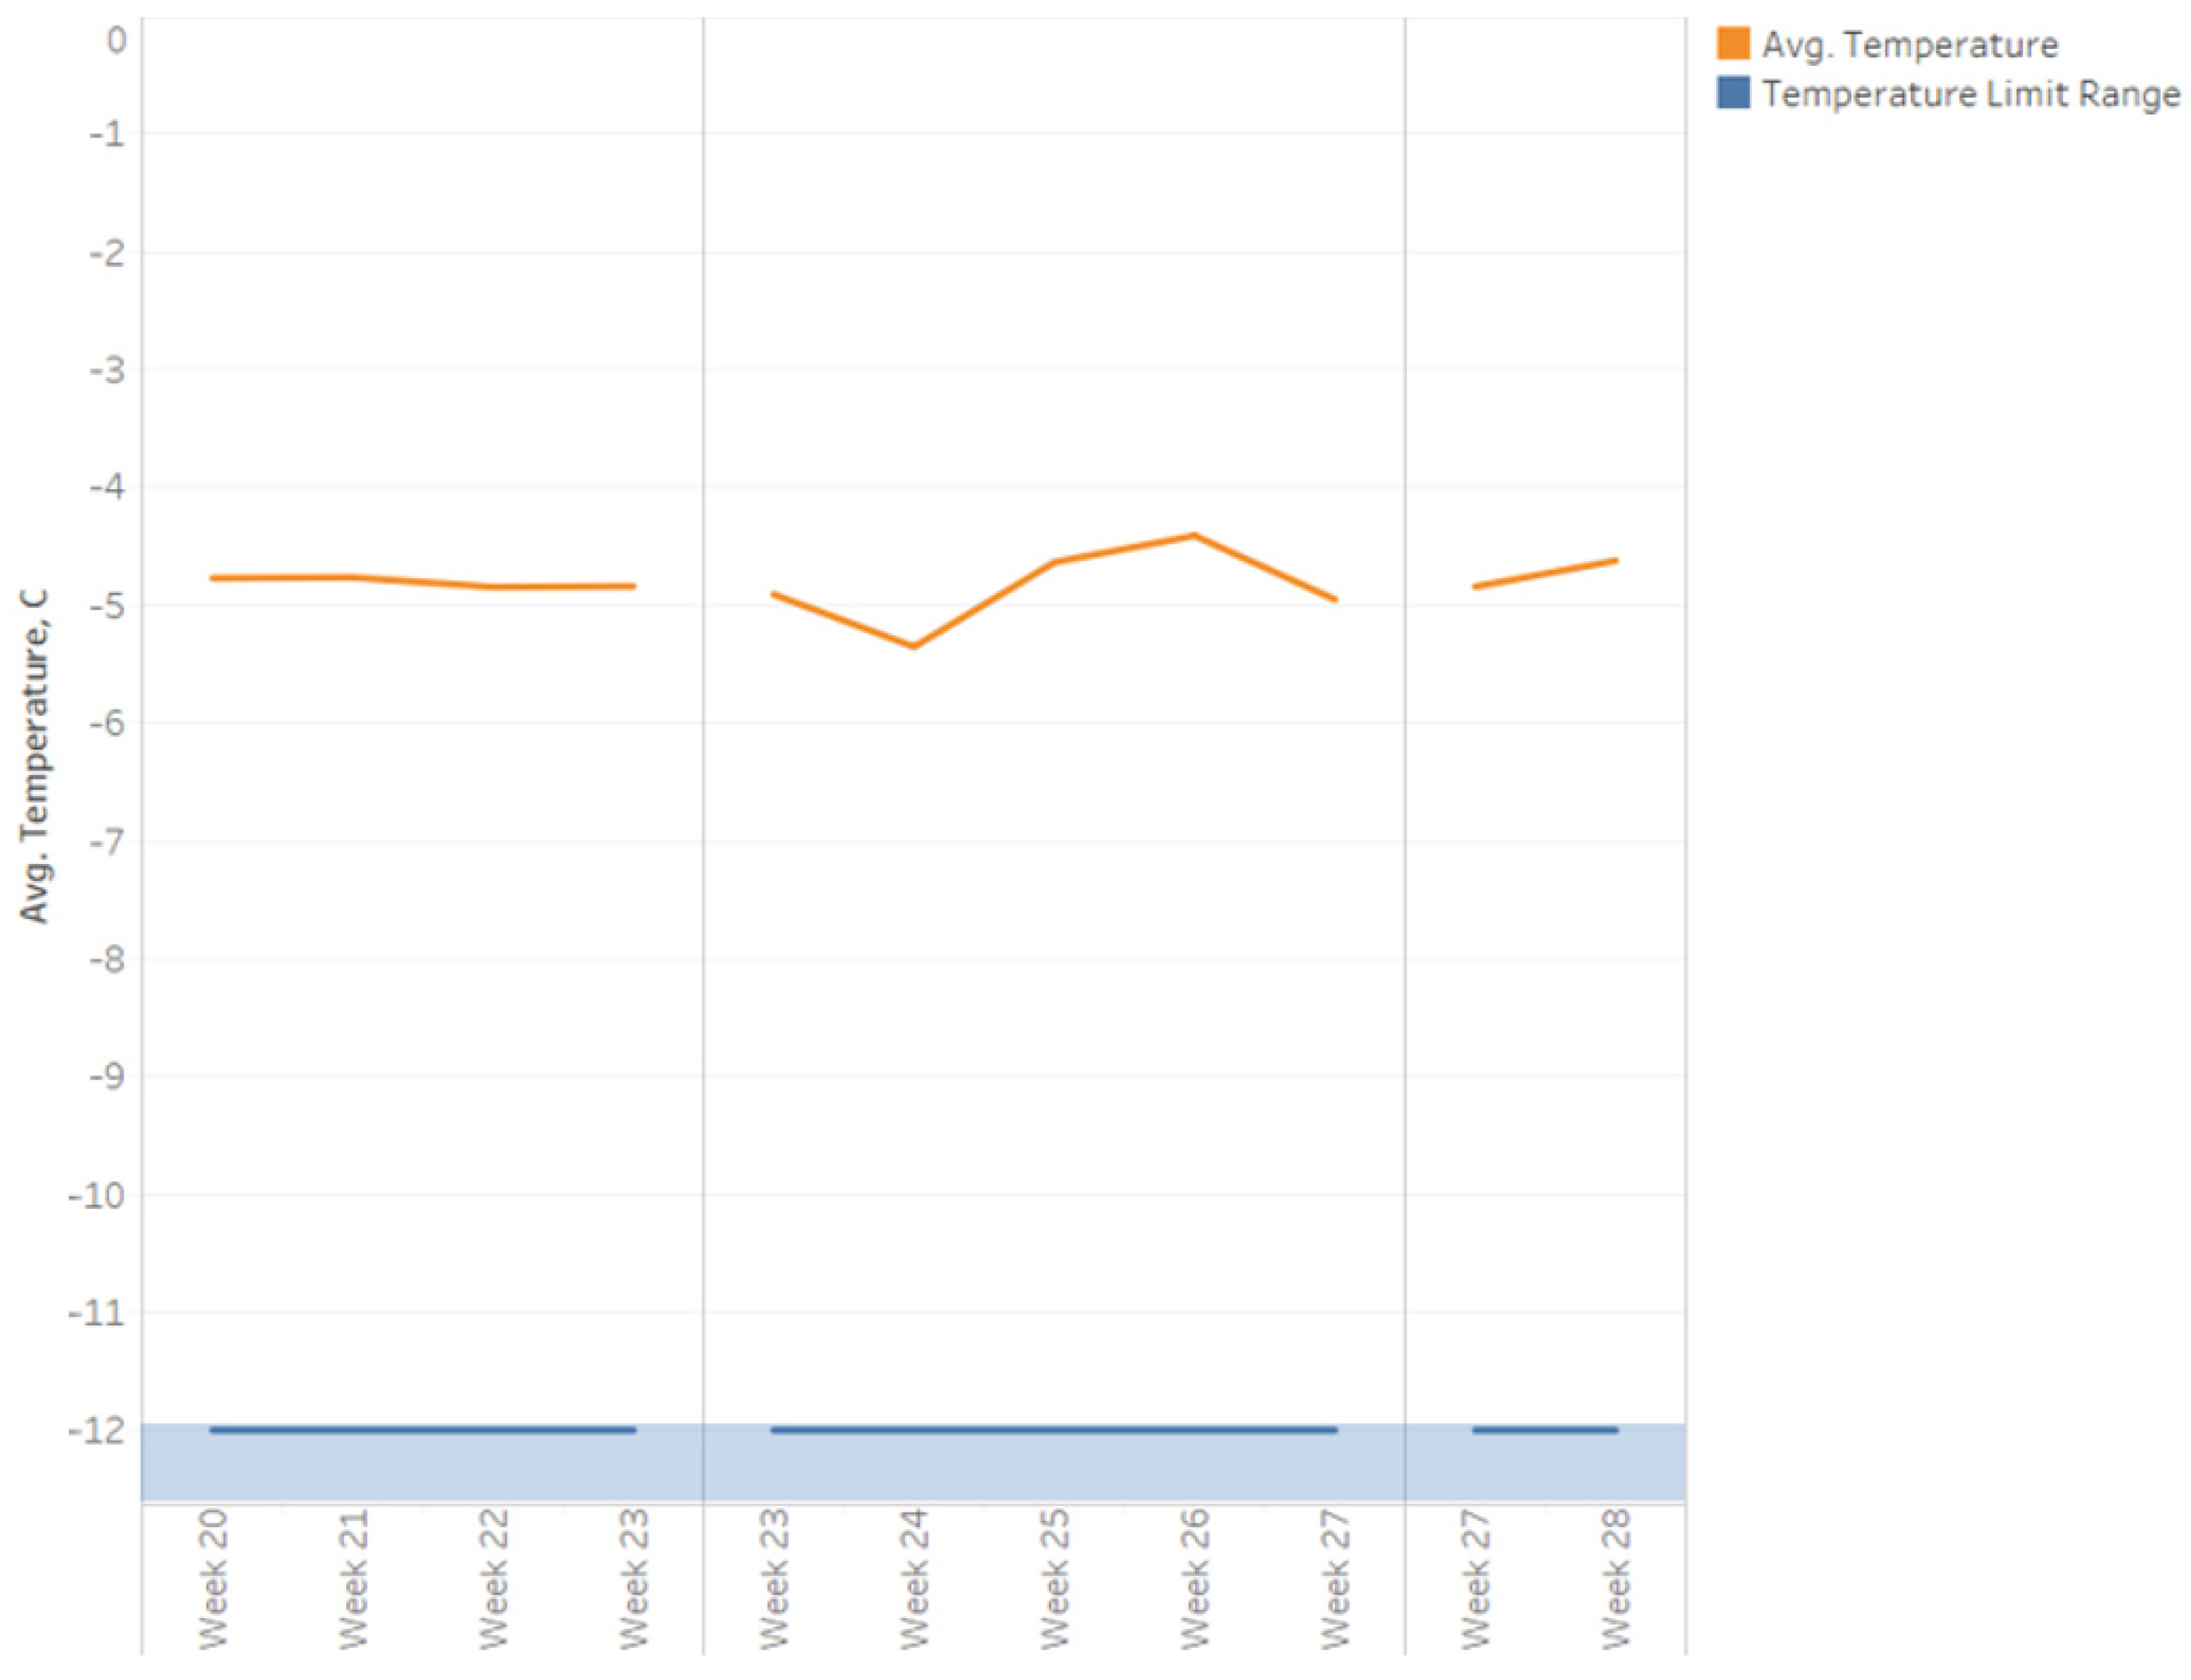
Figure 16.
Temperature distribution in cycles—frozen.
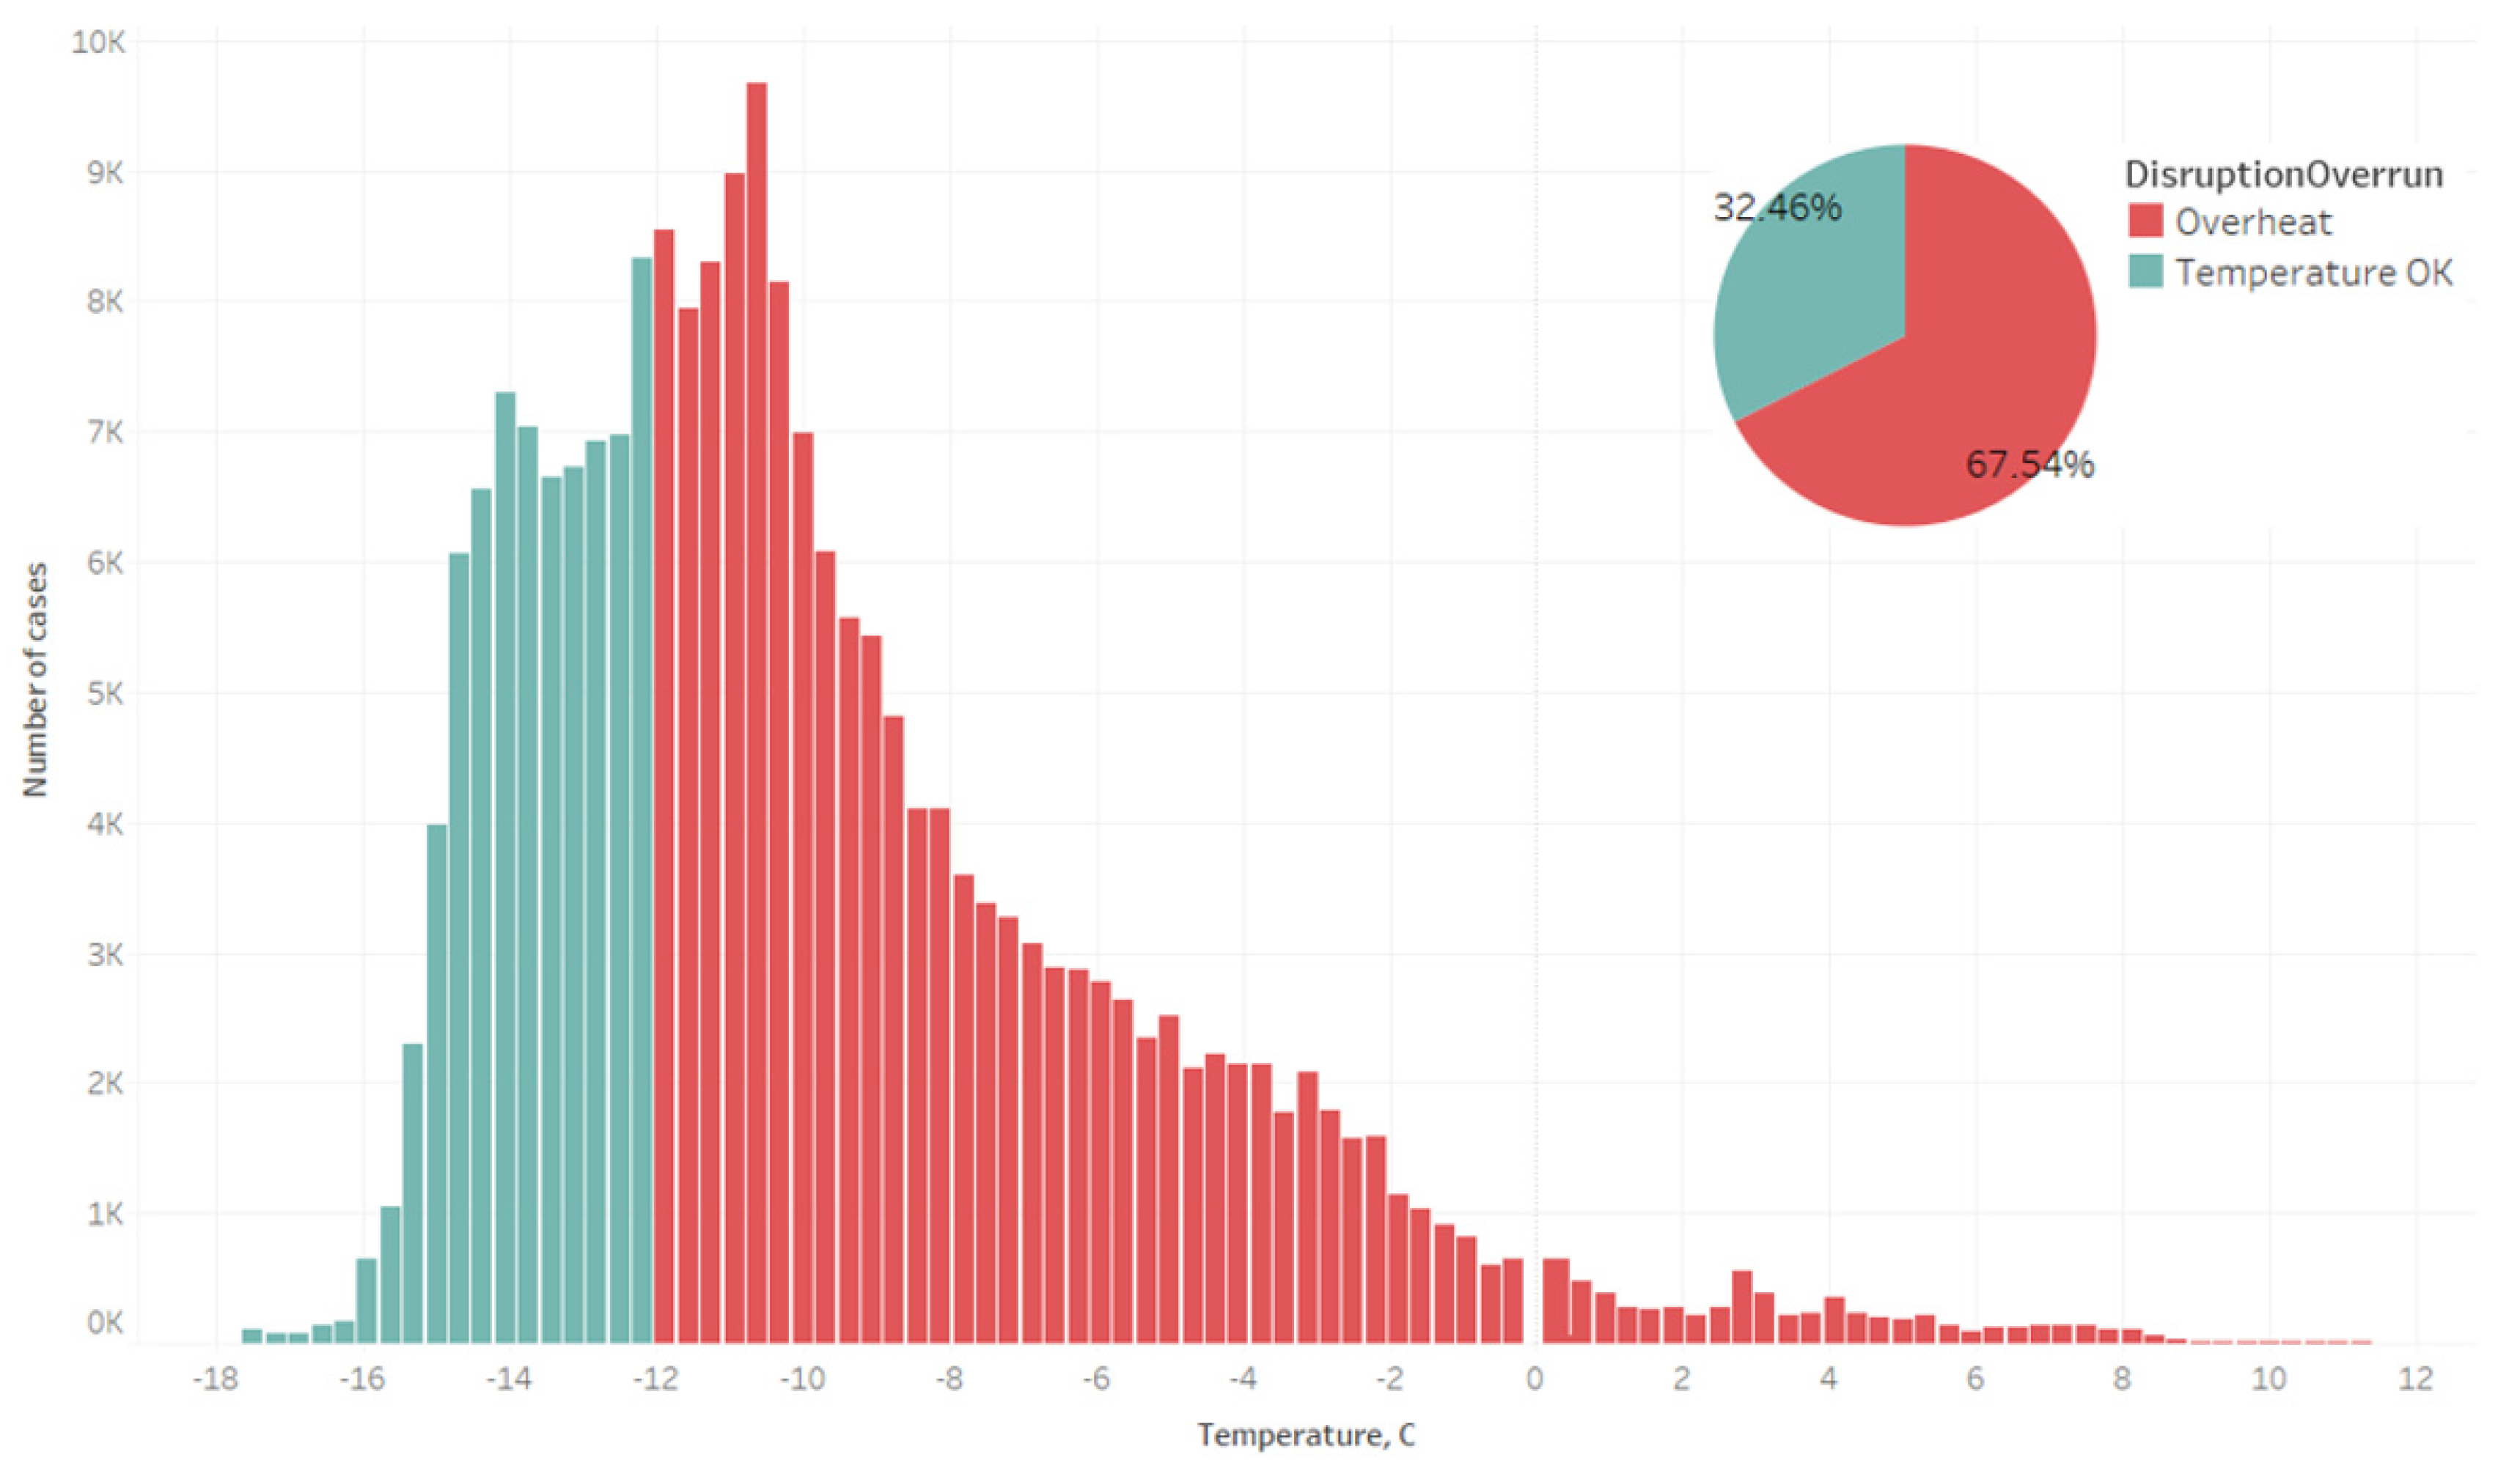
Figure 17.
Temperature distribution at the beginning of the logistic cycle—frozen.
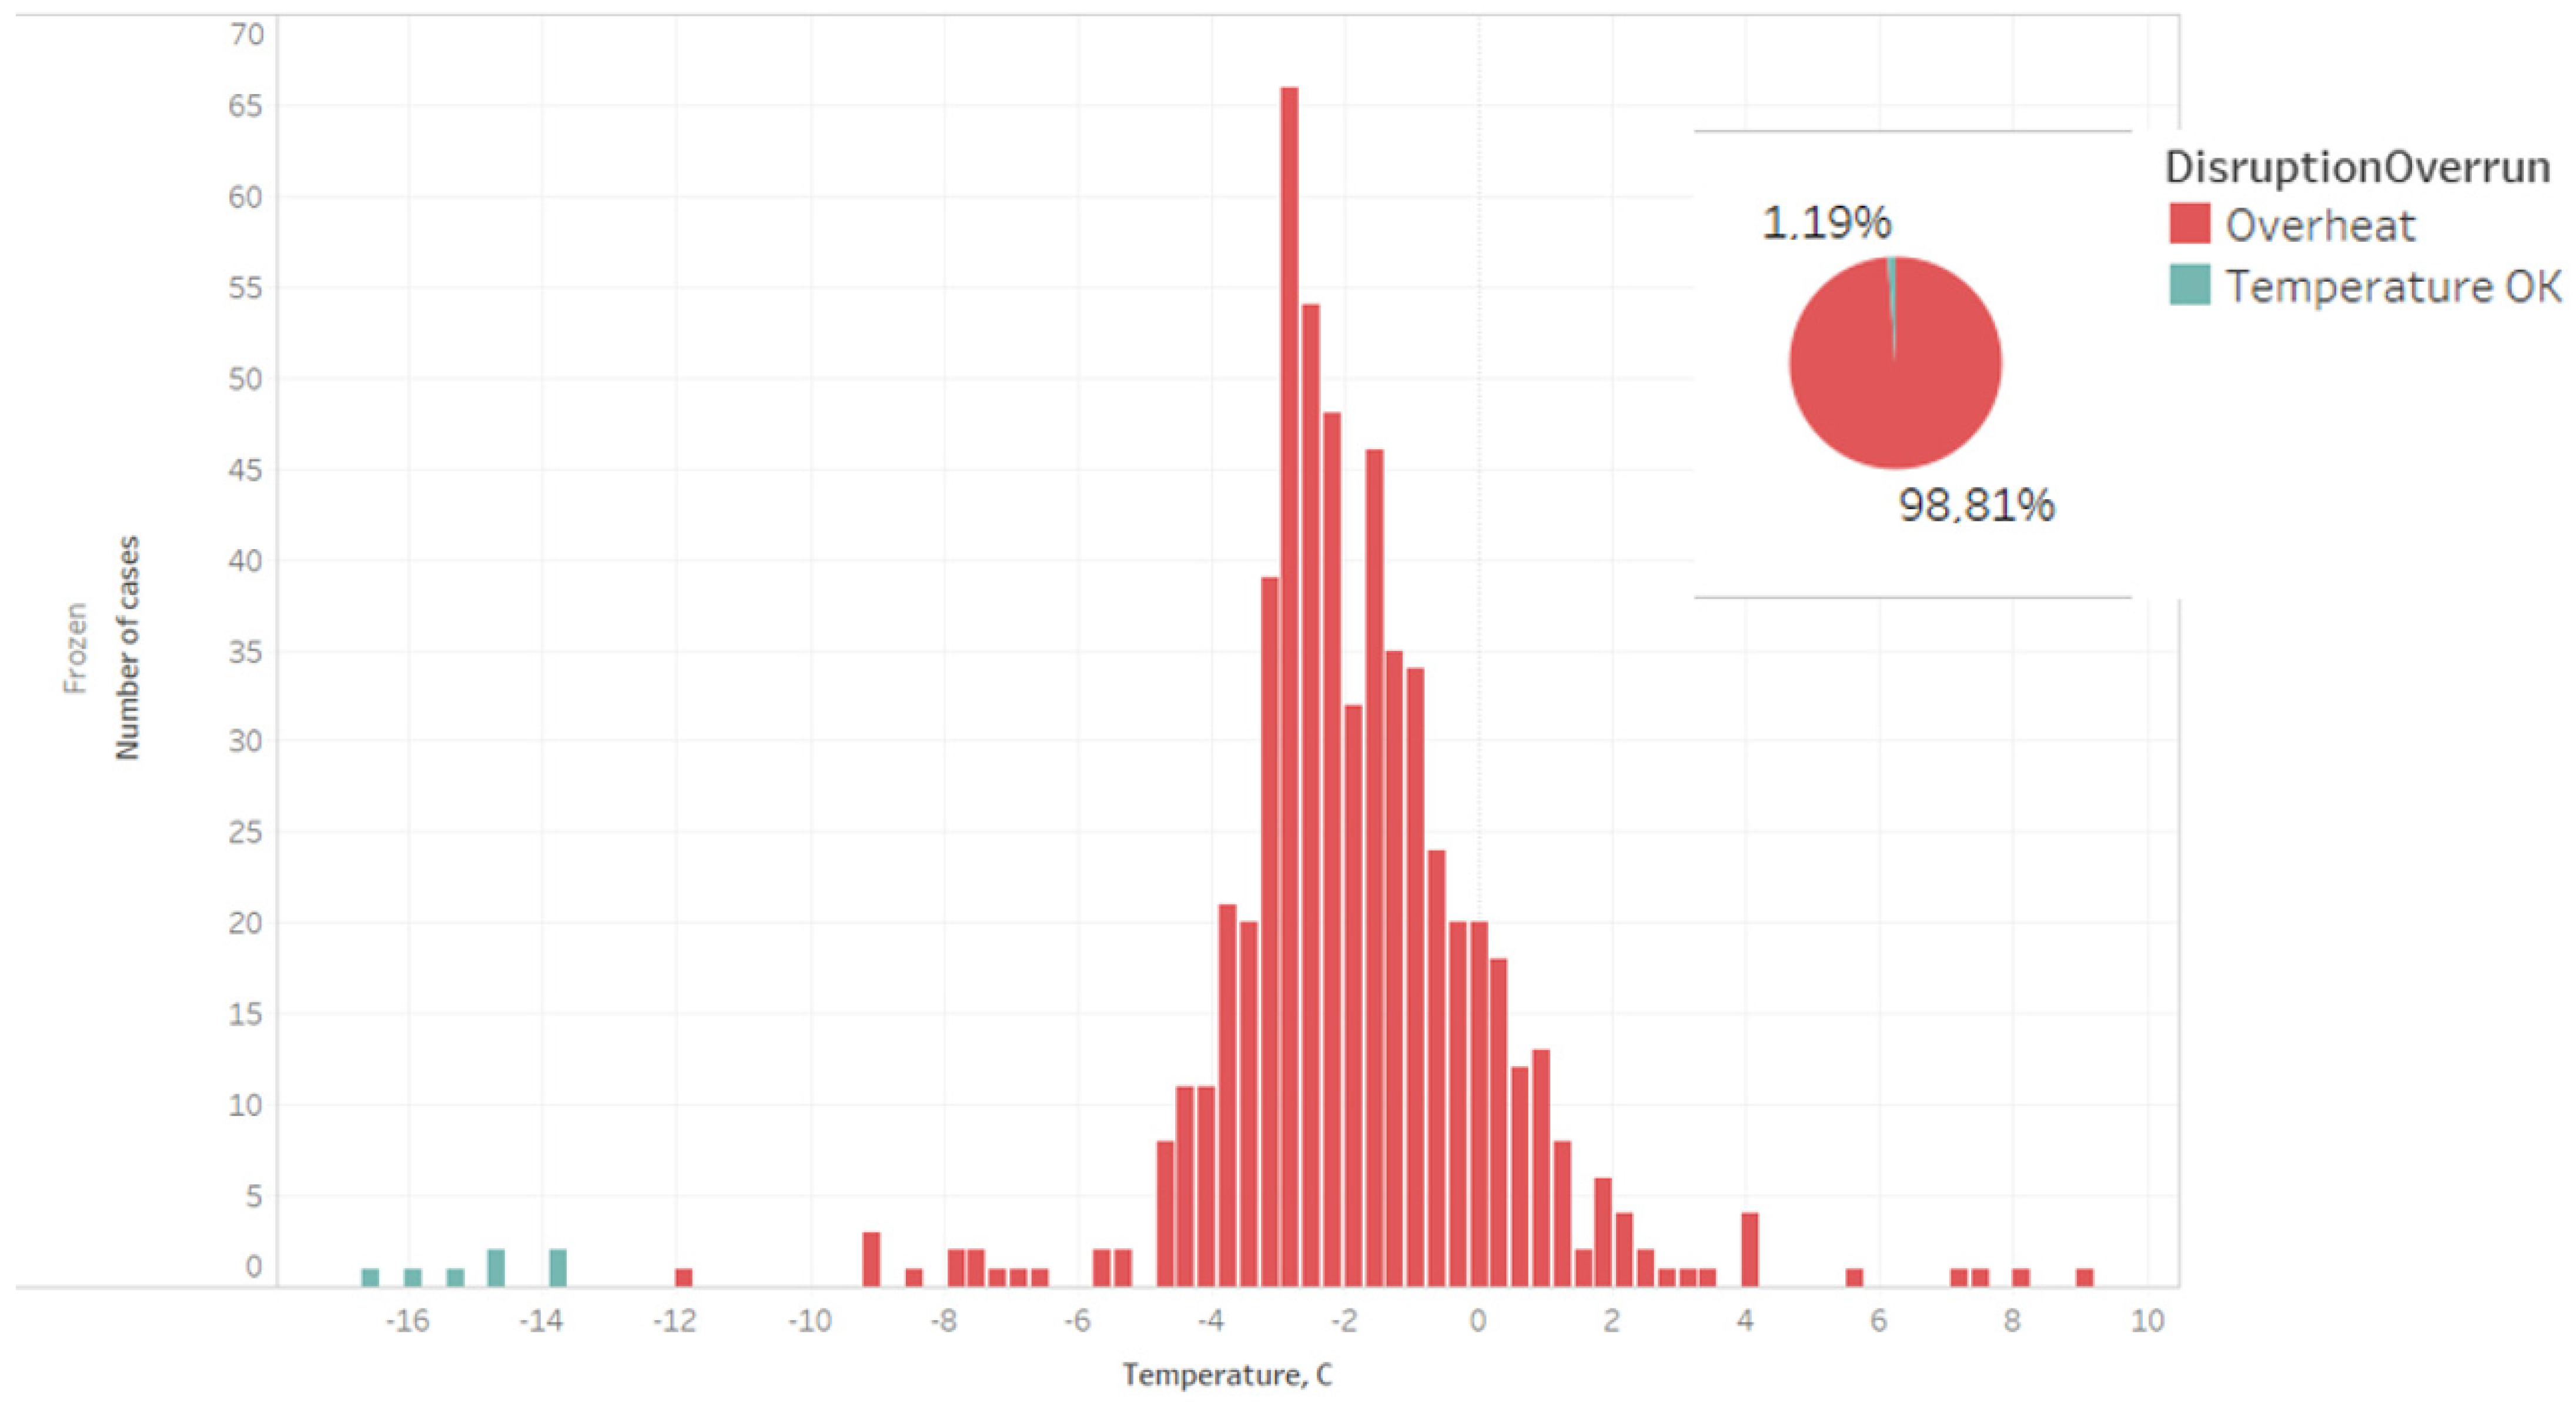
Figure 18.
Distribution of temperatures at the end of the logistics cycle—frozen.
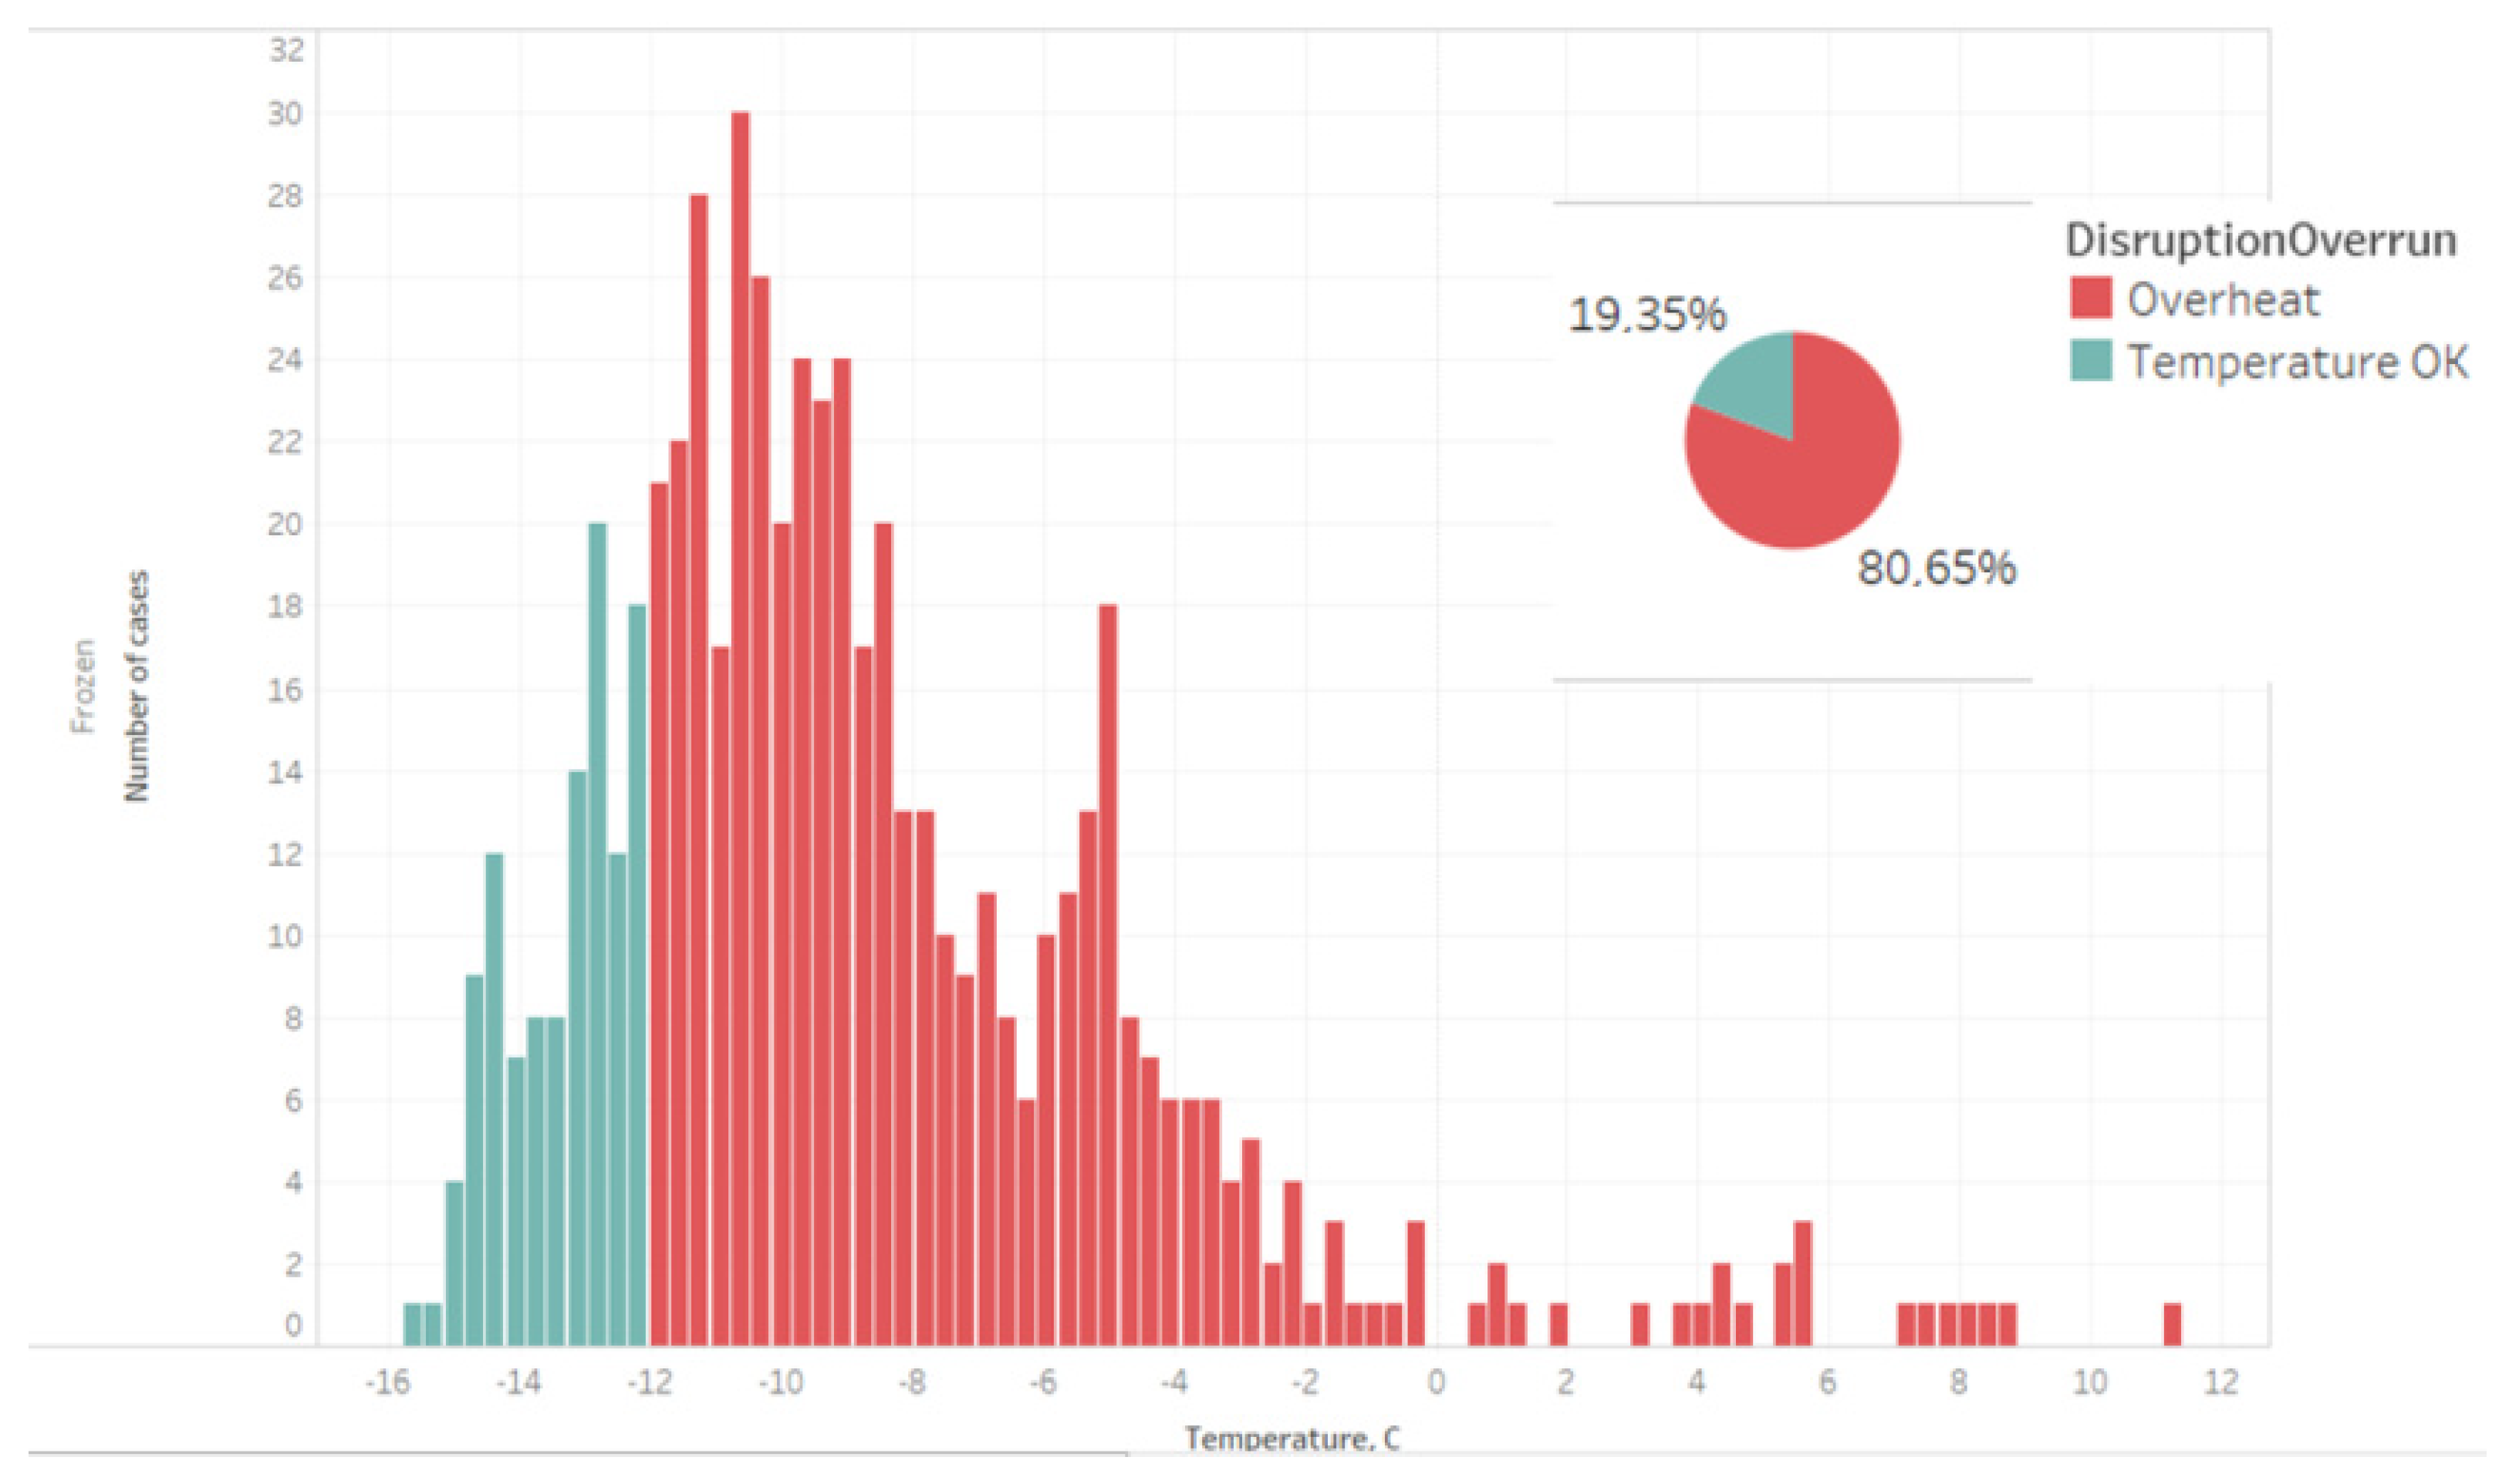
Table 1.
Container circulation cycle.
| Process | Obligatory | Zone | Scanning | Frequency per Cycle | The Environmental Temperature of the Coolbox | Notes |
|---|---|---|---|---|---|---|
| Arrival at DC | Yes | Receiving/Dispatch | Yes | 1 | 2 °C ÷ +20 °C | |
| Container eashing | Yes | Receiving/Dispatch | No | In every cycle or every few cycles | 60 °C | High-pressure cleaning, chemicals, high temperature > 60 °C |
| Drying | No | Cleaning Zone/Storage Zone CB | Recommended | As often as washing | 2 °C ÷ +50 °C | Natural drying or with forced air circulation and higher temperature |
| Cooling | Recommended | Receiving/Dispatch | Recommended—in the absence of an automatic system, such as the Hive Sensor | Always, with the exception being the need for a timed dispatch or cancellation of the shipment (skipping cooling) | −20 °C ÷ +6 °C | Cooling to a specified temperature (fresh or frozen) |
| Loading of products/goods | Yes | Drying Zone/Storage Zone CB | Recommended | 1 | 2 °C ÷ +6 °C | In the fresh zone |
| Placement of the coolant | Yes | Storage | No | 1 | 2 °C ÷ +6 °C | Loading dry ice or eutectic coolant |
| Coolbox transit to the gate | Yes | Receiving/Dispatch | Recommended | 1 | 2 °C ÷ +6 °C | |
| Loading onto the trailer | Yes | Receiving/Dispatch | Yes | 1 | 2 °C ÷ +6 °C | |
| Transport to the store | Yes | Receiving/Dispatch | Yes | 1 | Atmospheric | Trailer temperature or atmospheric, depending on the season |
| Delivery to the store | Yes | Transport | Yes | |||
| Unloading of the coolbox at the store | Yes | Transport | No | 1 | Atmospheric or fresh | Duration usually ranges from a few minutes to several hours from delivery |
| Waiting for transport | Yes | Shop | No | 1 | Atmospheric | During the next delivery, approximately 24 h. |
| Loading onto the trailer | Yes | Shop | Yes | 1 | Atmospheric | |
| Transport to the DC (distribution center) | Yes | Transport | No | 1 | Atmospheric |
Disclaimer/Publisher’s Note: The statements, opinions and data contained in all publications are solely those of the individual author(s) and contributor(s) and not of MDPI and/or the editor(s). MDPI and/or the editor(s) disclaim responsibility for any injury to people or property resulting from any ideas, methods, instructions or products referred to in the content. |
© 2023 by the author. Licensee MDPI, Basel, Switzerland. This article is an open access article distributed under the terms and conditions of the Creative Commons Attribution (CC BY) license (https://creativecommons.org/licenses/by/4.0/).
Share and Cite
MDPI and ACS Style
Lorenc, A. How to Find Disruptions in Logistics Processes in the Cold Chain and Avoid Waste of Products? Appl. Sci. 2024, 14, 255. https://doi.org/10.3390/app14010255
AMA Style
Lorenc A. How to Find Disruptions in Logistics Processes in the Cold Chain and Avoid Waste of Products? Applied Sciences. 2024; 14(1):255. https://doi.org/10.3390/app14010255
Chicago/Turabian StyleLorenc, Augustyn. 2024. "How to Find Disruptions in Logistics Processes in the Cold Chain and Avoid Waste of Products?" Applied Sciences 14, no. 1: 255. https://doi.org/10.3390/app14010255
Note that from the first issue of 2016, this journal uses article numbers instead of page numbers. See further details here.