1. Introduction
The instability of energy prices and the difficult geopolitical situation in central Europe are forcing the development of solutions to balance the energy market. Despite the fact that in recent decades many mining plants have been closed down, which is related to the process of restructuring the industry’s enterprises and the country’s energy transition, hard coal in Poland is still its main energy resource. The process of intensification of mining, which is part of the restructuring and urgency of mining companies, is accompanied by serious difficulties related to, among other things, the need to protect the surface from the possible effects of increased mining. The need to reach deeper and deeper coal seams, and the concentration of mining fronts in a relatively small area, often generate seismic phenomena that can be dangerous to surface infrastructure facilities and cause concern for the populations living in areas affected by these phenomena. Ground vibrations, which are induced by technological processes in mines where blasting is used to extract rock, are also a significant problem [
1]. Despite the fact that entrepreneurs conducting mining works under conditions of rockburst hazards are obliged to conduct studies in the field of engineering geophysics, including measurement, interpretation and evaluation of the impact of tremors on surface facilities, for technical reasons it is difficult to monitor vibrations at all points affected by mining activities [
2]. For this reason, mine geophysics stations are expanding their seismological networks, which, on the one hand, makes it possible to more precisely determine the distribution of vibrations on the surface, but on the other hand, significantly increases the company’s operating costs, associated mainly with the need to maintain the measurement apparatus. Therefore, it becomes expedient to look for solutions that provide greater accuracy in predicting the distribution of ground vibration parameters and do not generate higher costs associated with the maintenance of additional measurement apparatuses.
In seismology, attenuation relations that do not take into account the directionality of vibrations are generally used. Many examples of different forms of these dependencies can be found in the literature [
3,
4,
5,
6]. For mining problems in Poland, the model proposed in [
4] is usually used.
Frequently, after the occurrence of vibrations generated by rock mass tremors, large differences in the magnitude of observed accelerations and velocities of vibrations at points located at similar epicentral distances are observed. This phenomenon cannot always be explained by changes in the value of the vibrations’ amplification coefficient. Similar observations are found in global seismology [
7]. This may be evidence of the directional nature of the attenuation of ground vibrations caused by tremors. Some interesting conclusions taking into account the directionality of ground vibration attenuation can be found in the following works [
7,
8,
9].
Relationships describing the directionality of elastic wave attenuation are successfully used for probabilistic seismic hazard assessment (PSHA) [
10,
11]. The above-mentioned relationships make it possible to estimate the decrease in ground shaking intensity with distance from the earthquake source [
12]. By providing information on how the amplitude of seismic waves decreases with distance, they can be used to estimate parameters such as equivalent peak acceleration (EPA) in specific areas, peak ground velocity (PGV) and peak ground acceleration (PGA). By accounting for uncertainties associated with various parameters such as ground acceleration velocity and distance from the measurement site to the tremor source, these relationships provide more accurate estimates of the mean and variance of ground attenuation [
13]. Validation of these relationships is crucial to ensure their reliability in seismic hazard assessment—assessing the probability of earthquakes and induced shaking and their potential impact on building infrastructure, or for interpreting near-surface structures, as well as mapping seismic activity in volcanic areas and assessing the stability of faults in oil fields [
5,
14,
15,
16,
17]. On the laboratory scale, with regard to seismoacoustic emissions, the recognition of shear and tension signals can be found in [
18]. These results can be generalised to issues of mining seismology given that many rock mass tremors are characterised by a shear mechanism, but there are also phenomena in which the explosives component dominates.
In seismology, isotropic models such as the preliminary reference earth model (PREM) developed by Dziewonski and Anderson [
19] are used to describe the earth’s seismic velocity properties. These models consider parameters such as P and S velocities, density and attenuation as functions of depth. Isotropic models are important because they provide a complete reference for calculating synthetic seismograms without additional assumptions [
20,
21,
22,
23,
24].
Anisotropic models are important for understanding the behavior of seismic waves in different geological structures. Anisotropy refers to the directional variation of physical properties. In seismology, anisotropy can affect the propagation of seismic waves in the Earth’s crust. Considering anisotropy in seismology is important for the accurate interpretation of seismic data and improving seismic imaging techniques. This can provide more precise insights into geological structures and the properties of rock formations, as these models can accurately predict the behavior of anisotropic rocks by more accurately predicting the behavior of geomaterials such as rocks and sediments [
25,
26,
27,
28,
29].
The models which take into account the directionality of ground vibration attenuation proposed in global seismology, e.g., ref. [
5], are often characterized by a relatively large number of parameters. This requires having measurement results from many surface monitoring stations. In the case of observation networks installed by mining plants, as a rule, data on registered ground vibrations is determined by a relatively small number of measuring apparatuses. For this reason, it is necessary to use simpler regression models. With the above assumption in mind, this paper proposes a new method for predicting the distribution of ground vibration accelerations (PGAs) induced by mining activities, taking into account the directionality of vibration attenuation. The results of its application to the description of the field of ground vibration acceleration were compared with the results obtained from the isotropic model [
5], which is often used in Poland, and the anisotropic model [
9] previously developed by the authors.
In this study, the authors analyzed and evaluated the accuracy of predicting the distribution of PGAs induced by mining activities, taking into account three models, including two (No. 2 and No. 3) that take into account the directional nature of vibration attenuation:
The Joyner–Boor, hereafter referred to as the classical model, which assumes isotropic vibration attenuation, the distribution of isolines of predicted ground vibration velocities and accelerations taking the shape of circles;
The elliptical model, accounting for anisotropy of vibration attenuation and elliptical isolines [
9];
The rotational model, accounting for the anisotropy of vibration attenuation without assuming the shape of the isolines of vibration intensity parameters.
In our calculations, the variation of the vibration amplification factor was omitted in order to clearly illustrate the effects of anisotropy of vibration attenuation. When considering registrations for a single station, this procedure is justified.
2. Models Taking into Account the Directional Nature of Vibration Attenuation
For a complete description of the ground vibration distribution of an area affected by induced tremors, it is necessary to have a relation called the vibration attenuation relation. This relation is a function that relates a selected parameter, characterizing the intensity of ground vibrations (e.g., PGA, PGV) to the energy (magnitude) of the tremor and its distance (epicentral, hypocentral) from the source.
As a rule, this relation is determined by regression analysis. This is due to the significant complexity of the analytical description of the phenomena occurring between the source of the vibrations (tremor hypocenter) and the surface area. The intensity of ground vibrations caused by mining tremors depends on diverse factors: the seismic energy of a tremor; the depth of the focus and the epicentral distance of an observation point; the source mechanism; the centre’s geological structure, especially local ground conditions at the point of observation—the type and thickness of loose overburden; its watering; as well as the area topography.
Assuming a known tremor energy, the vibration attenuation relations make it possible to predict the intensity of surface vibrations at different distances from the source. Additional parameters that are taken into account in studies of ground motion prediction equations are: amplification of ground vibrations, directivity of vibration propagation and dominant frequencies of ground vibrations. A wide overview of the applied models can be found in the literature [
4]. Models of vibration attenuation relations estimated from data obtained from measuring stations located on the surface are used to predict vibration parameters averaged for the analyzed area.
In this paper, the model proposed by Joyner–Boor [
5] was first used to describe the relationship between PGA, tremor energy and distance from the source to the seismometer station (Equation (1)):
where:
is the maximum value of ground vibration acceleration, [m/s
2];
is the energy of a tremor, [J];
is the epicenter distance, [m];
,
, are the estimated parameters of the model;
is the random component;
are the coordinates of the tremor; and
are the coordinates of the measuring station.
The parameters of the above model are estimated using the least squares method. The form of attenuation relation model (1) is most often used for estimating local attenuation relations in Polish mines. The model described by Equation (1) will be referred to as the classical model in the remainder of this article. This model assumes the isotropic nature of vibration attenuation, which results in the isolines of PGA and PGV taking the shape of circles. This is a rather broad simplification of the problem, if only due to the fact that there is a phenomenon of vibration amplification, which, as a rule, causes a differentiation of the recorded parameters of vibration intensity at similar distances from the source of the tremor. Unfortunately, this variation in observation results cannot always be explained by the phenomenon of vibration amplification. Numerous studies on the phenomenon of ground vibration attenuation indicate that the directional nature of attenuation can have a significant effect on the shape of isolines of PGA and PGV [
9,
12,
13].
In the case of the second model considered in the paper, in order to take into account the anisotropy of vibration attenuation, the authors assumed that the isolines take the shape of ellipses [
5,
9,
10]. The directionality of vibration damping was introduced into the model by transforming the variable associated with the epicenter distance, as shown in Equation (2). This model will be referred to as the elliptical model in the remainder of the paper.
where:
The model parameters were estimated [
30] with the following constraints (3):
The assumption of an elliptical shape for the isolines determines their symmetrical course with respect to each axis of the ellipse. In order to depart from this condition, the authors proposed a model that takes into account the anisotropy of vibration attenuation without making any assumptions about the shape of the isolines of vibration intensity parameters.
Assume that we have a large number of registrations at a given seismic station. The focal point of the analysis is the point with coordinates (0,0), which is also the location of the station. In the first step, angle α, hereinafter referred to as the angle of penetration, was determined, which determines the dilation of the slice Ω
i, containing the epicenters of the registered tremor, from which the vibration attenuation relation will be determined. This slice is marked with the letter Ω
0 in
Figure 1. The model parameters determined from these registrations represent the intensity of vibration attenuation for the direction γ
i = 0. In the subsequent steps, slice Ω is rotated by 1° counterclockwise, thus determining a new set of tremors. The model parameters determined from these represent the vibration attenuation for the direction γ
i = 1. These steps are repeated until a full rotation around the seismic station is performed, that is, until the model parameters representing the vibration attenuation intensity for directions γ
0, γ
1, …, γ
359 are determined.
Figure 1 presents the situation in which a penetration angle of 90° is assumed. The shaded slice Ω
0 covers the epicenters of the tremors, representing the set of input data for which the ground vibration acceleration attenuation relation will be determined. This relation will represent the vibration attenuation for the direction γ = 0°. To determine the vibration attenuation relation for direction γ = 150°, for example, taking into account the penetration angle assumed earlier, it is necessary to take into account all the events covered by slice Ω
150. After performing a full rotation around the seismic station, the final result is a 360° ground vibration acceleration attenuation relation.
This model is described by the relation shown in Equation (4) and will be referred to as the rotational model in the rest of the article.
where
i is the index of observations in the subsample;
j is the index of the subsample.
The direction to the tremor
is calculated from Equation (5):
The question of selecting an appropriate penetration angle still requires comment. On the one hand, it is advantageous for this angle to be small due to the fact that, by determining the attenuation relation for a given direction, the deviation of the data from it will be small. Unfortunately, setting a very small penetration angle may consequently mean that a small number of observations will be included in the sample, making it impossible to determine reliable estimates of model parameters. Another limitation may be the significance of regressions and individual model parameters. According to the authors, it should be assumed that the penetration angle should be chosen so that the minimum size of each subsample is no less than ten times the number of estimated parameters, and the significance of each estimated vibration attenuation relationship should be no greater than 0.05. In addition, each estimated parameter of the attenuation relationship should have a significance level of 0.05 and take a value that is consistent with its physical interpretation. The selection of the minimum angle, which ensures that the above three conditions are met, guarantees the correct interpretation of vibration damping from the analyzed direction. Choosing an angle greater than the minimum does not disqualify the method. The phenomenon of vibration directivity will still be analyzed, but the parameters of the vibration attenuation relation will be estimated from tremors coming from a wider spectrum of directions. In the limit case, for an angle of 360°, the relation will take the form of a classical linear regression model.
3. Description of Seismometric Data
The subject of the analysis was seismometric data from a mining area characterized by a very high level of induced seismicity. The analyzed tremors were recorded from 2009 to 2020 at a single measuring station. The surface distribution of tremors along with the location of the seismometric station is shown in
Figure 2.
A surface seismic station ARP 2000 was installed in the analyzed area, consisting of triaxial accelerometers with a frequency range between 0.5 and 100 Hz and a sampling rate of 500 samples per second. The dynamic range for processing and recording is 90 dB. The station is synchronized with a GPS unit, yielding a very precise recording time accuracy, on the order of microseconds. The equipment is serviced and periodically calibrated by its manufacturer. Measurement accuracy is better than 0.0001 m/s2. The system detects vibrations of mining, seismic or communication origins and transmits them digitally via radio to a processing centre. A PC, which is the processing centre, is allowed to record, archive, and process the registered data. The logger software periodically generates status data and sends it to the processing centre.
Information on seismic event locations and seismic energy were collected by an underground seismic network installed in the coal mine. The location of underground stations is periodically optimised to ensure that the exact locations of tremors are acquired.
Table 1 presents basic positional statistics on the distribution of source energy, epicenter distances, as well as PGA values of the considered tremors.
Analyzing the distribution of PGAs, it should be noted that 89% of all resultant components of horizontal vibration accelerations did not exceed a value of 0.045 m/s
2, while more than 96% did not exceed a value of 0.090 m/s
2. Only 1.8% of the investigated accidental components of horizontal ground vibration accelerations exceeded a value of 0.135 m/s
2, and only 0.5% exceeded a value of 0.225 m/s
2.
Table 2 presents the distribution of the logarithms of the energy of the recorded shocks. It can be seen that shocks with energies in the energy range from 3.1 × 10
4 J to 1.3 × 10
5 J dominate. The energies of more than 900 recorded seismic phenomena exceeded a value of 5.5 × 10
5 J while about 70 shocks were characterized by energies of no less than 1.0 × 10
7 J.
The epicenter of the tremor with the highest energy, at 3.0 × 10⁹ J, was located about 2420 m from the measuring station. This tremor caused ground vibration accelerations of 0.22 m/s2. A maximum ground vibration acceleration of 0.455 m/s2 was caused by a tremor with an energy of 1.0 × 10⁷ J. The epicenter of this tremor was located about 1297 m from the measuring station.
4. Results and Discussion
A classical model of the attenuation relation of ground vibration acceleration was determined for the recorded vibration cases. The structural parameters of the model, estimated using the least squares method, are shown in Equation (6).
The p-values for all estimated model parameters were not greater than 0.001, which means that they were statistically significant. The standard error of the residual component was 0.2283. The standard error of the residuals was calculated as the square root of the sum of the squared residuals divided by the sample size reduced by number of estimated parameters. The properties of the residuals of the model were examined in terms of normality and homoscedasticity using appropriate statistical tests. For normality, the Jarque–Bera test was used. The p-value for the JB statistic is lower than 0.001. However, when referring the central limit theorem, it is sufficient that the residual distribution is asymptotically normal, considering the very large sample size. Residual homoscedasticity was tested using the Breusch–Pagan statistic. The p-value equalled 0.21, which means that there is no evidence to reject the hypothesis of homoscedastic residuals.
Based on the same data set, the parameters of the elliptical model were determined. The results are shown in
Table 3. The values of the parameters
p = 1.24 and
q = 1.21 mean that the root of the quotient of the length of the major axis to the length of the minor axis of the ellipse is 1.24, while the angle of rotation of the ellipse around the beginning of the coordinate system is 69° (the direction of the minor axis of the ellipse). The standard error of the residual component for the elliptical model is 0.2267.
In the next part of the analysis, the parameters of the vibration attenuation relation for the rotational model were estimated. A penetration angle of 180° was assumed, which resulted in the size of the least numerous rotational subsample being 540 tremors. In addition, this angle made it possible to obtain parameter estimators that were significant at a level equal to 0.01 and consistent with their physical interpretation. Also noteworthy is the fact that only at a penetration angle of 100° was the abundance of the least numerous subsample 40 observations.
Figure 3 shows the dependence of the minimum subsample size on the adopted penetration angle. In the figure, the red line indicates a value of 40 units in the subsample.
Figure 4 plots the values of the estimators of the models’ parameters for each γ
i direction. The values of the estimator associated with the free expression range from −3.975 to −2.964. For the parameter associated with the logarithm of tremor energy, the minimum value of the estimator was 0.4763 for a direction equal to 39°, while the maximum value was 0.5848 for a direction equal to 296°. For the parameter associated with the geometric scattering of the wave front, the limiting values were −0.3736 and −0.048 for directions equal to 71° and 334°, respectively. The minimum value of the estimator associated with damping was −0.00028 for the 271° direction, while the maximum value was −0.00012 for the 8° direction. The coefficients of variation of the parameters α
0, α
1, α
2 and α
3 were 7%, 6%, 26% and 20%. This means that the dispersion of parameters related to free expression and tremor energy is relatively small, while the dispersion of estimators related to distance from the source shows moderate heterogeneity. This may mean that the variability of the predictions of the maximum resultant vibration accelerations, taking into account the γ direction, can be traced to the variability of the distance-related parameters.
The estimation of regression estimators of models of vibration attenuation relations for directions γ
i made it possible to determine isolines of PGA for a hypothetical tremor with energy equal to 5 × 10
6 J. The results are presented in
Figure 5. The isolines shown are in fact contour lines of the function f(E,R)—vibration attenuation relations. In order to determine the dominant direction of the fastest increase in the value of the parameter describing the intensity of vibration attenuation, the gradient properties of the function and the vector field concept were used.
The gradient of the function f(E,R) at the point
is the vector defined by Equation (7):
where:
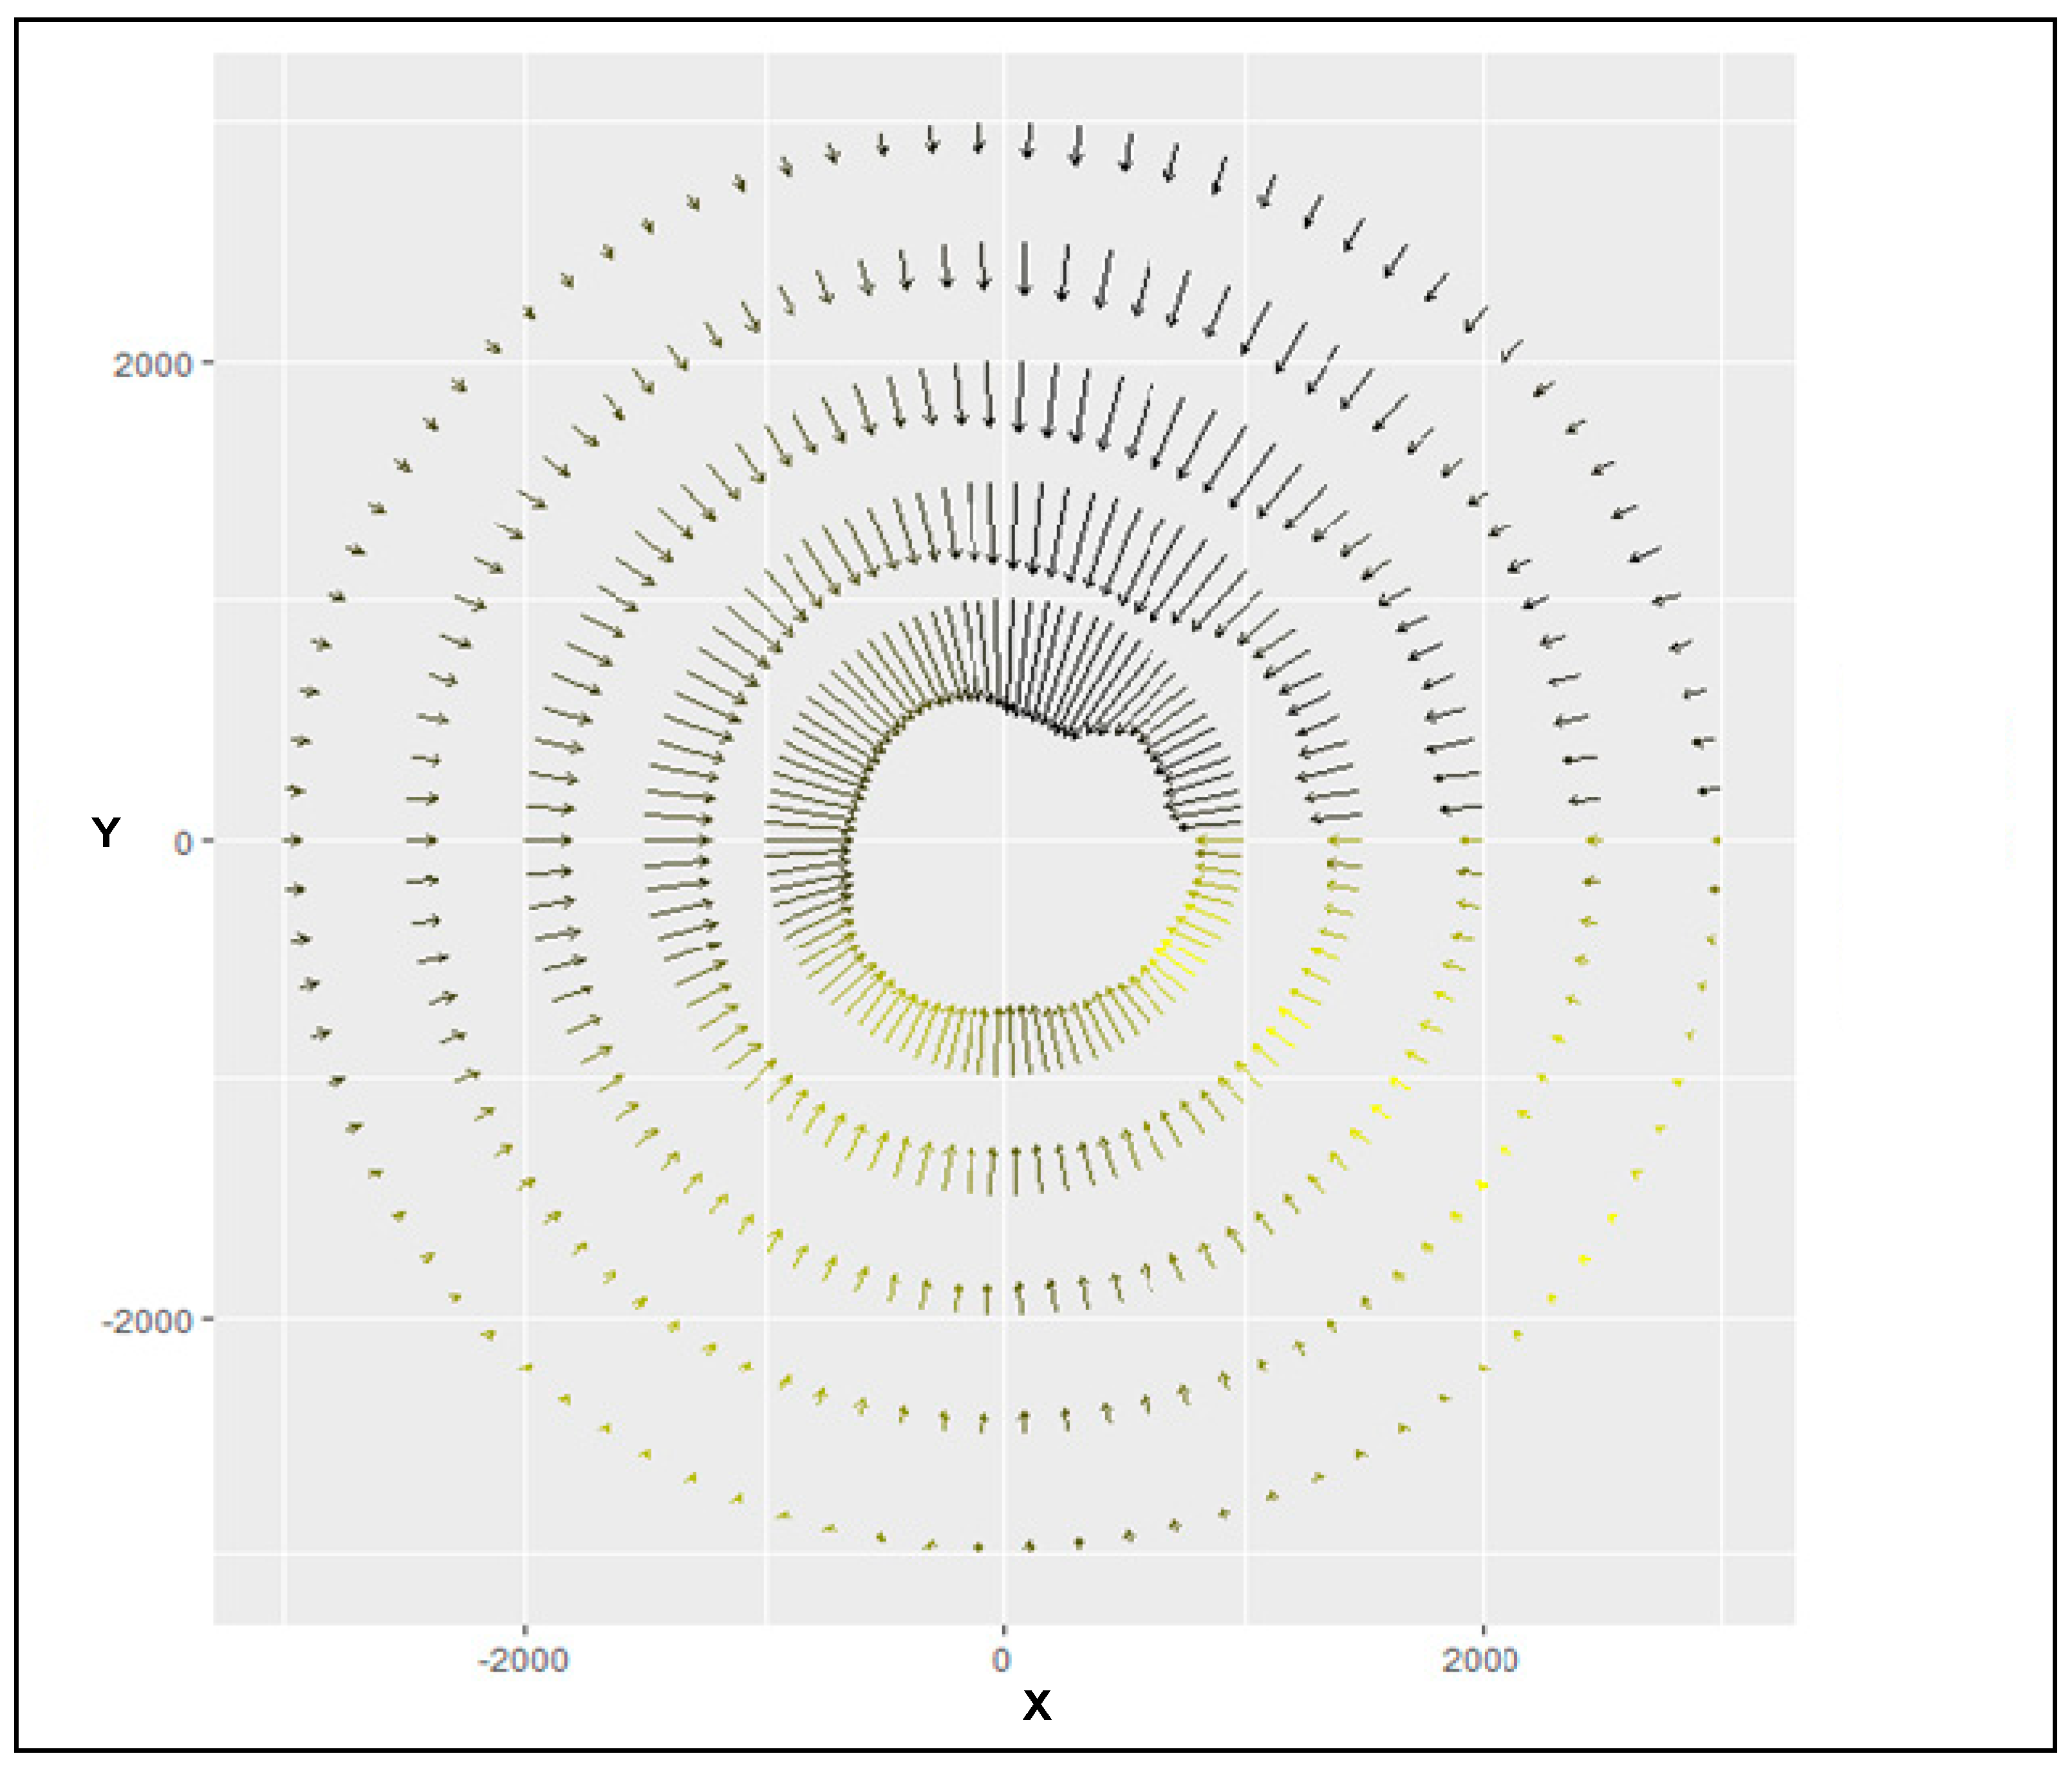
Figure 6 shows the vector field of the function f(E,R) in two-dimensional space at a fixed energy of 5 × 10
6 J.
For clarity,
Figure 6 presents only those vectors whose origin is at points 1000 m, 1500 m, 2000 m, 2500 m and 3000 m away from the measurement station. The lengths of the vectors for given distances from the measuring station are proportional to the value of the growth rate of the ground vibration intensity parameter. The yellow color indicates those vectors whose lengths for a given distance from the site are relatively small. The values of vibration acceleration increase most rapidly from the NNE direction for an angle γ equal to 67°, and most slowly from the ESE direction for an angle γ equal to 331°.
5. Discussion
A measure of the standard deviation of the residual component and Pearson’s correlation coefficient of theoretical and empirical values were used to compare the results obtained for the three models. The results are shown in
Table 4.
The presented values prove that models taking into account the directional nature of vibration attenuation better describe the actual distribution of values of the vibration intensity parameter than the classical model. The slight increase in the fit to the empirical data of the rotational model compared to the classical model is due to the selection of a fairly wide penetration angle. The applied angle of penetration (180°) ensured that the assumptions of the least squares method were met. A better model fit to the empirical data could be achieved by selecting a smaller penetration angle, which in turn is associated with sample size (occurred tremors). In addition, a better fit of the model to the empirical data can be sought by using other estimating methods. These can be nonlinear least squares methods or non-classical methods. It is possible that geostatistical methods would lead to similar results.
Noteworthy is the fact that both the elliptical and rotational models indicate a high convergence in the direction of anisotropy of vibration attenuation. For the elliptical model, the directions of the minor axis and major axis of the ellipse are 69° and 339°, respectively. For the rotational model, the direction of the fastest increase in the value of the vibration acceleration parameter was 67°, while the direction of the slowest increase in this parameter was estimated at 331°.
In addition, these directions are closely in line with the directions for which the extreme values of the parameter
(see Equation (4)) were calculated. This parameter is related to the geometric scattering of the wave front for the rotational model. The maximum value of this parameter was −0.048 for a direction equal to 334°, while the minimum value, in turn, was estimated at −0.3736 for a direction equal to 71°. This may mean that this parameter explains the direction of anisotropy to the greatest extent, especially since, in terms of the empirical material analyzed, it was characterized by the greatest heterogeneity when taking into account the direction of the epicenter of the tremor—the seismic station. In order to compare the anisotropy determined based on the elliptical and rotational model, a measure of the mean square deviation of the predictions of the anisotropic model and the isotropic model can be used for predetermined energy levels and distance from the source [
31]. These relationships are presented in Equations (8) and (9).
If the vibration attenuation phenomenon does not show anisotropy, then the values of Aeli and Arot should be zero. For the estimated models, for an energy equal to 5 × 10⁶ J and an epicenter distance of 1000 m, they are 6.08 and 14.42, respectively. This means that for the elliptical model, the predicted values deviate on average from the predictions of the isotropic model plus or minus 0.0061 m/s2, and 0.0144 m/s2 for the rotational model.
6. Summary and Conclusions
The article analyzes the results of ground vibration acceleration measurements carried out in the mining area of one of the Upper Silesian Coal Basin mines strongly threatened by induced seismicity. The examples presented of ground vibrations caused by mining tremors confirm the desirability of including the directional effect of this phenomenon in the attenuation relationship. As a result of applying models that take into account the anisotropy of vibration attenuation, it was proved that these models better describe the actual distribution of values of the vibration intensity parameter than the classical model.
The calculations made it possible to conclude that the inclusion of anisotropy in the vibration attenuation relationship leads to an improvement in the quality of the model in terms of its fit to empirical data and reduction in prediction errors. In addition, a high convergence in the direction of anisotropy of the elliptical model with the rotational model was demonstrated.
The models developed as a result of research, and take into account the anisotropy of damping of ground vibrations caused by tremors, and make it possible to more accurately reconstruct the field of acceleration and velocity of ground vibrations after high-energy tremors. This is important not only for knowledge but also for application reasons. It allows mining companies to more precisely determine the extent of the damaging effects of ground vibrations induced by tremors accompanying ongoing mining works.
Further research will aim to investigate the influence of various factors on the observed ground vibration attenuation anisotropy. Among the many potential causes of the observed ground vibration attenuation anisotropy, the mechanism of tremor foci and the occurrence of tectonic faults will be the first to be considered in future research.


