
Experimentally Determined Force Density Spectra for Admittance-Based Vibration Predictions along Railways
by
Benedikt Tappauf
1,*,
Karoline Alten
2,
Marianne Legenstein
1,
Marlene Ofner
1 and
Rainer Flesch
3 1
Benedikt Tappauf GmbH, Waltendorfer Hauptstraße 113—1, 8010 Graz, Austria
2
AIT Austrian Institute of Technology GmbH, Giefinggasse 4, 1210 Vienna, Austria
3
Institute for Structural Concrete, Graz University of Technology, Rechbauerstraße 12, 8010 Graz, Austria
*
Author to whom correspondence should be addressed.
Appl. Sci. 2024, 14(6), 2557; https://doi.org/10.3390/app14062557
Submission received: 12 September 2023
/
Revised: 27 February 2024
/
Accepted: 8 March 2024
/
Published: 19 March 2024
(This article belongs to the Special Issue Recent Advances in Vehicle-Track-Ground Coupling Dynamics and Railway-Induced Ground Vibration)
Abstract
:Featured Application
The article provides practical recommendations on the use of force density spectra in vibration prediction along railway lines.
Abstract
The planning application and approval process of railway tracks is generally accompanied by a vibration immission assessment. Starting with the source spectrum, which is ideally obtained through measurements, the German guideline VDI 3837 recommends a series of multiplications using transfer spectra which account for the various subdomains of the wave propagation path, such as the effect of the superstructure, the free field propagation, the soil-structure coupling and the transmission inside buildings. Typically, these one-third octave spectra are an average over empirical reference values. While simplified empirical relations are prone to a large variance, the use of artificial vibration sources allows the actual vibration transmission behavior from the tracks to the immission points to be quantified. Using so-called transfer admittances, also known as transfer mobilities, which account for all dynamic interactions along the transmission path (track, tunnel structures, foundations, structural properties), together with force density spectra for relevant rail vehicles, the authors investigate the practical application of the method presented in Report No. 0123 of the Federal Transit Administration (2018) for the frequency range 5–200 Hz. The article demonstrates how such force density spectra were obtained for the most common train types in the Austrian rail network at two different track sections using artificial vibration sources. Furthermore, practical aspects are discussed and a recently developed approximation method for estimating line transfer admittances from point transfer admittances using simplified models is introduced.
1. Introduction
Vibration mitigation is becoming increasingly important due to the constant densification of urban areas, the expansion of transport networks, and the increase in traffic volume. The growing demand for the protection of residents, along with the use of heavier and faster vehicles with higher emissions places significant demands on the track–vehicle system. The current state of the art during planning procedures involves predicting environmental impacts based on empirical data or reference measurements in comparable scenarios. The propagation path from the source to the assessment point is typically split into separate sections referred to as the emission, transmission and immission domains, each with their respective transfer spectra [1,2,3,4,5]. This path encompasses the vehicle–track interaction (determined by superstructure stiffness, axle loads and vehicle speed), the propagation of seismic waves through the ground (determined by soil densities and elastic moduli) as well as the soil–structure interaction at the receiver location. While reference spectra for these subdomains typically require large safety factors or allowances to account for their variability, in situ investigations using artificial vibration sources can measure the actual vibration transfer behavior from the track to the immission points in question.
In this article, the admittance-based prediction method, first presented by Nelson and Saurenman [6], is explained and demonstrated in the context of railway applications at grade and in tunnels. The mechanical admittance is the ratio between the measured vibration velocity and the excitation force as a function of frequency. By using site-specific transfer admittances, which account for dynamic influences along the entire transmission path between the excitation point and the immission point, together with force density spectra of rail vehicles, which the authors of [6] claimed to represent site-independent vibration data of vehicles, would allow accurate immission predictions during planning. The process of determining these force density spectra for the most relevant train types in the Austrian rail network (see Table 1) and the associated pros and cons are illustrated in this article.
Previous studies [7,8,9] have demonstrated that force density spectra can be calculated both numerically and experimentally. Theoretical models estimate the emitted forces based on the following method and considerations:
- The admittance of the track or track compliance (in meters per Newton) is calculated by finite-element simulations, sometimes combined with boundary-element methods. Typical results are shown in [10];
- The vehicle compliance, which can be based on a single degree of freedom (SDOF) or a multi-degree of freedom (MDOF) system, needs to be determined;
- Track unevenness and wheel roughness also need to be considered.
Challenges arise due to the complexity of soil stratification and underground structures in real world projects, which are not easily modeled. Assumptions must also be made regarding the track unevenness. The wheel roughness, as on-site measurements have shown, significantly influences emissions but is often overlooked. This typically leads to high uncertainties for frequencies above 25 Hz, as noted in [11]. Moreover, quasi-static effects or the impact of the moving load are generally neglected in such calculations, resulting in underestimated amplitudes at frequencies up to 25 Hz [11].
An alternative approach uses wheelset acceleration measurements, multiplied by the wheelset mass, to determine the excitation forces, as described in [12]. Typically, such measurements show that forces increase considerably with train speed at low frequencies, along with a frequency shift for individual components of roundness (6–16 Hz) and sleeper passage (32–80 Hz). A comparison of measurements on slab tracks and ballasted tracks [11] shows that at approximately 32 Hz, nearly identical acceleration levels were recorded. Below 32 Hz, wheelset accelerations on ballasted tracks show significantly higher values, whereas force spectra on slab tracks at frequencies above 32 Hz were considerably higher. This phenomenon is attributed to vehicle–track resonance caused by soft rail pads.
In this article, Section 2 outlines the theory of the admittance-based vibration prediction and practical considerations of the study presented herein. Section 3 presents the in situ surveys conducted on a tunnel track and on an embankment track of the same railway line to determine the force density spectra for different train categories. Section 4 summarizes the findings and compares them to results from other projects, while also commenting on the limitations and advantages of the method compared to simplified, empirical prediction procedures.
2. Admittance-Based Immission Prediction
The site-specific tests described in the Federal Transit Administration’s manual [5] are based on using the transfer admittance (in mm/s/kN) between excitation points on the track and the investigated immission points in a building. This procedure (schematically shown in Figure 1) allows for more accurate immission predictions compared to conventional methods [1,4] for the relevant train configurations by multiplying the transfer admittance spectrum with the previously determined force density spectra. Figure 1 shows excitation points at a spacing of h meters along the tracks inside a tunnel, the immission points of interest inside a nearby building (sensor points indicated by red triangles) and the procedure’s spectral computations which rely on vibration measurements during artificial vibration generation.
2.1. How to Determine the Transfer Admittance
In order to obtain the admittance Y, the ground is subject to controlled, measurable forces at several points along an existing or planned railway corridor. These tests are ideally performed on the subgrade or inside tunnel structures, using a vibration generator or an impact tester. The resulting vibrations are measured at the immission points of interest (e.g., inside nearby houses), as shown in Figure 1. By dividing the vibration velocity, , by the force, , as shown in Equation (1), the point transfer spectra are obtained as a function of frequency, ω, usually in one-third octave bands (where ω presents the center frequency of the bands).
Transfer admittances characterize the entire propagation path between the emission and immission points, including the site’s geology, the interaction between structure and foundation, and the dynamics due to the supporting structures. Previous experiments by the authors have shown that artificial vibration sources provide a sufficiently accurate simulation of an object’s structural dynamics, such as the floor amplification, as observed during train passages even when very short excitation signals such as those from an impulse generator are used. The steady state of a floor slab excited by an artificial source is normally reached very quickly, as shown by Equation (2) [13]. Given the floor’s typical damping, , the degree of transient response (amplitude relative to the maximum amplitude during steady state excitation) after a certain number of load cycles, , can be calculated as
A concrete floor with 5% damping and a resonance frequency of 30 Hz would thus reach 69% of its maximum vibration amplitude after only 4 cycles of excitation in its eigenfrequency (0.13 s).
This effect can also be demonstrated through in situ measurements. Figure 2 shows the spectral amplification function measured in one-third octave bands of a timber ceiling in a two-story building. The peak represents the ceiling’s low eigenfrequency in the 10 Hz band. It was determined by dividing the measured vibration velocity spectra on the top floor by the measured vibration velocity spectra on the foundation. During the tests, a vibration generator near the building was used to emit a 60 s signal into the ground that corresponded to a sweep from 4–80 Hz as well as white noise in the range 1–80 Hz. Using the same sensor setup, a tram and an impact tester (with an impact duration of 0.1 s) were also used as sources at the foundation. Figure 2 furthermore shows that the amplification factors obtained through artificial impacts reach around 70% of the vibration amplitudes obtained during longer excitations using sweeps or rail-bound vehicles that resemble more of a steady state excitation.
Since rail vehicles, particularly in the proximity of tracks, correspond to a line source rather than a point source, vibrations resulting from artificial point excitation are subject to significantly stronger damping with increasing distance from the source compared to passing trains. Figure 3 illustrates the decay of the measured vibration velocities due to train traffic and artificial sources as a function of distance from the source for two exemplary one-third octave bands, (a) 16 Hz and (b) 32 Hz. The time weighting applied to the raw vibration signals per octave band in this article is Slow (S, time constant = 1 s) unless otherwise stated. The technical specifications of both vibration sources, which were used during the on-site measurements described herein, are given in Table 2.
The amplitudes produced by the vibration generator and the impact tester show a stronger attenuation with distance compared to the amplitudes of the train passages. To compensate this effect and to account for the line source characteristic of a train, the vibration generator is positioned at several points along the track in an interval of meters, as shown in in Figure 1. Using the measured point transfer admittances (), the line transfer admittance () is calculated by numerical integration over the respective train length or line source length, e.g., using Simpson’s rule according to [5], as shown in Equation (3), or the rectangle or trapezoid rule, resulting in units of mm/s/kN. In Equation (3), the source length is represented by subintervals of length , where , and .
2.1.1. Practical Aspects—Approximations of Line Transfer Admittance
In practice, determining line transfer admittances through the integration of multiple point transfer admittances—especially when dealing with numerous measurement points or a long section of track—can be very time-consuming. Based on theoretical considerations, the authors created a simplified method to estimate the line transfer admittance () at an immission point from the maximum point transfer admittance (), as shown in Equation (4). This approach measures the transfer admittance only at the shortest distance between the track and immission point (assuming this yields ), which is multiplied by factor that depends on the geology (which affects material damping), the integration length from to (train length ) and the distance between the emission and immission points (. The values obtained for factor are shown in Figure 4 and are based on the following theoretical considerations:
In a first step, additional point transfer admittances are calculated along the train length using Equation (5) [14], where and are the vibration amplitudes at distance and from the source, respectively, and is the damping. The exponent accounts for the amplitude reduction due geometric damping. The exponent describes the amplitude reduction due to material damping. As a result, material damping increases with frequency, leading to lower frequencies becoming more dominant with increasing distance, while higher frequencies diminish more quickly. In practice, since the contributions of geometric and material damping cannot be determined independently, the simpler form of the equation is typically used, shown in Equation (6). This approach encompasses both the geometric and the material damping within a single frequency-dependent parameter .
In a second step, these calculated point transfer admittances are summed up according to Equation (3), giving a theoretical estimate of . Lastly, was then computed as the inverse of Equation (4) from the estimate of .
Practical experience has shown that the influence of the attenuation exponent diminishes with increasing distance from the track (see Figure 4, in particular, subplot (a)). The authors therefore recommend using = 1 for immission points at larger distances in settings where the exponent is not known, as shown in Figure 5. This pragmatic approach simplifies the modeling of at every single emission point along a railway track in projects with budgetary constraints.
2.2. Immission Prediction
In the second step of the procedure according to the FTA manual [5], the predicted vibration velocity immissions, , in one-third octave bands are obtained by multiplying the line transfer admittance with a force density spectrum () according to Equation (7).
Using these predicted one-third octave vibration spectra, the root mean square (RMS) vibration amplitude (in mm/s) can be calculated by summing over the values in all relevant frequency bands according to Equation (8).
Other immission criteria used in the assessment of vibration impacts such as the KB value (according to national standards in Germany [15]) and vmax, Emax, LA,S, or LA,F, (according to national standards in Austria [16]) can be calculated using the relationships shown in [17]. An excerpt of these is given in Table 3.
2.3. Determination of the Force Density Spectrum
Due to the complexities and the limitations of numerical models described in Section 1 and the rare datasets available to test and validate these theoretical considerations, the authors decided to determine the force density spectra experimentally for train configurations in operation at existing reference tracks using the following procedure:
- At representative measurement points at different distances from the track, train immissions are measured to determine the one-third octave vibration velocities;
- Along the track, artificial vibration excitation is applied at multiple measurement points using a vibration generator or impact tester, e.g., during a line closure or maintenance window. The point transfer admittances, and subsequently, the line transfer admittances to the same measurement points are determined;
- By dividing the vibration immissions from step 1 by the line transfer admittances from step 2, force density spectra for the investigated train configurations are obtained at each measurement point. These can be averaged over several locations to obtain representative results for each train category.
According to the FTA study [5] and the application examples in [7,8,9], this approach fully accounts for soil conditions, and the force density spectrum can also be used for prediction purposes at other locations with comparable train and track conditions. However, the authors show in this study that track stiffness and geological conditions do have a relevant influence on the trains’ force density spectra, but this influence is an order of magnitude smaller than the variance of the vibration velocity immission spectra used in conventional prediction procedures according to [1].
3. On-Site Measurements
This chapter describes the surveys which were carried out to determine the force density spectra of different train configurations at two sections of the Austrian Federal Railways’ line between Vienna and Linz, aiming to capture the influence of track structure, geology, etc. The first experiments were conducted on a slab track at the northern portal of the Wienerwald Tunnel (see Section 3.1), and the second survey on an embankment with ballasted track near Ybbs main station (see Section 3.2). The same train configurations operate on both sections.
3.1. Tunnel Section
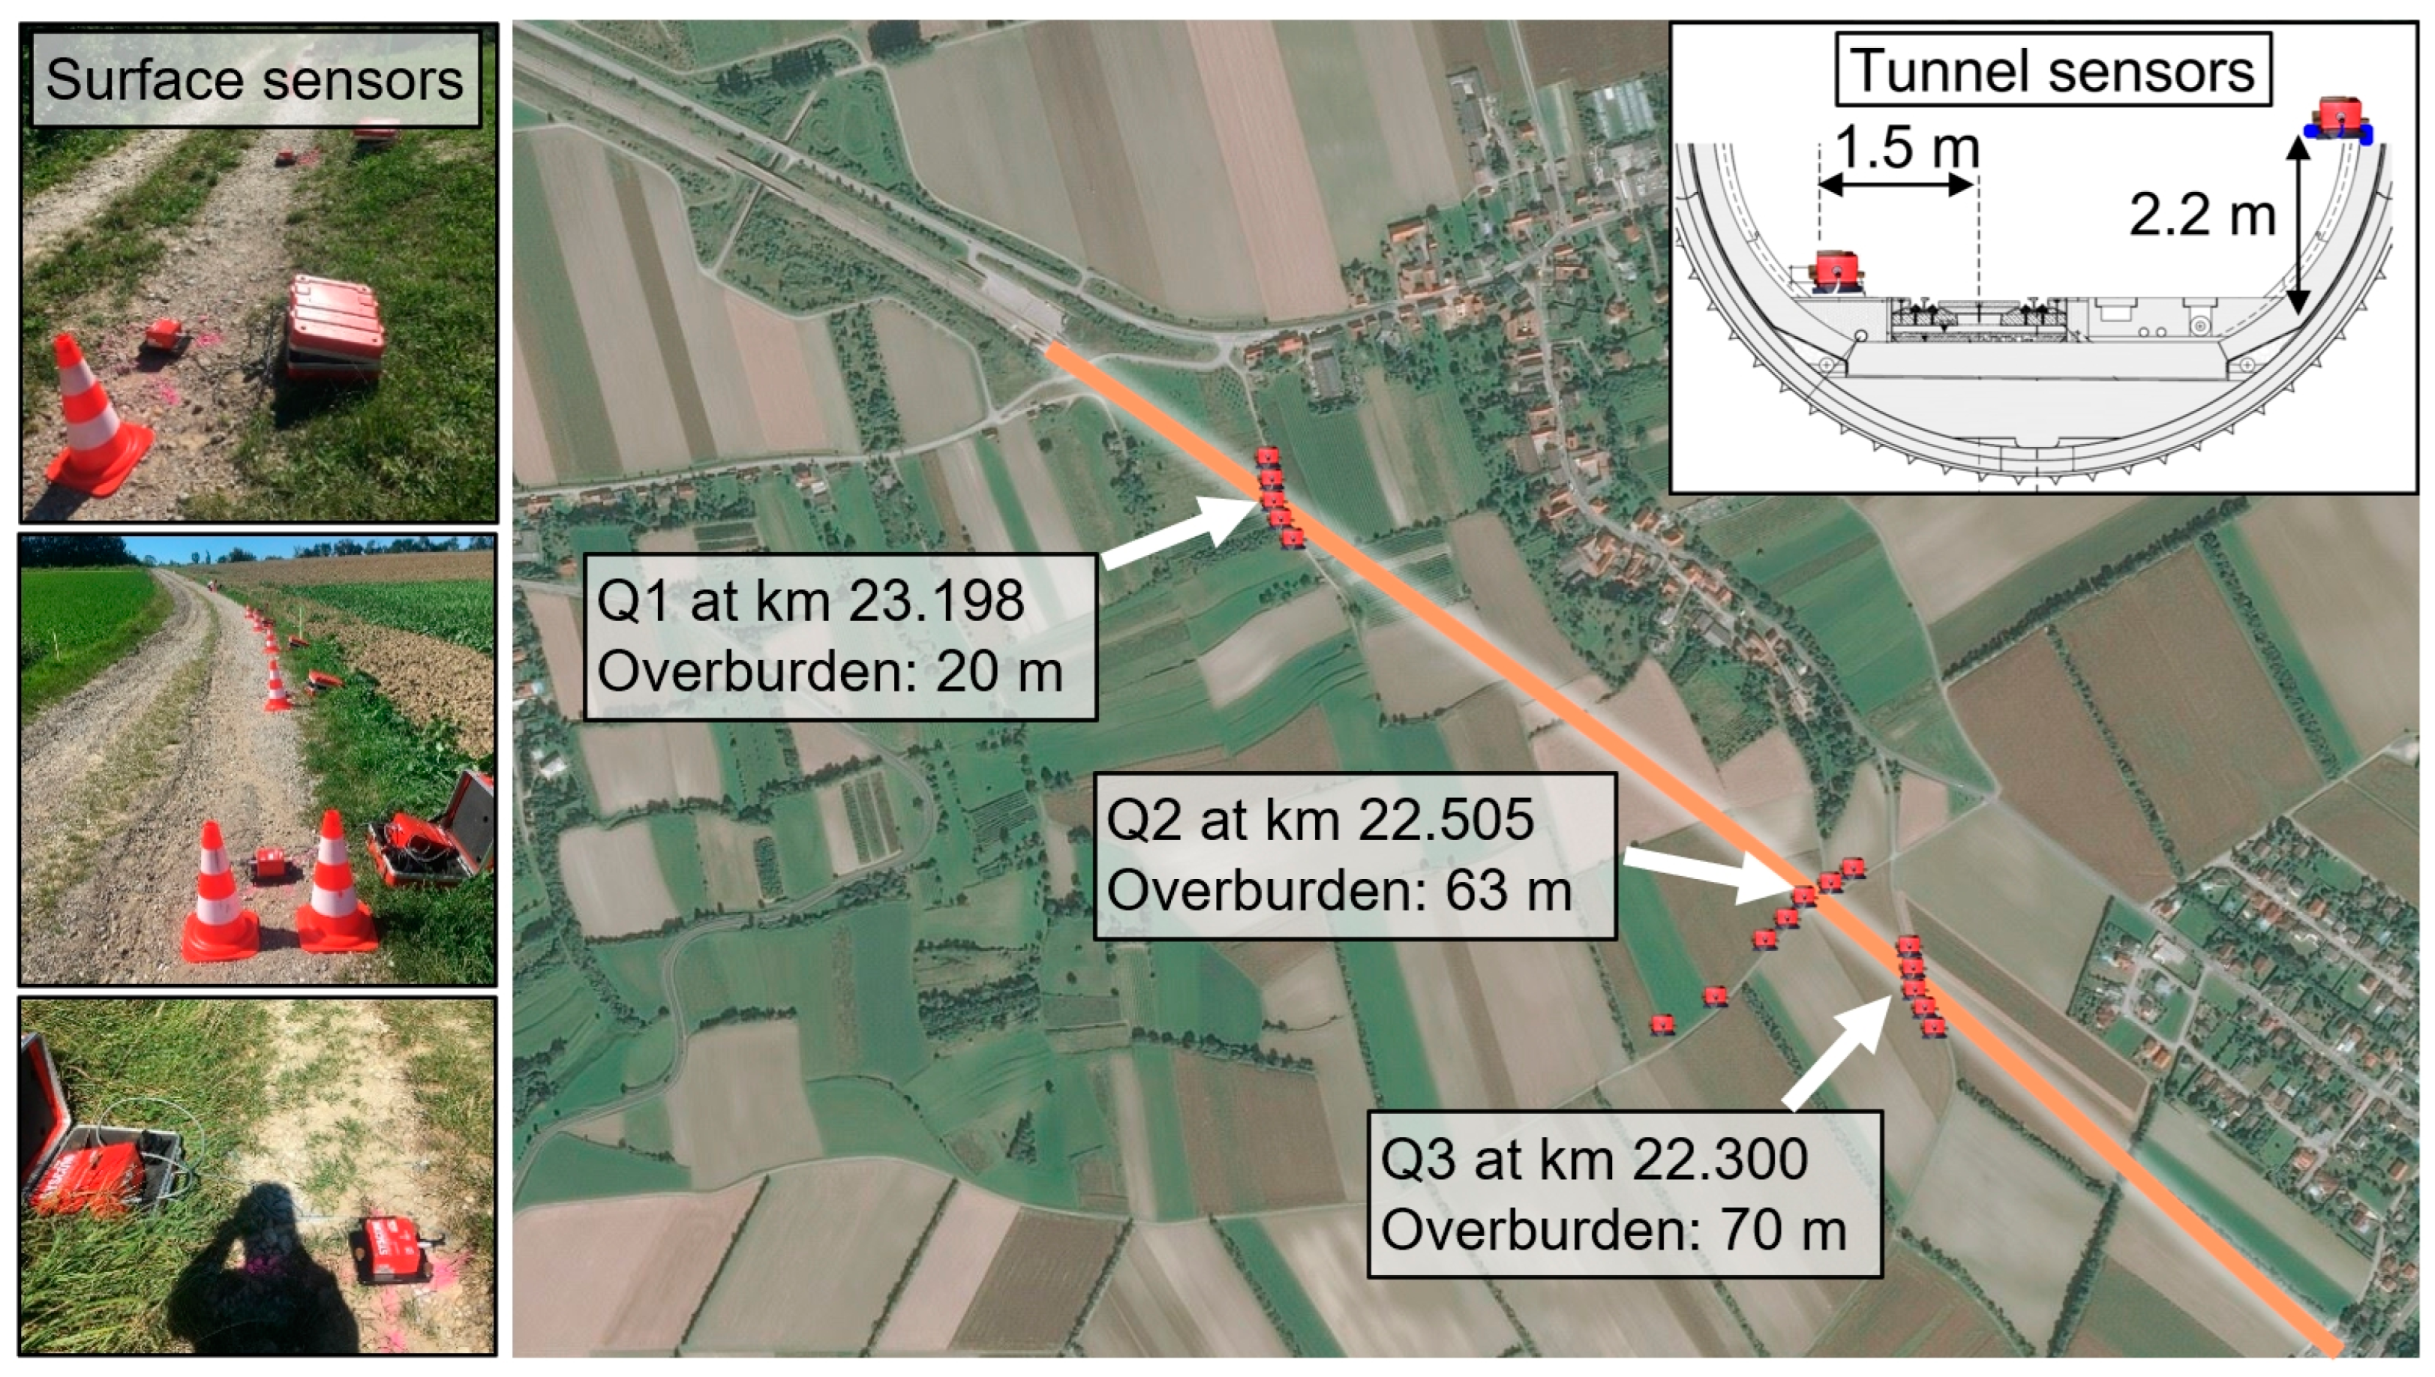
For the investigations on slab track, three tunnel cross-sections, termed Q, along the southern tube of the Wienerwald Tunnel were used (Q1 at km 23.198, Q2 at km 22.505 and Q3 at km 22.300 of the line connecting Vienna to Linz). These cross-sections were chosen to have different overburden depths (20 m, 65 m and 70 m, respectively) and were located within the Molasse basin of the northern Alps. The geology of the test site consists of silt- and clay marlstones (the local velocities of p- and s-waves were not determined in the course of this study). At the surface, several geophones were placed at various lateral distances from the tubes on unpaved roads and footpaths, as shown in the measurement layout in Figure 6, and sensors were installed on the abutment (invert) and tunnel walls inside the tube.
3.1.1. Admittance Measurements
During a nighttime maintenance window, the absorber plates at the three tunnel cross-sections were removed over a length of about 2 m to place a vibration generator (weight: 20 t) and an impact tester as close as possible to the tunnel invert. By using both vibration sources, the differences in the measured transfer admittances per one-third octave band could be studied for different types of excitation.
During excitation, the vibration velocities were measured both on the invert (at distances of 2, 4 and 8 m from the excitation point) and on the tunnel wall using a fixture, and at the surface above the tunnel to calculate the point transfer admittances at various positions.
The vibrotruck’s excitation force was transmitted into the ground through its baseplate, approx. 2 m wide and 1 m long, placed on the ground using hydraulics. Because of the baseplate’s width, which exceeded the track gauge, the space between the invert slab and the tunnel’s structural lining had to be filled using a temporary construction. This consisted of several timber beams (30 × 25 × 150 cm) each weighing approx. 80 kg. Assuming a loading area of 1 m2, an E-modulus of 1000 N/m2 (perpendicular to the fibers), and a truck weight of 20 tons (partially decoupled), a natural frequency for this setup of 100 Hz was estimated. As prior experiments were conducted to determine the resonance effect of the wooden construction, its influence could be eliminated numerically.
For the excitation using the impact tester (falling mass 50 kg, drop height 1.25 m), multiple impacts were induced into the ground at the same cross-sections where the vibrotruck was positioned. The impacts took place on the tunnel’s concrete invert without using the wooden construction, and the measured forces were used to calculate the point transfer admittance to all geophones at the same cross-section. The final transfer admittance was obtained by averaging over up to 30 impacts.
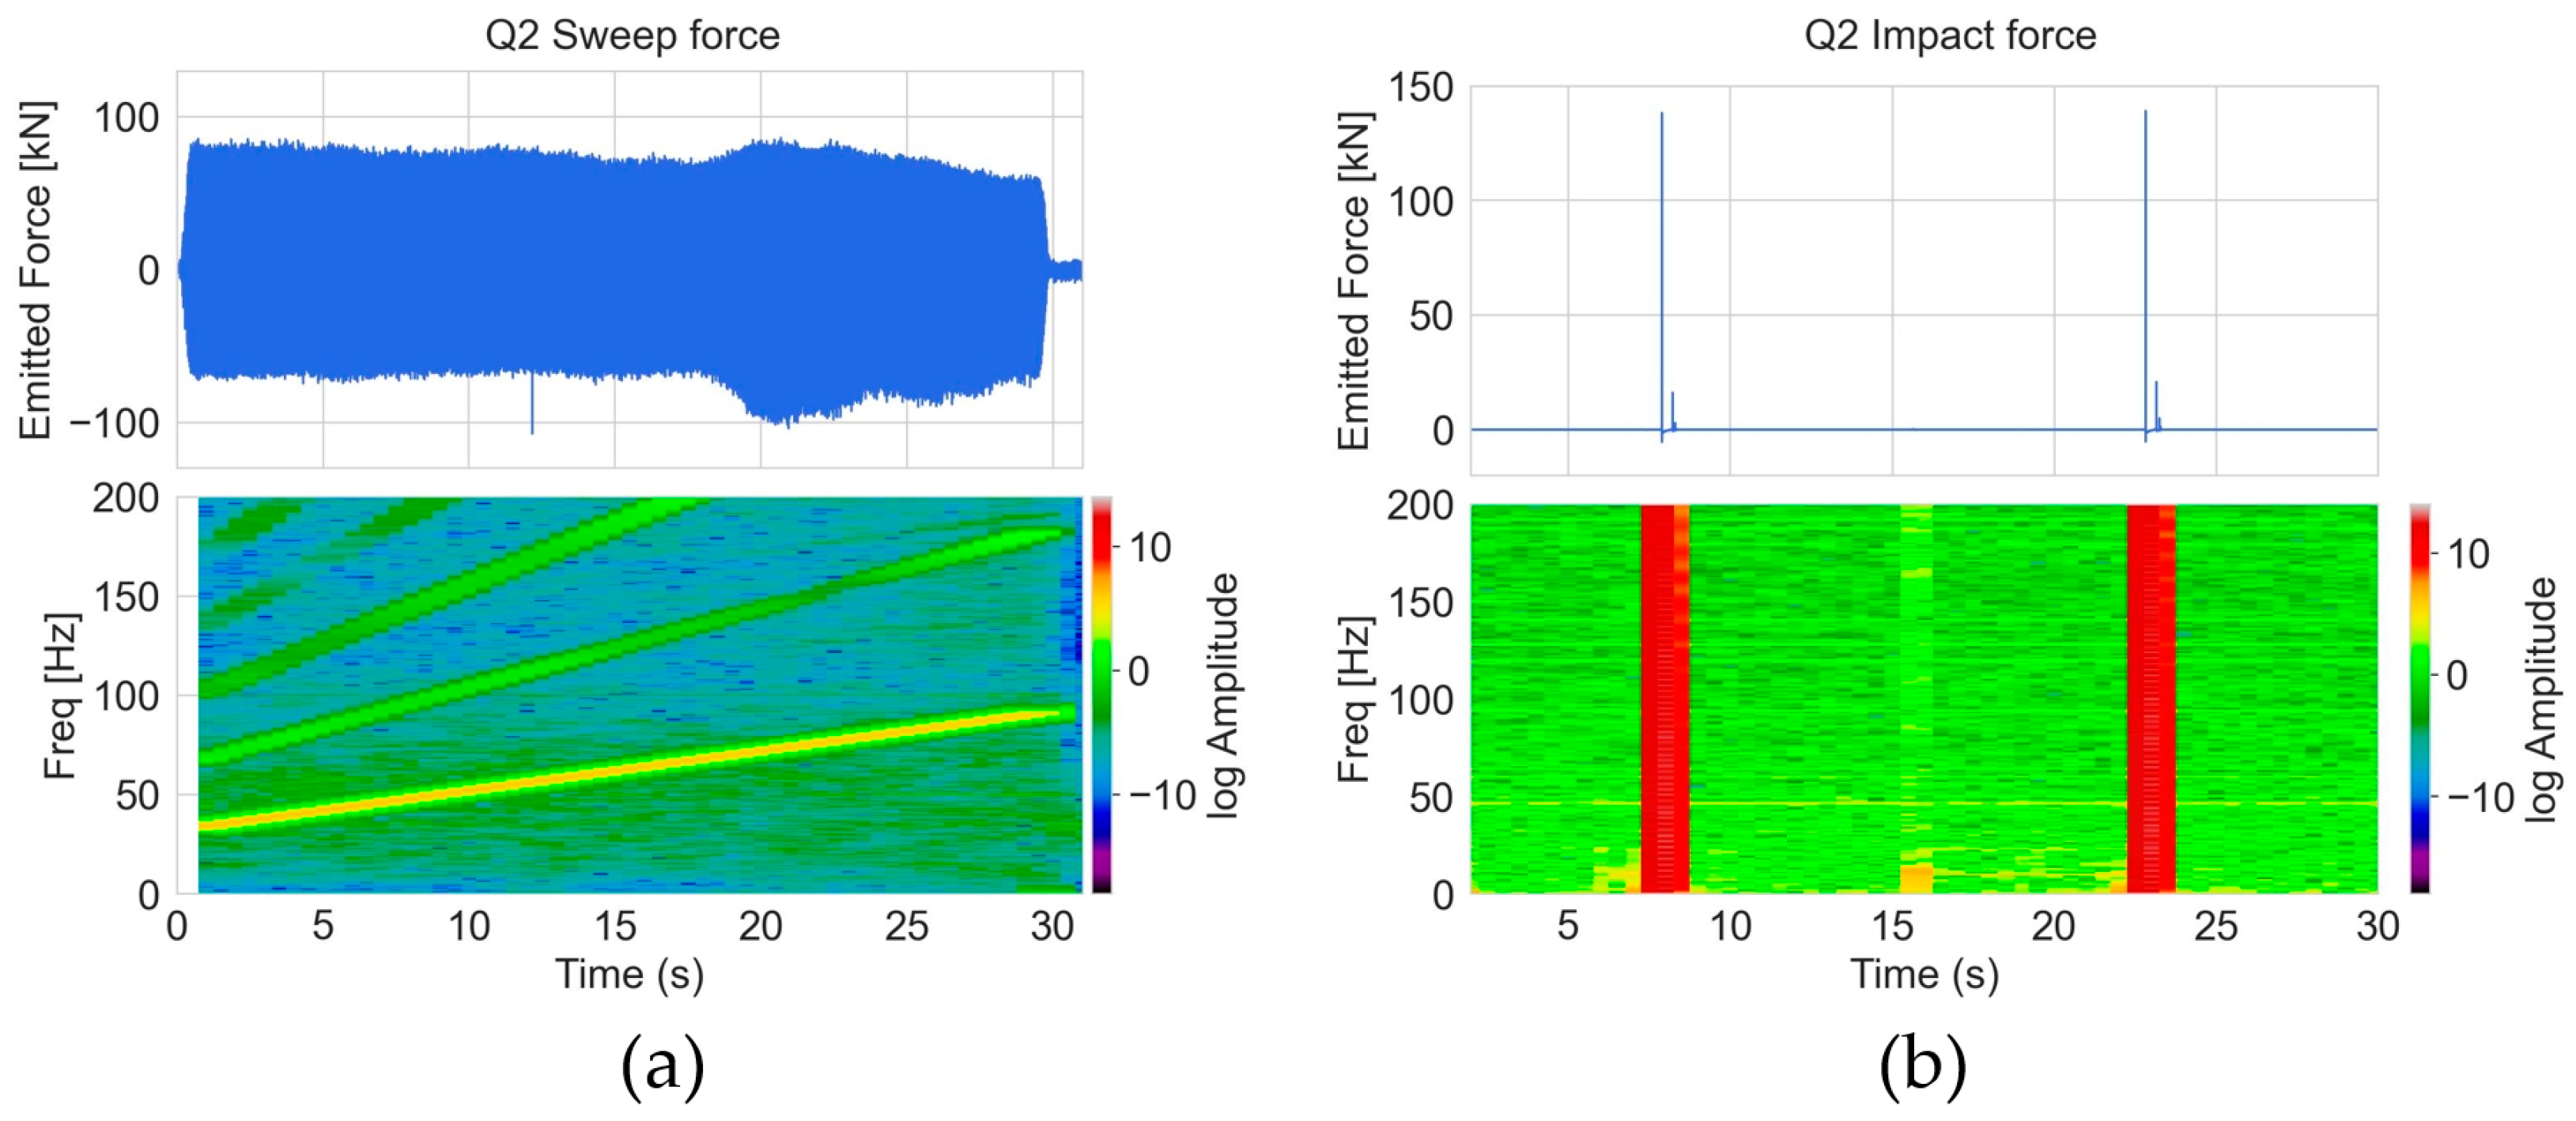
For the subsequent analysis, one-third octave spectra were used for both force and vibration velocity, with the time weighting Slow ( = 1 s). Figure 7 shows the time history and spectrogram of the raw force signals measured during the excitation inside the tunnel with the truck (subplot (a)) and the impact tester (subplot (b)). Figure 8 shows the measured vibration velocity signals resulting from the impact tester (subplots (b) and (d) and the vibrotruck subplots (a) and (c)) at radial distances of 2 m and 97 m from the centerline of the track, recorded on the tunnel invert and at the surface above the tunnel, respectively. As can be seen in both, the raw time signal and the spectrogram, the impacts of the falling mass are clearly discernible even at considerable distances from the tunnel.
Figure 9 compares the point transfer admittances computed when using impulse excitation and when using sweep excitation at various receiver points—both underground and at the surface—around cross-section Q2. Excellent agreement between the two vibration sources can be observed across the entire investigated frequency range. The data from the impact tester were analyzed down to the 4 Hz band, while the data from the sweep excitation were available at bands of 8 Hz and above.
3.1.2. Immission Measurements
After completing the admittance measurements, the tunnel sensors (abutment and walls) remained in place for 4 weeks until the next maintenance window. During this period, they recorded the immissions of all trains passing through the tunnel. This yielded over 3000 train passages (including approximately 1000 high-speed long-distance trains, about 800 regional trains and over 600 freight trains). The sensors at the surface were reinstalled repeatedly for a few days at the same locations as during the admittance survey in order to simultaneously capture surface immissions of the same trains. This yielded records for 42 high-speed long-distance trains, 22 regional trains and 18 freight trains, the exact number depending on the sensor location and signal–noise ratios.
To show some examples, Figure 10 summarizes the vibration velocity immission spectra at the abutment sensor Q1 for the most frequent train types. The recorded passages were divided into six speed classes per train type (in km/h: <90, 110–130, 130–150, 150–170, 170–190 and 190–240). The solid lines in Figure 10 indicate the mean immission spectrum per speed class, and the surrounding hatched area represents the range between the 5th and 95th percentile of the respective category. The number of trains per category are given in brackets.
3.1.3. Force Density Spectra
Using the admittance and immission measurements, the force density spectra were determined for each train class as described in Section 2.3. Point transfer admittances of the relevant receiver points were converted to line transfer admittances using correction factors according to the relationship described in Section 2.1.1. Figure 11 shows the resulting force density spectra in root-mean-square amplitudes for different train types along the tunnel section. The solid lines indicate the mean force per speed class, and the surrounding hatched area represents the range between the 5th and 95th percentiles of the respective category. Again, the recorded number of trains per class is shown in brackets.
3.2. Embankment Section
Using the same railway line between Vienna and Linz as in Section 3.1, a section of ballasted track was chosen in the vicinity of Ybbs main station (approx. at km 106.0), where the rails run on an embankment. The site is also located within the Molasse zone, but due to its immediate proximity to the river Danube, recent fluvial sediments constitute the near-surface layers. The track structure and soil dynamics differ significantly from those of the tunnel survey, but the same trains run on both sections. The layout of the vibration excitation and measurement points are shown in Figure 12.
3.2.1. Admittance Measurements Using the Impact Tester
During a scheduled maintenance closure, the impact tester (falling mass 50 kg, drop height 1.25 m) was placed at 11 positions directly on the ballasted track. Multiple impacts were induced on the ballast between the concrete sleepers. In this survey, the use of a vibration generator was inhibitive due to practical and budgetary limitations.
During excitation, the generated vibration velocities were recorded at all geophone points marked in Figure 12, at distances ranging from 13–75 m to track no. 3. Using the measured forces and immissions, the point transfer admittances (average over up to 15 impacts) were determined for each receiver point and integrated to obtain the line transfer admittances. A comparison between the line transfer admittance, , computed through integration of measured and the line transfer admittance obtained through the simplified approach described in Section 2.1.1 is shown in Figure 13. The diagram shows that a very good approximation of can be obtained from a single point transfer admittance measurement, suggesting that the number of survey points can be reduced significantly without information loss.
3.2.2. Immission Measurements
The geophones were re-installed at the same locations 4 weeks later to capture 56 high-speed long-distance trains and 18 freight trains (note that the latter operated on track no. 6 and no. 8, while all long-distance passenger trains ran on track no. 3 and no. 4, as shown in Figure 12).
Figure 14 summarizes the vibration velocity spectra at a distance of 12 m from track no. 3 for the most frequent train categories. The solid lines indicate the mean immission spectra, and the surrounding hatched area represents the range between the minimum and maximum immissions (percentiles were not used due to the considerably smaller number of available train records compared to the tunnel section). As the recorded train velocities were uniform throughout the day of the survey, Figure 14 could not be split into different velocity classes. The amplitudes of the freight trains were corrected for the extra distance between the sensor and track no. 6 and no. 8. Vibration amplitudes at 16 Hz are considerable at this track section compared to the tunnel immissions in Section 3.1.2, where vibrations below 31.5 Hz are negligible. Overall, the trends observed for each train category are the same as on the tunnel track: Both Westbahn and ICE repeatedly produce very similar spectra with a small divergence, while freight trains and Railjets show a considerable spread between the minimum and maximum amplitude in each one-third octave band. One reason for this is the disposition of vehicles along the investigated line: While only a limited number of different Westbahn and ICE trains pass the site, the Railjet vehicle pool is much bigger, and the types and compositions of freight trains are much more varied than for passenger trains. Another reason could be that both ICE and Westbahn are articulated multiple-unit trains, while Railjets are locomotive-hauled push–pull high-speed trains, leading to more varied carriage behavior. The unsprung masses of the different train types and the stiffnesses of the primary suspensions or the under sleeper pads were unknown and could thus not be investigated as possible further causes for the observed differences.
3.2.3. Force Density Spectra
From the admittance and immission measurements, the force density spectra were determined, as described in Section 2.3. Figure 15 shows the results for different train types on the embankment track. The solid lines indicate the average spectrum and the surrounding hatched area the range between the minimum and maximum amplitudes for each class.
3.3. Comparison with Other In Situ Studies
When comparing the force density spectra obtained during this study, as shown in Figure 16, the following trends can be observed: Amplitudes in the mid-frequency range, around 32 Hz, appear similar for each train class, independent of the site. At low frequencies (one-third octave bands below 32 Hz), the force density spectra were greater on the ballasted track, which illustrates the effect of track structure, soil dynamics, track irregularities and the quasi-static effect of the moving loads, which appear to be more dominant on the embankment than on tunnel tracks. On the other hand, the effect of rail roughness—manifested at frequencies above 32 Hz—is more dominant on slab tracks, as also indicated by theoretical considerations in [5,7]. Furthermore, the vehicle–track resonance caused by soft rail pads on slab track must be considered [18].
In addition to the force density spectra measured during this study, the results for an ICE train from the H2020 project SILVASTAR [11] were included in Figure 16. These spectra were converted from their original RMS vibration velocities to slow-weighted values using factor 1.7 (see Table 3), which stems from empirical correlations described in [17]. In terms of the overall profile, the ICE shows a very similar spectrum to the Westbahn trains and correlates very well with regard to amplitude and trend to the author’s experimental findings.
4. Summary
Train immissions and point transfer admittances were measured on two different sections of the same railway line using artificial vibration sources, and subsequently, line transfer admittances and force density spectra were computed for the most common train types in operation, including high-speed and freight trains. A method has been introduced that significantly reduces the effort required for determining the line transfer admittances through the integration of multiple point transfer admittances, which can be estimated from the maximum point transfer admittance measured at a site. This requires the in situ measurement of only one point transfer admittance, rather than dozens over the entire length of the trains of interest.
While the same train configurations operated at both locations at similar speeds, the two survey points differed significantly in terms of track alignment (tunnel vs. embankment), track structure (slab track vs. ballasted track) and soil dynamics (Molasse Zone vs. recent river sediments). These differences are reflected in the computed trains’ force density spectra. Despite the theoretical considerations in the literature e.g., in [5], the empirical force density spectra determined in the course of this study do not eliminate the effect of train–track interaction and thus do not present a site-independent train emission spectrum. The fact that a site-dependent train–track interaction will always occur needs to be taken into account when aiming to use force density spectra for prediction purposes and applying them to geologies or track structures that diverge from the ones they were measured on. The authors therefore want to point out that track stiffness and geological conditions, as shown in [7,8], do have a relevant influence on the emitted force density spectrum by different trains, but this influence is an order of magnitude smaller than the variance of vibration velocity spectra used as source spectra in conventional prediction procedures according to [1], as illustrated through the immission spectra recorded for over 3000 trains on the tunnel invert over 4 weeks.
The experimental results from this study were compared to findings from a theoretical investigation [11], which used numerical simulations to compute site-independent force density spectra for common train categories. As the ICE was available in both studies on ballasted track, this train was used for direct comparison and showed very good agreement over a broad frequency range. The peak in the low frequency bands of 16–20 Hz (attributed to quasi-static effects of the moving loads) as well as the dip in the 32 Hz band were confirmed. Furthermore, the higher force densities in the bands above 40 Hz, attributed to rail roughness, were also visible in both studies.
Author Contributions
Conceptualization and methodology, B.T.; writing—original draft preparation, B.T.; writing—review and editing, K.A.; visualization, K.A.; On-site Measurements, All; data processing, K.A., M.L. and M.O.; validation and review, R.F.; project administration, M.L. and M.O. All authors have read and agreed to the published version of the manuscript.
Funding
This research received no external funding.
Institutional Review Board Statement
Not applicable.
Informed Consent Statement
Not applicable.
Data Availability Statement
The data presented in this study are available on request from the corresponding author.
Acknowledgments
The authors would like to thank the Austrian Federal Railways (ÖBB) for providing the opportunity to carry out the surveys presented herein.
Conflicts of Interest
Author Benedikt Tappauf, Marianne Legenstein and Marlene Ofner were employed by the company Benedikt Tappauf GmbH. Author Karoline Alten was employed by the company AIT Austrian Institute of Technology GmbH. The remaining authors declare that the research was conducted in the absence of any commercial or financial relationships that could be construed as a potential conflict of interest.
References
- Verein Deutscher Ingenieure e.V., Guideline VDI 3837, Ground-borne vibration in the vicinity of at-grade rail systems—Spectral prediction method. Düsseldorf, January 2013. (In German)
- Rücker, W.; Auersch, L. A User-Friendly Prediction Tool for Railway Induced Ground Vibrations: Emission—Transmission—Immission. In Noise and Vibration Mitigation for Rail Transportation System, Proceedings of the 9th International Workshop on Railway Noise, Munich, Germany, 4–8 September 2007; Springer: Berlin/Heidelberg, Germany, 2008; Volume 99. [Google Scholar] [CrossRef]
- Lopes, P.; Costa, P.A.; Ferraz, M.; Calçada, R.; Cardoso, A.S. Numerical modelling of vibrations induced by railway traffic in tunnels: From the source to the nearby buildings. Soil Dyn. Earthq. Eng. 2014, 61–62, 269–285. [Google Scholar] [CrossRef]
- Kuppelwieser, H.; Ziegler, A. A tool for predicting vibration and structure-borne noise immissions caused by railways. J. Sound Vib. 1996, 193, 261–267. [Google Scholar] [CrossRef]
- Government. Office of the Federal Register, National Archives and Records Administration. “Govt. Manual 2018—Federal Transit Administration: Transit Noise and Vibration Impact Assessment Manual”. September, 2018. Available online: https://www.transit.dot.gov/sites/fta.dot.gov/files/docs/research-innovation/118131/transit-noise-and-vibration-impact-assessment-manual-fta-report-no-0123_0.pdf (accessed on 1 January 2024).
- Nelson, J.T.; Saurenman, H.J. A Prediction Procedure for Rail Transportation Ground-borne Noise and Vibration. Transp. Res. Rec. 1987, 1143, 26–35, Transportation Research Board. Available online: http://onlinepubs.trb.org/Onlinepubs/trr/1987/1143/1143-005.pdf (accessed on 1 January 2024).
- Kuo, K.; Verbraken, H.; Degrande, G.; Lombaert, G. Hybrid predictions of railway induced ground vibration using a combination of experimental measurements and numerical modelling. J. Sound Vib. 2016, 373, 263–284. [Google Scholar] [CrossRef]
- Verbraken, H.; Lombaert, G.; Degrande, G. Verification of an empirical prediction method for railway induced vibrations by means of numerical simulations. J. Sound Vib. 2011, 330, 1692–1703. [Google Scholar] [CrossRef]
- Lombaert, G.; François, S.; Verbraken, H.; Degrande, G.; Thompson, D. Numerical, experimental, and hybrid methods for the prediction of railway-induced ground vibration. In Proceedings of the 9th International Conference on Structural Dynamics, EURODYN 2014, Porto, Portugal, 30 June–2 July 2014; ISBN 978-972-752-165-4. [Google Scholar]
- Auersch, L. Dynamics of the railway track and the underlying soil: The boundary-element solution, theoretical results and their experimental verification. Veh. Syst. Dyn. 2005, 43, 671–695. [Google Scholar] [CrossRef]
- Reumers, P.; Degrande, G.; Lombaert, G.; Seyfaddini, F.; Herremans, G.; Ntotsios, E.; Thompson, D.; Nélain, B.; Bouvet, P.; Fröhling, B.; et al. Validation of the Prototype Vibration Prediction Tool Against Documented Cases. SILVARSTAR project GA 101015442, Deliverable D1.3, Report to the EC, June 2022. Available online: https://rail-research.europa.eu/wp-content/uploads/2022/12/SR_SV-WP01-D-S2R-003-01_-_D1.3_Validation_of_the_prototype_vibration_prediction_.pdf (accessed on 1 March 2024).
- Auersch, L.; Said, S.; Müller, R. Measurements on the vehicle-track interaction and the excitation of railway-induced ground vibration. Procedia Eng. 2017, 199, 2615–2620, ISSN 1877-7058. [Google Scholar] [CrossRef]
- Chopra, A.K. Dynamics of Structures: Theory and Applications to Earthquake Engineering, 5th ed.; Pearson: Bloomington, MN, USA, 2017. [Google Scholar]
- Ziegler, A. Bauwerksdynamik und Erschütterungsmessungen; Springer: Berlin/Heidelberg, Germany, 2017; (eBook); ISBN 978-3-658-16054-8. [Google Scholar] [CrossRef]
- DIN 4150-2:1999-06; Erschütterungen im Bauwesen—Teil 2: Einwirkungen auf Menschen in Gebäuden. Deutsches Institut für Normung e.V.: Berlin, Germany, 1986; (In German). [CrossRef]
- S 9012: 2016-12; Beurteilung der Einwirkung von Schwingungsimmissionen des Landgebundenen Verkehrs auf den Menschen in Gebäuden—Schwingungen und Sekundärer Luftschall. Austrian Standards International, Standard ÖNORM: Vienna, Germany, 2016. (In German)
- Tappauf, B.; Tappauf, C.; Cik, M.; Lercher, P.; Flesch, R. The use of vibration health response information in the framework of environmental health impact assessments: Technical issues of implementation and interpretation. In European Conference on Noise Control; EuroNoise: Maastricht, The Netherlands, 2015; pp. 589–594. [Google Scholar]
- Auersch, L. Simple and fast prediction of train-induced track forces, ground and building vibrations. Railw. Eng. Sci. 2020, 28, 232–250. [Google Scholar] [CrossRef]
Figure 1.
Schematic explanation of the admittance-based immission prediction procedure.

Figure 2.
Floor amplification spectra using different means of vibration excitation.

Figure 3.
Decay of peak vibration amplitudes with distance at (a) 16 Hz and (b) 32 Hz when measuring line sources (trains) and artificial point sources.
Figure 3.
Decay of peak vibration amplitudes with distance at (a) 16 Hz and (b) 32 Hz when measuring line sources (trains) and artificial point sources.

Figure 4.
Factor to estimate the line transfer admittance from the maximum point transfer admittance at an immission point depending on the attenuation coefficient, , the distance from the track, D, and train length, L. (a) When assuming a constant L = 200 m and (b) assuming a constant D = 10 m.
Figure 4.
Factor to estimate the line transfer admittance from the maximum point transfer admittance at an immission point depending on the attenuation coefficient, , the distance from the track, D, and train length, L. (a) When assuming a constant L = 200 m and (b) assuming a constant D = 10 m.

Figure 5.
Factor to estimate the line transfer admittance from the maximum point transfer admittance as a function of the distance from the track, D, and train length, L, when using an attenuation coefficient = 1.
Figure 5.
Factor to estimate the line transfer admittance from the maximum point transfer admittance as a function of the distance from the track, D, and train length, L, when using an attenuation coefficient = 1.

Figure 6.
Measurement layout of surface sensors (red dots on the map) along the tunnel track (solid orange line). Photo inserts on the left show the surface sensors, and the schematic insert on the right shows the tunnel sensors with their respective distances from the center of the track/rail head.

Figure 7.
Force signals emitted during the artificial excitation at Q2, time histories at the top and spectrograms at the bottom, (a) using the vibrotruck’s sweep (in this example, 32–92 Hz), (b) using the impulse generator.
Figure 7.
Force signals emitted during the artificial excitation at Q2, time histories at the top and spectrograms at the bottom, (a) using the vibrotruck’s sweep (in this example, 32–92 Hz), (b) using the impulse generator.

Figure 8.
Vibration velocity signals measured during the vibrotruck sweep excitation (a,c) and the excitation during impact testing (b,d). (a,b) show raw time signals and spectrograms of vibrations velocities 2 m from the source; (c,d) show raw time signals and spectrograms of vibrations velocities 97 m from the source.

Figure 9.
Point transfer admittance spectra at different sensor points in the tunnel and at the surface (distance from source given in brackets) when using different excitation sources at Q2.
Figure 9.
Point transfer admittance spectra at different sensor points in the tunnel and at the surface (distance from source given in brackets) when using different excitation sources at Q2.

Figure 10.
Examples of vibration velocity spectra in one-third octave bands for different train types recorded at the abutment sensors over 4 weeks inside the tunnel at Q1.
Figure 10.
Examples of vibration velocity spectra in one-third octave bands for different train types recorded at the abutment sensors over 4 weeks inside the tunnel at Q1.

Figure 11.
Force density spectra of different train categories, depending on their velocity.

Figure 12.
Measurement layout along the embankment track including an insert showing the impact tester.
Figure 12.
Measurement layout along the embankment track including an insert showing the impact tester.

Figure 13.
Measured point transfer admittances at MP1 (dashed lines) and computed line transfer admittances when integrating over all measured and when using the simplified method, which only requires measurement of .
Figure 13.
Measured point transfer admittances at MP1 (dashed lines) and computed line transfer admittances when integrating over all measured and when using the simplified method, which only requires measurement of .

Figure 14.
Examples of the immission spectra for different train categories recorded 12 m from the embankment track.
Figure 14.
Examples of the immission spectra for different train categories recorded 12 m from the embankment track.

Figure 15.
Force density spectra for different trains on the embankment track.

Figure 16.
Comparison of the average force density spectra measured for different train types on the embankment and tunnel tracks, as well as a spectrum computed in the SILVASTAR project for an ICE on ballasted track.
Figure 16.
Comparison of the average force density spectra measured for different train types on the embankment and tunnel tracks, as well as a spectrum computed in the SILVASTAR project for an ICE on ballasted track.


Table 1.
The most common train types in operation in Austria’s railway network and their nominal characteristics at the investigated sites.
Table 1.
The most common train types in operation in Austria’s railway network and their nominal characteristics at the investigated sites.
| Train | Vehicle Type | Max. Velocity (km/h) | Typical Train Length (m) | Average Tonnage (t) |
|---|---|---|---|---|
| Railjet/Railjet Express | High-speed passenger train | 230/230 | 206/411 | 480/960 |
| ICE | High-speed passenger train | 230 | 449 | 186 |
| Cityjet | Regional passenger train | 160 | 76 | 156 |
| Nightjet | Long-distance couchette train, new generation | 200 | 300 | 630 |
| Euronight | Long-distance couchette train, old generation | 200 | 125 | 300 |
| Westbahn | High-speed double-decker passenger train | 200 | 150 | 387 |
| Freight | Freight train | 100 | 575 | 1175 |
Table 2.
Technical specifications of the artificial vibration sources used in this study.
| Parameter | Vibration Generator | Impact Tester |
|---|---|---|
| Peak excitation | 225 kN | 600 J |
| Frequency bands | 1–250 Hz | 4–315 Hz |
| Baseplate size | 2 m2 | 0.03 m2 |
| Actuator mass | 3505 kg | 50 kg |
Table 3.
Empirical factors for converting vibration parameters for train passbys.
| Start Parameter | Target Parameter | Conversion Factor |
|---|---|---|
| RMSpassby | Slow weighted RMS(τ=1 s) | 1.7 |
| RMSpassby | Fast weighted RMS(τ=0.125 s) | 2.2 |
| RMSpassby | vmax | 5 |
Disclaimer/Publisher’s Note: The statements, opinions and data contained in all publications are solely those of the individual author(s) and contributor(s) and not of MDPI and/or the editor(s). MDPI and/or the editor(s) disclaim responsibility for any injury to people or property resulting from any ideas, methods, instructions or products referred to in the content. |
© 2024 by the authors. Licensee MDPI, Basel, Switzerland. This article is an open access article distributed under the terms and conditions of the Creative Commons Attribution (CC BY) license (https://creativecommons.org/licenses/by/4.0/).
Share and Cite
MDPI and ACS Style
Tappauf, B.; Alten, K.; Legenstein, M.; Ofner, M.; Flesch, R. Experimentally Determined Force Density Spectra for Admittance-Based Vibration Predictions along Railways. Appl. Sci. 2024, 14, 2557. https://doi.org/10.3390/app14062557
AMA Style
Tappauf B, Alten K, Legenstein M, Ofner M, Flesch R. Experimentally Determined Force Density Spectra for Admittance-Based Vibration Predictions along Railways. Applied Sciences. 2024; 14(6):2557. https://doi.org/10.3390/app14062557
Chicago/Turabian StyleTappauf, Benedikt, Karoline Alten, Marianne Legenstein, Marlene Ofner, and Rainer Flesch. 2024. "Experimentally Determined Force Density Spectra for Admittance-Based Vibration Predictions along Railways" Applied Sciences 14, no. 6: 2557. https://doi.org/10.3390/app14062557
Note that from the first issue of 2016, this journal uses article numbers instead of page numbers. See further details here.