
Energy Management Strategy for DC Micro-Grid System with the Important Penetration of Renewable Energy


Department of Electrical, Electronic and Computer Engineering, Cape Peninsula University of Technology, Cape Town 7535, South Africa
*
Author to whom correspondence should be addressed.
Appl. Sci. 2024, 14(6), 2659; https://doi.org/10.3390/app14062659
Submission received: 12 February 2024
/
Revised: 8 March 2024
/
Accepted: 18 March 2024
/
Published: 21 March 2024
(This article belongs to the Special Issue Renewable Energy Production and Applications: Latest Advances and Prospects)
Abstract
:This paper presents an energy management strategy using a Stateflow controller related to DC microgrids with the important penetration of renewable energy. The increase in world electricity demand is one of the principal drivers of the exhaustion of fossil fuels and increased greenhouse gas emissions. To solve these problems, several countries have adopted actions for widespread renewable energy deployment, which includes wind energy, solar power, biomass power, tidal, and hydropower. These sources are considered as significant in delivering clean energy and reducing greenhouse gas emissions for sustainable improvement. As these sources play an increasingly vital role in the global energy landscape, the efficient management of these intermittent sources is essential for grid stability and sustainability. This paper aimed to develop an energy management strategy for DC microgrids to supply power to a DC microgrid system. The main objective of this paper was to implement an energy management system to ensure the proper operation of DC microgrid systems utilizing Simulink blocks available in MATLAB/Simulink 2020b software. The simulation results demonstrated that the developed energy management algorithm was unconditionally reliable, ensuring the proper operation of the microgrid systems. Additionally, the results demonstrated that the energy management strategy exhibited robust performance across different scenarios, effectively balancing energy generation and consumption while ensuring the reliable operation of the microgrid system. Moreover, the developed algorithm model presents another advantage, as it enables users to access and to change any control parameters within the DC microgrid. By comparing these results with the literature, the developed energy management algorithm provides safety and the automatic control of the microgrid.
1. Introduction
The augmentation of world electricity requirements is one of the principal drivers of the exhaustion of fossil fuels and expanded greenhouse gas emissions. To solve these problems, several countries have adopted actions for the widespread deployment of renewable energy sources, which include wind energy, solar power, biomass energy, and tidal and hydropower [1]. These sources are considered as significant in delivering clean energy and reducing greenhouse gas emissions for sustainable development [2]. Topić et al. reported that in 2016, a total of 921 GW was achieved from the deployment of renewable energy resources, excluding hydropower, which resulted in increased awareness of climate change. These renewable energy sources are often connected to the conventional power system through the distribution network near the loads; thus, no transmission system is needed. In such a case, these are referred to as distributed generation systems [3]. Distributed generation can negatively impact the performance of the distribution network as the distribution network will no longer operate with a unidirectional power flow pattern [4].
The issues related to a bidirectional power flow pattern are intensified by increasing the levels of the distributed generation systems in the distribution network. Some of the known issues affect power quality and desensitized relays, cause increased fault currents, and the increased maintenance of the equipment utilized, and even affect a large portion of the distribution grid [5]. To address these issues, microgrids are used as platforms to integrate distributed generation systems, as they provide significant benefits to end-users and to the distribution network. A microgrid can minimize disruption, lower costs, and optimize the size of the system components, thereby reducing operation costs and ensuring access to affordable, reliable, and sustainable forms of energy [6]. Besides distributed generation systems, a typical microgrid consists of a controllable load and an energy storage system. An energy storage system refers to a device that converts energy from one form (usually electrical energy) to a storable form, and then, the stored energy can be converted back into electricity when required. The utilization of energy storage systems, especially in renewable microgrids, has a significant impact on the reliability of the electric power as it can smooth the power fluctuation, reduce power quality problems, control the microgrid frequency and voltage, deliver initial energy when there is a transition between grid connection and islanded mode operation of microgrids, provide ride-through capability in the case of dynamic variations in intermittent energy sources, and enable distributed generations to operate as dispatchable units [7,8].
Three different types of microgrids exist, namely, the AC microgrid, the DC microgrid, and the hybrid microgrid [9]. This paper considers a DC microgrid. The rapid increase in renewable energy sources requires a robust energy management system to connect these renewable energy sources, including energy storage systems. Based on the inexact models, deterministic estimations, and balance conditions, different researchers have reported findings which focus on enhancing the efficient action and operation of EMS, which requires much more improvement. Thus, new research needs to be performed to improve the reliability of microgrid systems. The aim of this paper was to develop an energy management system for DC microgrids, which contributes to an increase in the deployment of renewable energy sources (RESs). The principal contribution of this research was the implementation of an energy management strategy that attempts to ensure the proper operation of a DC microgrid system with the deep penetration of renewable energy sources. The developed DC microgrid model was created using MATLAB/Simulink software. The rest of the paper is presented as follows. The concept of microgrid systems is presented in Section 2. Section 3 discusses the mathematical modeling of the system components. In Section 4, the developed energy management system is presented. Section 5 explores and evaluates the simulation results of the developed method, and finally, Section 6 presents the conclusion of the paper.
2. Concept of Micro-Grid Systems
A typical microgrid refers to a set of distributed generation (DG) systems based on renewable and/or nonrenewable sources, incorporating an energy storage system (ESS) and local controllable loads, generally connected to the distribution system [10]. It may operate in both grid connection as well as isolated mode depending on the load condition. Microgrids can be grouped into diverse categories depending on the location (such as campus, military, residential, commercial, and industrial), size (such as small, medium, and large scale), and application (such as premium power, resilience-oriented, and loss mitigation) [11].
A microgrid involves the integration of several distributed energy sources; the power from these sources is collected, converted, and distributed according to the load requirements. A control system is needed to ensure the proper operation of the microgrid when the power electronics interface with it to form a single unit. The control system is essential; besides providing flexibility, it also preserves the specific energy production and the power quality [12]. Each of these three sorts of microgrid presents advantages and disadvantages. The following Figure 1 presents the different types of microgrids.
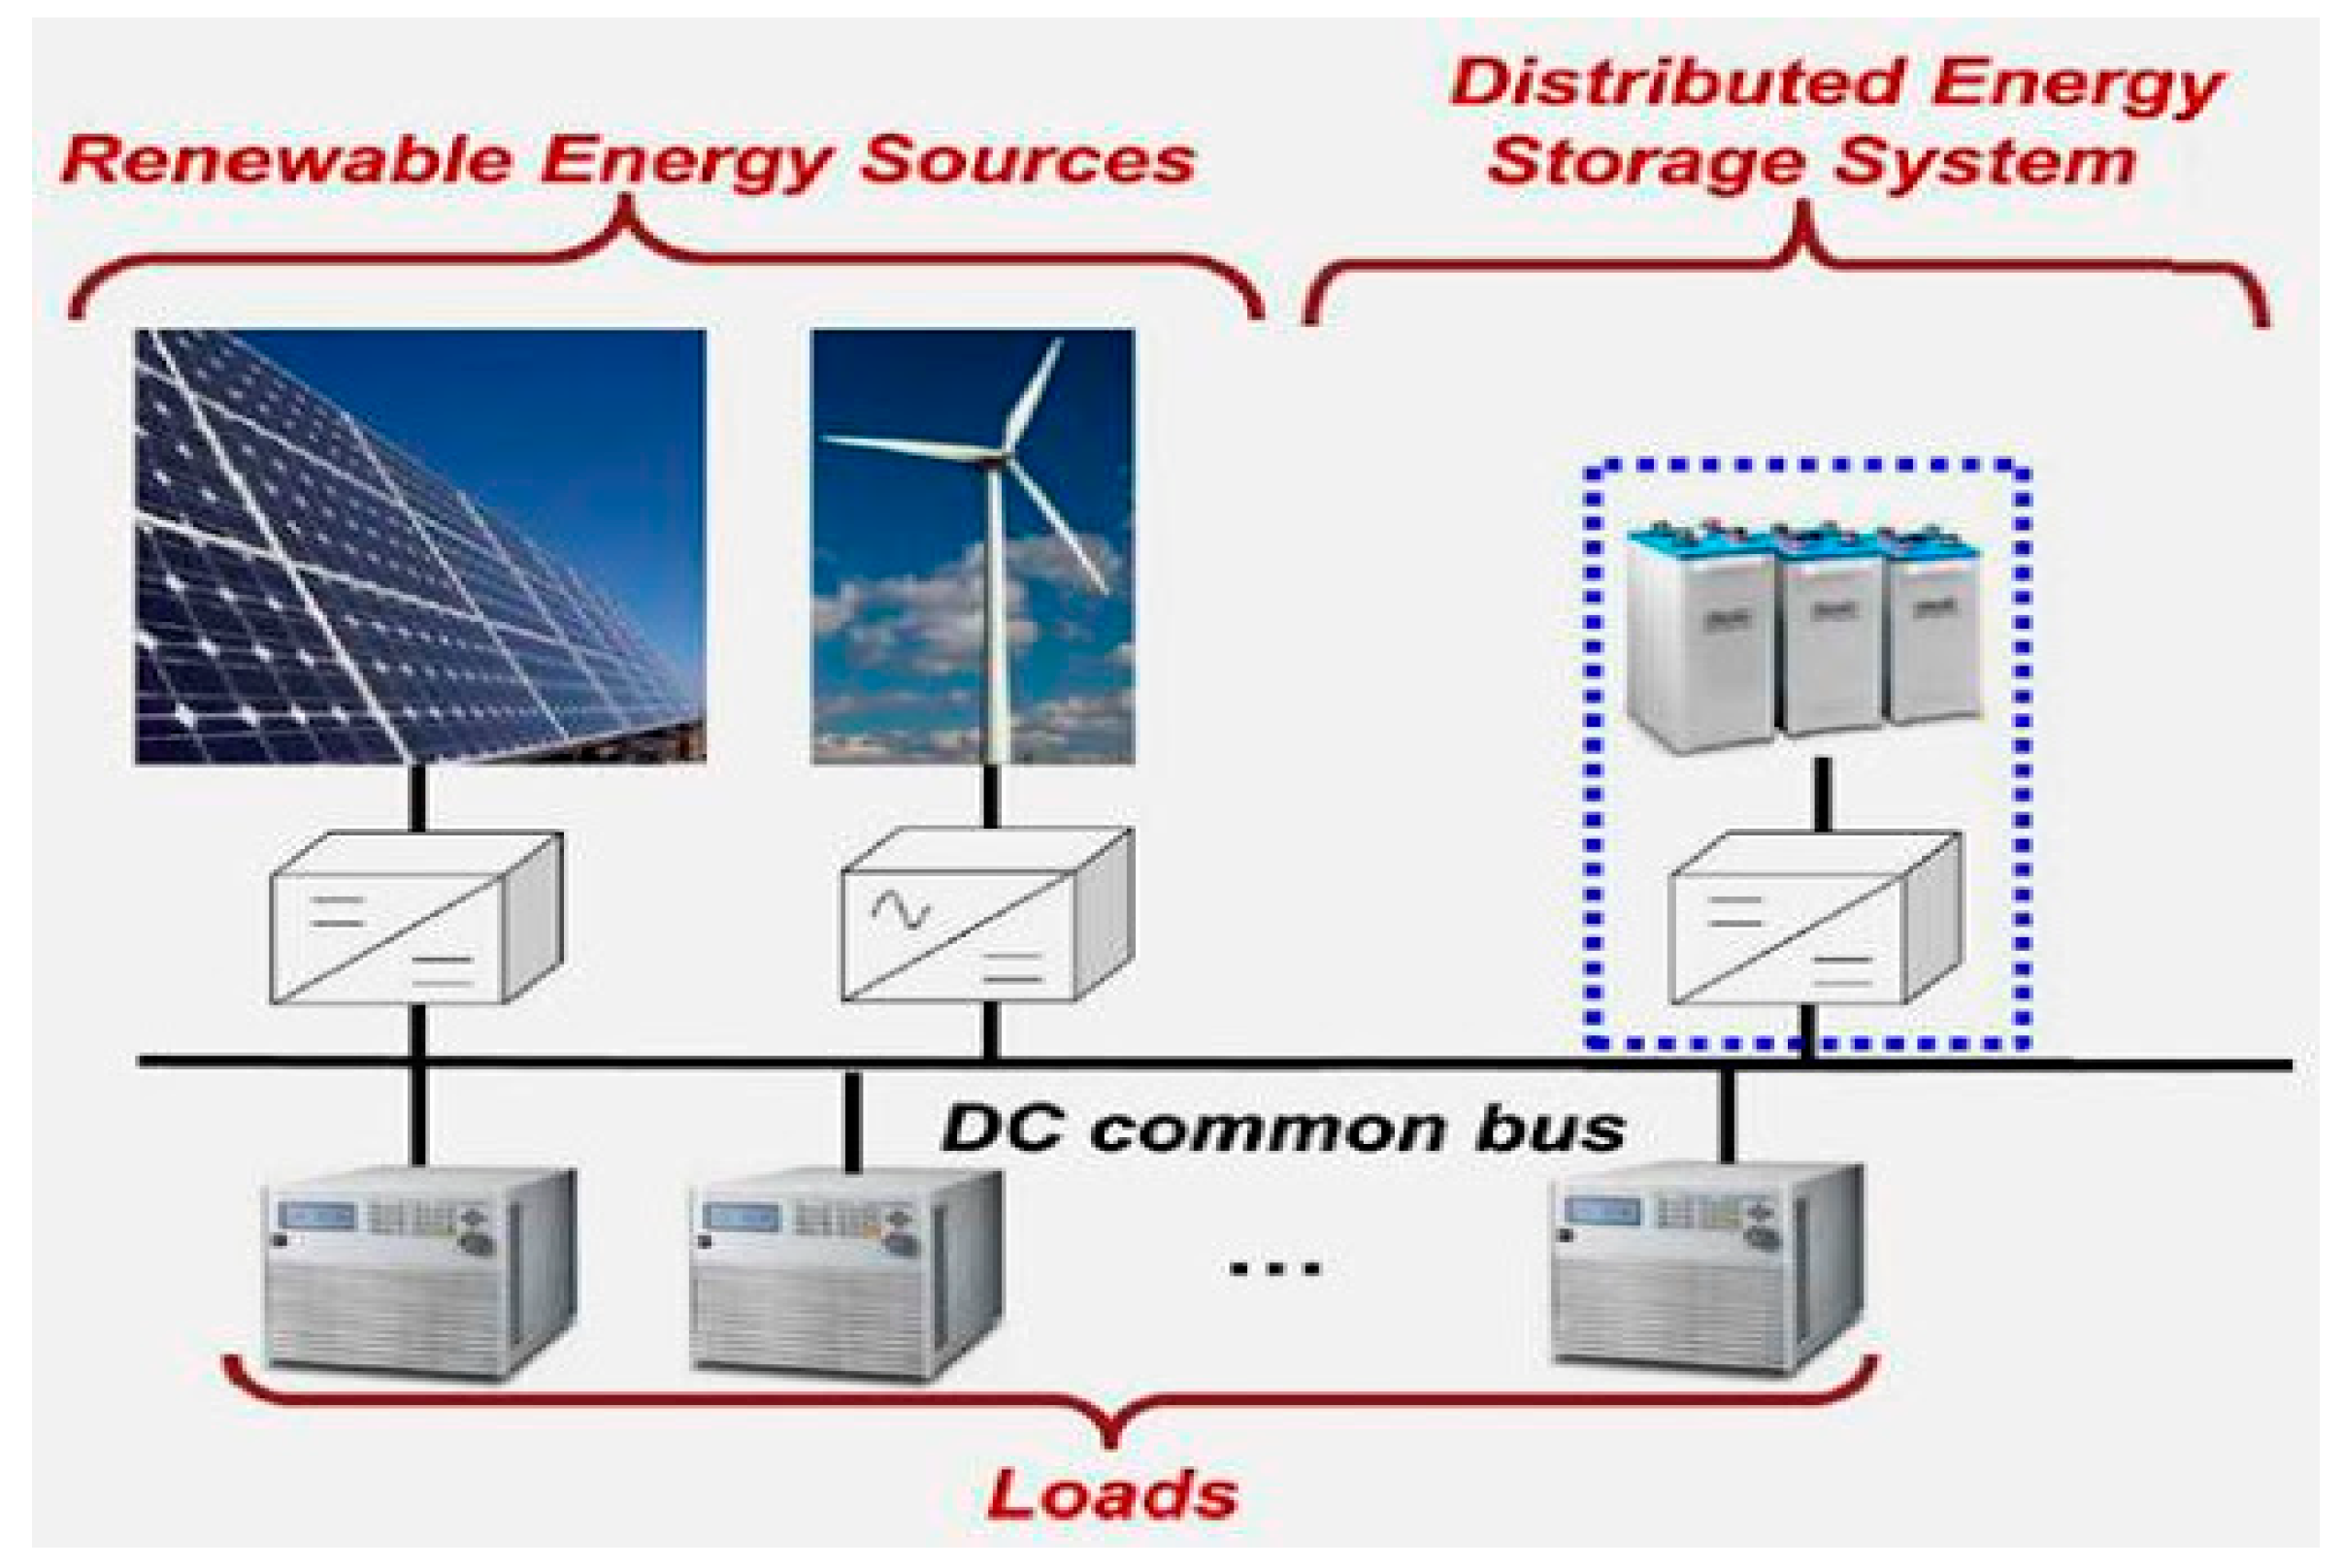
DC microgrids have recently received much attention, especially for commercial and residential small-scale applications, as they provide increased efficiency and controllability with additional power conversion stages being eliminated, and the synchronization and compensation of reactive power is no longer needed [13]. In a typical microgrid, the common bus is DC; hence, AC generators are connected to the DC bus via rectifiers, while inverters are used to supply AC loads (see Figure 2).
The DC microgrid can operate connected to the grid or isolated from it. It gives various operational advantages [14]. Many of the devices which are connected to a DC microgrid are generally electronic devices. As they are directly connected to a DC microgrid, no power systems like AC-to-DC, DC-to- AC, or AC-to-DC-to-DC are needed, which could be needed for an AC microgrid. No transformer is used in a DC microgrid; this characteristic makes it more efficient, reduces its size, and makes it more reliable in a DC power system [15]. However, a DC microgrid still presents various problems that must be surmounted. There are no good practices implemented to manage fault situations and a basic protective element such as circuit breakers, fuses, and protection relays is lacking, as in the case of AC microgrids [16].
The hybrid microgrids result from the combination of AC and DC microgrids; they include both AC and DC types of buses [17]. The type of connection to each bus depends on the proximity of the distributed generation unit and the load on the bus. The following steps in the electricity improvement distribution system are the AC microgrid systems. They can operate in a grid-connected or island mode. Based on the tasks that they have been designed to accomplish, their grid-connected or island modes can possess many suboperational states and or topological configurations [18]. DC-AC converters are used to connect DC generators and energy storage systems to AC buses, while rectifiers are used to supply DC loads.
To optimize the components of a microgrid system, an energy management system is used, which resolves decision-making strategies. These strategies consider increased system energy efficiency, increased reliability, reduced power consumption, the reduced operating cost of distributed energy resources, reduced system losses, and mitigated greenhouse gas emissions for sustainable improvement [9].
2.1. Distributed Generation Sources
A distributed generation system is composed of different sources, both renewable and nonrenewable. Renewable sources are generators that utilize renewable energy technologies such as photovoltaic, solar thermal power, wind power, biomass, tidal power, and geothermal power as the primary energy to generate power [19], whereas nonrenewable sources utilize natural resources that are not naturally replenished to produce power [20].
- (A)
- Solar Power: Solar power can produce power through two different forms, which include solar thermal generation and photovoltaic conversion. The first method, which is the solar thermal process, is a process of converting solar power into heat, and that heat runs a steam turbine which produces power, and photovoltaic conversion converts sunlight into electricity using photoelectric phenomena [21]. A solar cell is a basic component of a PV system. Solar cells can be grouped in series and parallel to constitute modules, which are also connected in series to form strings, and the strings are finally connected in parallel to form arrays. Different from the photovoltaic system, solar thermal generation utilizes solar collectors to collect heat, and the most widely used include parabolic, concentrated solar collectors, etc. [22].
- (B)
- Wind Power: The wind turbine operating mode is focused on two methods. Firstly, the kinetic energy of the moving air is converted into mechanical energy. This conversion is obtained by using aerodynamic rotor blades and a mechanical power controller. Secondly, the electromechanical energy is converted into electric power via a generator [23]. According to the wind turbine topology, they can be classified into two categories (horizontal axis and vertical axis); however, the most used topology is the horizontal axis wind turbine [24,25]. Various generator topologies are utilized to convert the electro-mechanical energy into electricity.
- (C)
- Geothermal Power: A geothermal power system converts the energy contained in the hot rock into electricity by injecting water into the rock to absorb heat from the rock and transport that heat to the surface of the Earth, where it can be converted into electrical power through a turbine generator. High-temperature water (>240 °C) is vaporized into steam, and that heat is transferred to a low-pressure steam turbine, which converts the steam into mechanical energy [26]. Usually, exploitable geothermal reservoirs are mostly located close to young volcanic rock areas [27].
- (D)
- Hydropower: Hydropower is a process that produces electricity from water flowing in the river or the oceans. The purpose of hydropower production is to generate clean energy [28]. A hydropower plant is generally composed of a generator, a turbine, a penstock, and a wicket gate. Mainly, two types of turbines are utilized, which include a pulse turbine (a Pelton Wheel turbine) and a reaction turbine like Francis and Kaplan turbines. Generally, the generator and turbine are directly linked to the same vertical shaft [29].
- (E)
- Biomass Power: A biomass power system utilizes biomass to produce biogas, which is utilized as fuel for a biomass generator [30]. The utilized biomass includes both energy crops and wastes, such as forest residues and a range of other agricultural and industrial compounds. Actually, the use of biomass is a fundamental part of global renewable energy and contributes to an ever-increasing share of global electricity capacity [31].
- (F)
- Micro-Turbines: Micro-turbines are energy generators, which have a range of capacity between 15 and 500 kW. They operate under the open cycle gas turbine principle, and they have shown many different characteristics and operate easily and at high speed. Some of their benefits include having variable speeds, being easy to install, having compact sizes, being low maintenance, having air bearings, having low NOx emissions, and being mostly recuperators [32]. Micro-turbine generators have demonstrated strong improvements in distributed small-scale power production. However, the results have shown that these generators are not able to supply power during peak periods, but they may meet peak demand and improve the power generation reliability, as they can provide standby capabilities when the power grid fails [33].
- (G)
- Diesel Generators: A diesel generator (also known as a genset) is composed of an internal combustion engine and a synchronous generator connected to the same shaft. Diesel generators are generally utilized as backup or emergency power systems in commercial and industrial installations. They are also widely utilized in new areas where connection to the distribution grid is unfeasible or expensive to perform [34]. Their principal disadvantage is the negative impact that they can have on the environment due to their high NOx.
2.2. Power Electronics Converter Control
The hierarchical control architecture of a microgrid system includes the primary, secondary, and tertiary controllers. A primary controller consists of the preliminary power sharing and regulation of current/voltage, whereas a secondary controller is higher than the primary controller and helps to compensate for the voltage and improve the performance sharing. Finally, a tertiary controller focuses on power management, energy management, and economic dispatch [35].
2.2.1. Primary Controller
A primary controller consists of an inner loop (current/voltage regulation) and droop control (preliminary power sharing) based on the control of the power converters. The response time of the primary controller is very short, and there is no need for communication when it is utilized in the decentralized system [36]. But when it is used in centralized control, distributed control, and master–slave control, there is a need for communication. This controller is mostly used for regulating the frequency and voltage of the inner loop of control.
2.2.2. Secondary Controller
A secondary controller has a longer operating time than a primary controller because it minimizes the frequency and voltage deflections that persevere even after primary control is performed, and it can also be utilized for centralized and decentralized controls [37]. The secondary controller is performed by a central controller of the microgrid in centralized control and in decentralized control; it is implemented by local controllers.
2.2.3. Tertiary Controller
The principal goal of a tertiary controller is to regulate power flow and load sharing between converters and between several hybrid microgrid systems if they are connected in a group and finally synchronize individual incremental costs. Additionally, a tertiary controller is utilized to update the set point for the secondary controller depending on the production cost preferences by updating the loading ratio of each converter [38]. Compared to the secondary controller, the tertiary controller is able to suppress voltage fluctuations and change voltage operating points to attain the optimal dispatch of power production.
2.3. Description of the Developed System
The developed DC microgrid system includes different loads such as a commercial load, industrial load, and residential load. The capacity of the power produced by all DG sources are 150 kWp for solar, 150 kW for wind energy, and 345 kWh for battery banks. Power generation from the PV and battery is DC, but for wind, it is AC; therefore, the power generation from the AC source is converted to DC by using a rectifier. To reduce the voltage fluctuation, each DG source is equipped with a converter. A battery is used to ensure power supply to consumers without any interruption. The DC microgrid supplies the loads directly by 380 Vdc. The total produced power, which includes PV and wind, are connected in parallel. The battery bank will be used as back-up power during peak demand and to decrease variations in the power produced by renewable sources. Thus, the total power required to supply the loads is 280 kW. Figure 3 illustrates the block diagram of the developed DC microgrid system.
3. Mathematical Modeling of the System Components
The concern at this point was to design a dynamic model of the developed DC microgrid, which helped to verify the efficacy of the designed controller. The MATLAB/Simulink mathematical modules were used to build the DC microgrid model, including the battery systems, which used the component-equivalent circuits. Three different power supplies were considered in this model, which include PV, wind, and battery bank.
3.1. Photovoltaic Module Modelling
The output characteristic of a photovoltaic array is determined by cell temperature, solar irradiation, and output voltage. The operation mode of a PV or solar cell refers to the PN junction diode operation, which converts light energy into electricity by the photovoltaic effect [39]. Figure 4 represents the configuration of a single PV cell.
According to this circuit, the solar irradiance is described through a current source , and diode current , output current , series resistance , parallel resistance , and output voltage represent the remaining circuit parameters of the configuration. The output current is determined by the following formula:
where and are the numbers of cells connected in parallel and series, is Boltzmann’s constant, 1.380658 × 10⁻²³ J/K, q is the charge of an electron equal to , is the ideal diode factor between 1 and 5, represents the reverse saturation current of the cell, represents the reverse saturation current at , is the reference temperature (K), Eg is the energy in eV (), and T is the absolute temperature of the junction.
where represents the short-circuit current at a reference temperature of the cell, is the coefficient of the short-circuit temperature ( refers to cell temperature, and represents the solar radiation in [41]. According to this configuration, the shunt resistance in parallel with the ideal shunt diode and the I–V characteristics are described by the following equation:
The PV output power is a function of the solar irradiation and the area of PV module, as shown in the following equation:
where is the production efficiency, is the radiation of solar in W/, and A is the area.
3.2. Modeling of Wind Power
The wind model is characterized by the variation in wind velocity with gust and wind speed.
With the following parameters:
- is the base wind velocity;
- is the gust wind velocity;
- is the ramp wind component.
Wind power is given by the following expression:
The energy drawn by the wind turbine is expressed by the formula below:
where is the energy drawn by the wind turbine and is the air density. Based on Betz, the maximum output power of a wind turbine is given by the following:
where, A is the area, is the air density, and V is the wind velocity.
The substitution of the value for , and enable us to obtain the following equation:
where , , and are wind velocities in different areas.
The modeling of a wind turbine helps to describe the captured output power of the turbine [42]. The wind power according to a given area is calculated as follows:
where is the pitch angle of the blade (), is the tip speed ratio of the turbine, and is the power coefficient.
The maximum produced power by a wind turbine is calculated by the following equation:
3.3. Modeling of the Battery
The principal focusing parameters of the battery mathematical model are the voltage and current. The current can be determined by the change in the terminal voltage of the battery. The current production is driven by the transmission of electrons from one electrode to another [43]. The potential difference between the positive and negative electrodes determines the open circuit voltage of the battery [44]. The following equations present the charging and discharging voltages of the battery:
The composed relation model allows us to modify Equations (18) and (19). is the open circuit voltage at the battery and is the open circuit voltage at the positive electrode of the battery. represents the open circuit voltage of the battery expressed in Volt, I is the battery current, i.t is the discharged capacity (Ah), is the polarization coefficient , represents the battery capacity (Ah), is the internal resistance, A is the exponential voltage coefficient in V, B is the exponential capacity in , is the ohmic resistance in Ω, and SOC is the battery state of charge in %.
Equations (18) and (19) present some limitations such as (i) battery aging and self-discharge, (ii) the current amplitude not having an impact on the battery capacity, and (iii) no consideration of the temperature coefficient. To surmount these limitations, it is crucial to consider the aspects that have an impact on the life of the battery [45]. The analysis of the condition is conducted at each instant and is calculated with the threshold capacity using Equation (24).
The following equation determines the net power produced by a DC microgrid structure:
4. Developed Management System
Generally, the energy management system is used to control power production and schedule programs for a group of power grid applications. However, it may be considered as another way to control the electrical loads in microgrids. The present system is designed to meet the loads. As renewable resources are intermittent sources, the battery is used as a back-up system, and this is also designed to meet the load as well. The developed system includes three different types of loads (industrial, residential, and commercial loads), and in the developed model, the industrial load is assumed to be a priority load. The system comprises two renewable sources and a storage system. The net power generated and the load power are calculated as follows:
where is the power generated from the renewable energy sources; is the power produced from PV; is the power produced from wind; is the load power; is the industrial load power; is the residential load power; and is the commercial load power.
The battery bank will charge when there is excess production and will discharge when the power generated is not able to handle the load demands. Based on this architecture, the power generation will supply the load through four conditions and by the support of the battery bank.
- ✓
- Firstly, when the power generation is equal to the load demands, in this case, the loads are supplied by the power generation from PV and wind without any disruption.
- ✓
- Secondly, when the power generation exceeds the load demands, in this case, the power generation is more than the demand of the loads; thus, the loads are supplied by the power generation and the surplus of the production is used to charge the battery. When the battery is fully charged, the remaining excess of production is located to an auxiliary load.
- ✓
- When the power generation becomes less than the demand of the loads, then the loads are supplied with the help of the battery bank. The battery is discharged until its reaches its minimum value.
- ✓
- When the , the battery is disconnected from the system, and at this time, the priority load, which is the industrial load, is supplied by the power generation from the renewable energy sources. If the power production exceeds the industrial load, in this case, the excess of the production is used to charge the battery. When the power production falls below the priority load, then the power generated from the renewable energy sources is used to charge the battery. The system will permanently verify the power generation and the battery SOC until the power generation meets the loads or the battery becomes able to handle the loads.
5. Simulation Results and Discussion of the Developed Model
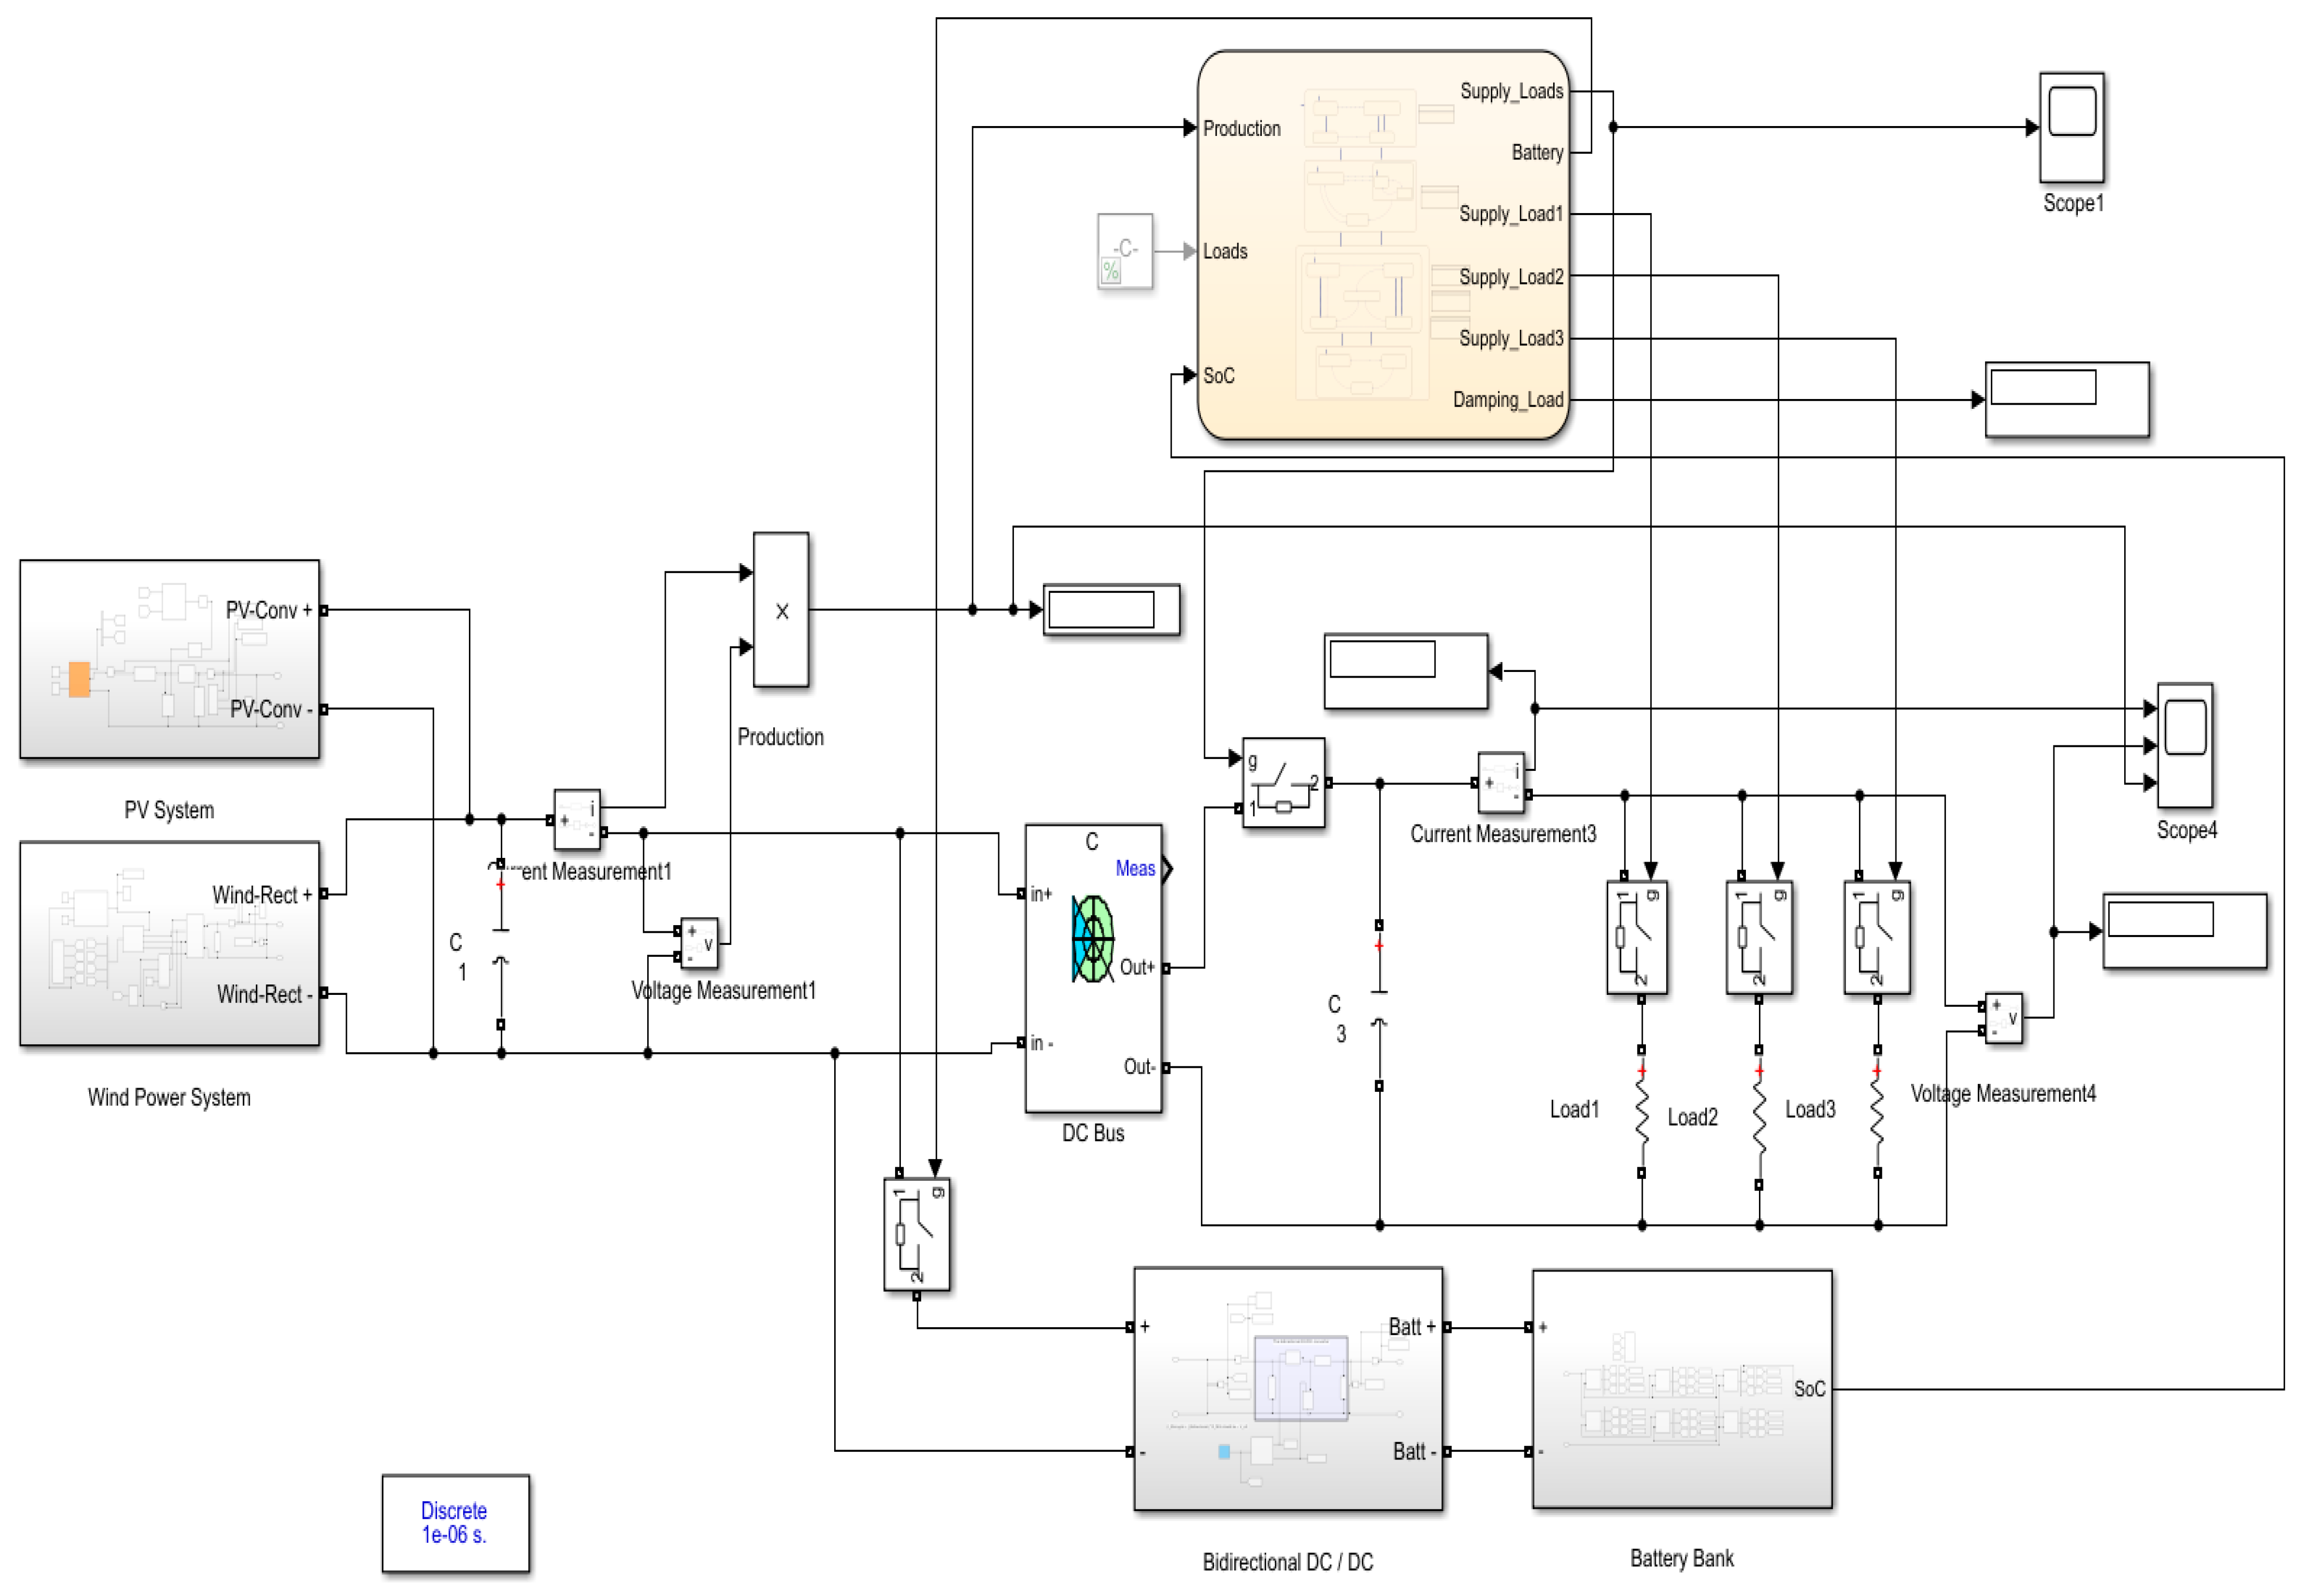
The following section presents the description of the developed energy management control and diverse specified simulation procedures and simulation results. The developed model was implemented in the MATLAB/SIMULINK 2020b software and the block diagram of the developed system and EMS algorithm is shown in Appendix A. All circuit elements and machines are represented by their respective model blocks available in the software. Different parameters of the simulation are presented in Table 1. The developed EMS strategy controls the PV, wind, battery, and loads. The load is subdivided into three categories: industrial load (which is the high-priority load), residential load, and commercial load [46].
Figure 5 illustrates the PV outputs voltage and power as a function of the simulation time.
The output voltage remains constant at 380 with very small ripples; the designed model allows a ripple with 0.9% variation from the steady state. The power generation stays constant at 149.68 kW.
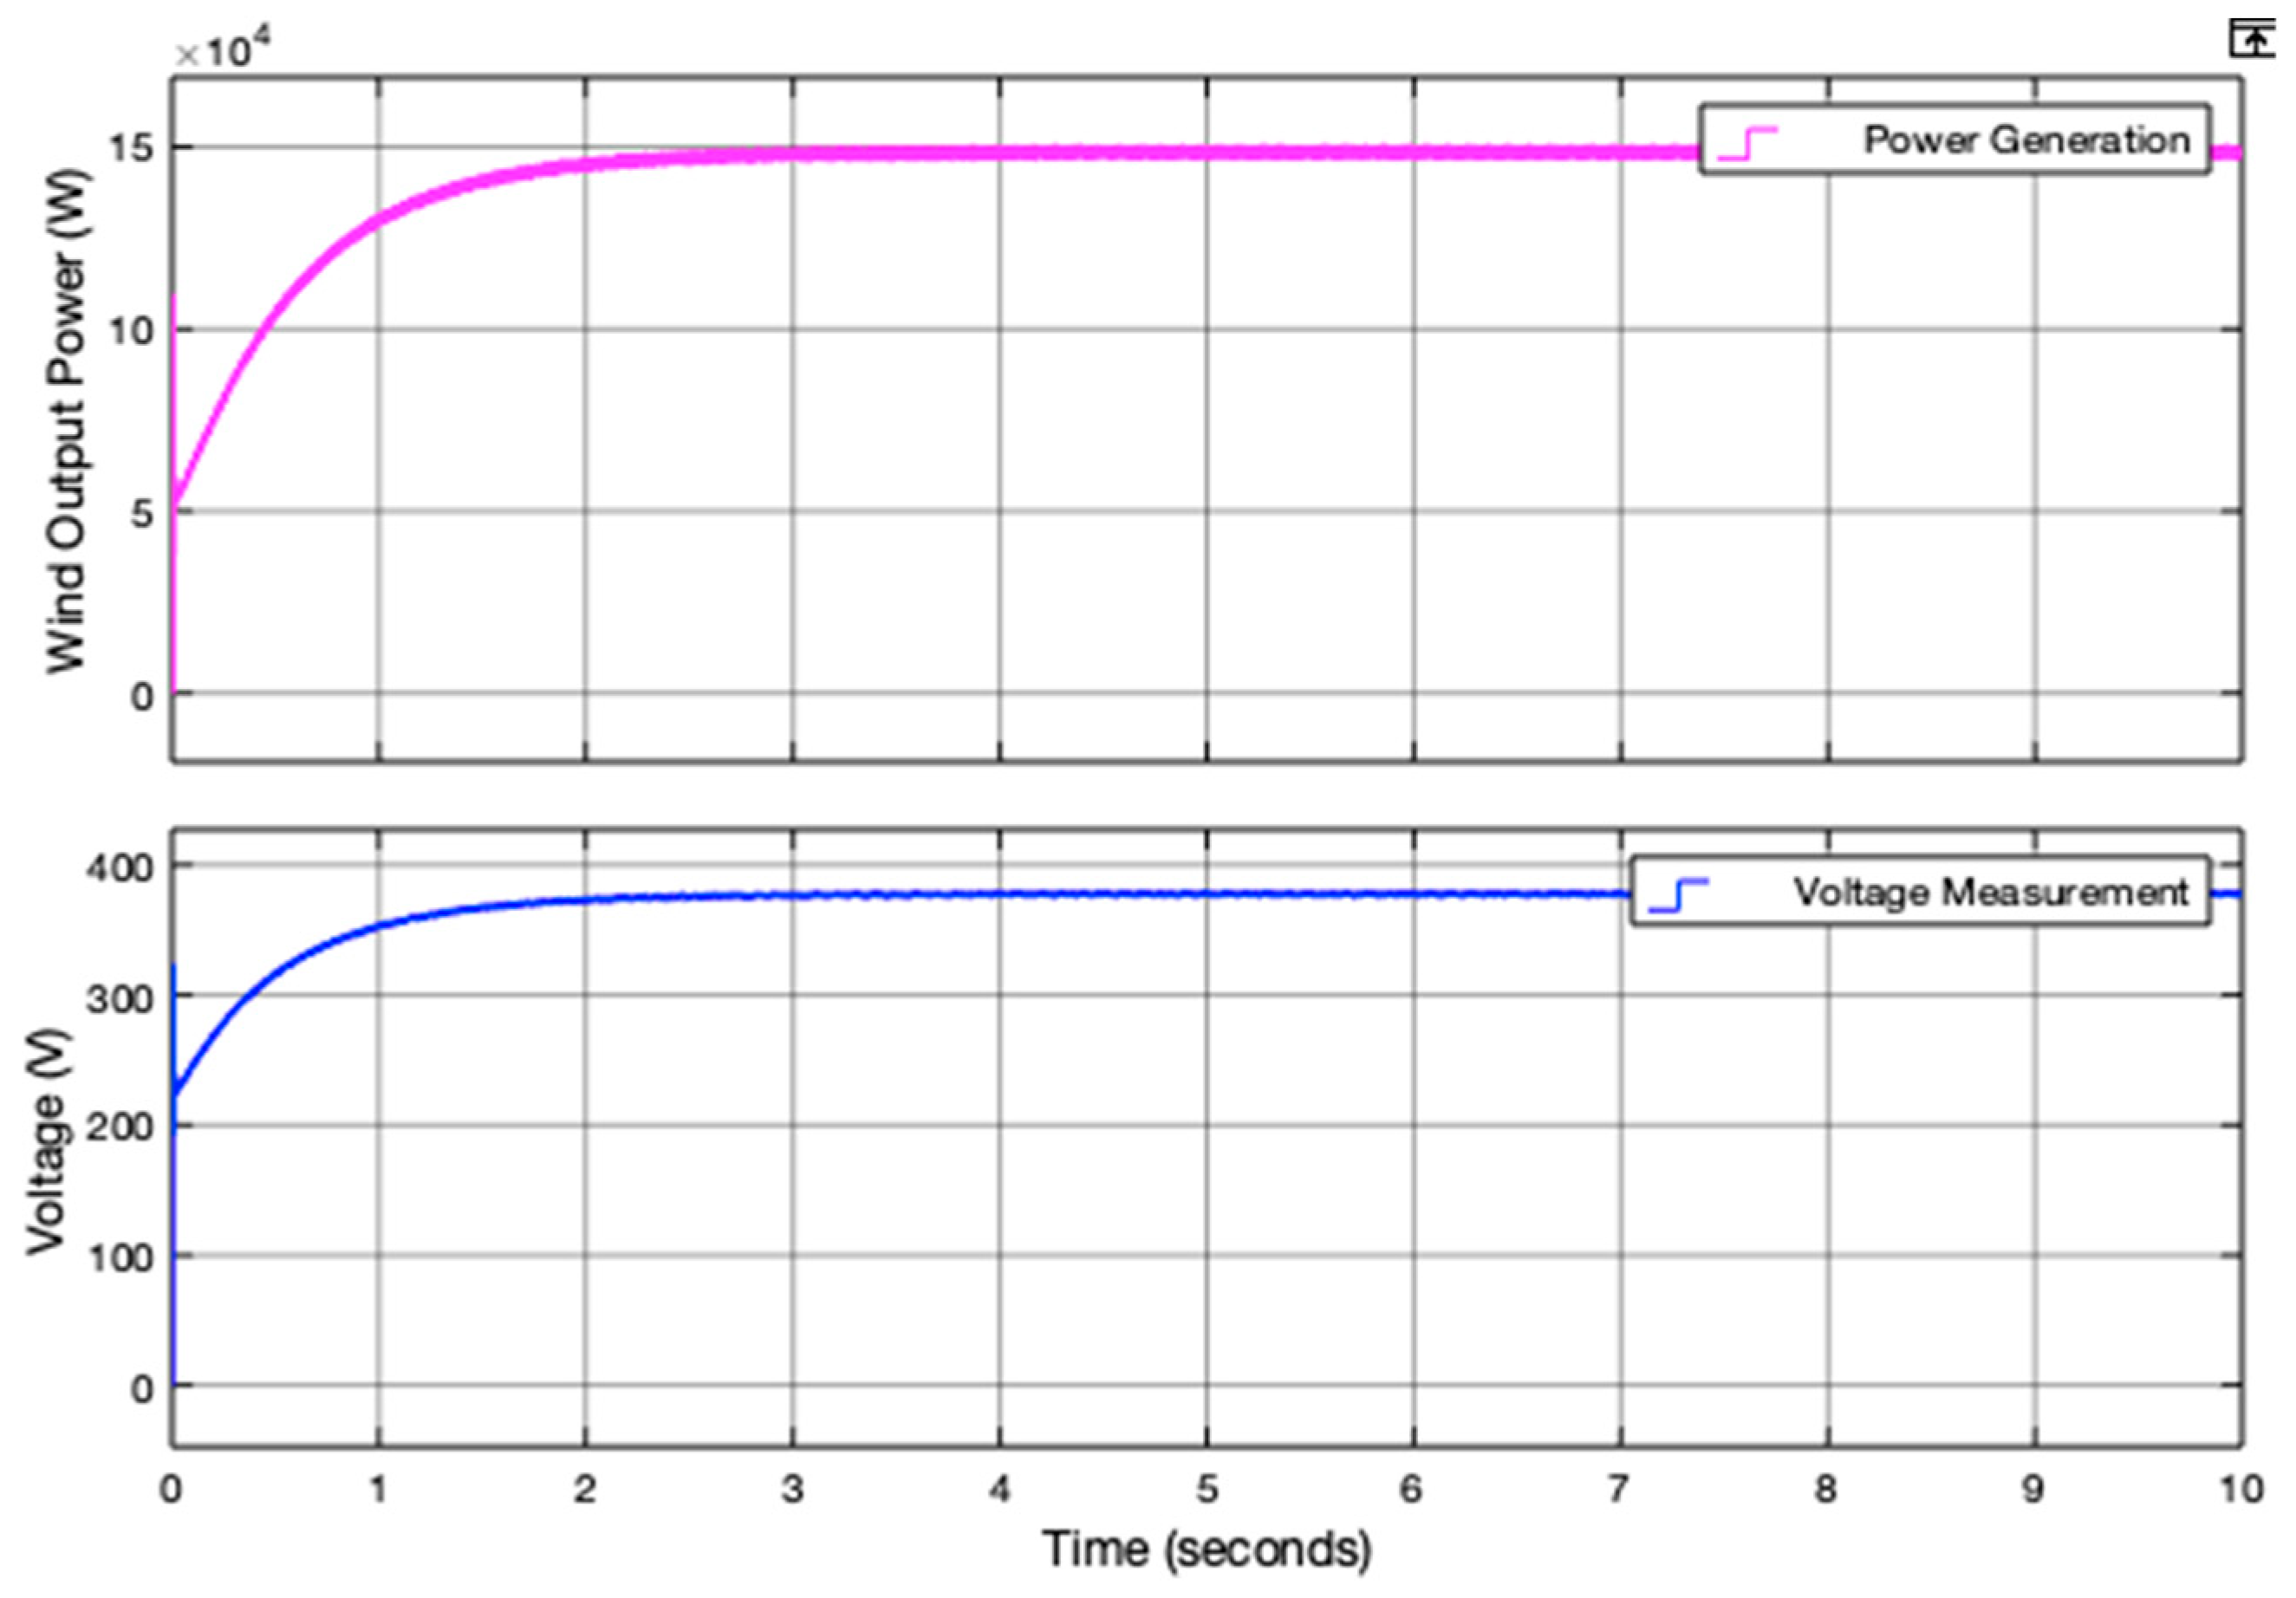
Figure 6 presents the universal bridge rectifier output voltage and output power of the wind model as a function of the simulation time. The steady states of the outputs are attained at approximately 2.2 s and remain constant after, with very small ripples. The output voltage is 380 , and the average value of the power generation is 148.78 kW.
The developed EMS algorithm is designed in the Stateflow logical programming environment. In this section, different cases are considered. Table 2 summarizes the different operating modes of these cases. In this study, Load 1 is considered as the priority load, which is the industrial load.
The operating mode of the Stateflow environment corresponds to that of a logical system; it is either 0 or 1. When the system is in operation mode, the output indicates 1, and when the output indicates 0, this means that the system is not in operation.
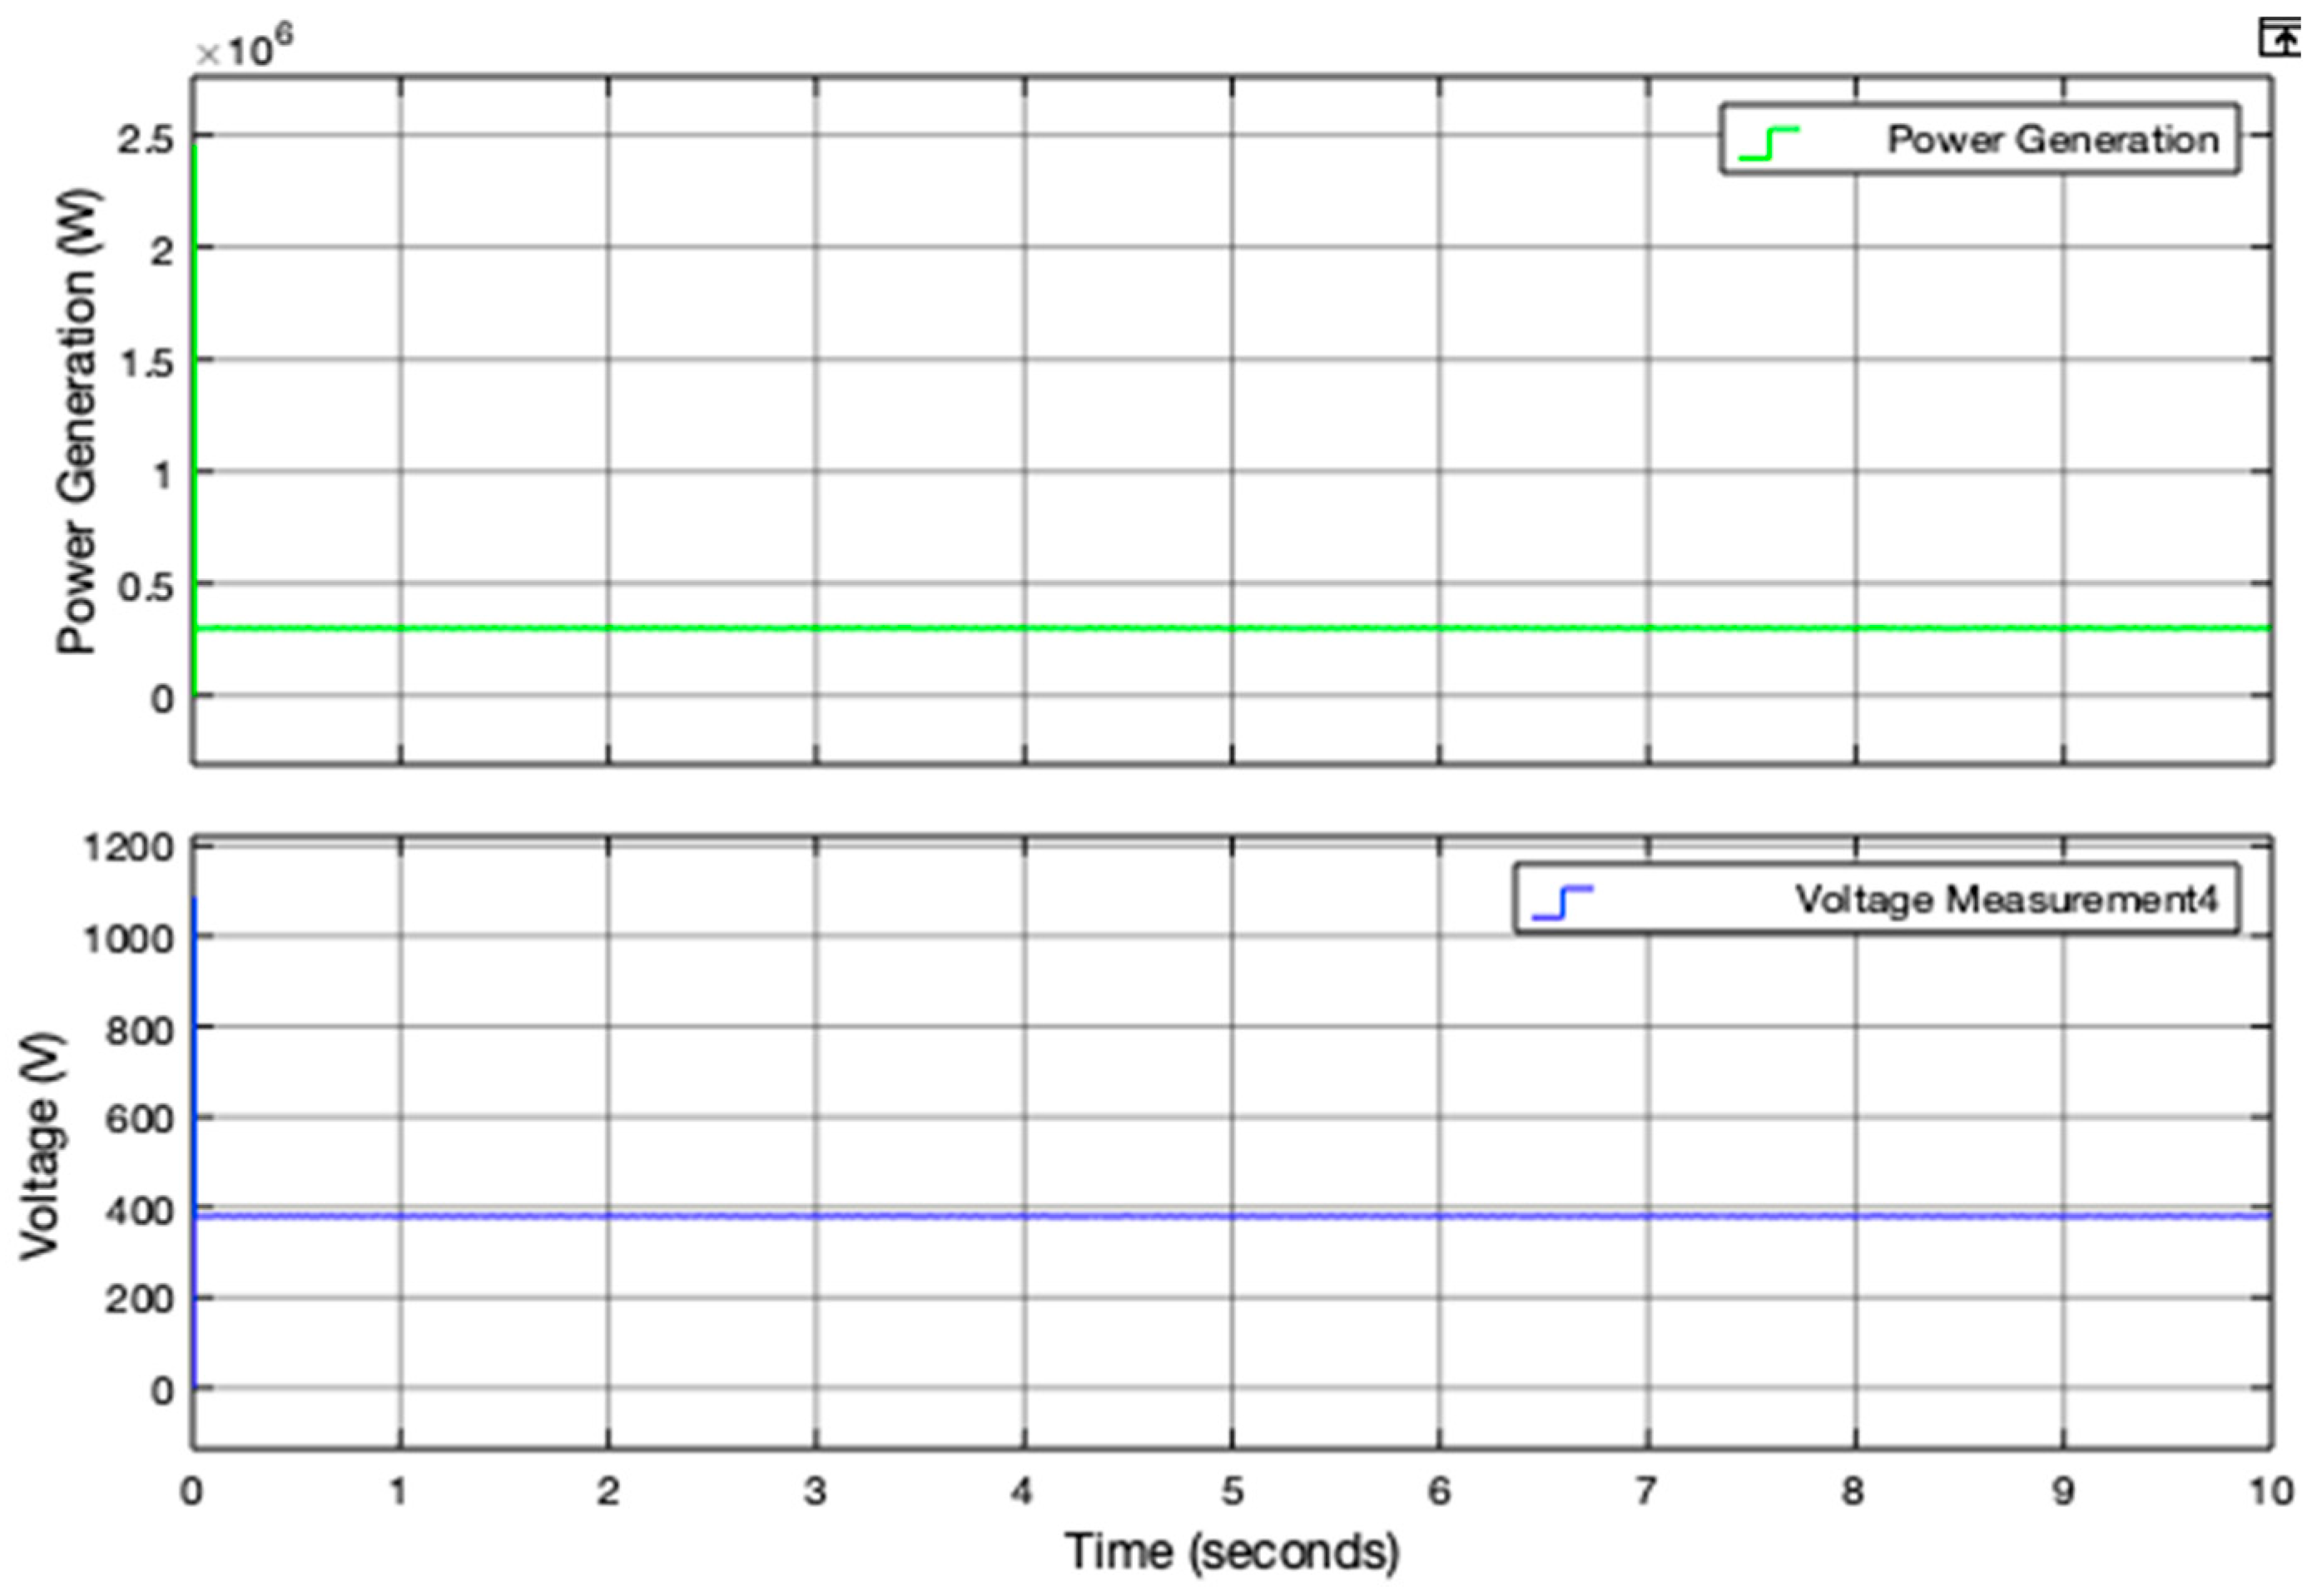
Case 1: In this first case, the power supply is equal to the demand of the loads, as shown in Figure 7. The battery and the auxiliary load are disconnected from the system. The power is supplied to the loads and the battery is assumed to be below its maximum capacity (100%). In this case, the battery is kept at 50%.
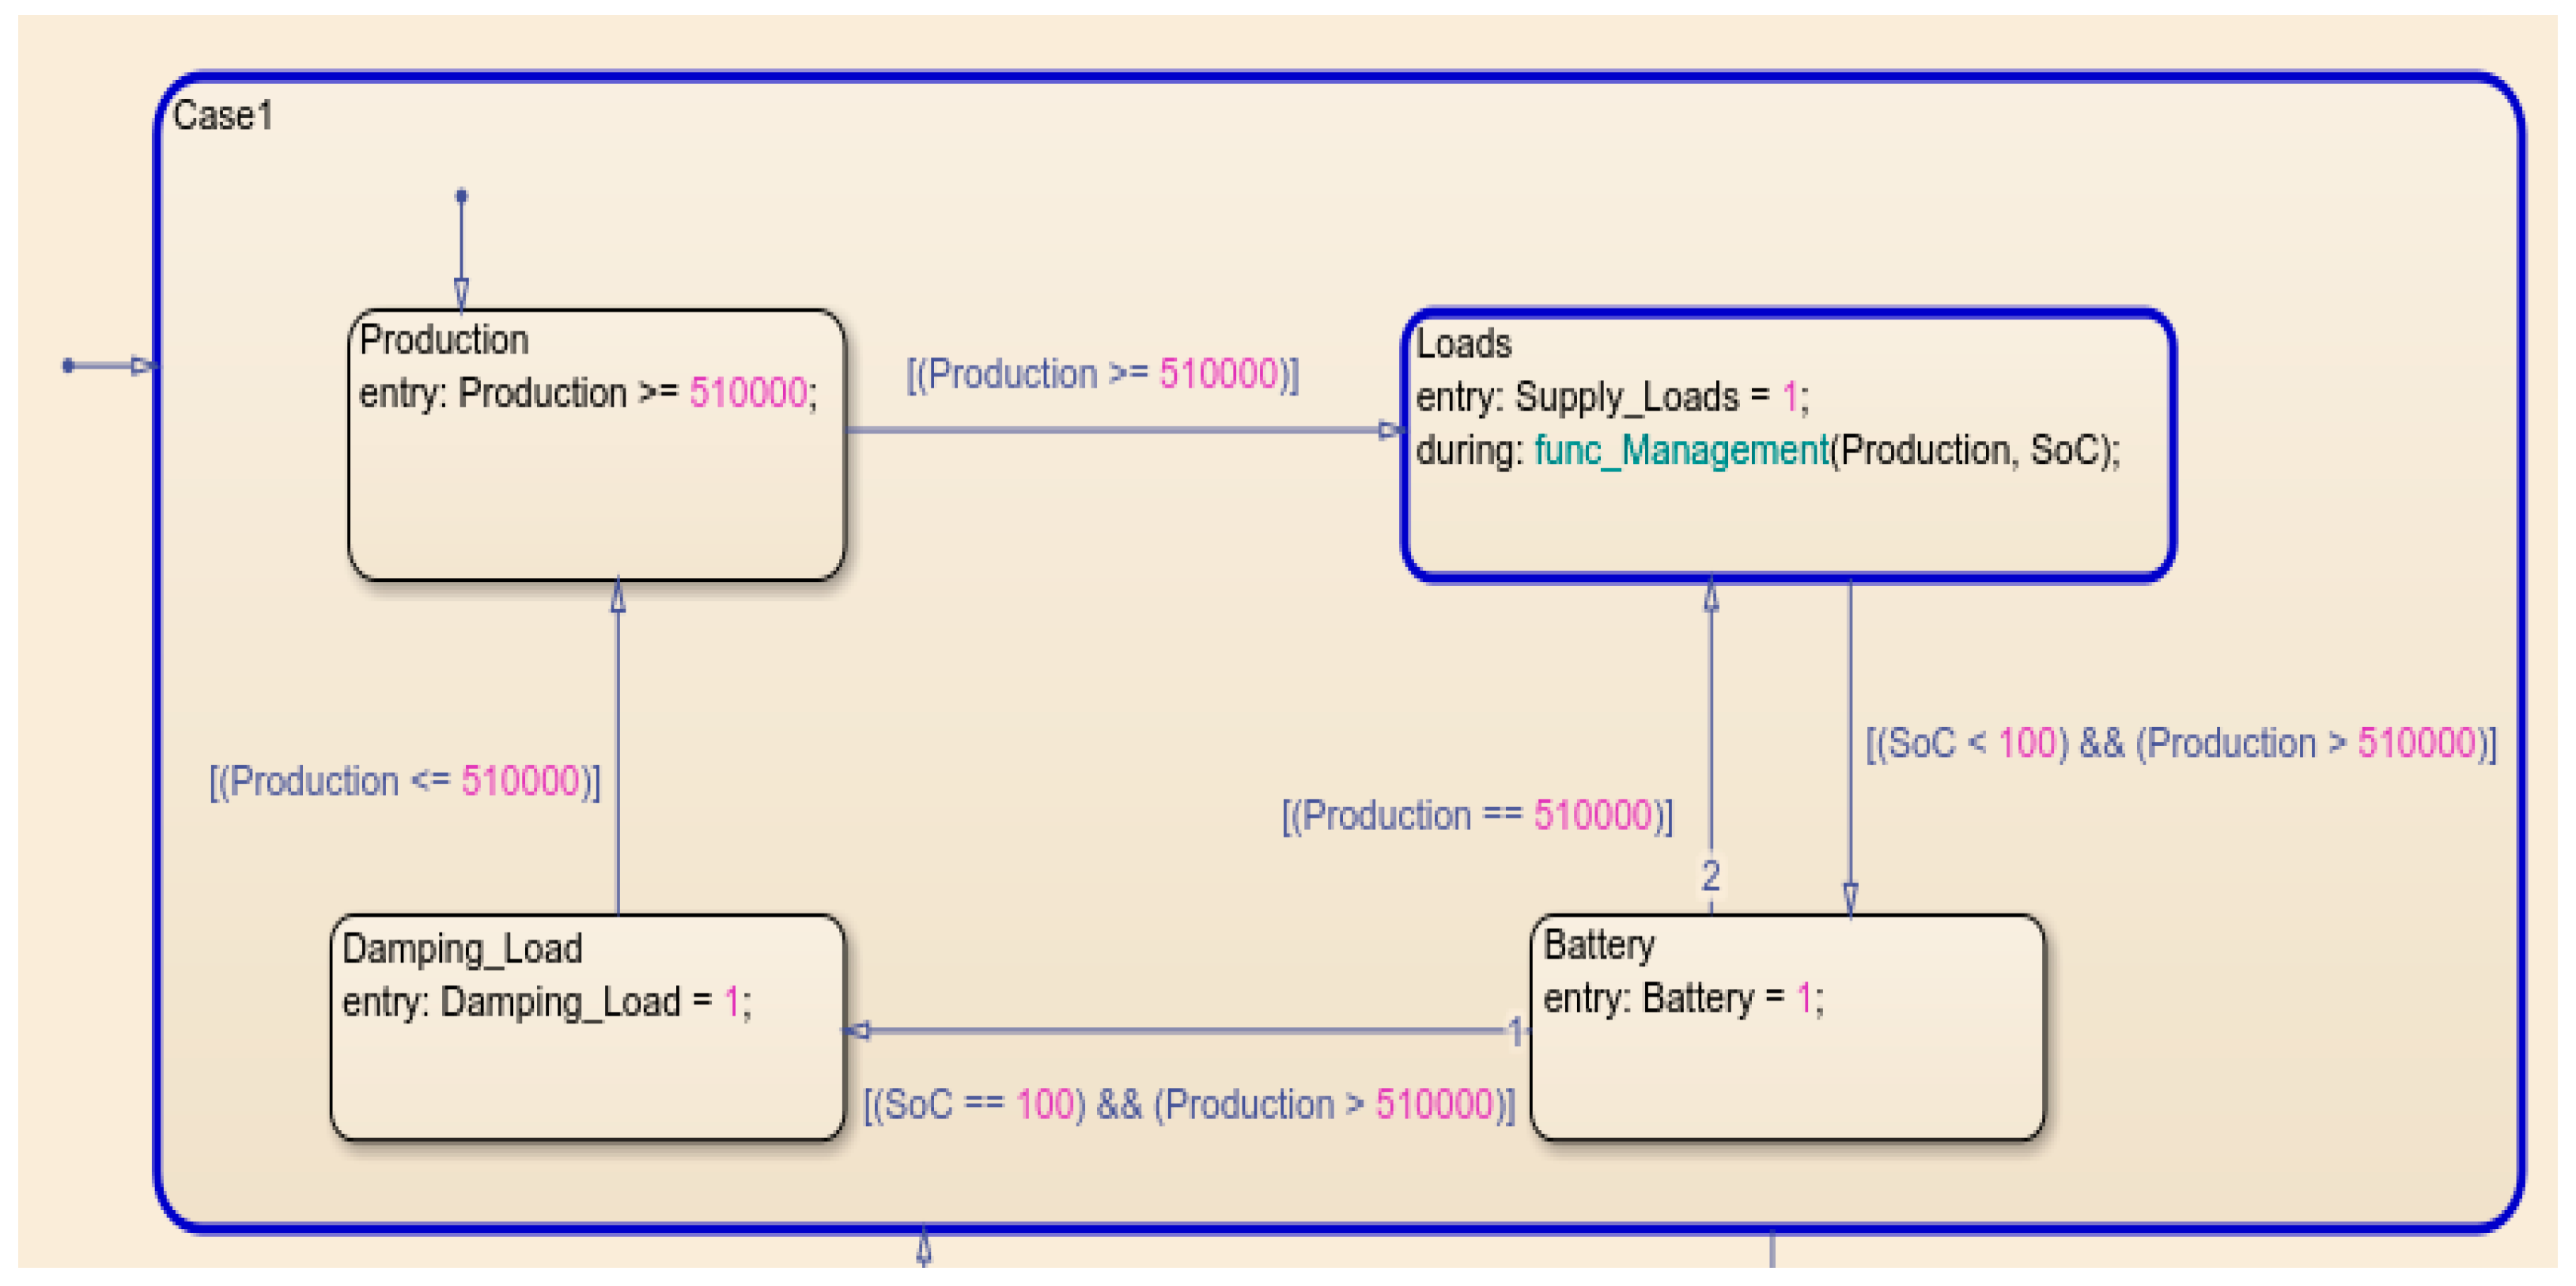
The demand of the loads is fixed at 280 kW, and the power production from the RES is 281 kW. Therefore, the loads are supplied by the power generation without any interruption. Figure 8 presents the Stateflow transition state of this scenario. The battery in this case is not charging or discharging.
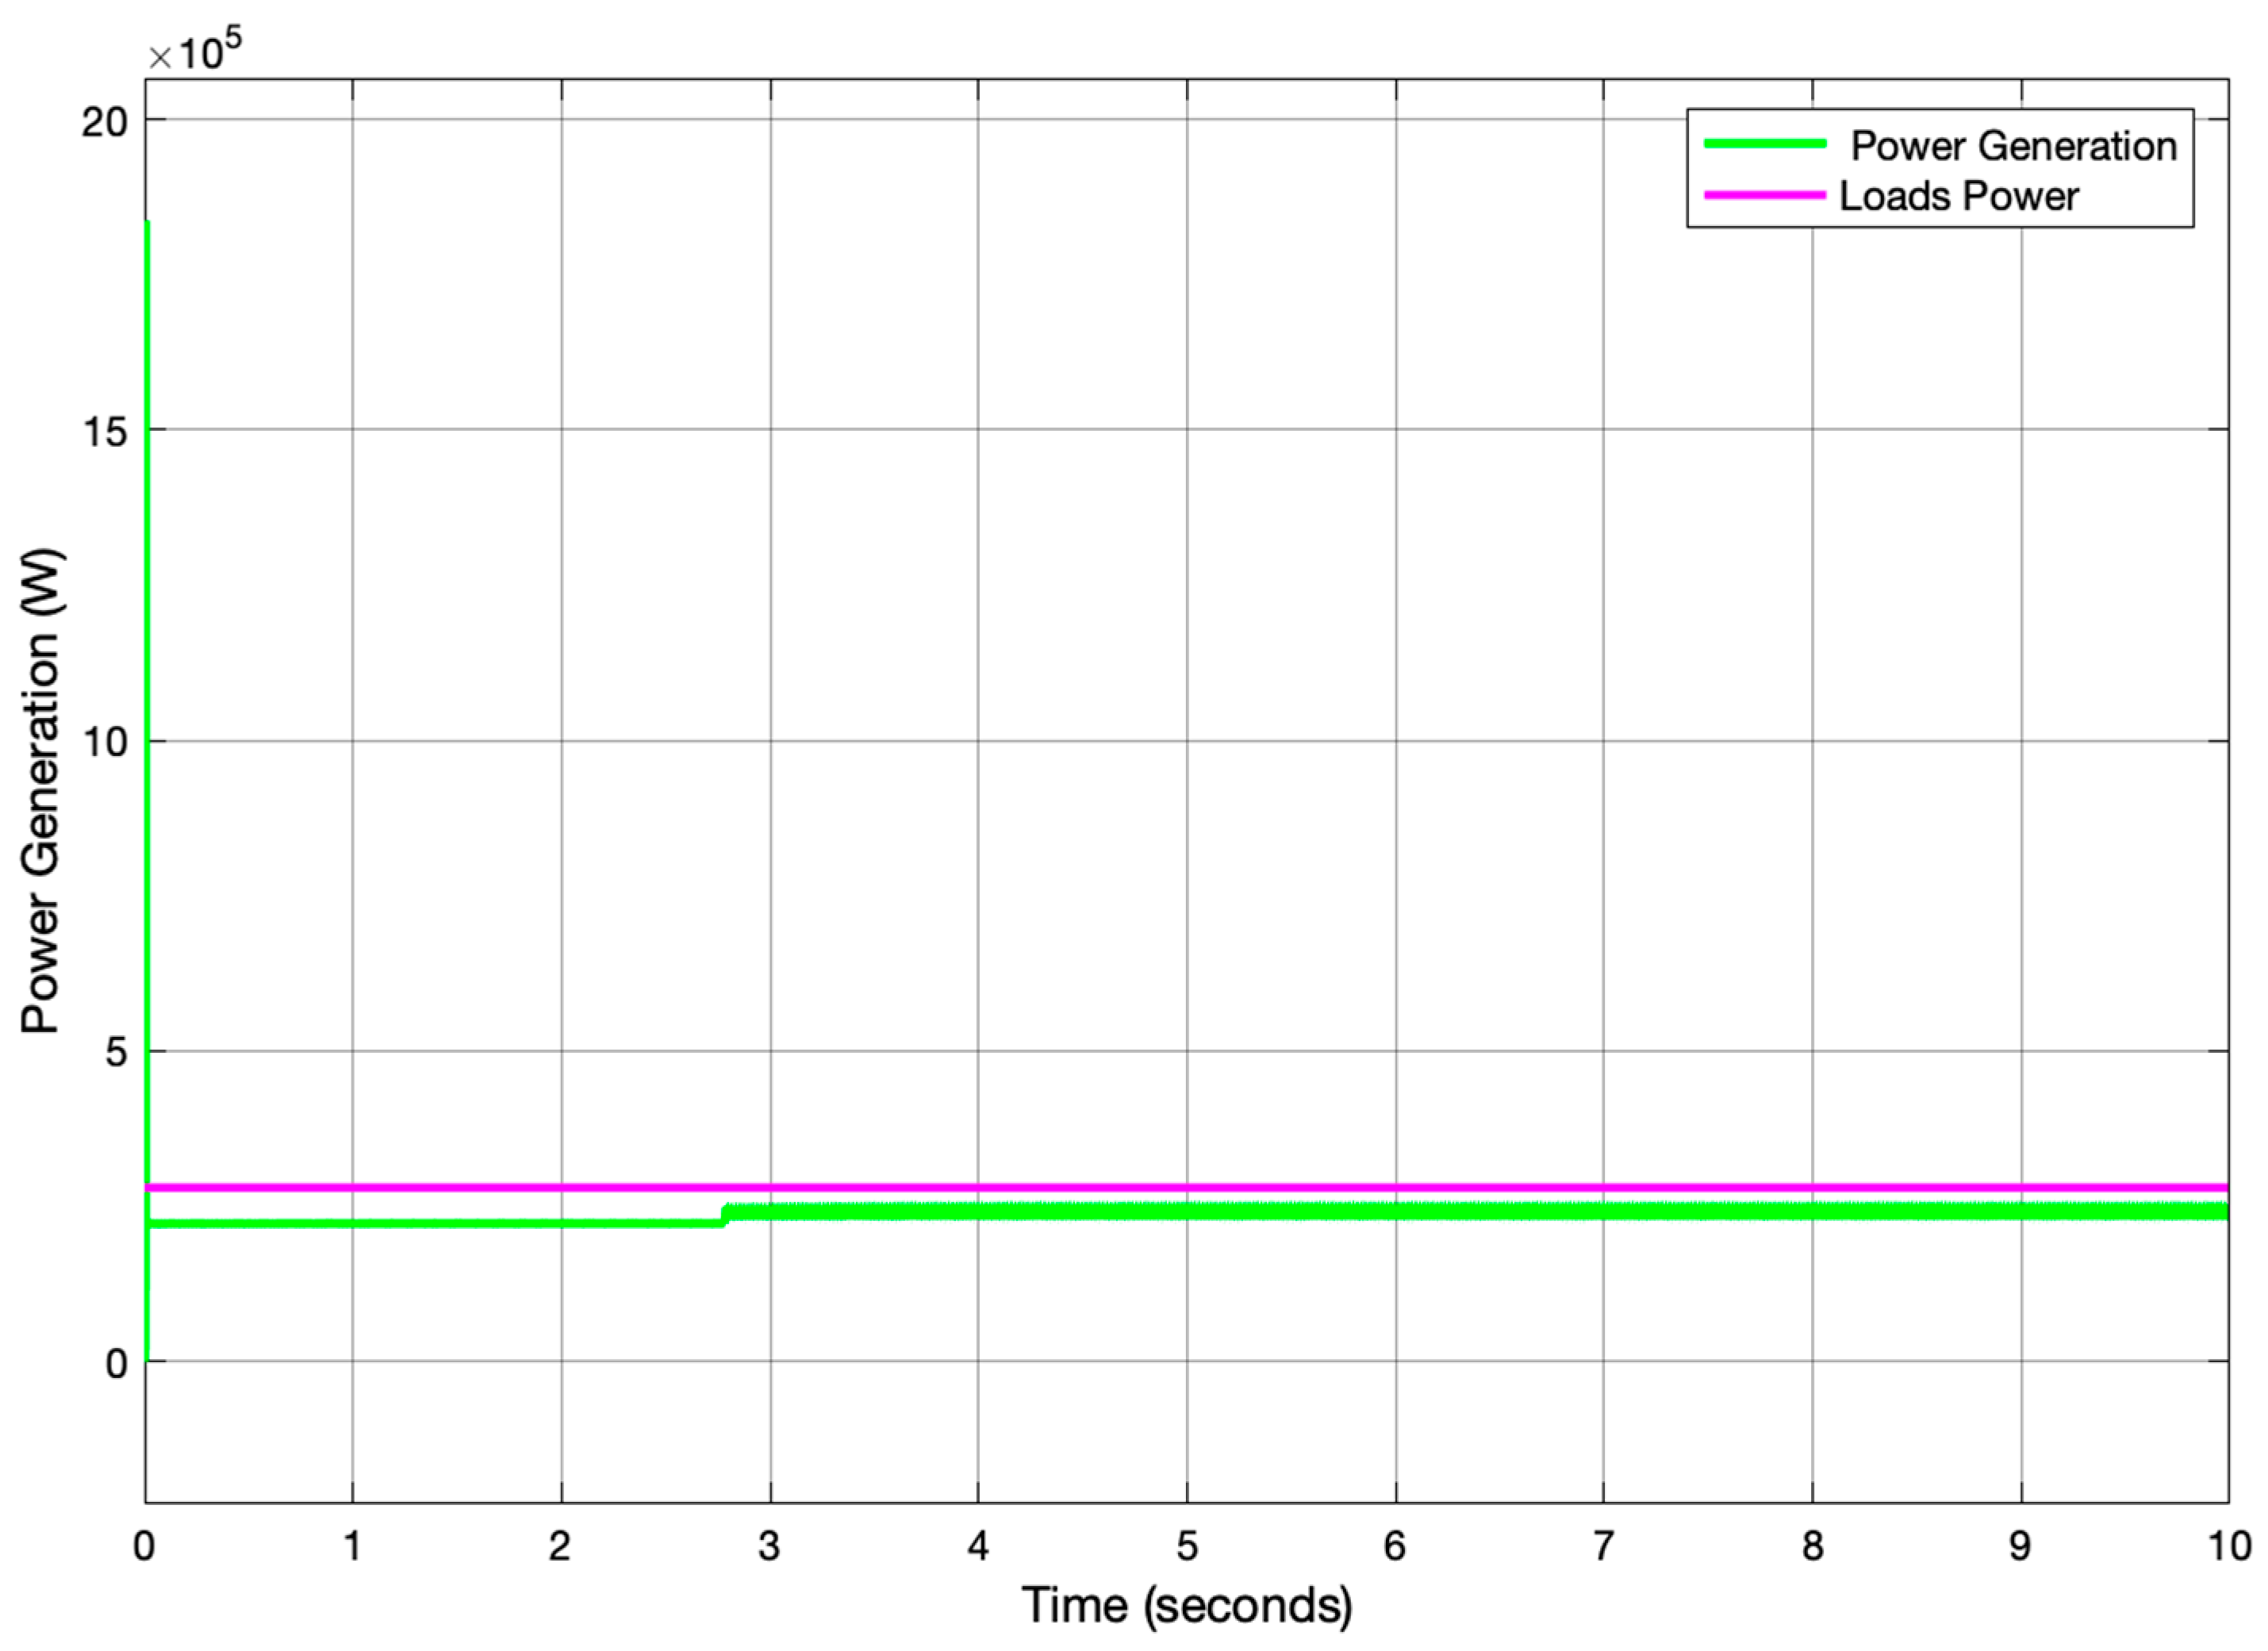
As shown in Figure 9, the output result from the EMS algorithm shows that all the loads are supplied without any interruption because the power produced meets the demand of the loads. In this case, the battery bank and the damp load are 0, which means that they are disconnected.
Case 2: Here, the power generation becomes higher compared to the load requirements, as shown in Figure 10. Thus, the EMS checks if the battery is fully charged or not. If the is less than 100%, as shown in Figure 11, the loads are supplied by the power produced, and at the same time, the battery is connected to be charged by the excess of production until it reaches its charge limit, which is 100%.
Figure 11 presents the battery graph in which it shows the battery charging.
When the battery reaches its maximum charge value (100%), it is disconnected from the system to wait for the discharge phase. Figure 12 shows that the loads and battery outputs are 1, while the damp load output is 0. This means that the loads are supplied, and at the same time, the battery is also charging.
Figure 13 shows the transition from the Stateflow chart. Power supplied from the RESs is 298 kW, and the demand of the loads is 280 kW. Thus, the excess of production (18 kW) is stored in the battery, as shown in Figure 13.
When the battery is fully charged (100%), the surplus of production is transferred to the auxiliary load, as shown in Figure 14, until the power generation meets the demand of the loads or the condition changes.
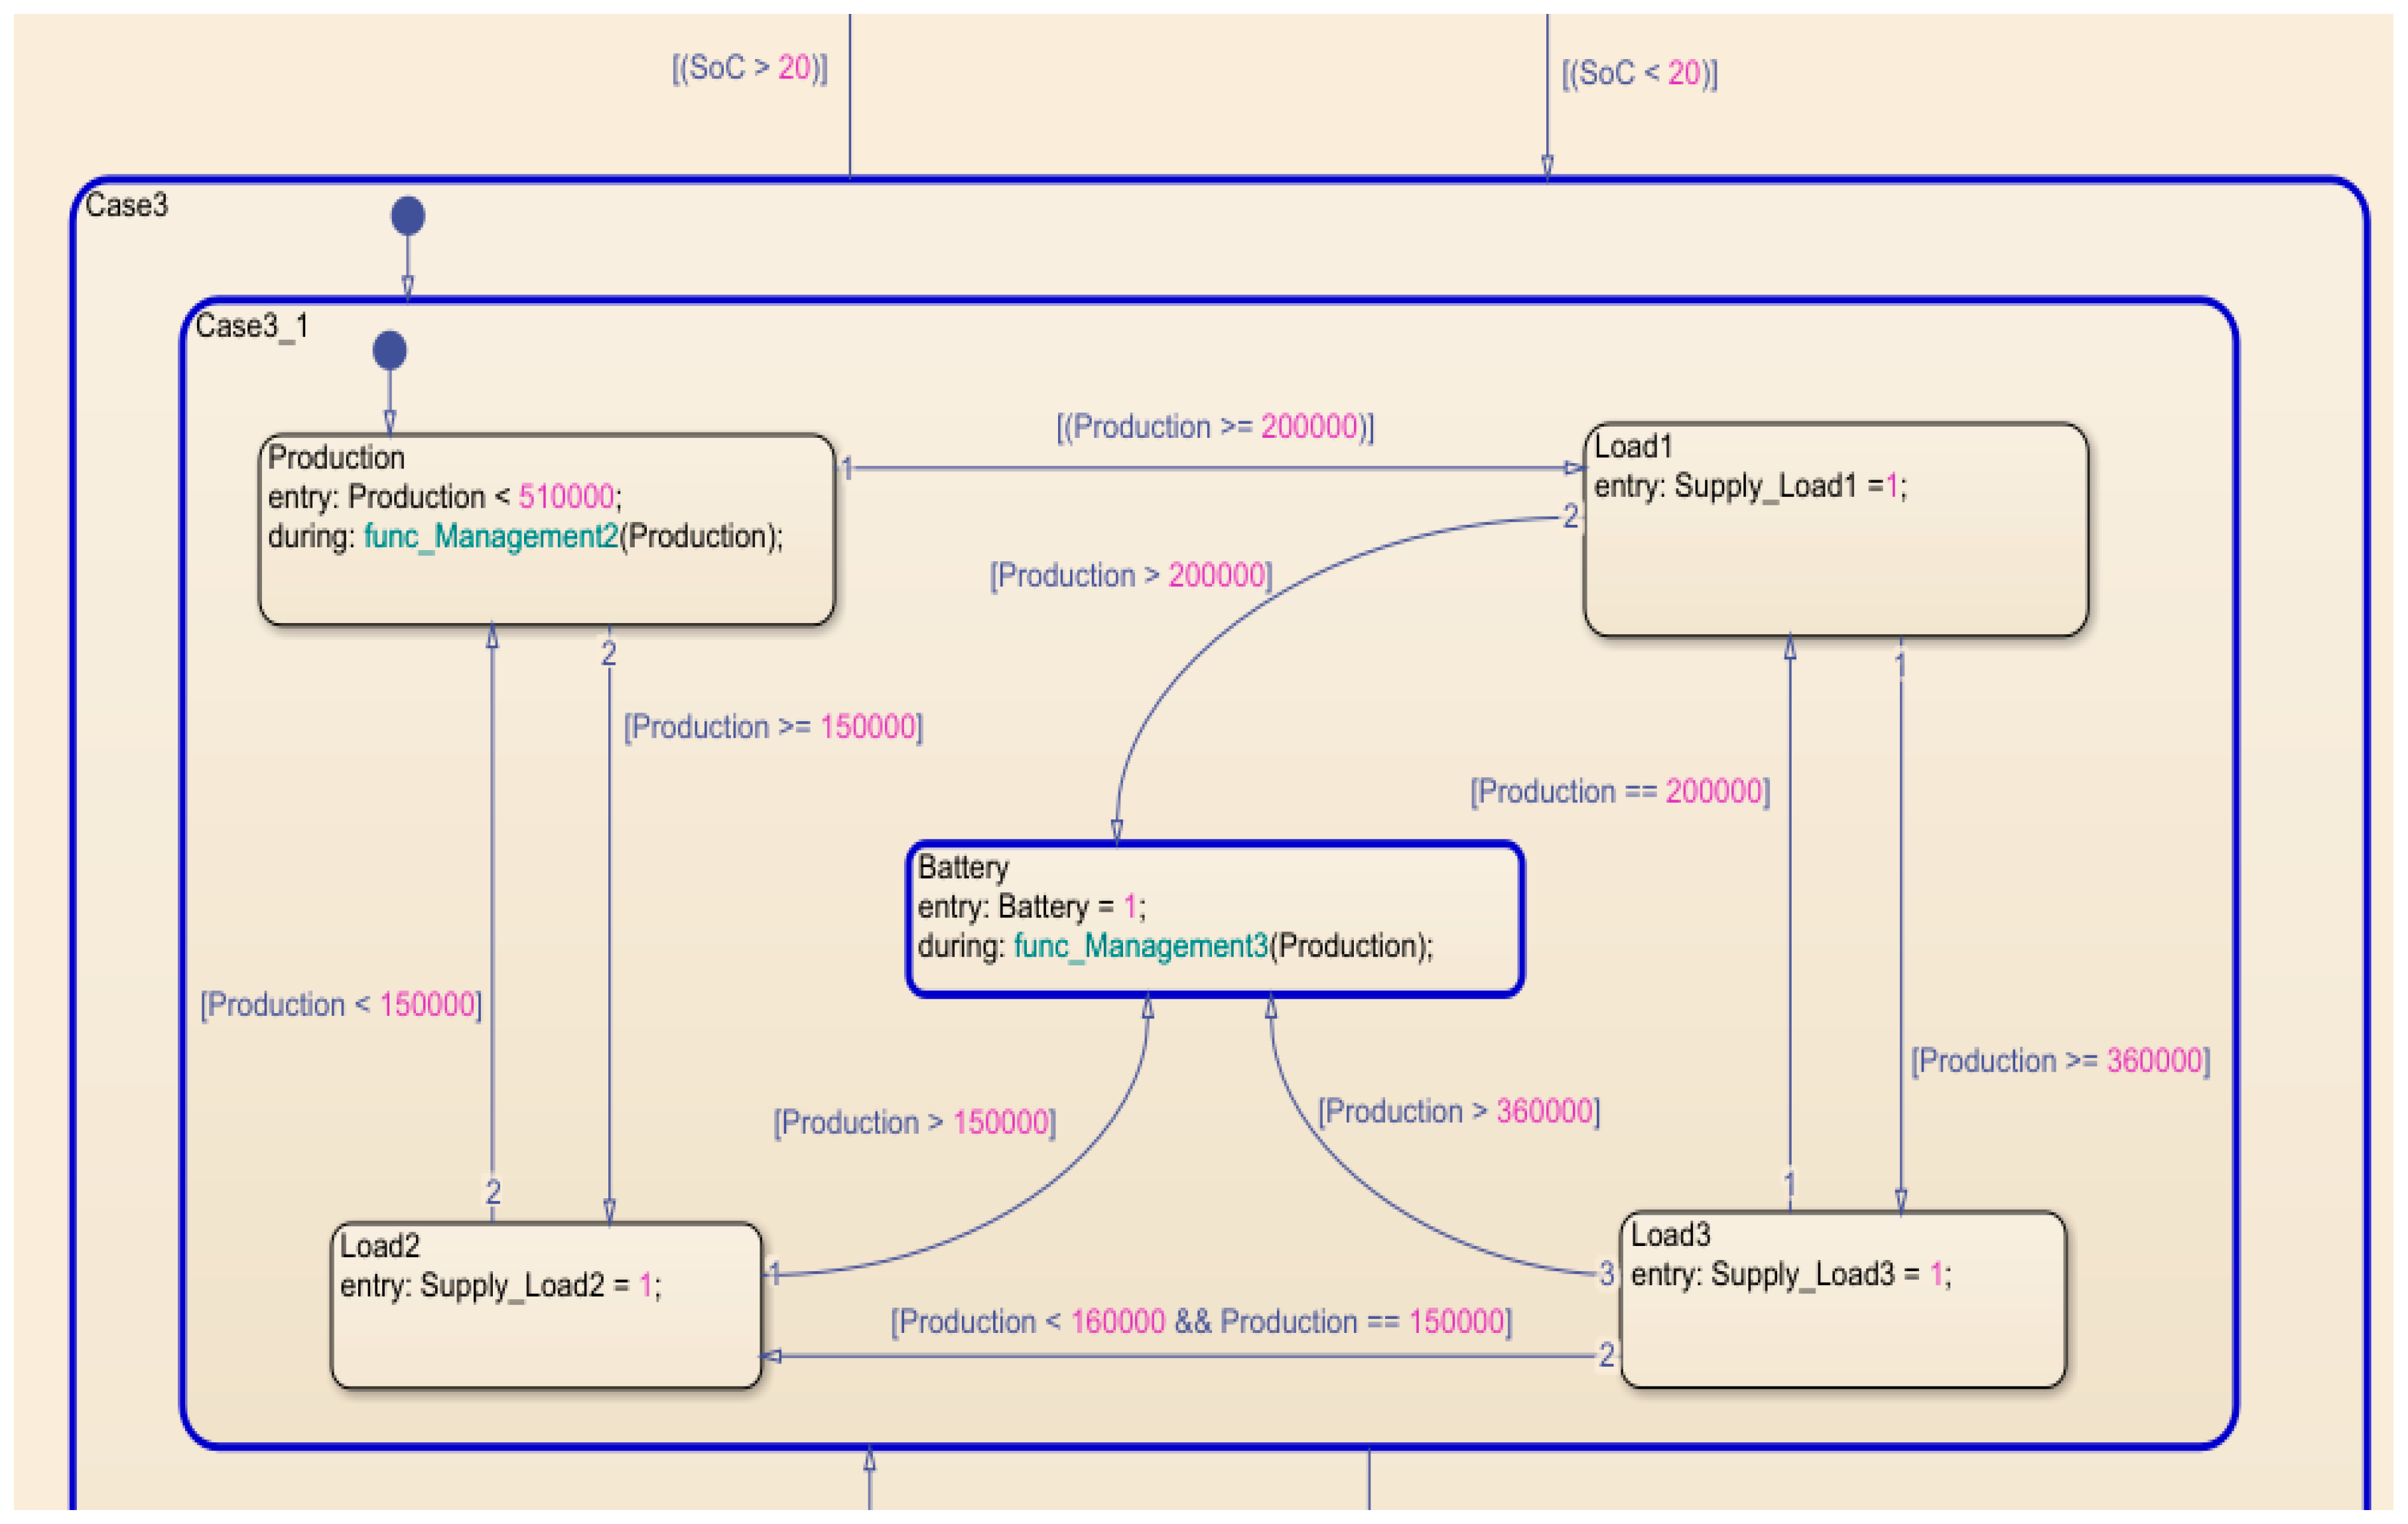
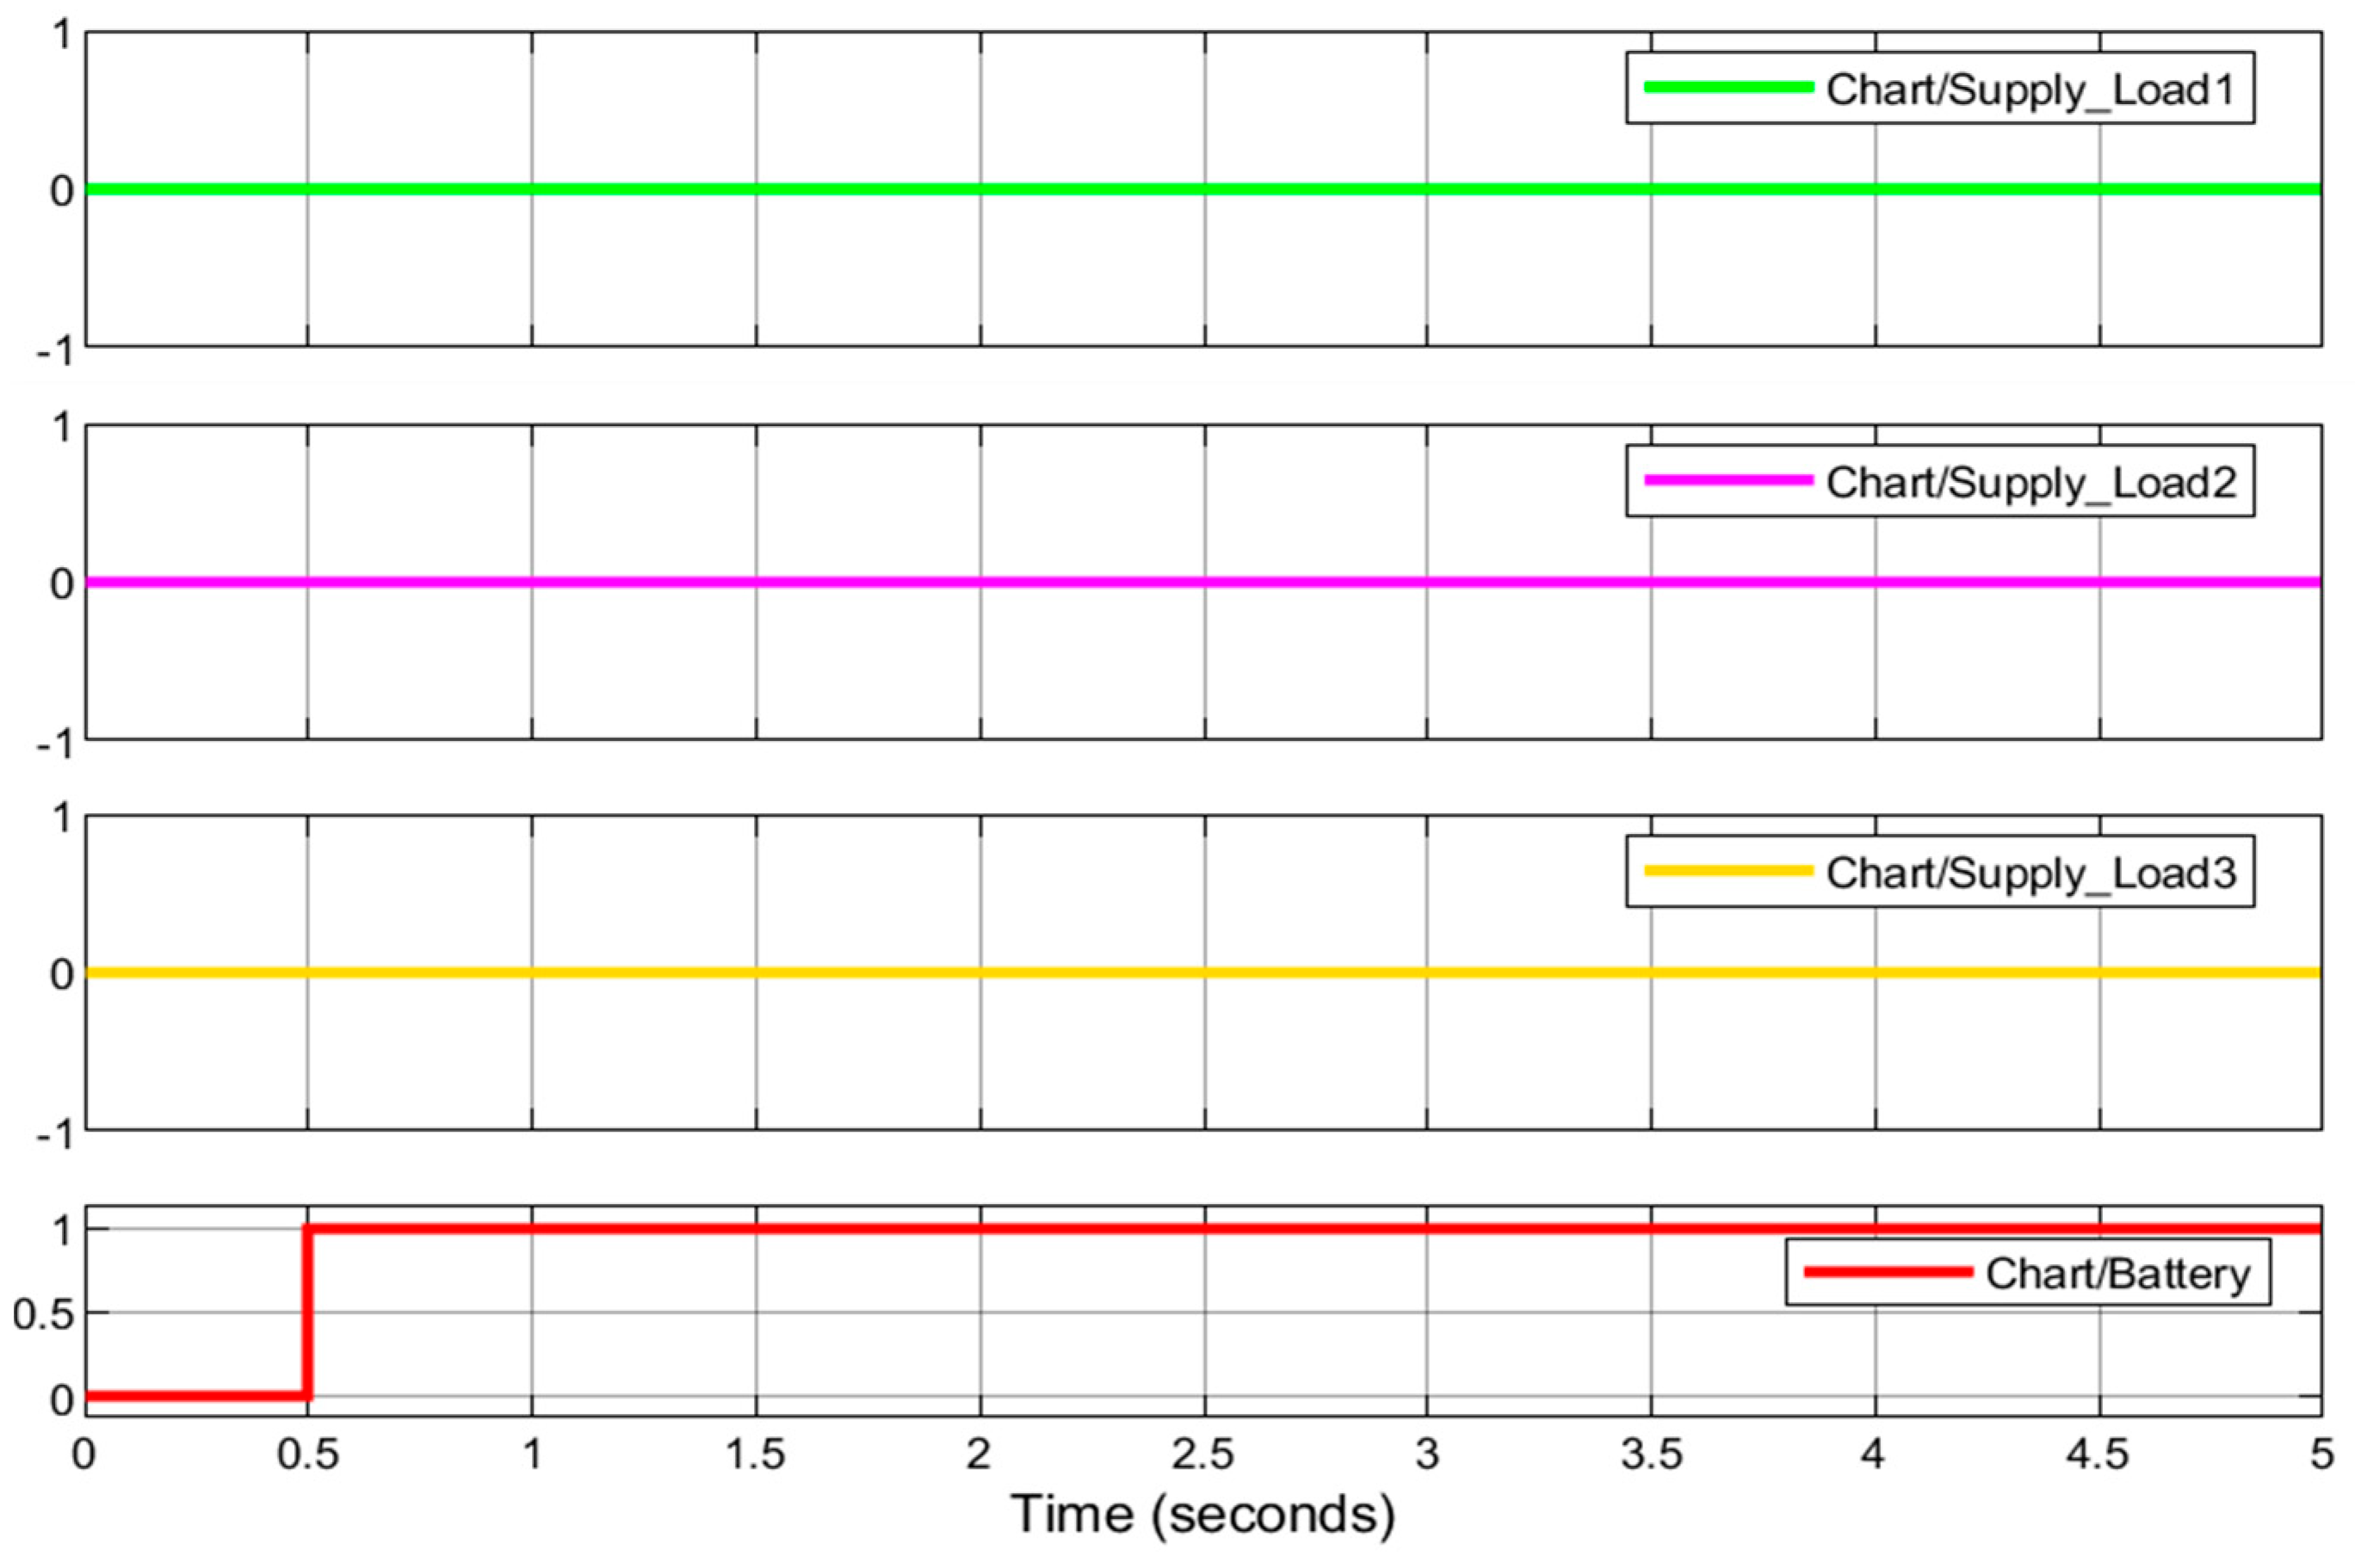
Case 3: The power generation becomes lower than the load requirements, as shown in Figure 15. Based on the EMS control, the loads are supplied by the help of the battery. Firstly, the of the battery is measured. If the it is more than 20%, then the battery is connected to be discharged. The condition is that, when the becomes equal to or less than 20%, automatically, the battery must be disconnected from the system.
In Figure 16, the battery is charging. When the minimum value of the SOC is reached, then the battery stops discharging to avoid deep discharge.
Figure 17 presents the results from the Stateflow chart, where the battery is connected to be discharged.
Once the of the battery becomes 20%, the battery is disconnected. The EMS control allows power to be supplied to the priority load, which is the industrial load (Load 1). Before that, the EMS measures the power generation to check if it is able to provide power to the priority load and charge the battery at the same time; if the condition is approved, then the battery is charged as well. Figure 18 presents the simulation results, showing that the priority load is supplied by the power generation, and Figure 19 illustrates the transition state.
When the power generation is not able to simultaneously supply the priority load and charge the battery, the EMS control checks if the power generation can handle the priority load. If the condition is met, then the priority load is supplied by the available power produced, as presented in Figure 20.
When the power generation becomes lower than the priority load, the EMS control checks if the power generated is able to supply the residential load (Load 2) or both supply the residential load and charge the battery at the same time. If the condition is approved, the residential load and the battery are supplied by the power generation, and if not, only the residential load is supplied. When the power generation falls below the residential load, the EMS control automatically disconnects all the loads (shut-down loads). In this case, no load is supplied. The loads are momentarily disconnected and the available power generation is used to charge the battery until its SOC meets the requirement or the power generation becomes active. The result of this scenario is shown in Figure 21.
The simulation results of the developed DC microgrid and energy management algorithm model are presented in this section. The model was designed and developed using MATLAB/Simulink software. In this paper, it was a question of focusing on the energy management control of the DC microgrid system to finally maintain its proper operation. The method used to design and develop this energy management system algorithm was the Stateflow logical programming environment in MATLAB/Simulink software. Based on all these scenarios, the developed energy management system algorithm has shown the ability to ensure the reliability, resiliency, robustness, and proper operation of the system.
The developed controllers reveal a promising approach towards effectively integrating renewable energy sources into DC microgrid systems. One notable aspect of the results is the robustness analysis conducted to assess the performance of the developed energy management strategy under various scenarios and conditions. During the robustness analysis, the energy management strategy was evaluated against a range of factors, including changes in renewable energy availability, and variations in load demand. This analysis provided valuable insights into the resilience and stability of the developed strategy in real-world operating conditions.
The results demonstrate that the energy management strategy exhibits robust performance across different scenarios, effectively balancing energy generation and consumption while ensuring the reliable operation of the microgrid system. Despite fluctuations in renewable energy generation and load demand, the strategy demonstrates adaptability and resilience, maintaining stable operation and minimizing disruptions. Furthermore, the robustness analysis highlights the flexibility of the energy management strategy in accommodating changes and uncertainties in the microgrid environment. By optimizing energy flow, the strategy enhances the overall efficiency and reliability of the microgrid system, while maximizing the integration of renewable energy sources.
6. Conclusions
This paper presents an energy management strategy using a Stateflow controller related to DC microgrids with the important penetration of renewable energy. The energy management system model was developed on MATLAB/Simulink. This developed DC microgrid model considered different loads such as commercial, industrial, and residential loads. The simulation was conducted to show the interaction between different components of the system and to demonstrate the operation of the developed energy management strategy model. Different results of the scenarios of the developed energy management system algorithm successfully show that this developed algorithm is capable of ensuring the reliability, the resiliency, the robustness, and the proper operation of the entire system, including the battery bank. The main advantage of this developed algorithm is that it ensures a proper relation between the charge/discharge rate of battery energy storage systems on their operating conditions and allows their SOC to be kept in the admissible limits (between 20% and 100%), according to the input power conditions from the EMS flow chart, to avoid the deep charge/discharge of the battery bank, which in return will significantly impact its lifespan and the reliability in a DC microgrid. The results demonstrated that the battery is able to handle the load demands for the different scenarios studied. Additionally, this analysis provides confidence in the practical implementation of the strategy, offering valuable guidance for designing and operating resilient and sustainable microgrid systems in the face of dynamic and uncertain operating conditions.
Author Contributions
C.B.N. is listed as the first author; he provided the most significant contributions to the project, including data acquisition, analysis, and the conceptualization of a practical energy management strategy testing model. M.A. and A.A., listed as the second and third authors, respectively, played vital roles in guiding the project, providing revisions, and ensuring quality control throughout its development. All authors have read and agreed to the published version of the manuscript.
Funding
This research received no external funding.
Institutional Review Board Statement
Not applicable.
Informed Consent Statement
Not applicable.
Data Availability Statement
Access to the datasets utilized in this study is available upon request from the corresponding author.
Acknowledgments
This paper is based on the thesis work and results of author C. Ndeke Bipongo. This paper is a summary of the most important aspects of his thesis entitled “Energy management of a battery energy storage system for renewable energy DC microgrid”.
Conflicts of Interest
The authors declare no conflict of interest.
Nomenclature
| Solar irradiance described through a current source (Ampere) | |
| Diode current (Ampere) | |
| PV output current (Ampere) | |
| Series resistance (Ω) | |
| Parallel resistance (Ω) | |
| PV output voltage (Volt) | |
| and | Number of cells connected in parallel and series |
| Boltzmann’s coefficient (1.380658 × 10⁻²³ J/K) | |
| Ideal diode factor between 1 and 5 | |
| Reverse saturation current of cell at T (Ampere) | |
| Reverse saturation current at (Ampere) | |
| Short-circuit current at a reference temperature of the cell (Ampere) | |
| Coefficient of the short-circuit temperature ( | |
| T | Absolute temperature of the junction (K) |
| Cell temperature (K) | |
| Reference temperature (K) | |
| PV output power (Watt-peak) | |
| PV production efficiency | |
| Radiation of solar (kWh/) | |
| A | Area () |
| Base wind velocity (m/s) | |
| Gust wind velocity (m/s) | |
| Ramp wind component (m/s) | |
| Wind speed (m/s) | |
| Wind turbine output power (Watt) | |
| Energy drawn by the wind turbine (Joule) | |
| Air density () | |
| Maximum wind turbine output power (Watt) | |
| Pitch angle of the blade (deg, ) | |
| Tip speed ratio of the turbine | |
| Power coefficient | |
| Maximum wind turbine produced power (Watt) | |
| Maximum wind turbine produced voltage (Volt) | |
| Maximum wind turbine produced current (Ampere) | |
| Open circuit voltage of the battery (Volt) | |
| Polarization coefficient | |
| Battery capacity (Ah) | |
| q | Charge of an electron equal to |
| Battery internal resistance (Ω) | |
| Generated power from the renewable energy resources (Watt) | |
| Power produced by PV (Watt-peak) | |
| Power produced by wind (Watt) | |
| SOC | State of charge (%) |
Appendix A. Block Diagram of the Developed EMS for DC Micro-Grid System Model
Figure A1.
Block diagram of the developed DC microgrid system and EMS algorithm.

References
- Lu, X.; Sun, K.; Guerrero, J.M.; Vasquez, J.C.; Huang, L.; Teodorescu, R. SoC-based droop method for distributed energy Storage in DC microgrid applications. In Proceedings of the IEEE International Symposium on Industrial Electronics, Hangzhou, China, 28–31 May 2012; pp. 1640–1645. [Google Scholar] [CrossRef]
- Lasseter, R.H.; Paigi, P. Microgrid: A conceptual solution. In Proceedings of the IEEE 35th Annual Power Electronics Specialists Conference, Aachen, Germany, 20–25 June 2004; Volume 6, pp. 4285–4290. [Google Scholar] [CrossRef]
- Topić, D.; Knežević, G.; Perko, J.; Kosić, D. Simplified model for optimal sizing of the off-grid PV system regarding value of loss of load probability. Teh. Vjesn. 2018, 25, 420–426. [Google Scholar] [CrossRef]
- Takele, H. Distributed generation adverse impact on the distribution networks protection and its mitigation. Heliyon 2022, 8, e09624. [Google Scholar] [CrossRef]
- Maor, T.T.; El-Kishky, H. Impacts of Power System-Tied Distributed Generation on the Performance of Protection Systems; University of Texas at Tyler: Tyler, TX, USA, 2017; Available online: https://scholarworks.uttyler.edu/ee_grad (accessed on 1 December 2017).
- Morstyn, T.; Hredzak, B.; Agelidis, V.G. Control Strategies for Microgrids with Distributed Energy Storage Systems: An Overview. IEEE Trans. Smart Grid 2018, 9, 3652–3666. [Google Scholar] [CrossRef]
- Faisal, M.; Hannan, M.A.; Ker, P.J.; Hussain, A.; Mansor, M.B.; Blaabjerg, F. Review of energy storage system technologies in microgrid applications: Issues and challenges. IEEE Access 2018, 6, 35143–35164. [Google Scholar] [CrossRef]
- Nadeem, F.; Hussain SM, S.; Tiwari, P.K.; Goswami, A.K.; Ustun, T.S. Comparative review of energy storage systems, their roles, and impacts on future power systems. IEEE Access 2019, 7, 4555–4585. [Google Scholar] [CrossRef]
- Wang, C.; Yu, Y.; Niu, J.; Liu, Y.; Bridges, D.; Liu, X.; Pooran, J.; Zhang, Y.; Hu, A. Recent Progress of Metal–Air Batteries—A Mini Review. Appl. Sci. 2019, 9, 2787. [Google Scholar] [CrossRef]
- Agrawal, M.; Mittal, A. Micro Grid Technological Activities across the Globe: A review. Int. J. Res. Rev. Appl. Sci. 2011, 7, 147–152. Available online: http://www.arpapress.com/Volumes/Vol7Issue2/IJRRAS_7_2_07.pdf (accessed on 1 January 2011).
- Lotfi, H.; Khodaei, A. AC versus DC microgrid planning. IEEE Trans. Smart Grid 2017, 8, 296–304. [Google Scholar] [CrossRef]
- Wu, X.; Shi, S.; Wang, Z. Micro-grid planning considering the supply adequacy of critical loads under the uncertain formation of sub-micro-grids. Sustainability 2019, 11, 4683. [Google Scholar] [CrossRef]
- Hirsch, A.; Parag, Y.; Guerrero, J. Microgrids: A review of technologies, key drivers, and outstanding issues. Renew. Sustain. Energy Rev. 2018, 90, 402–411. [Google Scholar] [CrossRef]
- Beykverdi, M.; Jalilvand, A.; Ehsan, M. Intelligent Power Management of Islanded DC Microgrid based on Droop Fuzzy Control. Am. J. Sci. 2017, 1, 1–11. [Google Scholar]
- Yadav, A.K.; Ray, A.; Lokhande, M.M. Low-voltage DC microgrid network: A case study for Standalone system. Int. J. Renew. Energy Res. 2017, 7, 1186–1194. [Google Scholar]
- Lago, J.; Heldwein, M.L. Operation and control-oriented modeling of a power converter for current balancing and stability improvement of DC active distribution networks. IEEE Trans. Power Electron. 2011, 26, 877–885. [Google Scholar] [CrossRef]
- Kishore, P.M.; Ravikumar, B. Refined Hybrid Microgrid Architecture for the Improvement of Voltage Profile. Energy Procedia 2016, 90, 645–654. [Google Scholar] [CrossRef]
- Vegunta, S.C.; Higginson, M.J.; Kenarangui, Y.E.; Li, G.T.; Zabel, D.W.; Tasdighi, M.; Shadman, A. AC microgrid protection system design challenges—A practical experience. Energies 2021, 14, 2016. [Google Scholar] [CrossRef]
- Ustun, T.S.; Ozansoy, C.; Zayegh, A. Recent developments in microgrids and example cases around the world—A review. Renew. Sustain. Energy Rev. 2011, 15, 4030–4041. [Google Scholar] [CrossRef]
- Muthuvel, P.; Arul Daniel, S.; Paul, S.K. Sizing of PV array in a DC nano-grid for isolated households after alteration in time of consumption. Eng. Sci. Technol. Int. J. 2017, 20, 1632–1641. [Google Scholar] [CrossRef]
- Maghami, M.R.; Hizam, H.; Gomes, C.; Radzi, M.A.; Rezadad, M.I.; Hajighorbani, S. Power loss due to soiling on solar panel: A review. Renew. Sustain. Energy Rev. 2016, 59, 1307–1316. [Google Scholar] [CrossRef]
- Wang, R. Research on Solar Power Generation Technology of Power Plant. In Proceedings of the Conference of Russian Young Researchers in Electrical and Electronic Engineering, ElConRus, Saint Petersburg, Russia, 25–28 January 2022; Volume 2022, pp. 1295–1301. [Google Scholar] [CrossRef]
- Das, S.; Mazumder, D.; Mia, N.; Rahman, S. A review on power generation from wind power created by fast moving train perspective Bangladesh. In Proceedings of the IEEE International Conference on Technology, Engineering, Management for Societal Impact Using Marketing, Entrepreneurship and Talent, TEMSMET, Bengaluru, India, 10 December 2020. [Google Scholar] [CrossRef]
- Camm, E.H.; Behnke, M.R.; Bolado, O.; Bollen, M.; Bradt, M.; Brooks, C.; Dilling, W.; Edds, M.; Hejdak, W.J.; Haouseman, D.; et al. Characteristics of wind turbine generators for wind power plants. In Proceedings of the IEEE Power and Energy Society General Meeting, PES ’09, Calgary, AB, Canada, 26–30 July 2009; pp. 1–5. [Google Scholar] [CrossRef]
- Sharif, Y.A.; Rahman, M.; Soloiu, V.; Kiernan, M.; Grall, D.; Hossain, M.S. Wind Power Generation from Multiple Array Configuration and Efficient Power Integration to Grid. In Proceedings of the North American Power Symposium, NAPS, College Station, TX, USA, 14–16 November 2021. [Google Scholar] [CrossRef]
- Schastlivtsev, A.I.; Borzenko, V.I.; Dunikov, D.O. Improvement of efficiency of geothermal power plants by using hydrogen combustion technologies. In Proceedings of the International Science and Technology Conference “EastConf”, EastConf, Vladivostok, Russia, 1–2 March 2019; pp. 1–6. [Google Scholar] [CrossRef]
- Jolie, E.; Scott, S.; Faulds, J.; Chambefort, I.; Axelsson, G.; Gutiérrez-Negrín, L.C.; Zemedkun, M.T. Geological controls on geothermal resources for power generation. Nat. Rev. Earth Environ. 2021, 2, 324–339. [Google Scholar] [CrossRef]
- Ahlfors, C.; Amelin, M. Weekly planning of hydropower in systems with large volumes and varying power generation: A literature review. In Proceedings of the IEEE Madrid PowerTech, PowerTech 2021—Conference Proceedings, Madrid, Spain, 28 June–2 July 2021. [Google Scholar] [CrossRef]
- Sysoev, A.A.; Lazareva, N.V.; Proskurina, A.A. Modeling complex hydropower systems for research and training. In Proceedings of the International Conference on Industrial Engineering, Applications and Manufacturing, ICIEAM 2021, Sochi, Russia, 17–21 May 2021; pp. 152–157. [Google Scholar] [CrossRef]
- Ali, G.; El-Hawary, M. Generating Heat and Power from Biomass—An Overview. In Proceedings of the IEEE Canadian Conference of Electrical and Computer Engineering, (CCECE), Edmonton, AB, Canada, 5–8 May 2019; pp. 8–13. [Google Scholar] [CrossRef]
- Tumiran; Na’iem, M.; Sarjiya; Putranto, L.M.; Listyanto, T.; Priyanto, A.; Muthahhari, A.A.; Budi, R.F.S. Potential of Biomass as RE Source for Sustainable Electricity Supply in Eastern Indonesia. In Proceedings of the 3rd International Conference on High Voltage Engineering and Power Systems, ICHVEPS, Bandung, Indonesia, 5–6 October 2021; pp. 22–27. [Google Scholar] [CrossRef]
- Aslanidou, I.; Rahman, M.; Zaccaria, V.; Kyprianidis, K.G. Micro Gas Turbines in the Future Smart Energy System: Fleet Monitoring, Diagnostics, and System Level Requirements. Front. Mech. Eng. 2021, 7, 676853. [Google Scholar] [CrossRef]
- Asgharian, P.; Noroozian, R. Modeling and simulation of microturbine generation system for simultaneous grid connected/islanding operation. In Proceedings of the 24th Iranian Conference on Electrical Engineering, ICEE, Shiraz, Iran, 10–12 May 2016; pp. 1528–1533. [Google Scholar] [CrossRef]
- Premadasa, P.N.D.; Silva, C.M.M.R.S.; Chandima, D.P. An optimal configuration of diesel generator and battery storage system for off-grid residential applications. In Proceedings of the IEEE Electrical Power and Energy Conference, EPEC, Toronto, ON, Canada, 22–31 October 2021; pp. 486–491. [Google Scholar] [CrossRef]
- Bidram, A.; Davoudi, A. Hierarchical structure of microgrids control system. IEEE Trans. Smart Grid 2012, 3, 1963–1976. [Google Scholar] [CrossRef]
- Beerten, J.; Belmans, R. Analysis of power sharing and voltage deviations in droop-controlled DC grids. IEEE Trans. Power Syst. 2013, 28, 4588–4597. [Google Scholar] [CrossRef]
- Dragicevic, T.; Guerrero, J.M.; Vasquez, J.C.; Skrlec, D. Supervisory control of an adaptive-droop regulated DC microgrid with battery management capability. IEEE Trans. Power Electron. 2014, 29, 695–706. [Google Scholar] [CrossRef]
- Abhishek, A.; Ranjan, A.; Devassy, S.; Kumar Verma, B.; Ram, S.K.; Dhakar, A.K. Review of hierarchical control strategies for DC microgrid. IET Renew. Power Gener. 2020, 14, 1631–1640. [Google Scholar] [CrossRef]
- Mandelli, S.; Barbieri, J.; Mereu, R.; Colombo, E. Off-grid systems for rural electrification in developing countries: Definitions, classification and a comprehensive literature review. Renew. Sustain. Energy Rev. 2016, 58, 1621–1646. [Google Scholar] [CrossRef]
- Azzollini, I.A.; Felice VDi Fraboni, F.; Cavallucci, L.; Breschi, M.; Rosa, A.D.; Zini, G. Lead-acid battery modeling over full state of charge and discharge range. IEEE Trans. Power Syst. 2018, 33, 6422–6429. [Google Scholar] [CrossRef]
- Gunasekaran, M.; Ismail, H.M.; Chokkalingam, B.; Mihet-Popa, L.; Padmanaban, S. Energy management strategy for rural communities’ DC micro grid power system structure with maximum penetration of renewable energy sources. Appl. Sci. 2018, 8, 585. [Google Scholar] [CrossRef]
- Bhayo, M.A.; Yatim AH, M.; Khokhar, S.; Aziz MJ, A.; Idris, N.R.N. Modeling of Wind Turbine Simulator for analysis of the wind energy conversion system using MATLAB/Simulink. In Proceedings of the IEEE Conference on Energy Conversion, CENCON, Johor Bahru, Malaysia, 19–20 October 2015; pp. 122–127. [Google Scholar] [CrossRef]
- Yu, S.Y.; Kim, H.J.; Kim, J.H.; Han, B.M. SoC-based output voltage control for BESS with a lithium-ion battery in a stand-alone DC microgrid. Energies 2016, 9, 924. [Google Scholar] [CrossRef]
- Camacho, O.M.F.; Mihet-Popa, L. Tests de recharge rapide et intelligente de batteries pour voitures électriques utilisant des énergies renouvelables. Oil Gas Sci. Technol. 2016, 71, 13. [Google Scholar] [CrossRef]
- Zhou, N.; Liu, N.; Zhang, J.; Lei, J. Multi-objective optimal sizing for battery storage of PV-based microgrid with demand response. Energies 2016, 9, 591. [Google Scholar] [CrossRef]
- Ndeke, C.; Marco, A. Energy Management of a Battery Energy Storage System for Renewable Energy DC Microgrid. Master’s Thesis, Cape Peninsula University of Technology, Cape Town, South Africa, 2021. [Google Scholar]
Figure 1.
Classification of the microgrids based on power type [9].
Figure 1.
Classification of the microgrids based on power type [9].

Figure 2.
Islanded DC microgrid structure [14].
Figure 2.
Islanded DC microgrid structure [14].

Figure 3.
Block diagram of the developed system.
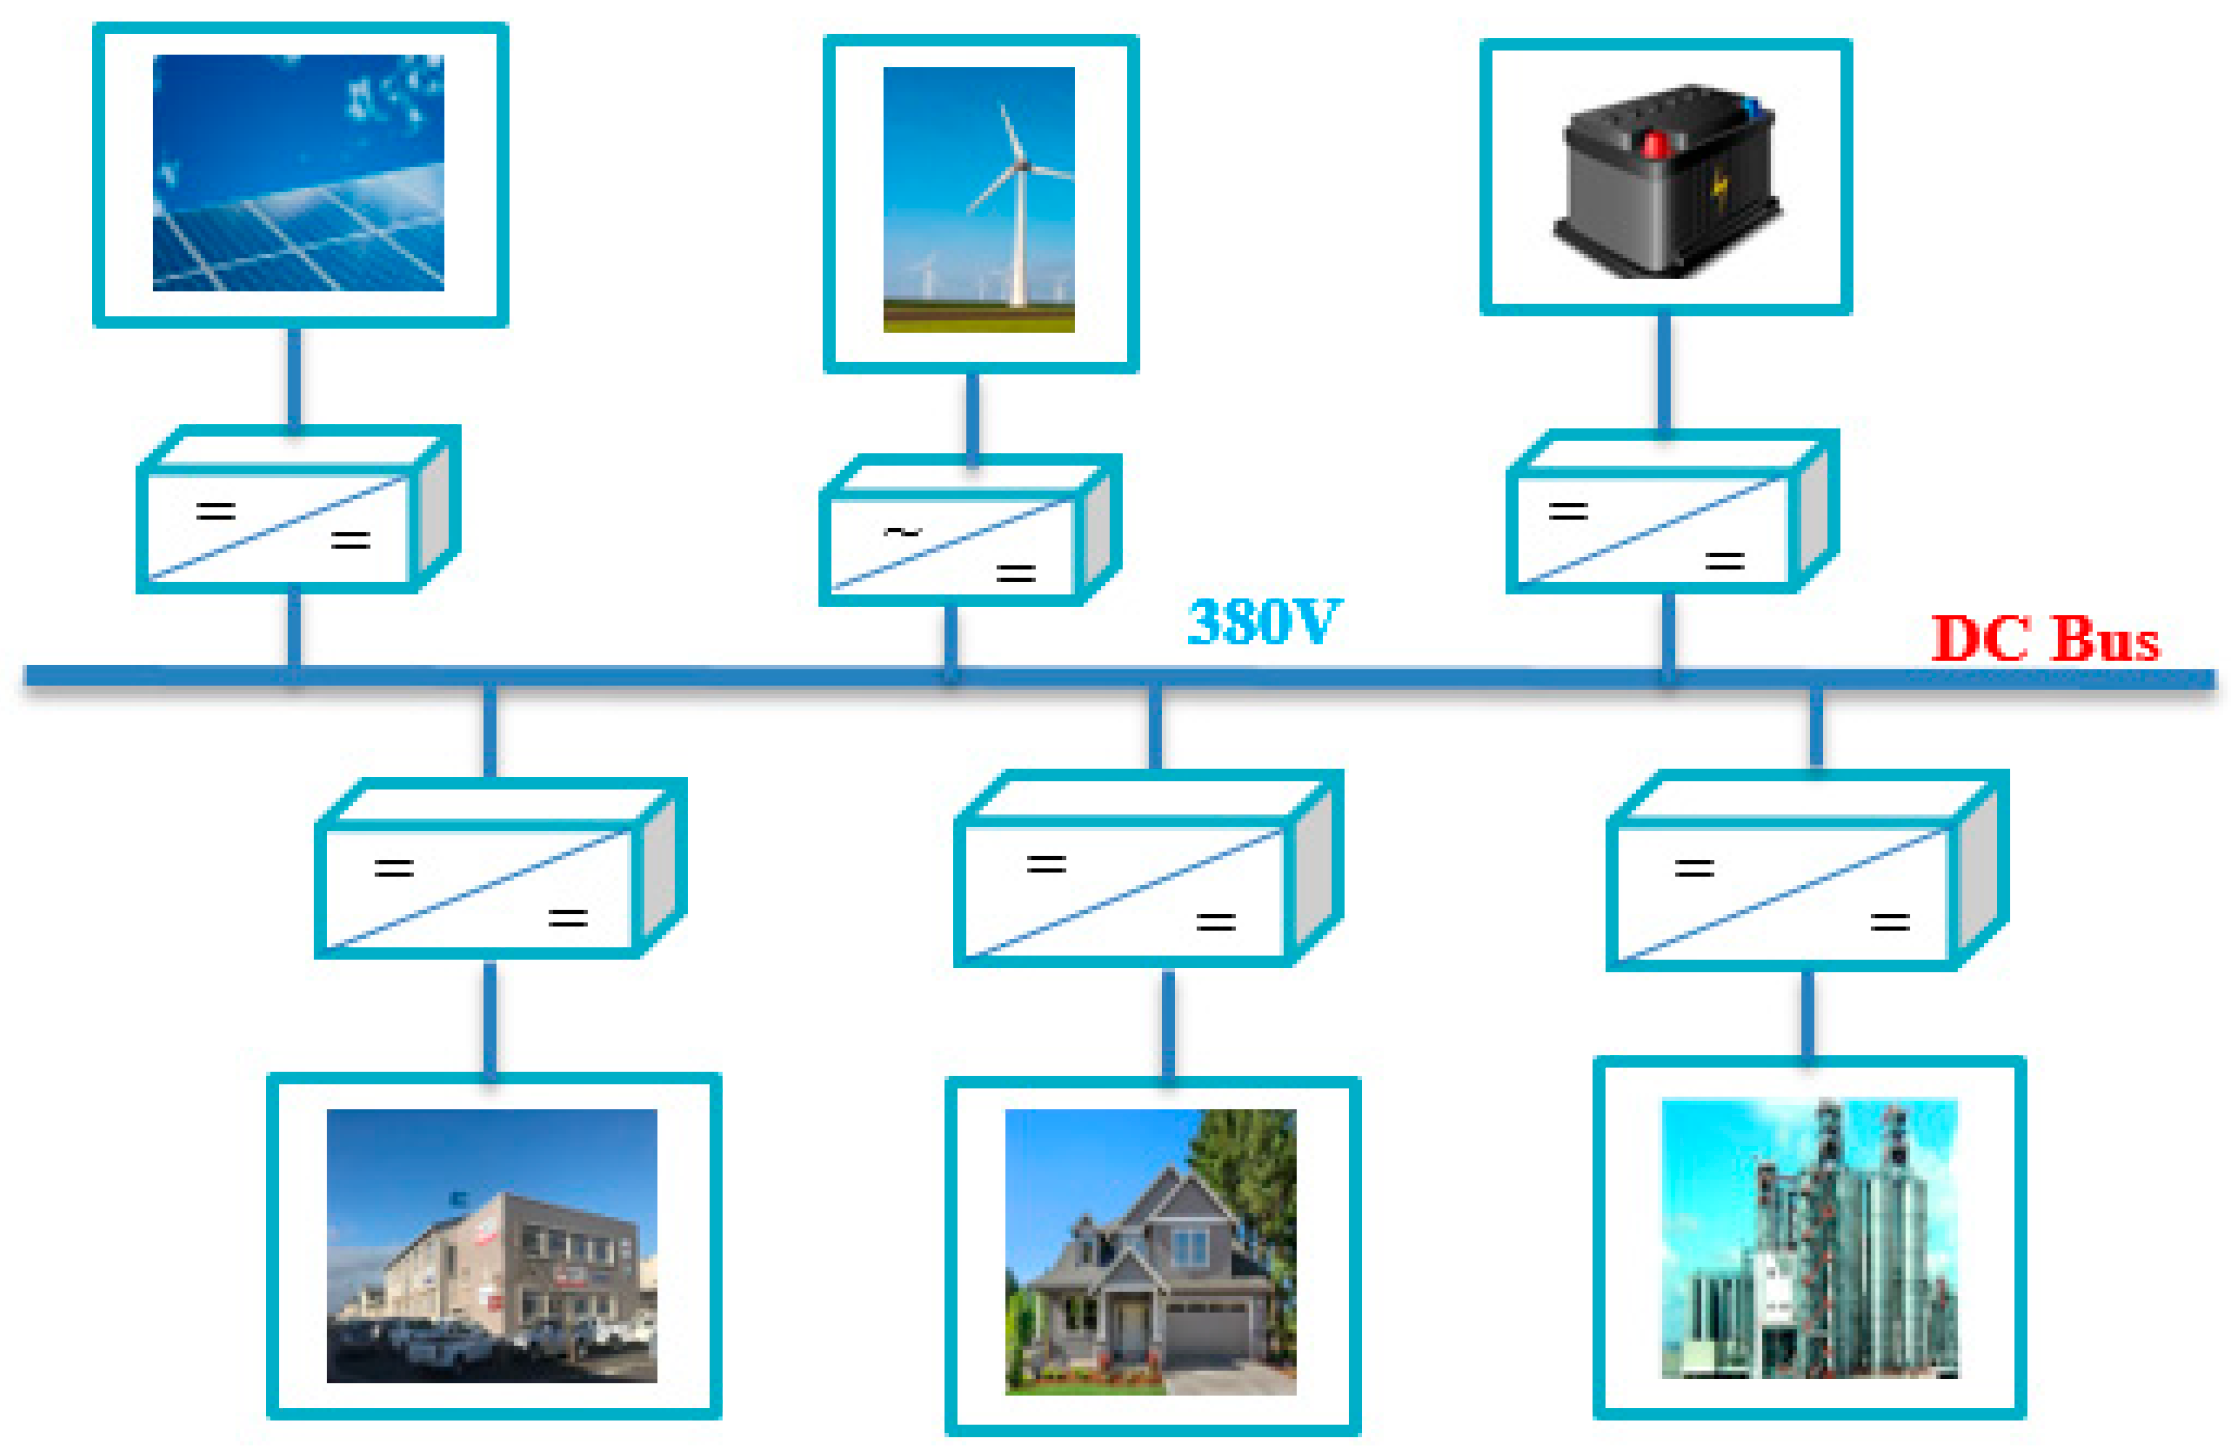
Figure 4.
A single equivalent circuit model of a PV cell [40].
Figure 4.
A single equivalent circuit model of a PV cell [40].

Figure 5.
PV output power and voltage from the developed DC microgrid model.
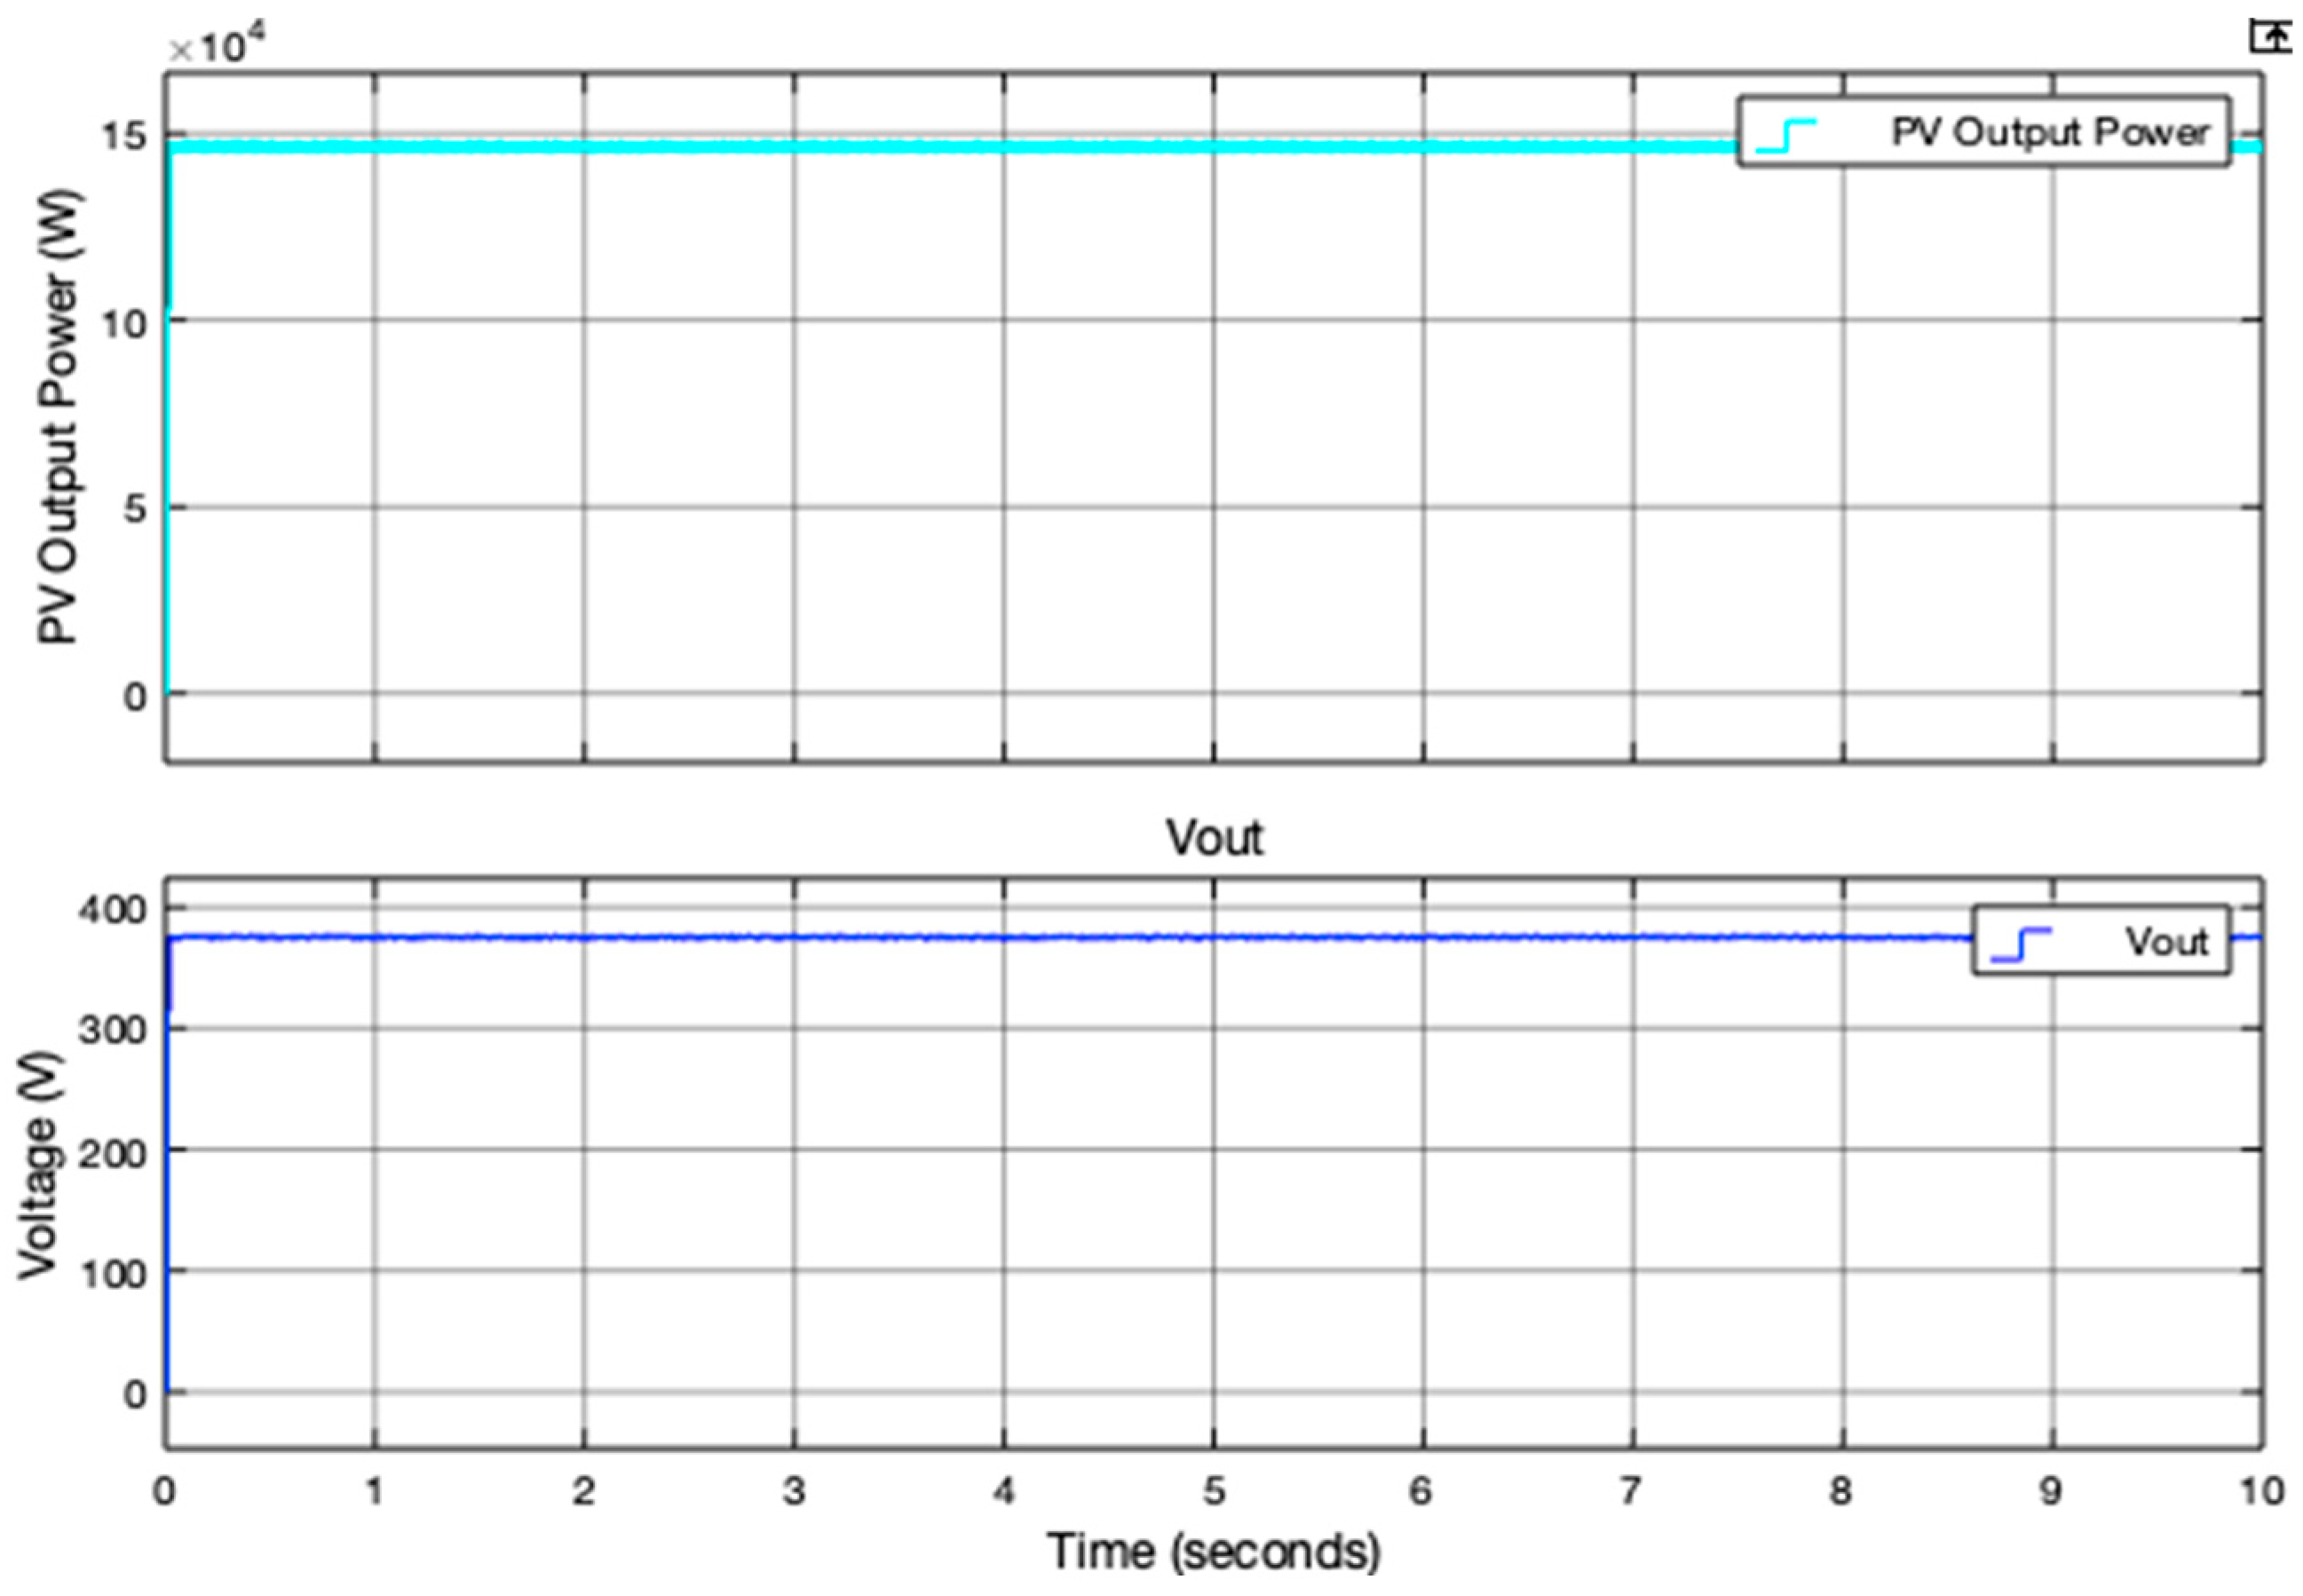
Figure 6.
Wind output power and voltage from the developed DC microgrid model.

Figure 7.
Power and voltage generation.

Figure 8.
Transition state from the Stateflow chart for the first scenario.

Figure 9.
EMS control output results for the first scenario.
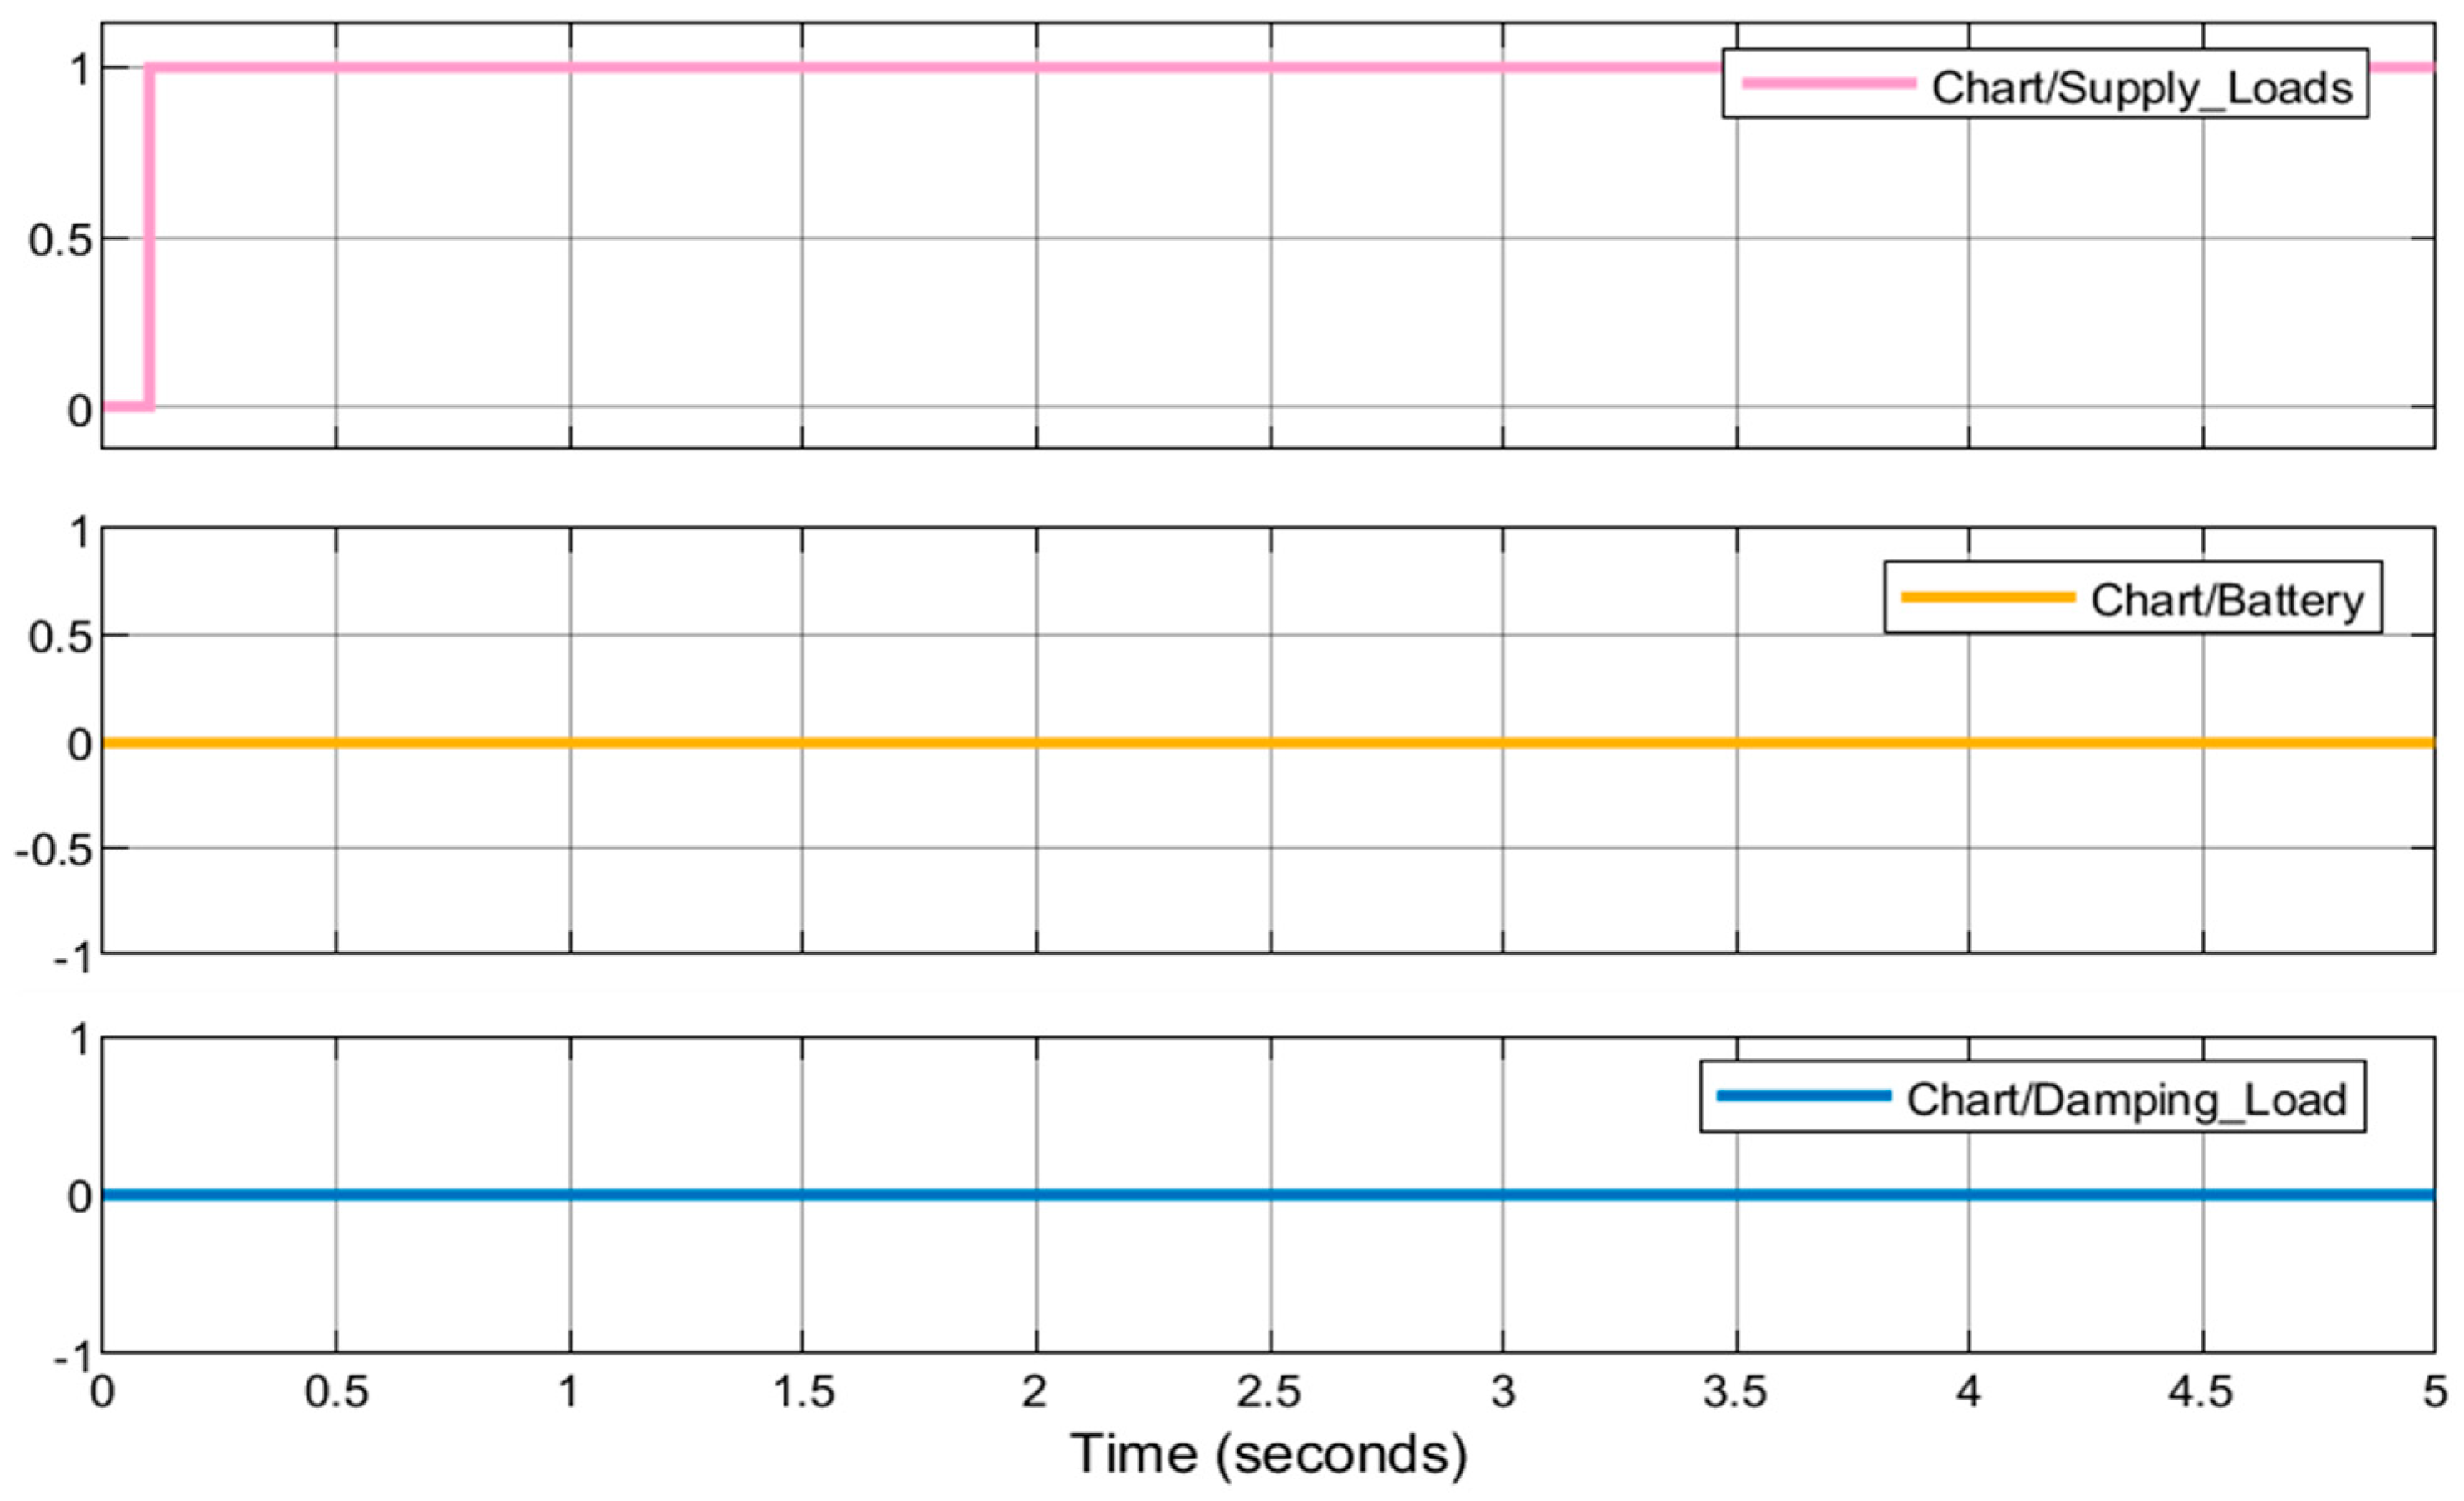
Figure 10.
Power generation.
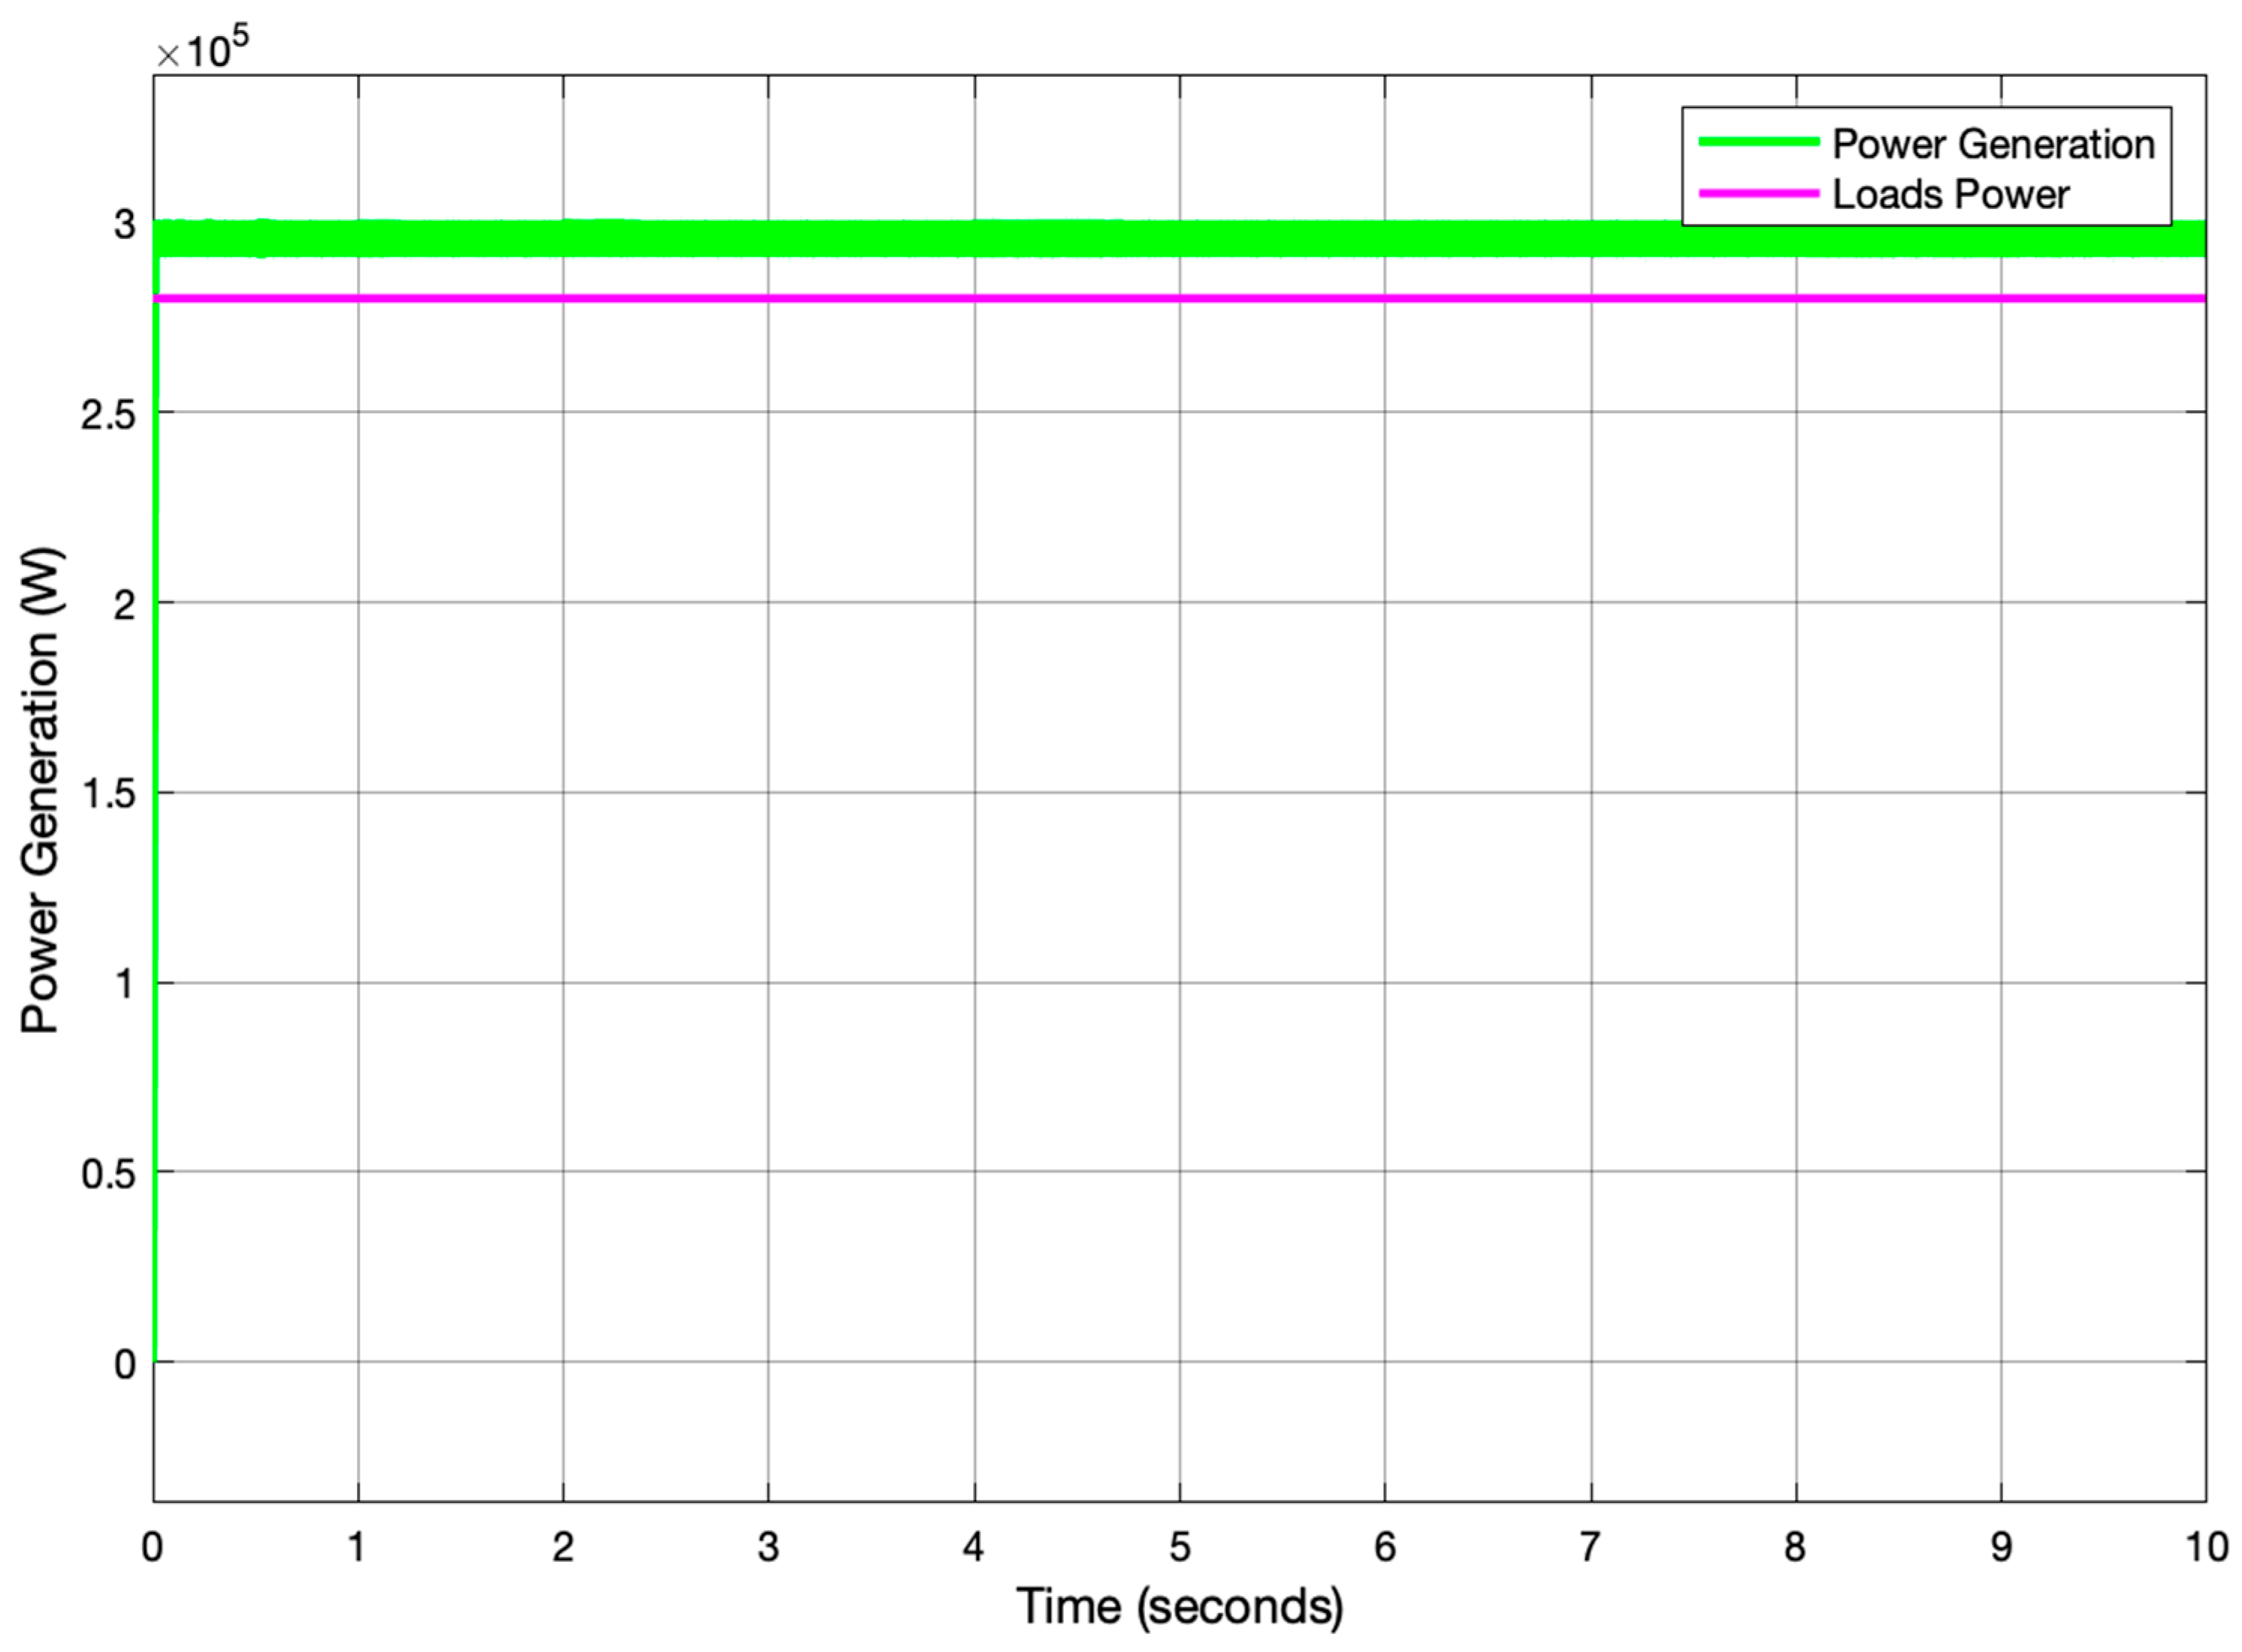
Figure 11.
Charging mode of the battery.
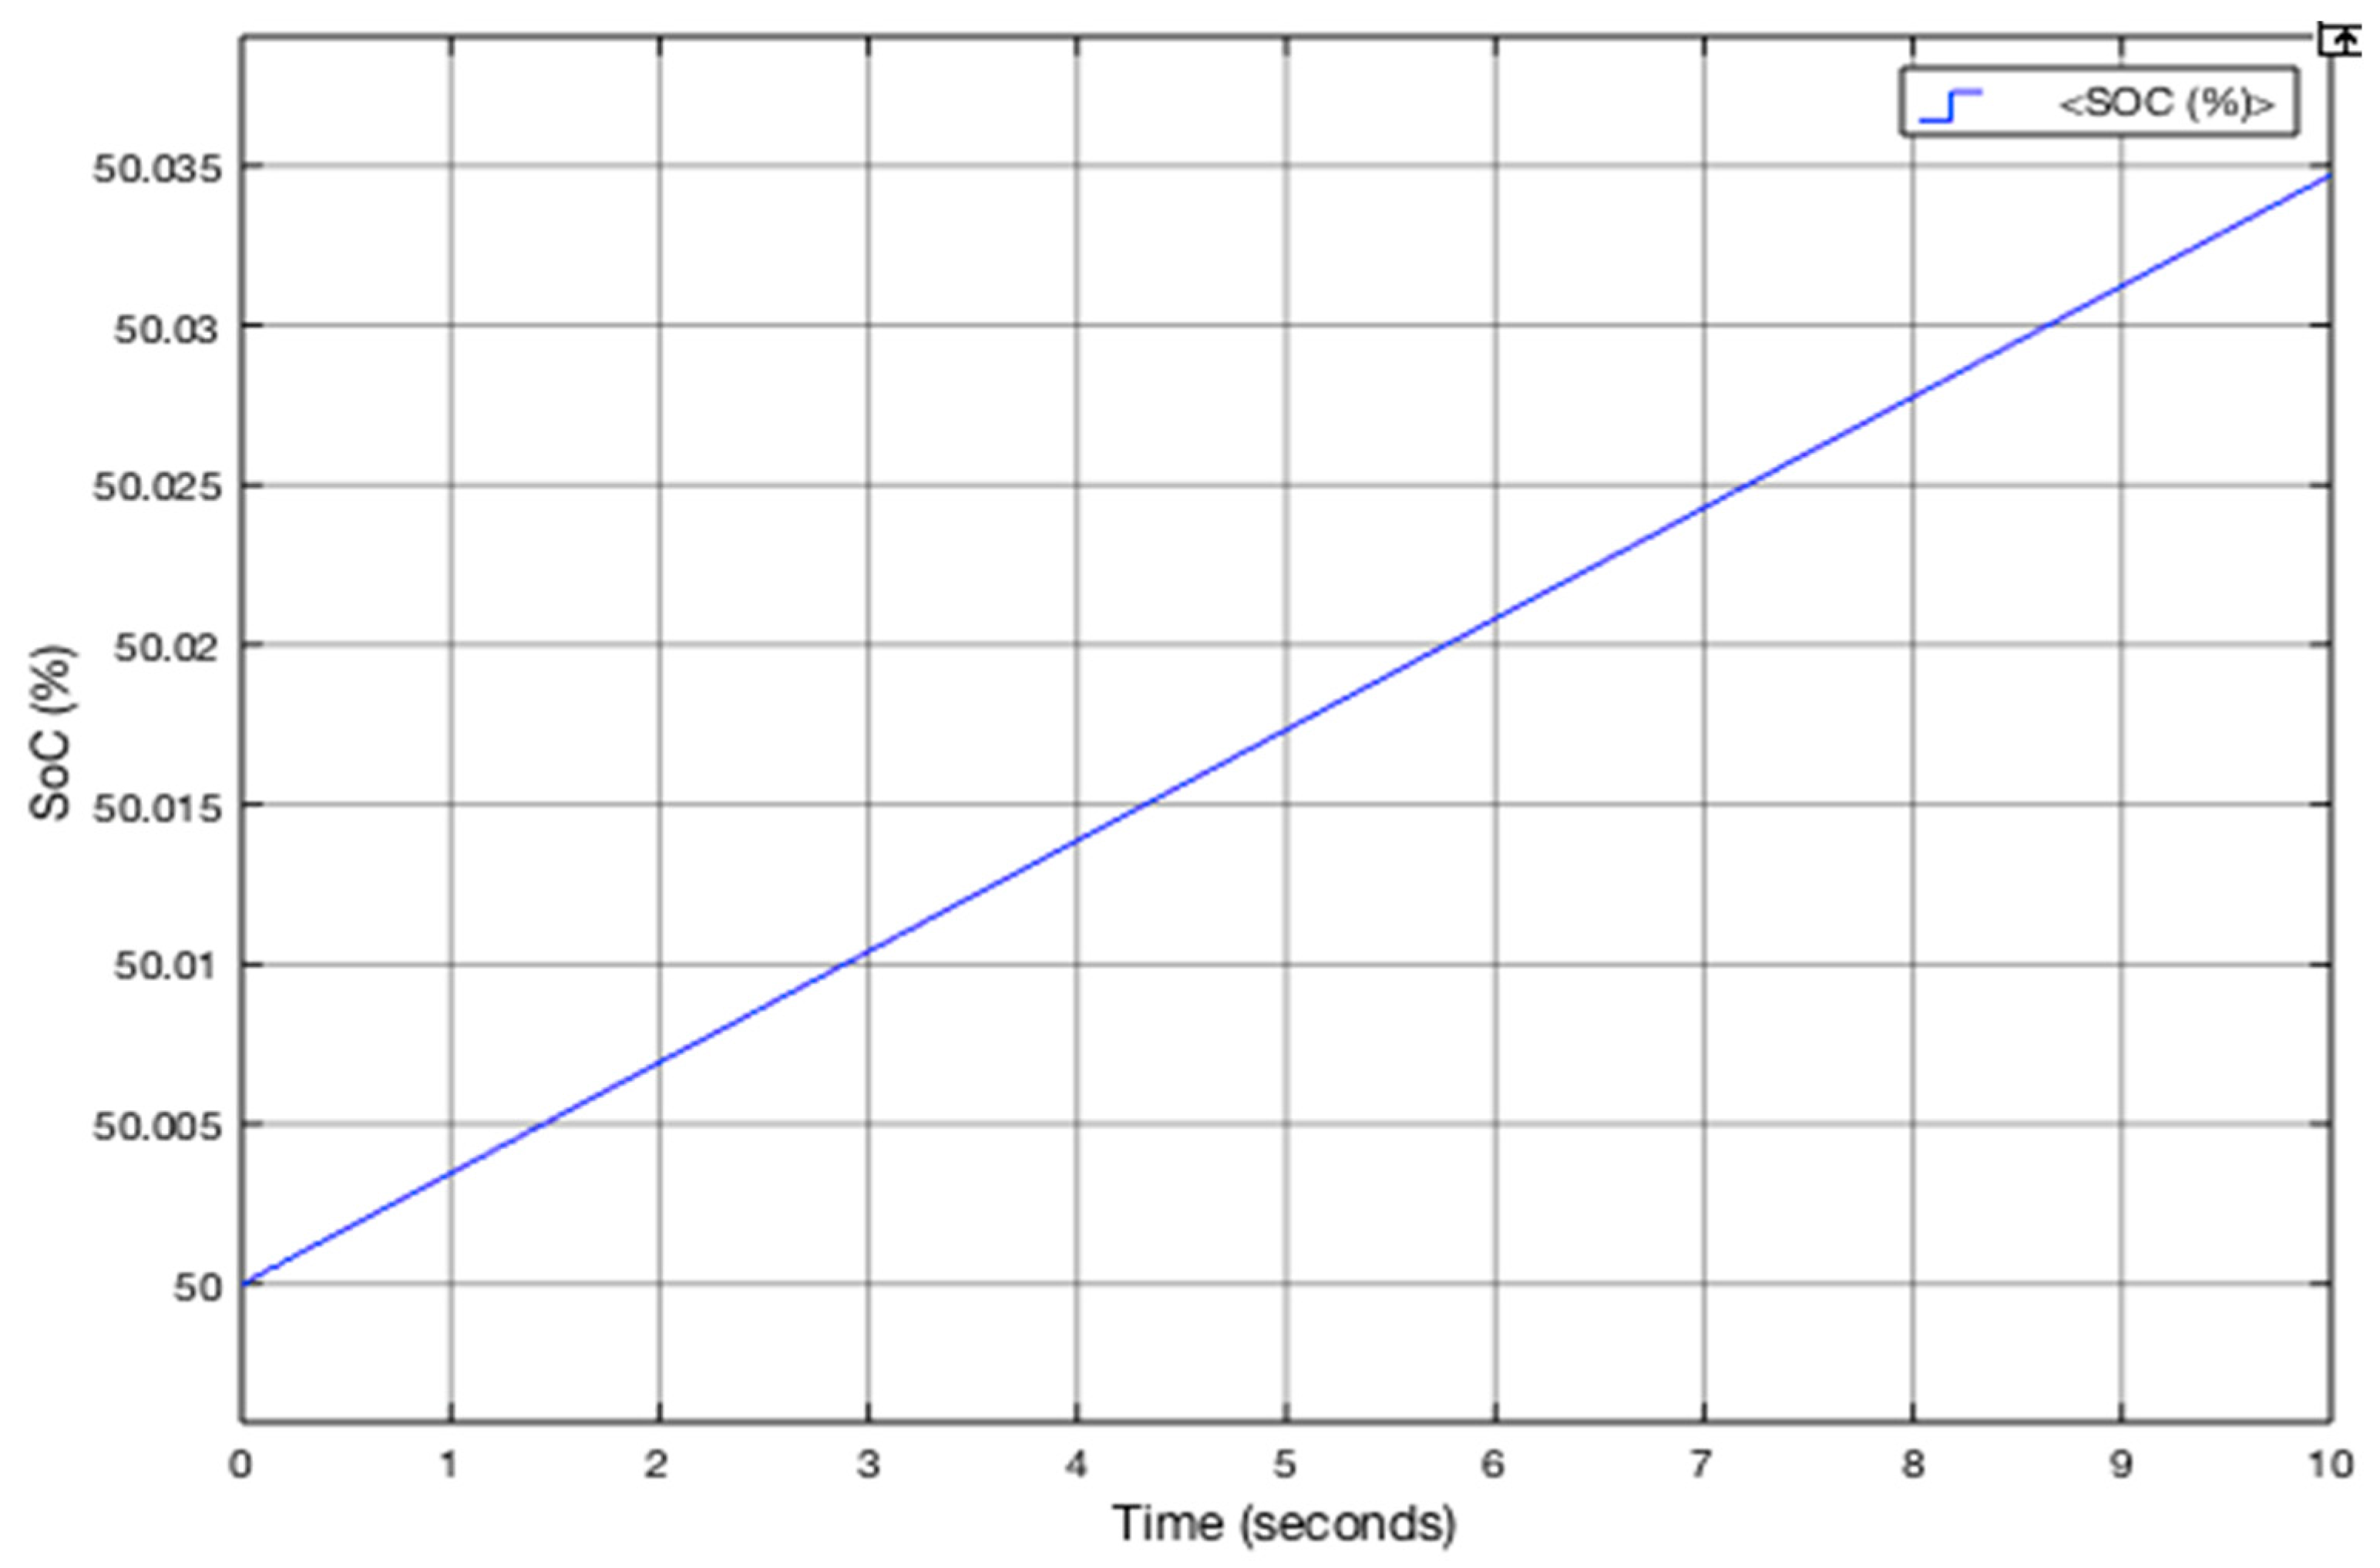
Figure 12.
EMS control output results for the second scenario.
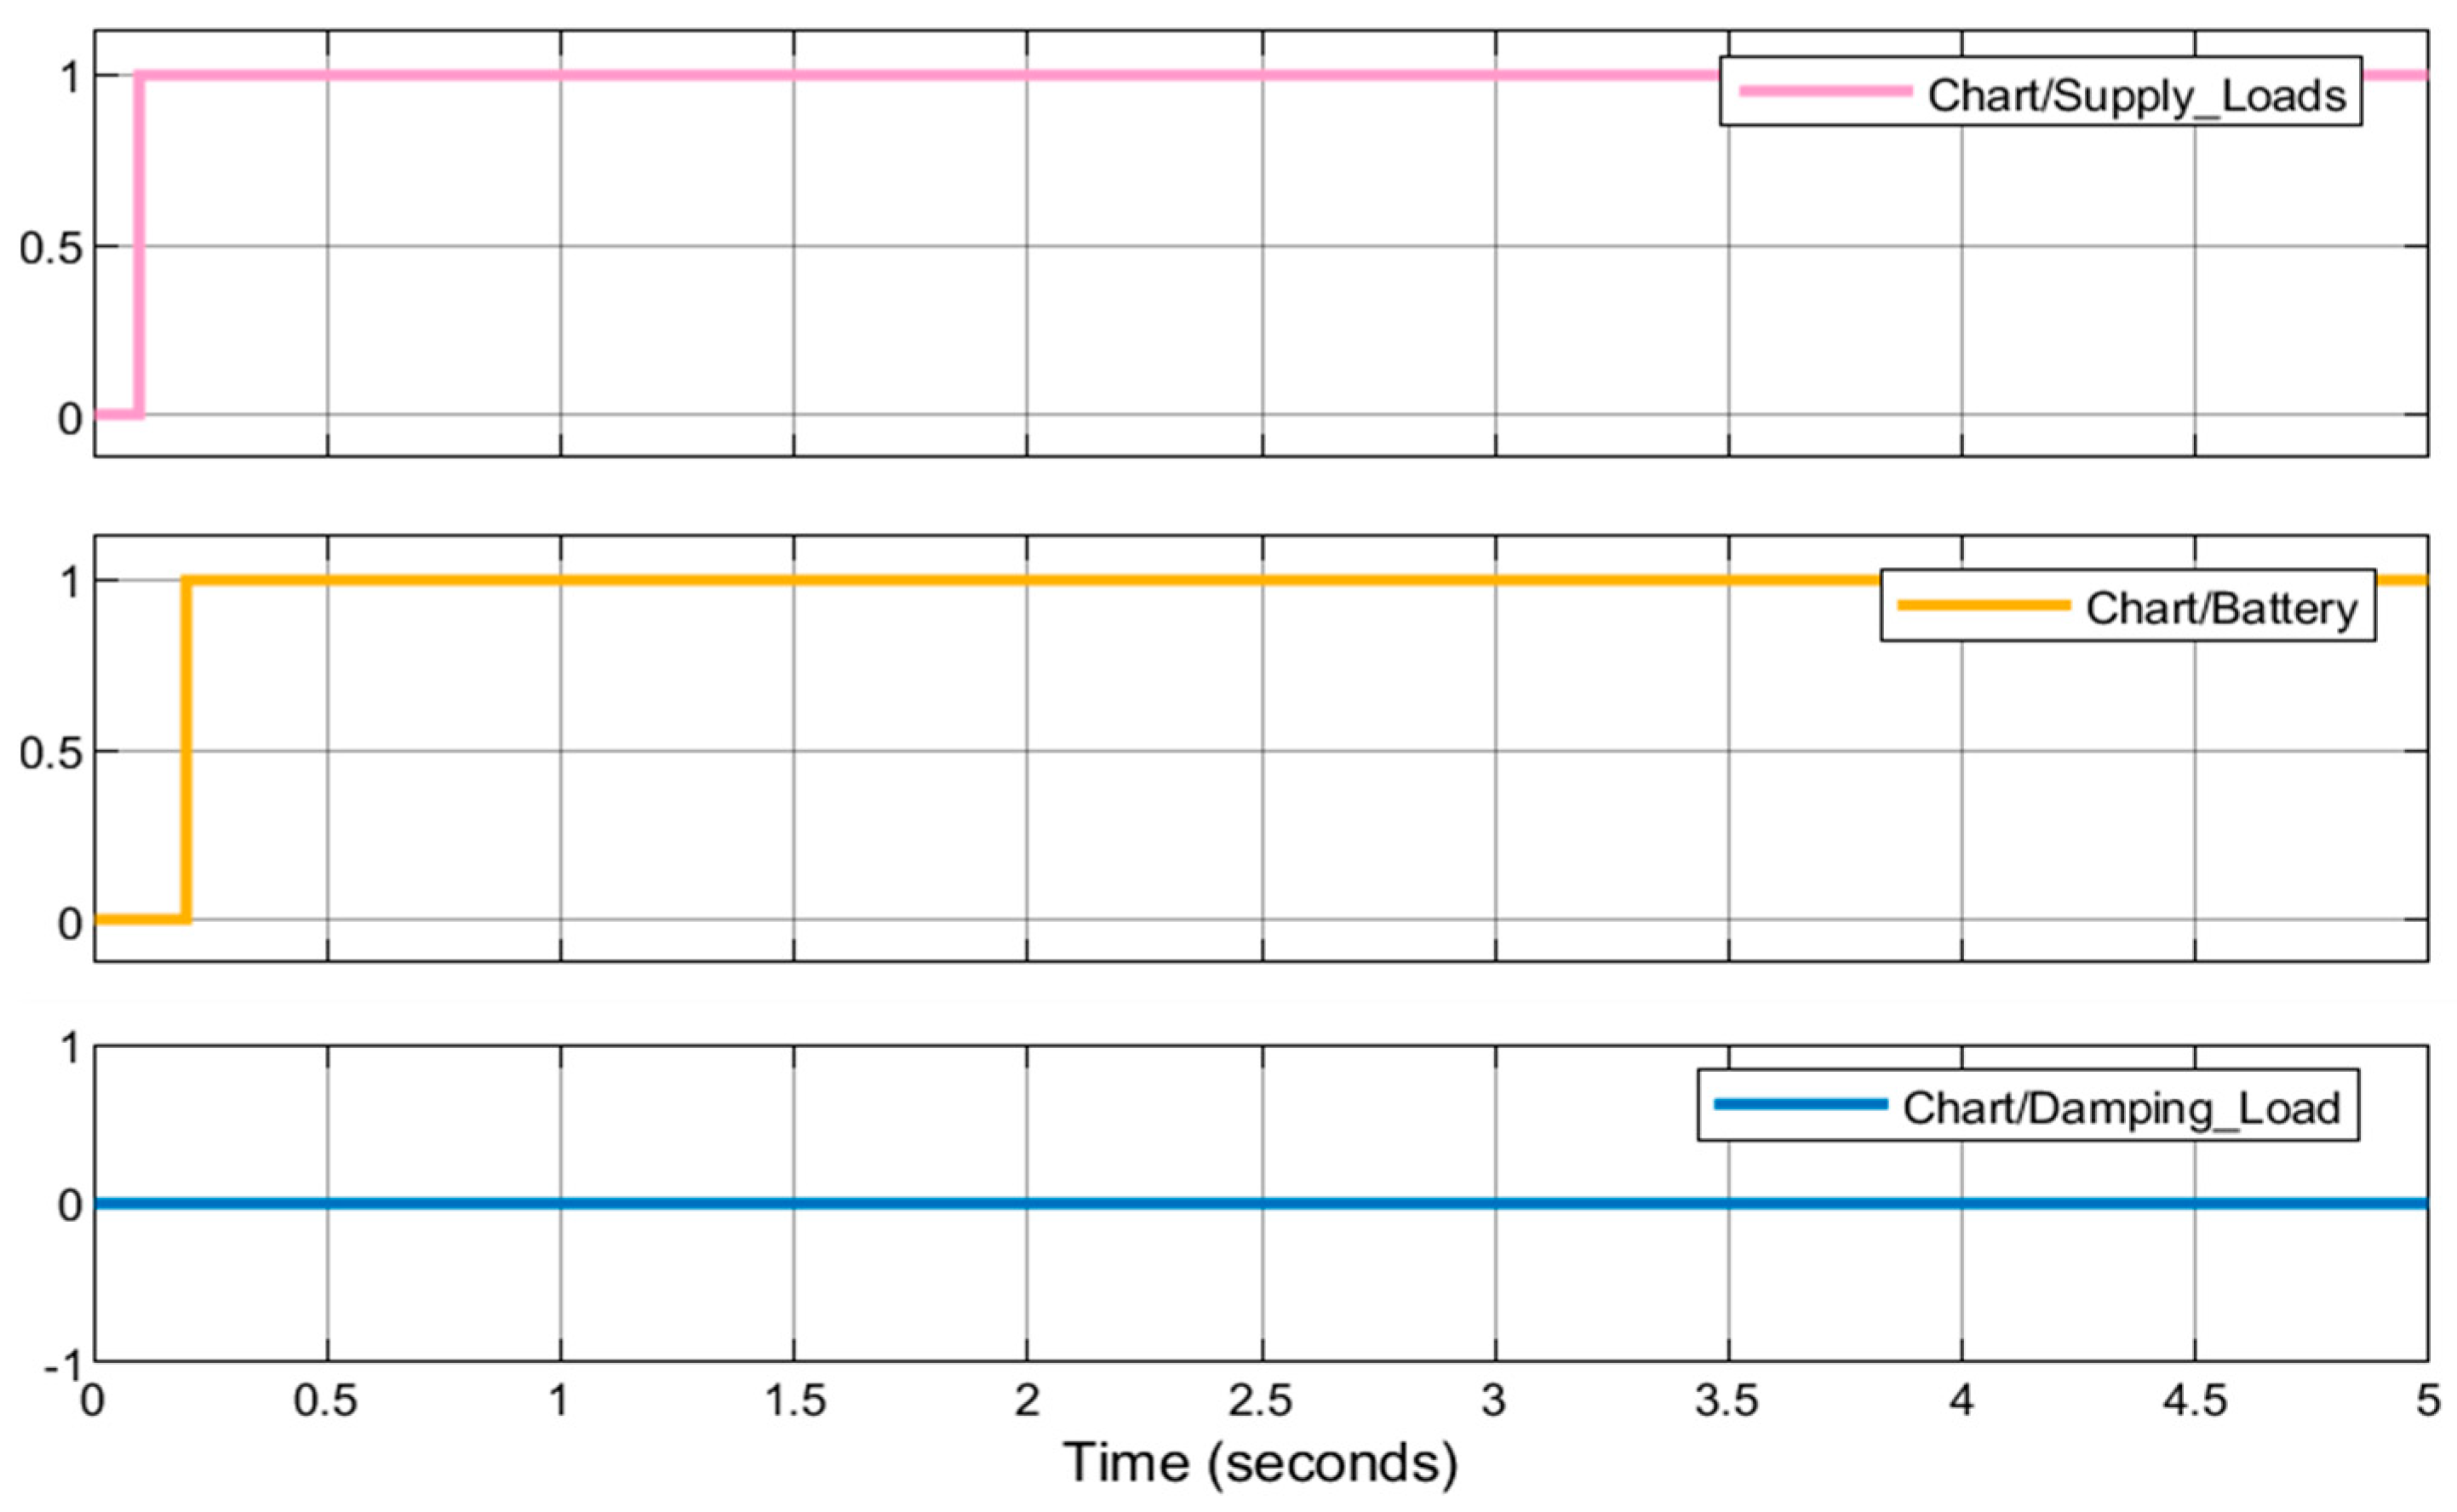
Figure 13.
Transition state from Stateflow chart for the second scenario.
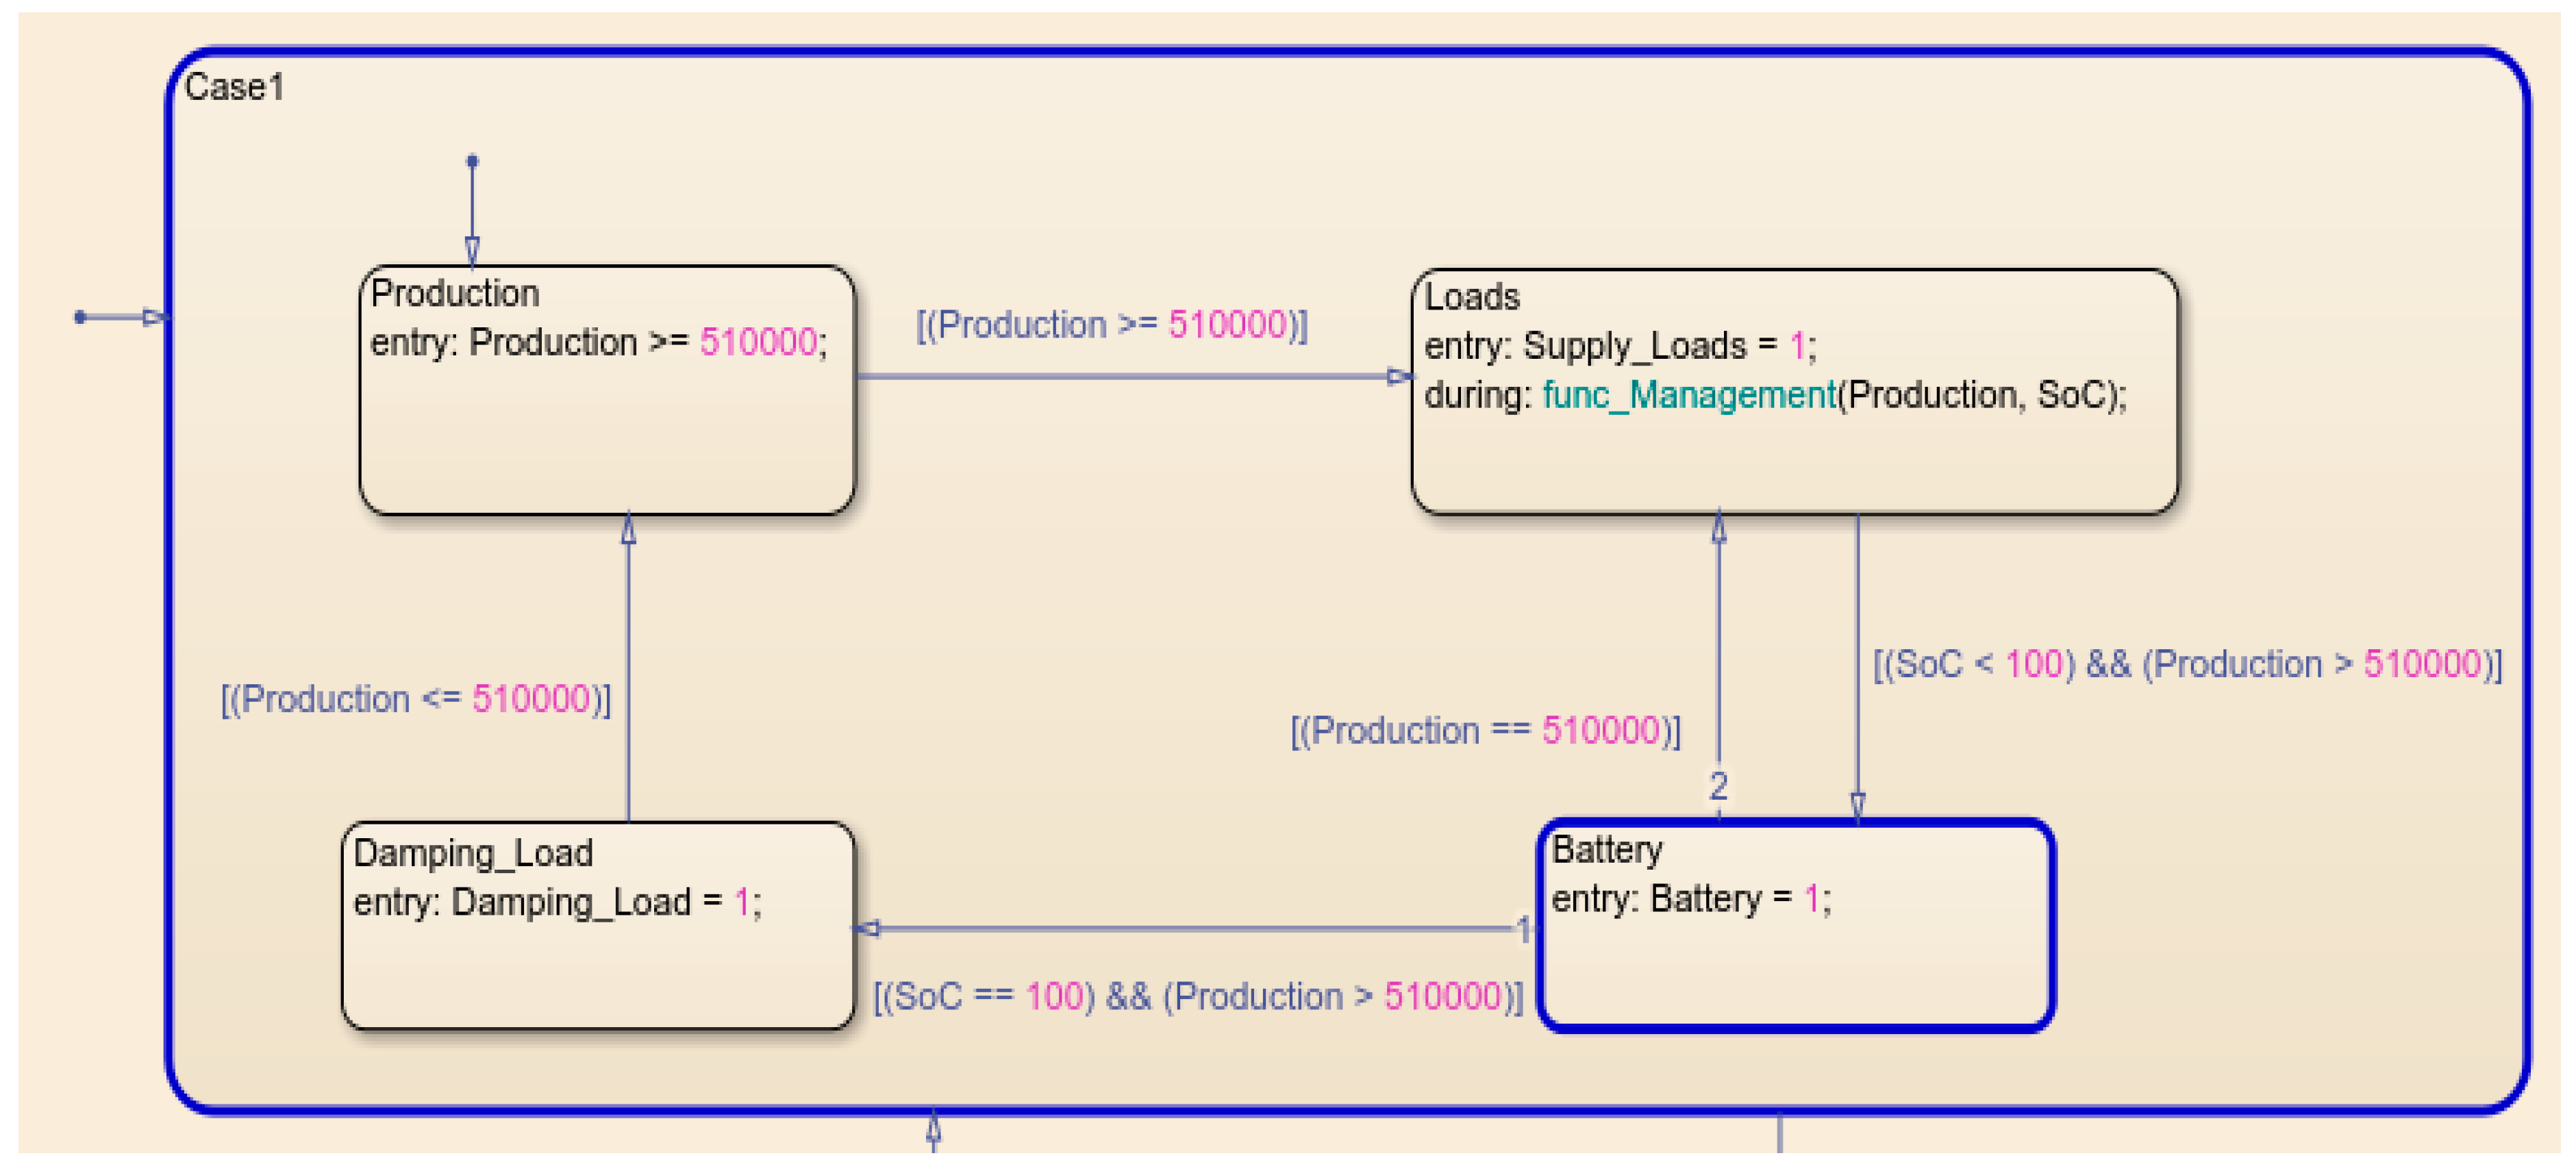
Figure 14.
EMS control output results for the second scenario: battery fully charged.
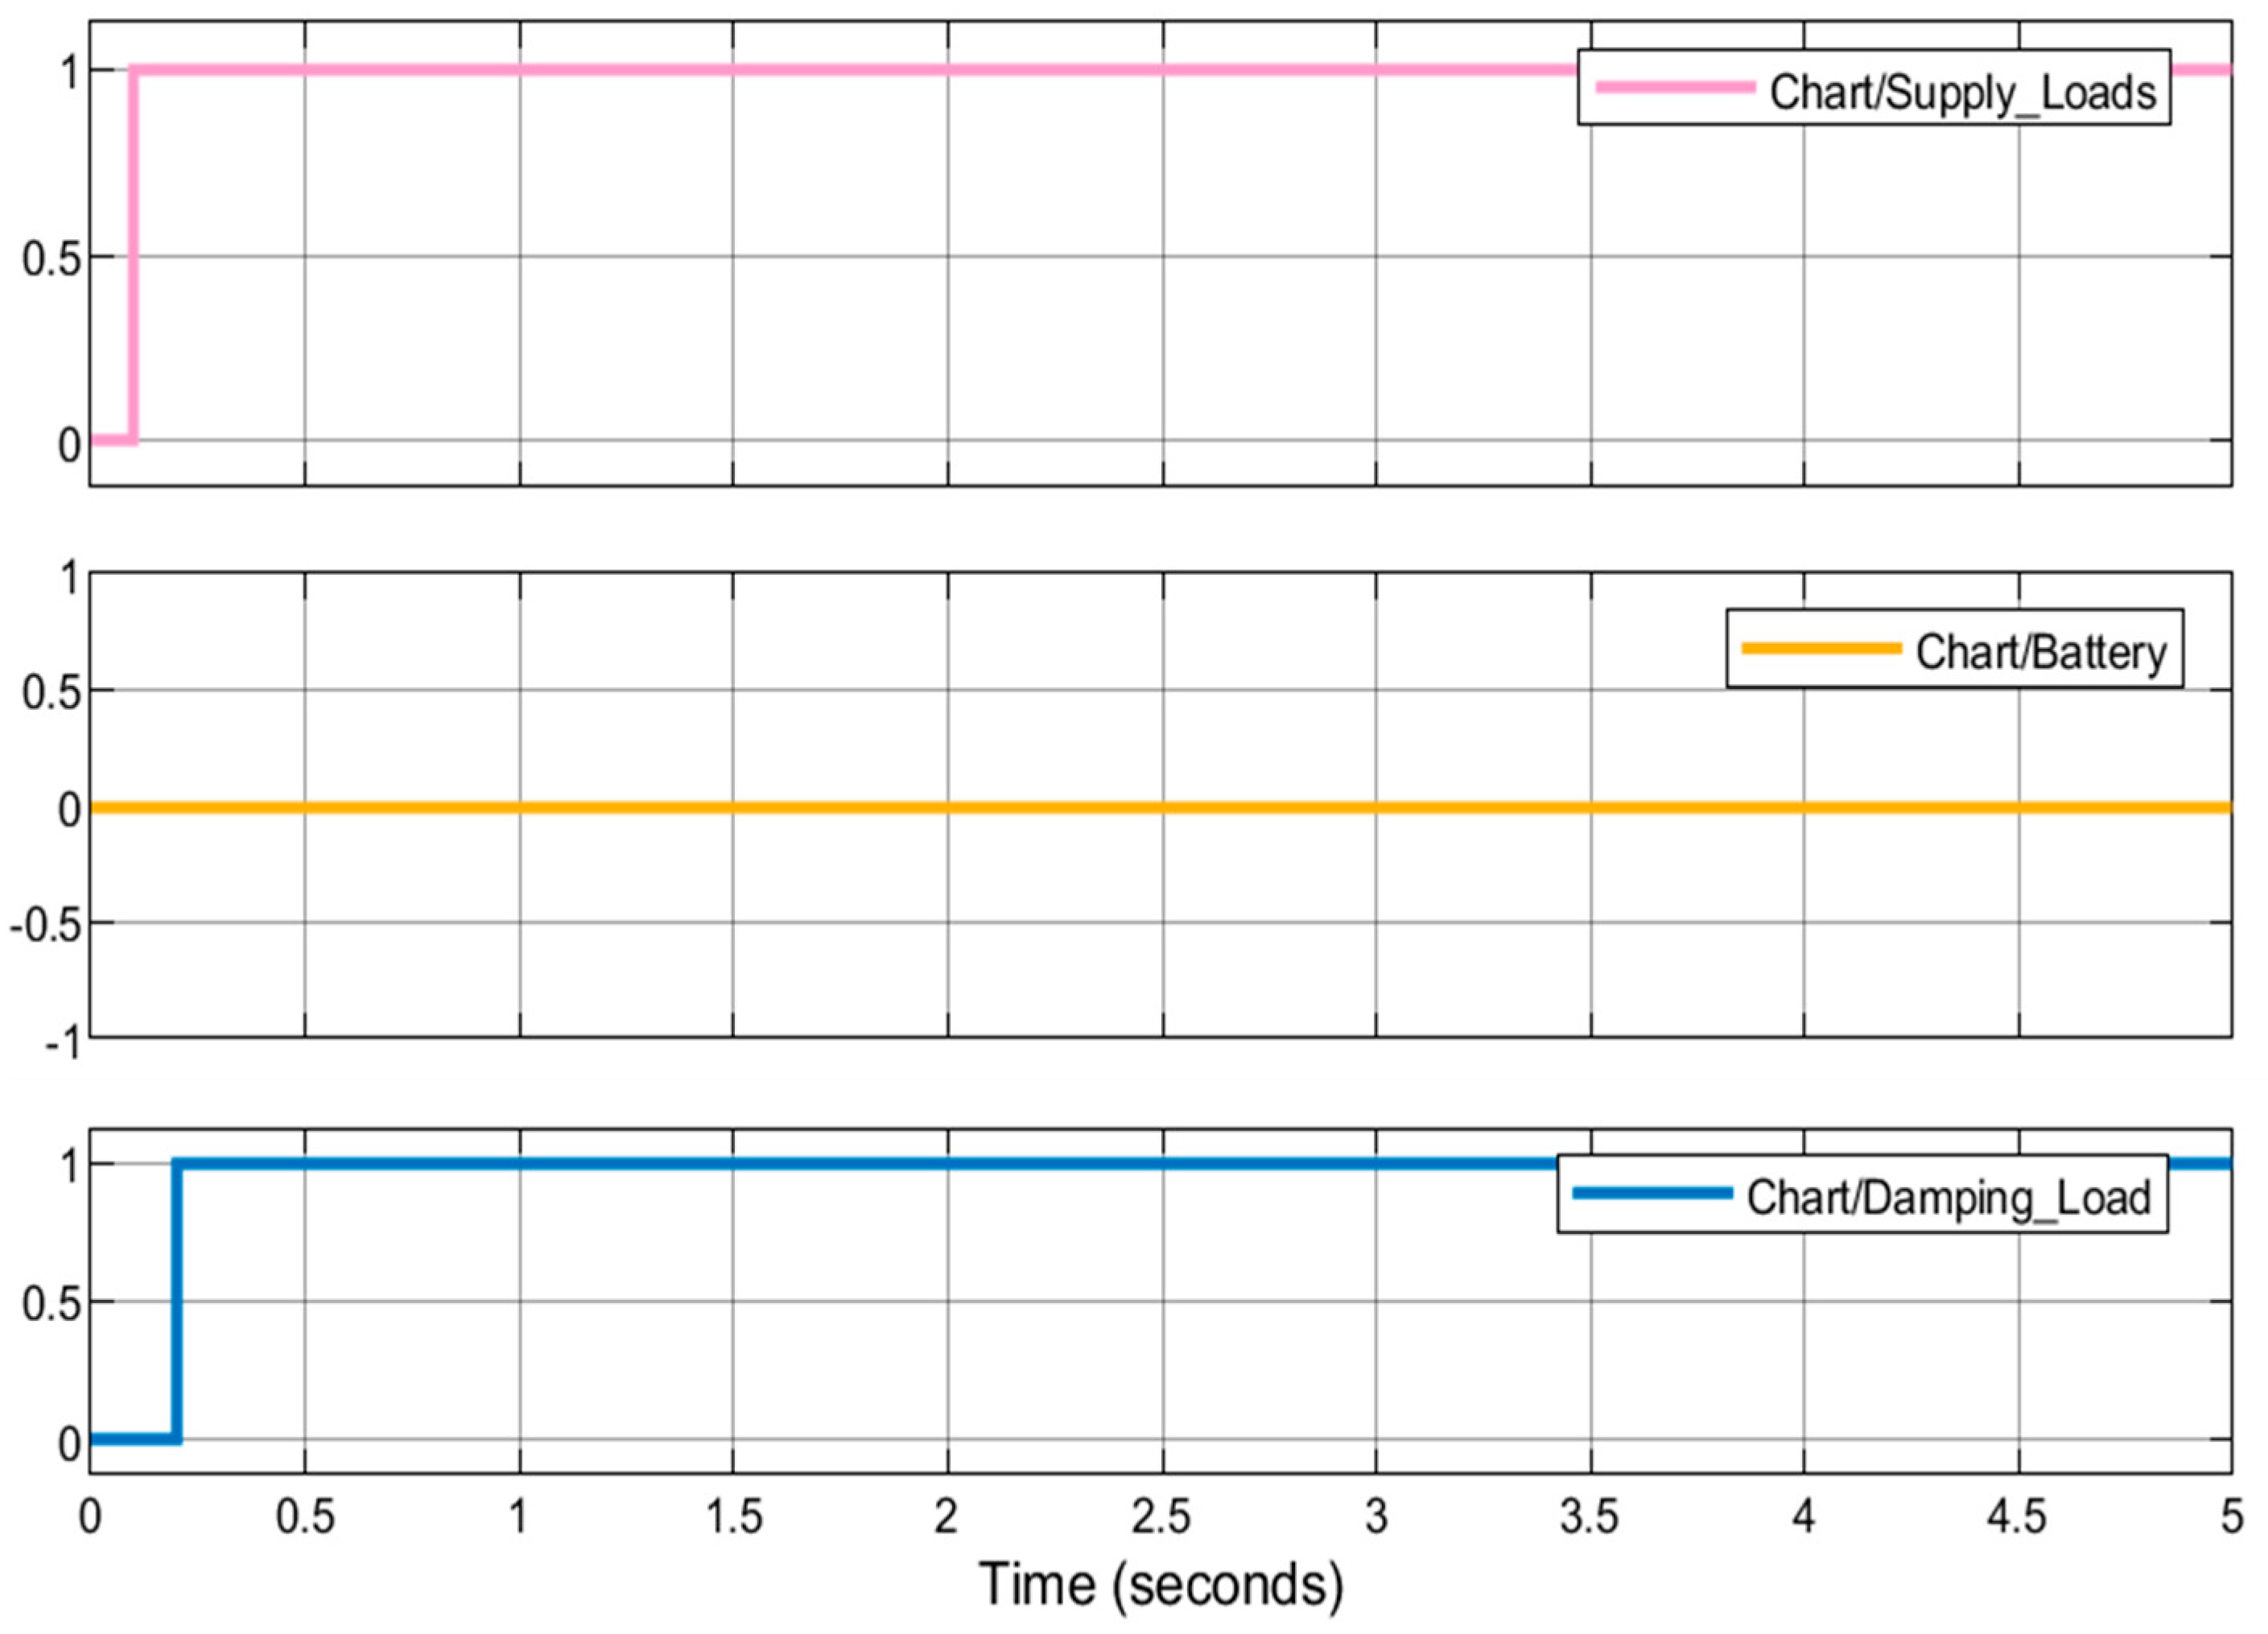
Figure 15.
Power generation.

Figure 16.
Discharging mode of the battery.

Figure 17.
Transition state from Stateflow chart for the third scenario.

Figure 18.
EMS control output results.
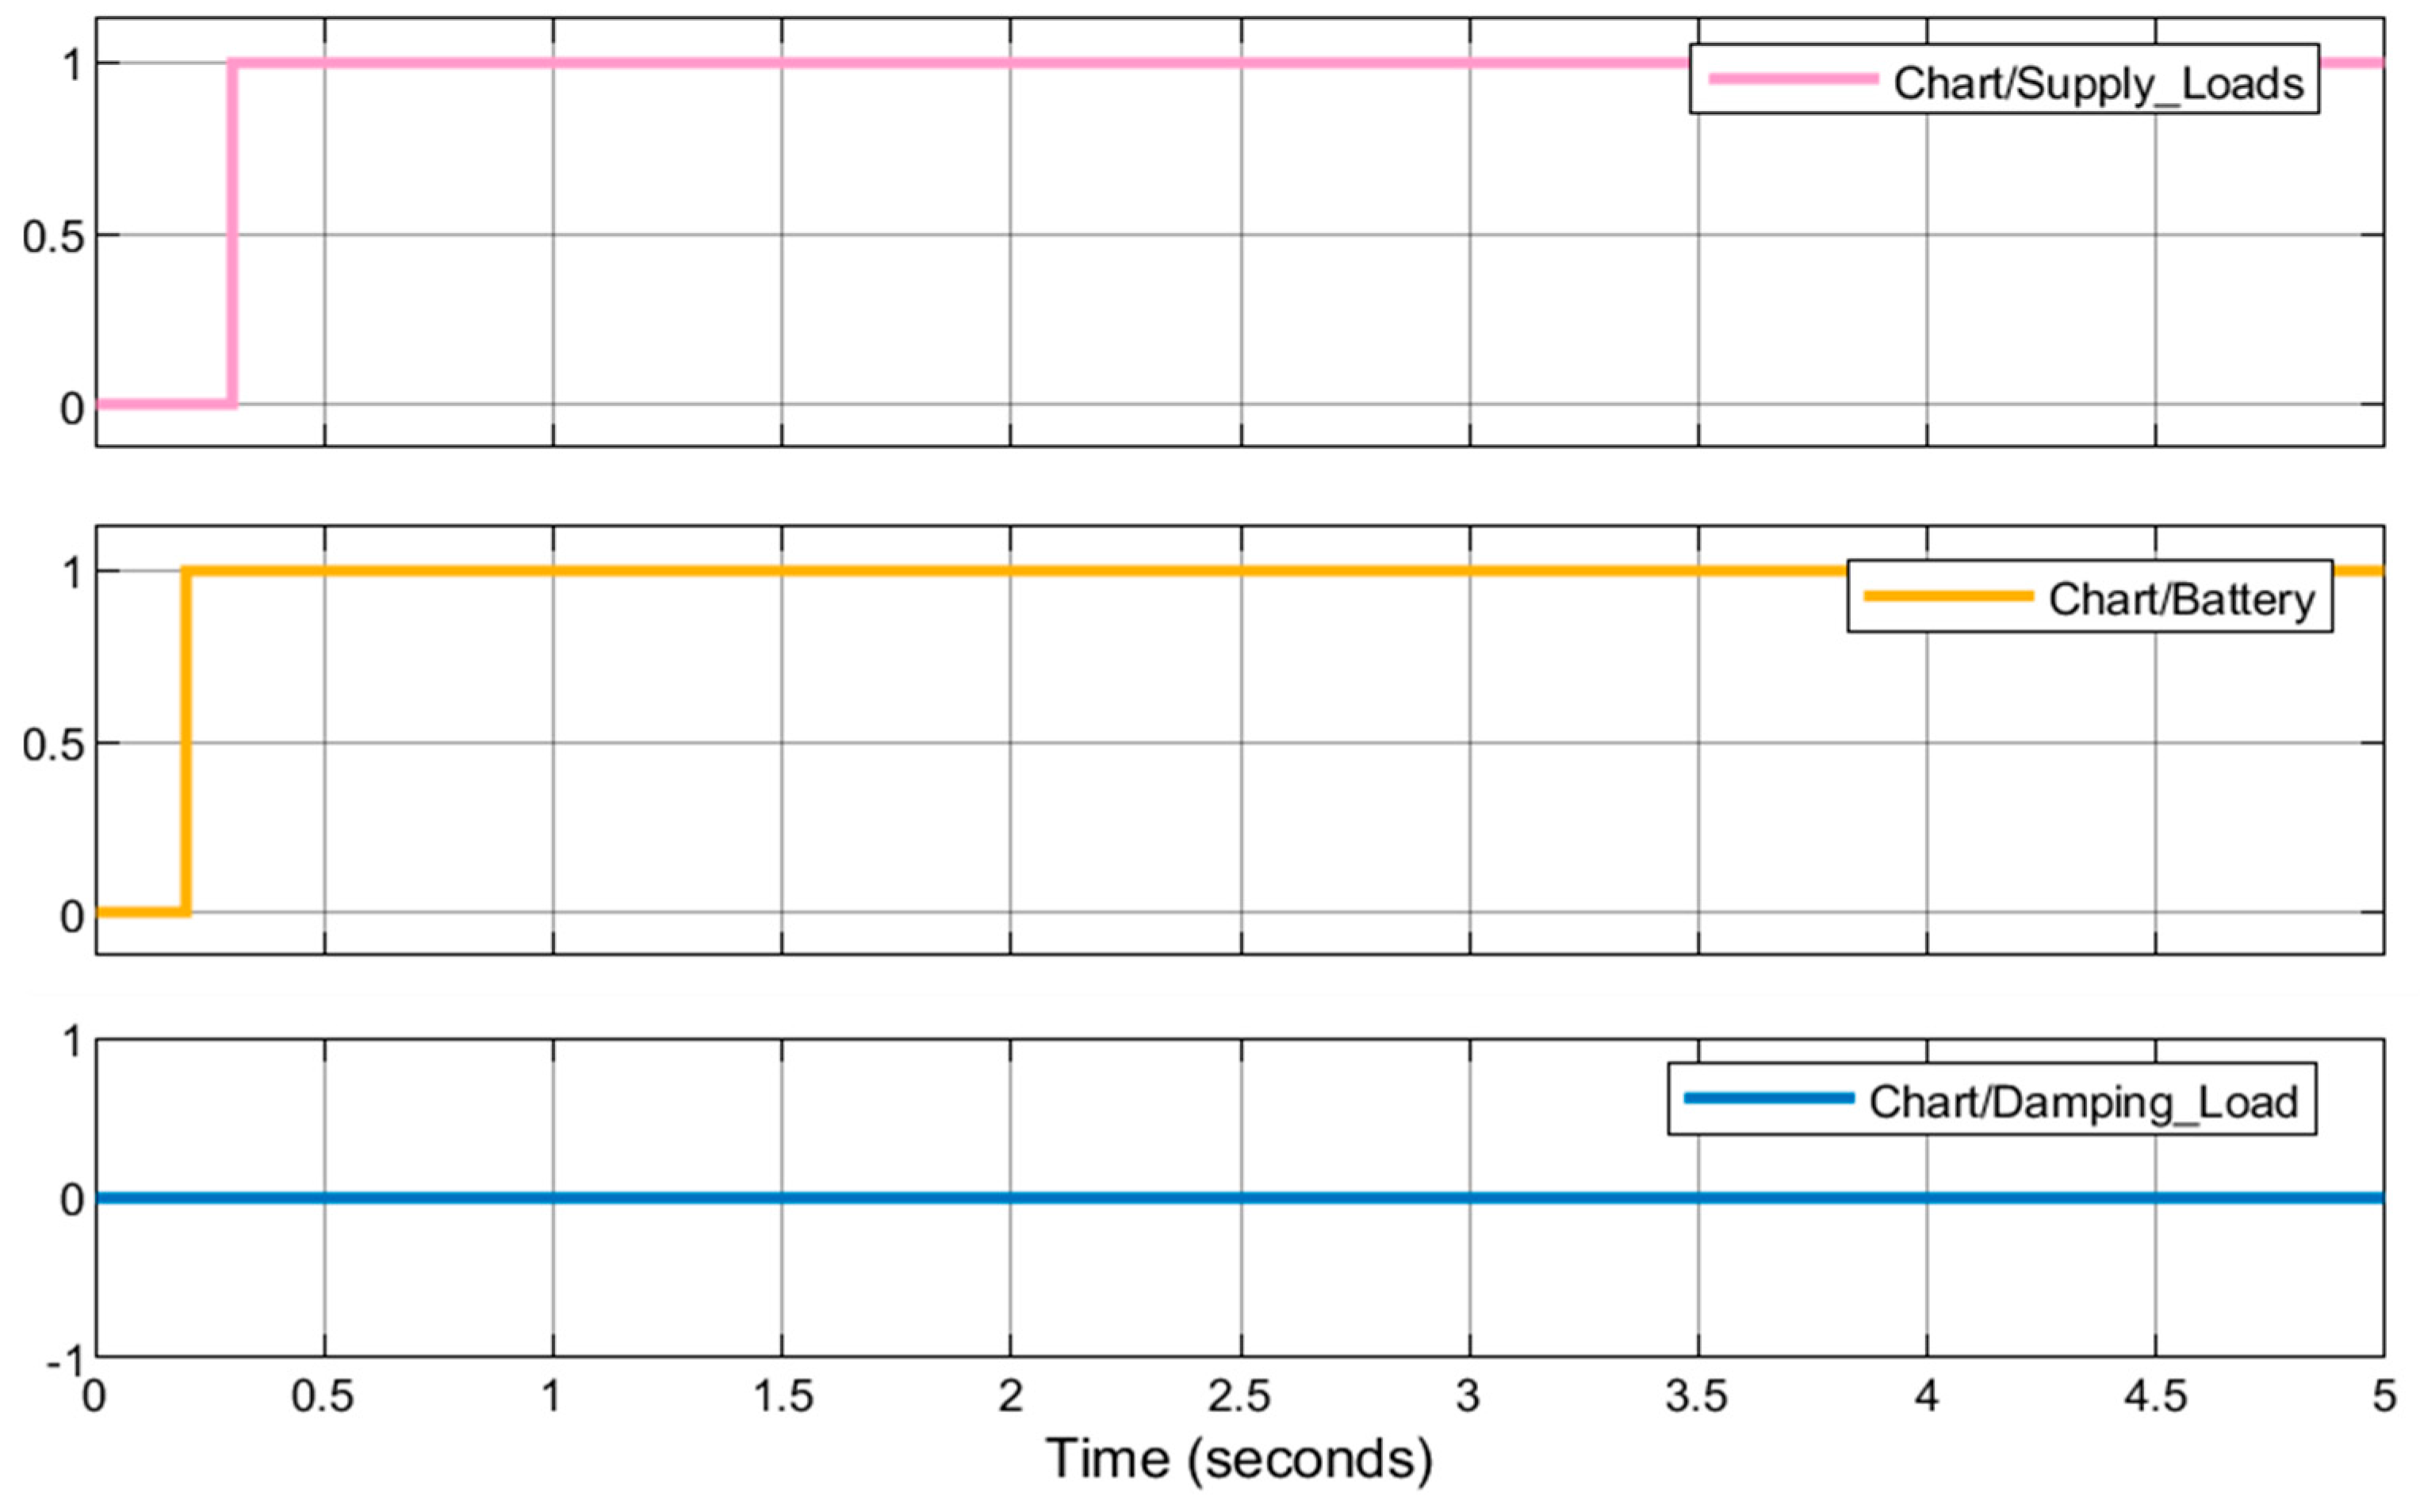
Figure 19.
Transition state from Stateflow chart.
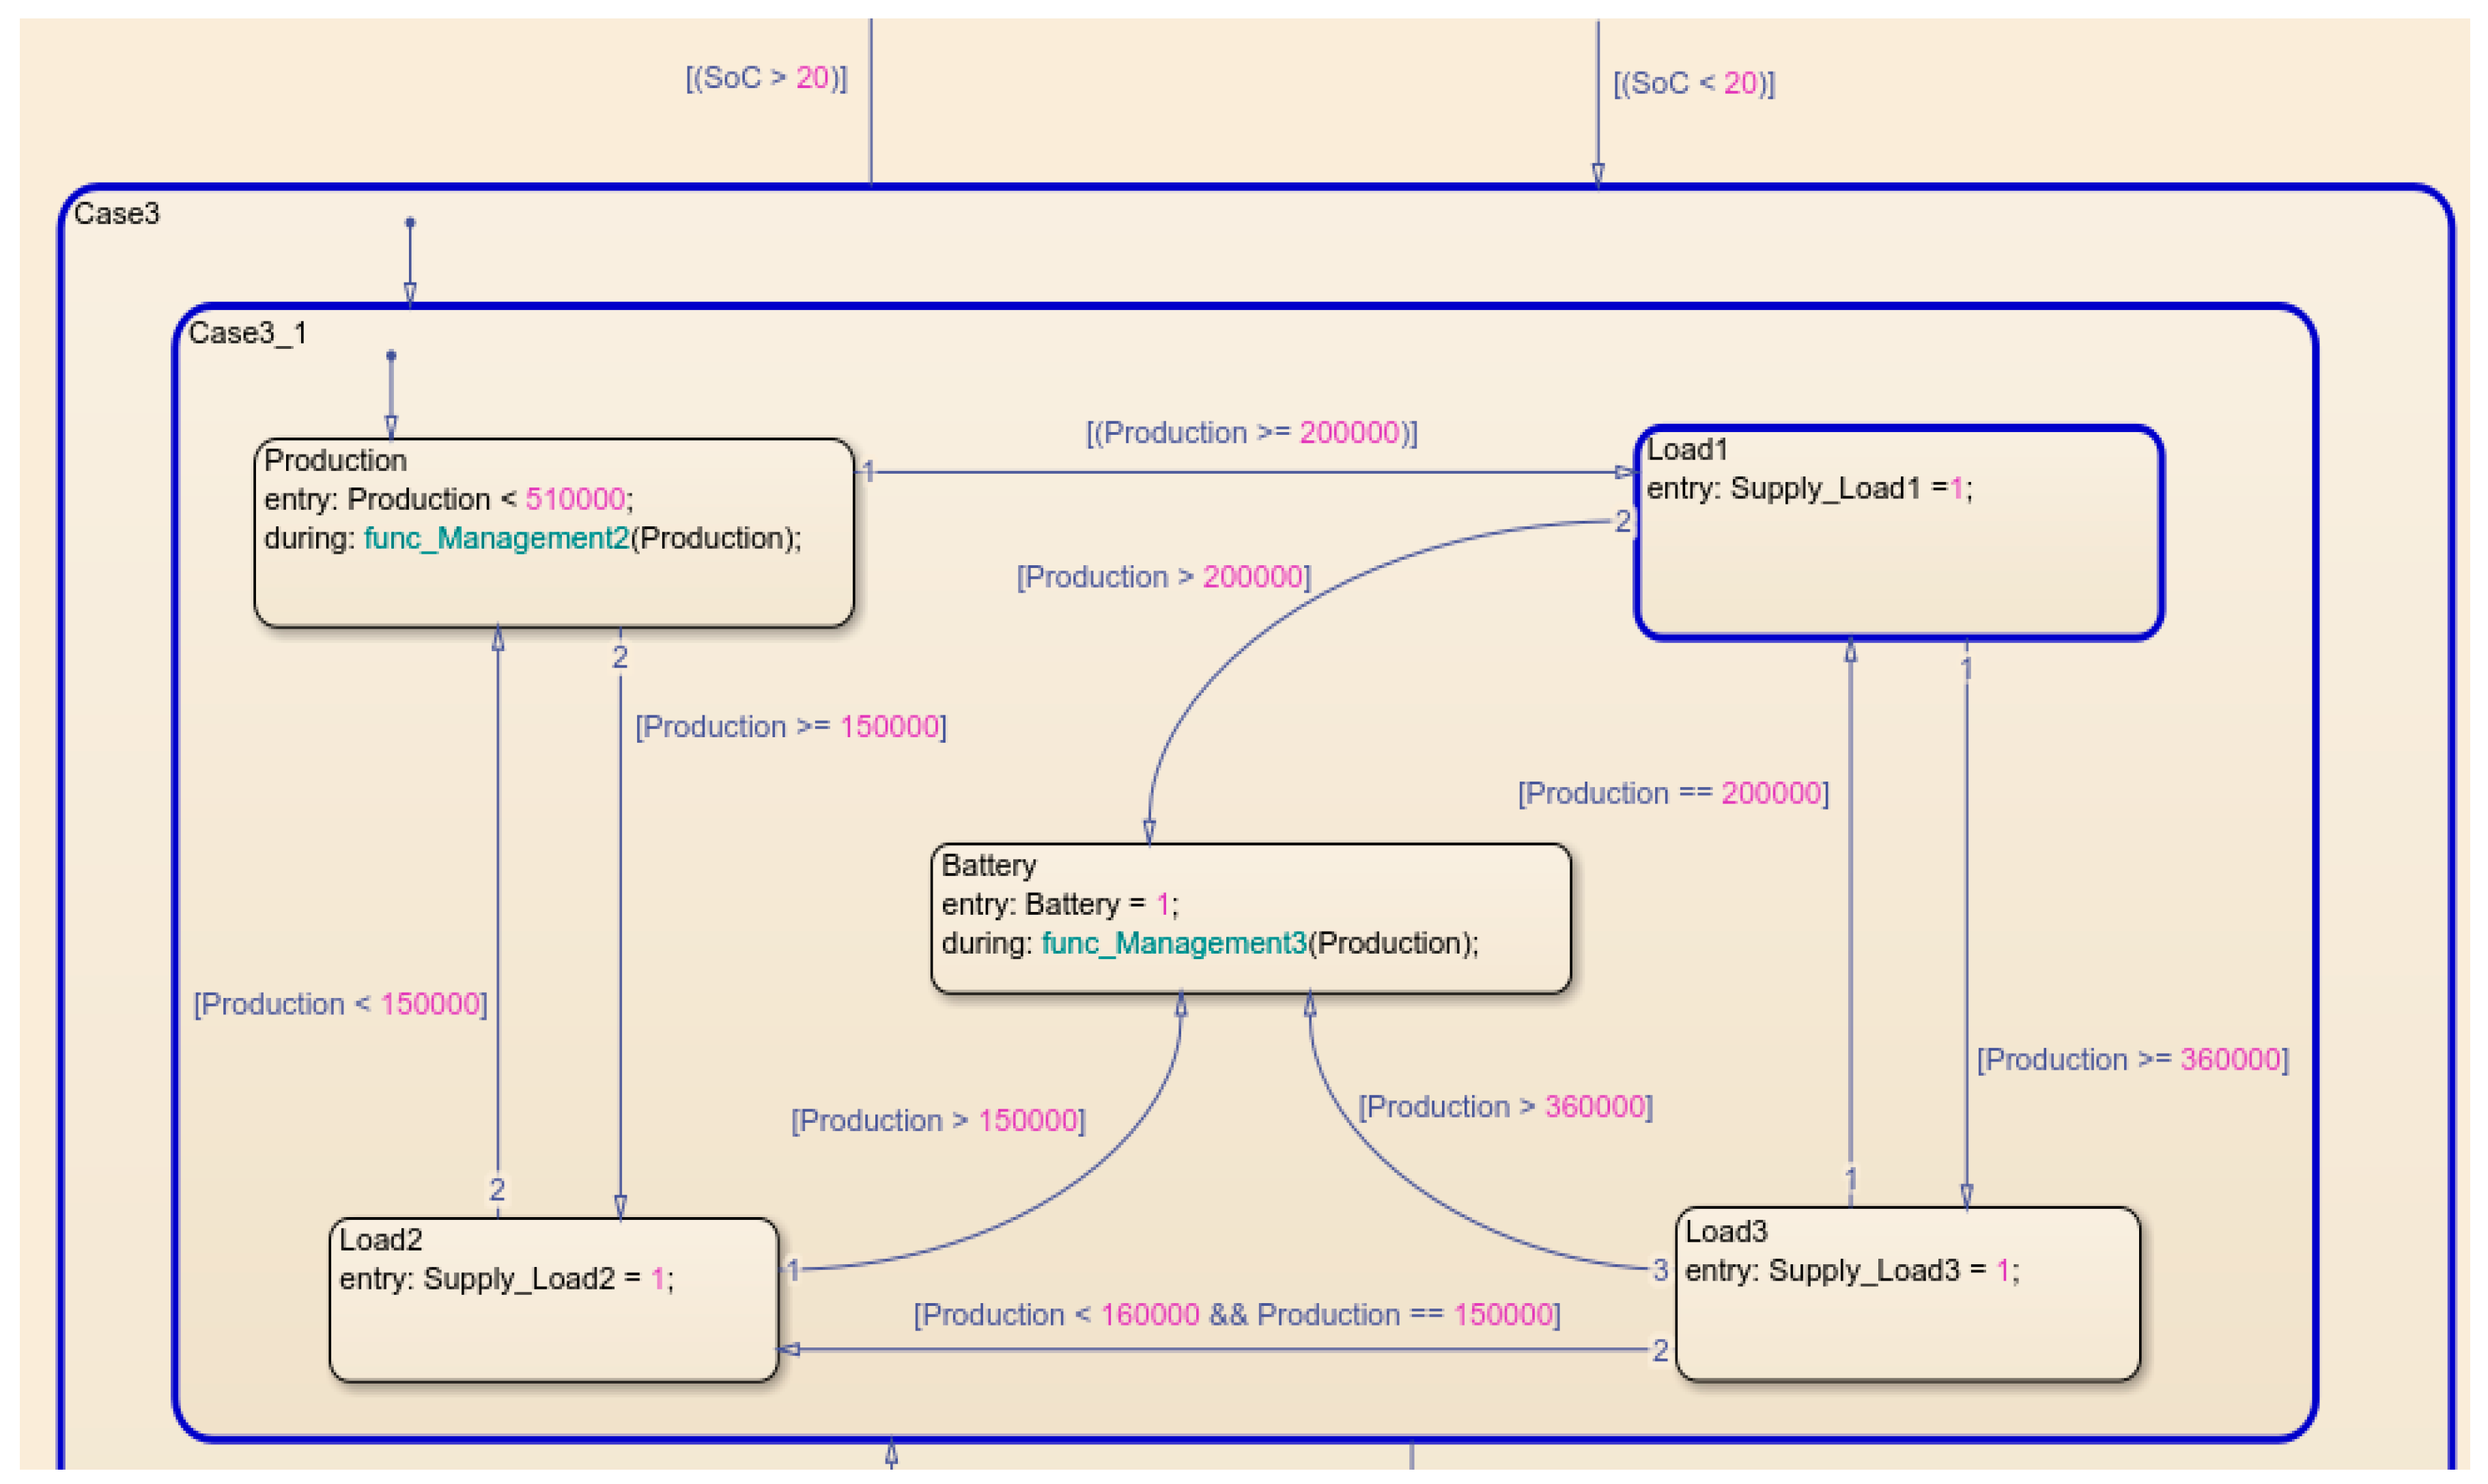
Figure 20.
EMS control output results when priority is supplied.
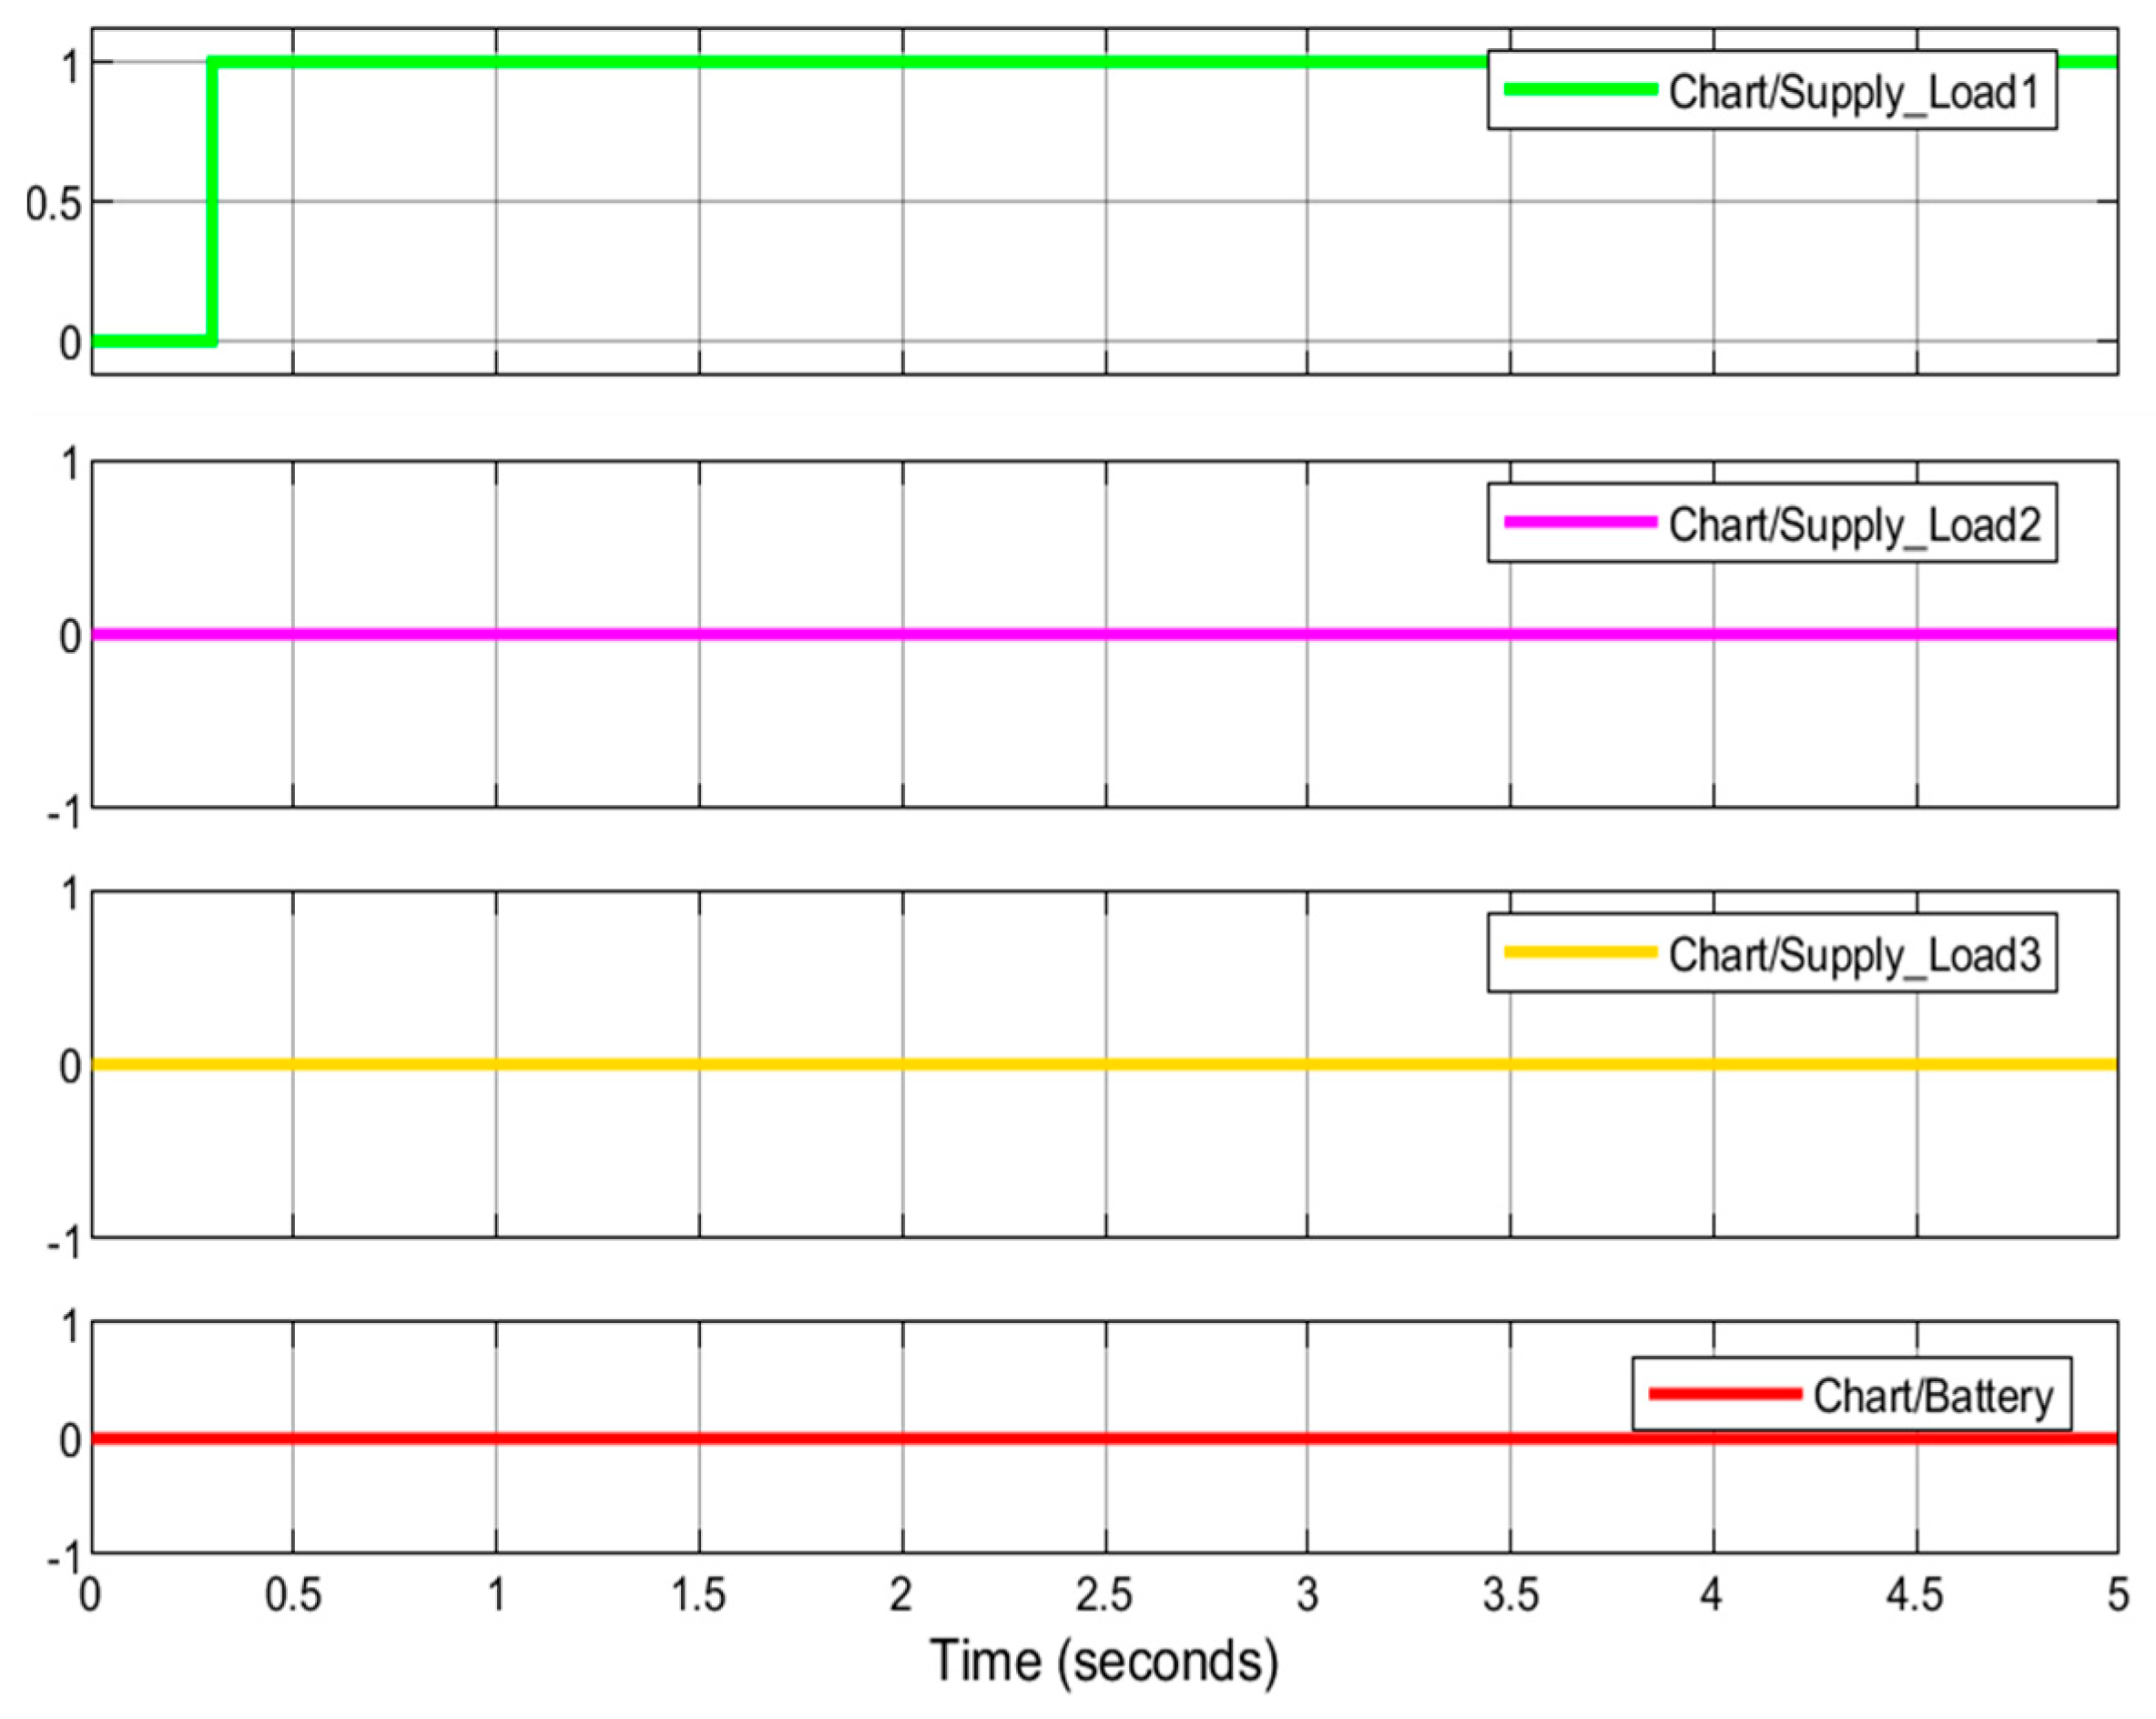
Figure 21.
EMS control output results.


Table 1.
Simulation parameters.
| Unit | Specification |
|---|---|
| Photovoltaic | 150 kW, 380 V |
| Wind power | 150 kW, 380 V |
| Battery | 900 Ah, 380 V |
| DC bus voltage | 380 V |
| DC-DC converter | 380 V |
| Load demands | 280 kW |
Table 2.
Action table for the energy management system.
| Operation | Descriptions | Actions |
|---|---|---|
| 1 | Loads connected | A1: Loads = ON; |
| 2 | Load connected and battery charging | A2: Loads and battery = ON; |
| 3 | Battery charging | A3: Battery = ON; |
| 4 | Auxiliary load connected | A4: Damp load = ON; battery = OFF; loads = ON; |
| 5 | Battery connected | A5: Battery = ON; Damp load = OFF; |
| 6 | Battery discharging | A6: Battery = ON; |
| 7 | Battery disconnected | A7: Battery = OFF; |
| 8 | and connected | A8: and = ON; = OFF; battery = ON; |
| 9 | and battery connected | A9: and = OFF; = ON; battery = ON; |
| 10 | and battery connected | A10: and = OFF; = ON; battery = ON; |
| 11 | Loads disconnected and battery connected | A11: Load = OFF; battery = ON; |
Disclaimer/Publisher’s Note: The statements, opinions and data contained in all publications are solely those of the individual author(s) and contributor(s) and not of MDPI and/or the editor(s). MDPI and/or the editor(s) disclaim responsibility for any injury to people or property resulting from any ideas, methods, instructions or products referred to in the content. |
© 2024 by the authors. Licensee MDPI, Basel, Switzerland. This article is an open access article distributed under the terms and conditions of the Creative Commons Attribution (CC BY) license (https://creativecommons.org/licenses/by/4.0/).
Share and Cite
MDPI and ACS Style
Ndeke, C.B.; Adonis, M.; Almaktoof, A. Energy Management Strategy for DC Micro-Grid System with the Important Penetration of Renewable Energy. Appl. Sci. 2024, 14, 2659. https://doi.org/10.3390/app14062659
AMA Style
Ndeke CB, Adonis M, Almaktoof A. Energy Management Strategy for DC Micro-Grid System with the Important Penetration of Renewable Energy. Applied Sciences. 2024; 14(6):2659. https://doi.org/10.3390/app14062659
Chicago/Turabian StyleNdeke, Christian Bipongo, Marco Adonis, and Ali Almaktoof. 2024. "Energy Management Strategy for DC Micro-Grid System with the Important Penetration of Renewable Energy" Applied Sciences 14, no. 6: 2659. https://doi.org/10.3390/app14062659
Note that from the first issue of 2016, this journal uses article numbers instead of page numbers. See further details here.