
Assessing Jump Performance: Intra- and Interday Reliability and Minimum Difference of Countermovement Jump and Drop Jump Outcomes, Kinetics, Kinematics, and Jump Strategy


Abstract
:1. Introduction
2. Materials and Methods
2.1. Participants
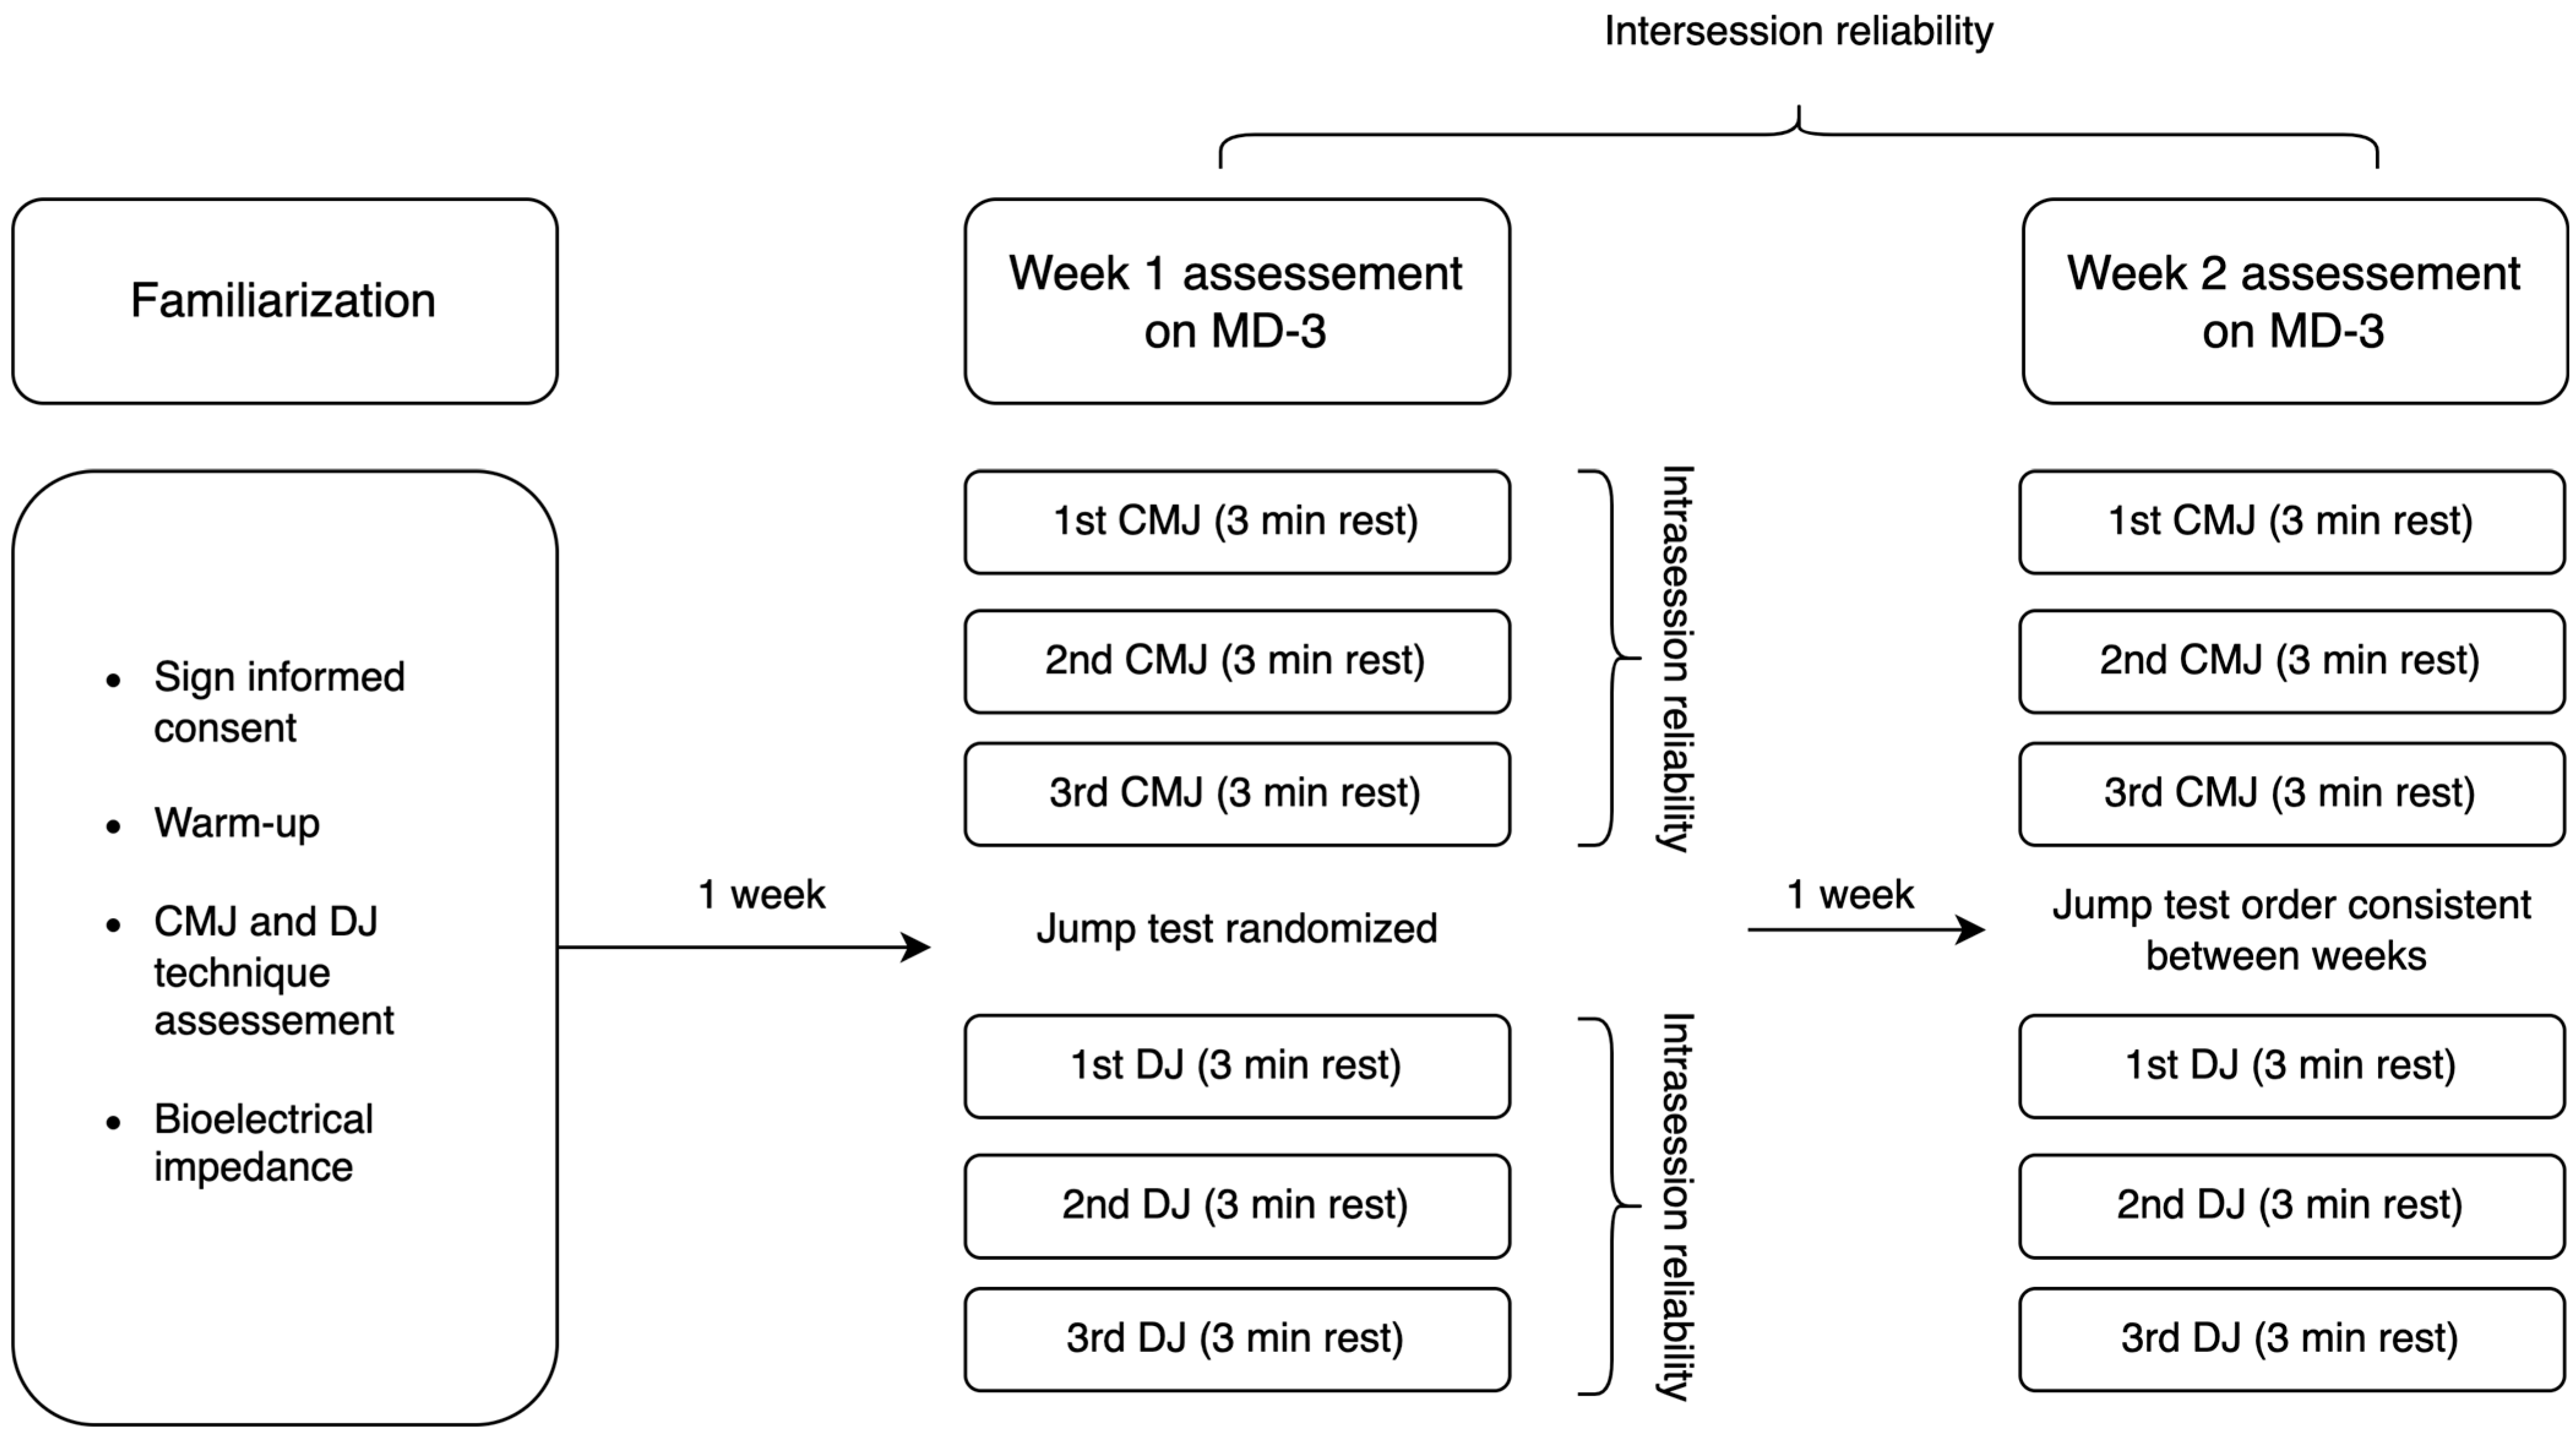
2.2. Procedures
2.3. Statistical Analysis
3. Results
3.1. CMJ
3.2. DJ

| Trial1 | Trial2 | Trial3 | p Value | ICC (95%CI) | SEM | CV (95%CI) | |||||||||||||
|---|---|---|---|---|---|---|---|---|---|---|---|---|---|---|---|---|---|---|---|
| Mean | SD | x͂ | Mean | SD | x͂ | Mean | SD | x͂ | ICC | LL | UL | SEM | MD 95%CI | MD 90%CI | CV(%) | LL | UL | ||
| Jump outcomes | |||||||||||||||||||
| Jump Height (Imp-Mom) [cm] | 27.7 | 4.8 | 27.5 | 28.3 | 5.1 | 27.6 | 29.0 | 4.8 | 28.1 | 0.012 | 0.97 | 0.93 | 0.99 | 1.2 | 3.5 | 2.9 | 4.1 | 1.2 | 7.0 |
| Jump Height (Flight Time) [cm] | 29.3 | 5.6 | 28.7 | 30.1 | 5.8 | 29.5 | 31.1 | 5.3 | 31.1 | 0.003 | 0.96 | 0.92 | 0.98 | 1.6 | 4.4 | 3.7 | 4.7 | 1.3 | 8.1 |
| RSI-modified [m/s] | 0.42 | 0.08 | 0.40 | 0.44 | 0.08 | 0.44 | 0.44 | 0.07 | 0.43 | 0.028 | 0.91 | 0.79 | 0.96 | 0.03 | 0.08 | 0.07 | 5.9 | 1.7 | 10.0 |
| Kinetics | |||||||||||||||||||
| Concentric Mean Force [N] | 1205 | 156.3 | 1193 | 1218 | 181.7 | 1228 | 1211 | 154.0 | 1218 | 0.418 | 0.99 | 0.96 | 1.00 | 27.3 | 75.6 | 63.4 | 1.9 | 0.5 | 3.2 |
| Concentric Mean Force/BM [N/kg] | 18.7 | 1.0 | 18.5 | 18.9 | 1.3 | 18.8 | 18.8 | 1.3 | 18.5 | 0.476 | 0.91 | 0.76 | 0.97 | 0.4 | 1.1 | 1.0 | 1.9 | 0.6 | 3.3 |
| Concentric Peak Force [N] | 1548 | 204.7 | 1503 | 1565 | 243.7 | 1535 | 1568 | 213.0 | 1525 | 0.495 | 0.97 | 0.91 | 0.99 | 49.9 | 138.2 | 116.0 | 2.7 | 0.8 | 4.6 |
| Concentric Peak Force/BM [N/kg] | 24.1 | 2.1 | 24.3 | 24.3 | 2.2 | 24.1 | 24.3 | 1.9 | 24.6 | 0.259 | 0.90 | 0.74 | 0.98 | 0.7 | 2.1 | 1.7 | 2.7 | 0.8 | 4.7 |
| Concentric Impulse [Ns] | 149.5 | 17.5 | 149.3 | 151.0 | 19.2 | 145.5 | 152.9 | 18.2 | 149.4 | 0.011 | 0.98 | 0.96 | 0.99 | 3.4 | 9.3 | 7.8 | 2.0 | 0.6 | 3.4 |
| Concentric Impulse-50 ms [Ns] | 42.3 | 7.3 | 42.2 | 43.8 | 8.5 | 42.9 | 44.0 | 6.6 | 43.7 | 0.169 | 0.92 | 0.78 | 0.97 | 2.7 | 7.5 | 6.3 | 5.3 | 1.5 | 9.2 |
| Concentric Impulse-100 ms [Ns] | 78.2 | 13.1 | 80.3 | 80.9 | 16.2 | 77.5 | 80.3 | 12.3 | 80.6 | 0.247 | 0.92 | 0.79 | 0.97 | 4.7 | 12.9 | 10.8 | 5.0 | 1.4 | 8.6 |
| Eccentric Mean Force [N] | 635.0 | 90.2 | 614.5 | 634.9 | 90.0 | 614.5 | 635.3 | 90.0 | 614.0 | 0.689 | 1.00 | 1.00 | 1.00 | 1.4 | 4.0 | 3.3 | 0.2 | 0.1 | 0.4 |
| Eccentric Peak Force [N] | 1533 | 236.1 | 1508 | 1578 | 278.4 | 1552 | 1575 | 216.4 | 1526 | 0.205 | 0.91 | 0.77 | 0.97 | 79.7 | 220.9 | 185.4 | 3.8 | 1.1 | 6.6 |
| Eccentric Peak Force/BM [N/kg] | 23.8 | 2.9 | 24.2 | 24.4 | 2.7 | 24.5 | 24.4 | 1.9 | 24.9 | 0.237 | 0.79 | 0.50 | 0.92 | 1.1 | 3.2 | 2.7 | 3.9 | 1.1 | 6.6 |
| Forceat Zero Velocity [N] | 1518 | 231.2 | 1501 | 1555 | 244.5 | 1531 | 1566 | 214.4 | 1523 | 0.073 | 0.96 | 0.89 | 0.90 | 62.9 | 174.2 | 146.2 | 3.3 | 0.9 | 5.7 |
| Eccentric Braking Impulse [Ns] | 41.3 | 12.9 | 40.4 | 46.0 | 13.9 | 43.2 | 47.8 | 15.7 | 45.0 | 0.046 | 0.81 | 0.55 | 0.93 | 7.8 | 21.6 | 18.1 | 16.2 | 4.6 | 27.8 |
| Eccentric Braking RFD [N/s] | 5220 | 2104.3 | 5577 | 5855 | 2640 | 5767 | 5443 | 1661 | 5679 | 0.113 | 0.89 | 0.71 | 0.96 | 876.8 | 2430 | 2039 | 12.4 | 3.5 | 21.2 |
| Kinematics | |||||||||||||||||||
| Concentric Mean Power [W] | 1574 | 179.8 | 1563 | 1609 | 222.0 | 1641 | 1621 | 182.6 | 1668 | 0.039 | 0.95 | 0.87 | 0.98 | 55.7 | 154.5 | 129.6 | 3.1 | 0.9 | 5.4 |
| Concentric Mean Power/BM [W/kg] | 24.5 | 2.6 | 24.0 | 25.0 | 2.8 | 24.0 | 25.3 | 2.9 | 24.4 | 0.034 | 0.94 | 0.84 | 0.98 | 0.9 | 2.4 | 2.0 | 3.2 | 0.9 | 5.5 |
| Peak Power [W] | 2810 | 370.2 | 2837 | 2830 | 401.9 | 2835 | 2841 | 347.7 | 2885 | 0.560 | 0.97 | 0.91 | 0.99 | 81.0 | 224.4 | 188.3 | 2.6 | 0.8 | 4.5 |
| Peak Power/BM [W/kg] | 43.8 | 5.0 | 43.6 | 44.0 | 4.9 | 43.8 | 44.2 | 4.9 | 44.0 | 0.561 | 0.95 | 0.87 | 0.98 | 1.3 | 3.5 | 2.9 | 2.7 | 0.8 | 4.6 |
| Concentric Peak Velocity [m/s] | 2.46 | 0.19 | 2.48 | 2.47 | 0.18 | 2.45 | 2.50 | 0.18 | 2.48 | 0.006 | 0.97 | 0.92 | 0.99 | 0.04 | 0.12 | 0.10 | 1.7 | 0.5 | 3.0 |
| Velocity at Peak Power [m/s] | 2.22 | 0.18 | 2.23 | 2.24 | 0.18 | 2.25 | 2.27 | 0.17 | 2.27 | 0.023 | 0.95 | 0.87 | 0.98 | 0.05 | 0.14 | 0.11 | 2.0 | 0.6 | 3.5 |
| Eccentric Mean Power [W] | 413.8 | 83.0 | 409.5 | 433.6 | 83.6 | 418.5 | 435.8 | 90.7 | 424.0 | 0.093 | 0.95 | 0.85 | 0.98 | 31.7 | 88.0 | 73.8 | 6.5 | 1.8 | 11.1 |
| Eccentric Mean Power/BM [W/kg] | 6.5 | 1.3 | 6.6 | 6.7 | 1.2 | 6.9 | 6.7 | 1.1 | 6.7 | 0.139 | 0.93 | 0.80 | 0.97 | 0.5 | 1.3 | 1.1 | 6.5 | 1.8 | 11.1 |
| Eccentric Peak Power [W] | 1263 | 435.0 | 1307 | 1393 | 509.6 | 1307 | 1313 | 331.7 | 1318 | 0.144 | 0.88 | 0.70 | 0.96 | 187.9 | 520.8 | 437.1 | 10.4 | 3.0 | 17.8 |
| Eccentric Peak Power/BM [W/kg] | 19.8 | 6.8 | 20.3 | 21.5 | 6.7 | 21.4 | 20.3 | 4.3 | 21.0 | 0.175 | 0.87 | 0.67 | 0.95 | 2.7 | 7.4 | 6.2 | 10.4 | 3.0 | 17.9 |
| Eccentric Peak Velocity [m/s] | −1.29 | 0.28 | −1.36 | −1.35 | 0.23 | −1.40 | −1.35 | 0.22 | −1.33 | 0.105 | 0.97 | 0.93 | 0.99 | 0.09 | 0.24 | 0.20 | 5.9 | 1.7 | 10.1 |
| Jump strategy | |||||||||||||||||||
| Contraction Time [ms] | 714.0 | 116.0 | 680.5 | 691.4 | 99.7 | 665.0 | 716.8 | 89.2 | 698.5 | 0.198 | 0.94 | 0.85 | 0.98 | 43.4 | 120.3 | 100.9 | 4.9 | 1.4 | 8.3 |
| Concentric Duration [ms] | 263.4 | 32.8 | 253.0 | 262.3 | 38.9 | 253.5 | 267.5 | 37.5 | 253.0 | 0.430 | 0.94 | 0.84 | 0.98 | 11.8 | 32.8 | 27.5 | 3.7 | 1.1 | 6.3 |
| Eccentric Duration [ms] | 450.6 | 90.4 | 422.0 | 429.2 | 68.9 | 432.0 | 449.3 | 60.9 | 449.5 | 0.164 | 0.94 | 0.84 | 0.98 | 35.6 | 98.7 | 82.8 | 6.3 | 1.8 | 10.8 |
| Countermovement Depth [cm] | 29.3 | 6.1 | −30.1 | 29.5 | 6.7 | −29.9 | 31.0 | 6.7 | −30.4 | 0.034 | 0.95 | 0.86 | 0.98 | 2.0 | 5.6 | 4.7 | −5.7 | 1.6 | 9.8 |
| Day 1 | Day 2 | p Value | ICC (95%CI) | SEM | CV (95%CI) | |||||||||
|---|---|---|---|---|---|---|---|---|---|---|---|---|---|---|
| Mean | SD | Mean | SD | ICC | LL | UL | SEM | MD 95%CI | MD 90%CI | CV (%) | LL | UL | ||
| Jump outcomes | ||||||||||||||
| Jump Height (Imp-Mom) [cm] | 28.3 | 4.8 | 28.5 | 4.3 | 0.341 | 0.93 | 0.81 | 0.97 | 1.3 | 3.5 | 3.0 | 3.8 | 1.1 | 6.4 |
| Jump Height (Flight Time) [cm] | 30.2 | 5.4 | 30.1 | 4.9 | 0.438 | 0.92 | 0.79 | 0.97 | 1.5 | 4.2 | 3.5 | 4.3 | 1.2 | 7.4 |
| RSI-modified [m/s] | 0.43 | 0.07 | 0.42 | 0.07 | 0.128 | 0.92 | 0.80 | 0.97 | 0.02 | 0.06 | 0.05 | 4.2 | 1.2 | 7.3 |
| Kinetics | ||||||||||||||
| Concentric Mean Force [N] | 1211 | 162.9 | 1217 | 164.9 | 0.292 | 0.97 | 0.92 | 0.99 | 29.6 | 82.2 | 69.0 | 2.0 | 0.6 | 3.4 |
| Concentric Mean Force/BM [N/kg] | 18.8 | 1.1 | 18.8 | 1.2 | 0.409 | 0.87 | 0.66 | 0.95 | 0.4 | 1.2 | 1.0 | 2.0 | 0.6 | 3.5 |
| Concentric Peak Force [N] | 1560 | 217.3 | 1552 | 241.4 | 0.376 | 0.92 | 0.79 | 0.97 | 67.6 | 187.3 | 157.2 | 2.8 | 0.8 | 4.9 |
| Concentric Peak Force/BM [N/kg] | 24.2 | 2.0 | 24.0 | 2.5 | 0.278 | 0.80 | 0.53 | 0.93 | 1.0 | 2.9 | 2.4 | 3.1 | 0.9 | 5.2 |
| Concentric Impulse [N s] | 151.1 | 18.2 | 152.4 | 18.6 | 0.117 | 0.98 | 0.94 | 0.99 | 3.0 | 8.3 | 6.9 | 1.7 | 0.5 | 2.9 |
| Concentric Impulse-50 ms [N s] | 43.3 | 7.2 | 43.3 | 8.3 | 0.480 | 0.88 | 0.70 | 0.96 | 2.7 | 7.6 | 6.4 | 4.3 | 1.2 | 7.3 |
| Concentric Impulse-100 ms [N s] | 79.8 | 13.5 | 80.0 | 14.6 | 0.452 | 0.91 | 0.76 | 0.97 | 4.4 | 12.3 | 10.3 | 4.4 | 1.2 | 7.5 |
| Eccentric Mean Force [N] | 635.1 | 89.9 | 637.6 | 86.7 | 0.098 | 1.00 | 0.99 | 1.00 | 5.5 | 15.2 | 12.8 | 0.8 | 0.2 | 1.3 |
| Eccentric Peak Force [N] | 1562 | 236.5 | 1553 | 244.8 | 0.381 | 0.90 | 0.74 | 0.96 | 79.3 | 219.9 | 184.5 | 3.5 | 1.0 | 6.1 |
| Eccentric Peak Force/BM [N/kg] | 24.2 | 2.4 | 24.0 | 2.6 | 0.312 | 0.78 | 0.48 | 0.92 | 1.2 | 3.3 | 2.8 | 3.8 | 1.1 | 6.5 |
| Force at Zero Velocity [N] | 1546 | 225.2 | 1546 | 242.6 | 0.489 | 0.91 | 0.76 | 0.97 | 73.4 | 203.3 | 170.7 | 3.2 | 0.9 | 5.5 |
| Eccentric Braking Impulse [N s] | 45.0 | 12.9 | 45.4 | 11.6 | 0.423 | 0.83 | 0.58 | 0.94 | 5.2 | 14.5 | 12.1 | 9.9 | 2.8 | 16.9 |
| Eccentric Braking RFD [N/s] | 5506 | 2060.6 | 5327 | 1633.5 | 0.251 | 0.86 | 0.65 | 0.95 | 722.7 | 2003 | 1681 | 11.6 | 3.3 | 19.9 |
| Kinematics | ||||||||||||||
| Concentric Mean Power [W] | 1601 | 191.2 | 1618 | 212.6 | 0.172 | 0.95 | 0.86 | 0.98 | 48.8 | 135.3 | 113.5 | 2.5 | 0.7 | 4.3 |
| Concentric Mean Power/BM [W/kg] | 24.9 | 2.7 | 25.1 | 2.7 | 0.322 | 0.93 | 0.80 | 0.97 | 0.8 | 2.1 | 1.8 | 2.7 | 0.8 | 4.6 |
| Peak Power [W] | 2827 | 367.9 | 2858 | 372.4 | 0.139 | 0.96 | 0.89 | 0.99 | 78.9 | 218.8 | 183.7 | 2.4 | 0.7 | 4.1 |
| Peak Power/BM [W/kg] | 44.0 | 4.8 | 44.2 | 4.3 | 0.291 | 0.92 | 0.79 | 0.97 | 1.4 | 3.8 | 3.1 | 2.7 | 0.8 | 4.6 |
| Concentric Peak Velocity [m/s] | 2.48 | 0.18 | 2.49 | 0.16 | 0.229 | 0.93 | 0.81 | 0.98 | 0.05 | 0.13 | 0.11 | 1.6 | 0.5 | 2.8 |
| Velocity at Peak Power [m/s] | 2.24 | 0.18 | 2.26 | 0.16 | 0.221 | 0.92 | 0.80 | 0.97 | 0.05 | 0.14 | 0.11 | 1.8 | 0.5 | 3.1 |
| Eccentric Mean Power [W] | 427.8 | 82.3 | 412.6 | 76.0 | 0.099 | 0.86 | 0.64 | 0.95 | 32.7 | 90.7 | 76.1 | 6.3 | 1.8 | 10.8 |
| Eccentric Mean Power/BM [W/kg] | 6.6 | 1.1 | 6.4 | 1.0 | 0.073 | 0.80 | 0.52 | 0.92 | 0.5 | 1.4 | 1.2 | 6.5 | 1.8 | 11.2 |
| Eccentric Peak Power [W] | 1323 | 405.3 | 1234 | 333.5 | 0.061 | 0.85 | 0.62 | 0.94 | 161.9 | 448.7 | 376.6 | 9.7 | 2.8 | 16.6 |
| Eccentric Peak Power/BM [W/kg] | 20.5 | 5.7 | 19.1 | 4.5 | 0.055 | 0.80 | 0.52 | 0.93 | 2.6 | 7.1 | 5.9 | 9.6 | 2.7 | 16.5 |
| Eccentric Peak Velocity [m/s] | −1.33 | 0.23 | −1.28 | 0.19 | 0.083 | 0.84 | 0.59 | 0.94 | 0.09 | 0.26 | 0.22 | 5.2 | 1.5 | 9.0 |
| Jump strategy | ||||||||||||||
| Contraction Time [ms] | 707.3 | 96.1 | 723.1 | 95.8 | 0.159 | 0.82 | 0.56 | 0.93 | 43.3 | 120.1 | 100.8 | 4.6 | 1.3 | 7.8 |
| Concentric Duration [ms] | 264.3 | 35.2 | 265.0 | 32.9 | 0.447 | 0.82 | 0.56 | 0.93 | 15.0 | 41.7 | 35.0 | 4.1 | 1.2 | 7.0 |
| Eccentric Duration [ms] | 443.0 | 68.8 | 458.0 | 71.5 | 0.111 | 0.80 | 0.52 | 0.92 | 33.9 | 94.0 | 78.9 | 5.8 | 1.7 | 10.0 |
| Countermovement Depth [cm] | 29.9 | 6.3 | 29.5 | 5.2 | 0.314 | 0.86 | 0.65 | 0.95 | 2.2 | 6.2 | 5.2 | 5.1 | 1.4 | 8.7 |
4. Discussion
4.1. CMJ
4.2. DJ
5. Conclusions and Practical Applications
Author Contributions
Funding
Institutional Review Board Statement
Informed Consent Statement
Data Availability Statement
Conflicts of Interest
References
- Borresen, J.; Ian Lambert, M. The Quantification of Training Load, the Training Response and the Effect on Performance. Sport. Med. 2009, 39, 779–795. [Google Scholar] [CrossRef] [PubMed]
- Halson, S.L. Monitoring Training Load to Understand Fatigue in Athletes. Sport. Med. 2014, 44, 139–147. [Google Scholar] [CrossRef]
- Sattler, T.; Sekulic, D.; Hadzic, V.; Uljevic, O.; Dervisevic, E. Vertical Jumping Tests in Volleyball: Reliability, Validity, and Playing-Position Specifics. J. Strength. Cond. Res. 2012, 26, 1532–1538. [Google Scholar] [CrossRef]
- Carroll, K.M.; Wagle, J.P.; Sole, C.J.; Stone, M.H. Intrasession and Intersession Reliability of Countermovement Jump Testing in Division-I Volleyball Athletes. J. Strength. Cond. Res. 2019, 33, 2932–2935. [Google Scholar] [CrossRef]
- McMahon, J.J.; Lake, J.P.; Stratford, C.; Comfort, P. A Proposed Method for Evaluating Drop Jump Performance with One Force Platform. Biomechanics 2021, 1, 15. [Google Scholar] [CrossRef]
- Mercer, R.A.J.; Russell, J.L.; McGuigan, L.C.; Coutts, A.J.; Strack, D.S.; McLean, B.D. Finding the Signal in the Noise—Interday Reliability and Seasonal Sensitivity of 84 Countermovement Jump Variables in Professional Basketball Players. J. Strength. Cond. Res. 2023, 37, 394–402. [Google Scholar] [CrossRef]
- Bishop, C.; Jordan, M.; Torres-Ronda, L.; Loturco, I.; Harry, J.; Virgile, A.; Mundy, P.; Turner, A.; Comfort, P. Selecting Metrics That Matter: Comparing the Use of the Countermovement Jump for Performance Profiling, Neuromuscular Fatigue Monitoring, and Injury Rehabilitation Testing. Strength. Cond. J. 2023. ahead of print. [Google Scholar] [CrossRef]
- Badby, A.J.; Mundy, P.D.; Comfort, P.; Lake, J.P.; Mcmahon, J.J.; Badby, A.J.; Mundy, P.D.; Comfort, P.; Lake, J.P.; Mcmahon, J.J. The Validity of Hawkin Dynamics Wireless Dual Force Plates for Measuring Countermovement Jump and Drop Jump Variables. Sensors 2023, 23, 4820. [Google Scholar] [CrossRef]
- Anicic, Z.; Janicijevic, D.; Knezevic, O.M.; Garcia-Ramos, A.; Petrovic, M.R.; Cabarkapa, D.; Mirkov, D.M. Assessment of Countermovement Jump: What Should We Report? Life 2023, 13, 190. [Google Scholar] [CrossRef] [PubMed]
- Rebelo, A.; Pereira, J.R.; Martinho, D.V.; Amorim, G.; Lima, R.; Valente-Dos Santos, J. Training Load, Neuromuscular Fatigue, and Well-Being of Elite Male Volleyball Athletes During an In-Season Mesocycle. Int. J. Sport. Physiol. Perform. 2023, 18, 354–362. [Google Scholar] [CrossRef] [PubMed]
- Twist, C.; Waldron, M.; Highton, J.; Burt, D.; Daniels, M. Neuromuscular, Biochemical and Perceptual Post-Match Fatigue in Professional Rugby League Forwards and Backs. J. Sport. Sci. 2012, 30, 359–367. [Google Scholar] [CrossRef]
- González-Ravé, J.M.; Arija, A.; Clemente-Suarez, V. Seasonal Changes in Jump Performance and Body Composition in Women Volleyball Players. J. Strength. Cond. Res. 2011, 25, 1492–1501. [Google Scholar] [CrossRef]
- González-García, J.; Latella, C.; Aguilar-Navarro, M.; Romero-Moraleda, B. Effects of Resistance Priming Exercise on Within-Day Jumping Performance and Its Relationship with Strength Level. Int. J. Sport. Med. 2023, 44, 38–47. [Google Scholar] [CrossRef] [PubMed]
- González-García, J.; Aguilar-Navarro, M.; Giráldez-Costas, V.; Romero-Moraleda, B. Time Course of Jump Recovery and Performance After Velocity-Based Priming and Concurrent Caffeine Intake. Res. Q. Exerc. Sport. 2022, 94, 655–667. [Google Scholar] [CrossRef] [PubMed]
- González-García, J.; Giráldez-Costas, V.; Ruiz-Moreno, C.; Gutiérrez-Hellín, J.; Romero-Moraleda, B. Delayed Potentiation Effects on Neuromuscular Performance after Optimal Load and High Load Resistance Priming Sessions Using Velocity Loss. Eur. J. Sport. Sci. 2020, 21, 1617–1627. [Google Scholar] [CrossRef] [PubMed]
- Gathercole, R.J.; Sporer, B.C.; Stellingwerff, T.; Sleivert, G.G. Comparison of the Capacity of Different Jump and Sprint Field Tests to Detect Neuromuscular Fatigue. J. Strength. Cond. Res. 2015, 29, 2522–2531. [Google Scholar] [CrossRef] [PubMed]
- Kollias, I.; Panoutsakopoulos, V.; Papaiakovou, G. Comparing Jumping Ability among Athletes of Various Sports: Vertical Drop Jumping from 60 Centimeters. J. Strength. Cond. Res. 2004, 18, 546–550. [Google Scholar] [CrossRef] [PubMed]
- Laffaye, G.; Wagner, P.P.; Tombleson, T.I.L. Countermovement Jump Height: Gender and Sport-Specific Differences in the Force-Time Variables. J. Strength. Cond. Res. 2014, 28, 1096–1105. [Google Scholar] [CrossRef] [PubMed]
- Comfort, P.; Jones, P.A.; McMahon, J.J. (Eds.) Performance Assessment in Strength and Conditioning, 1st ed.; Routledge: London, UK, 2019. [Google Scholar]
- Attia, A.; Dhahbi, W.; Chaouachi, A.; Padulo, J.; Wong, D.P.; Chamari, K. Measurement Errors When Estimating the Vertical Jump Height with Flight Time Using Photocell Devices: The Example of Optojump. Biol. Sport. 2017, 34, 63. [Google Scholar] [CrossRef]
- McMahon, J.J.; Suchomel, T.J.; Lake, J.P.; Comfort, P. Understanding the Key Phases of the Countermovement Jump Force-Time Curve. Strength. Cond. J. 2018, 40, 96–106. [Google Scholar] [CrossRef]
- Payne, R.W. Reliability Theory and Clinical Psychology. J. Clin. Psychol. 1989, 45, 351–353. [Google Scholar] [CrossRef]
- Bishop, C.; Turner, A.; Jordan, M.; Harry, J.; Loturco, I.; Lake, J.; Comfort, P. A Framework to Guide Practitioners for Selecting Metrics during the Countermovement and Drop Jump Tests. Strength. Cond. J. 2022, 44, 95–103. [Google Scholar] [CrossRef]
- Cormie, P.; McBride, J.M.; McCaulley, G.O. Power-Time, Force-Time, and Velocity-Time Curve Analysis of the Countermovement Jump: Impact of Training. J. Strength. Cond. Res. 2009, 23, 177–186. [Google Scholar] [CrossRef]
- Marques, M.C.; Izquierdo, M.; Marinho, D.A.; Barbosa, T.M.; Ferraz, R.; González-Badillo, J.J. Association Between Force-Time Curve Characteristics and Vertical Jump Performance in Trained Athletes. J. Strength. Cond. Res. 2015, 29, 2045–2049. [Google Scholar] [CrossRef]
- McLester, C.N.; Nickerson, B.S.; Kliszczewicz, B.M.; McLester, J.R. Reliability and Agreement of Various InBody Body Composition Analyzers as Compared to Dual-Energy X-Ray Absorptiometry in Healthy Men and Women. J. Clin. Densitom. 2020, 23, 443–450. [Google Scholar] [CrossRef] [PubMed]
- Teo, W.; McGuigan, M.R.; Newton, M.J. The Effects of Circadian Rhythmicity of Salivary Cortisol and Testosterone on Maximal Isometric Force, Maximal Dynamic Force, and Power Output. J. Strength. Cond. Res. 2011, 25, 1538–1545. [Google Scholar] [CrossRef]
- Rae, D.E.; Stephenson, K.J.; Roden, L.C. Factors to Consider When Assessing Diurnal Variation in Sports Performance: The Influence of Chronotype and Habitual Training Time-of-Day. Eur. J. Appl. Physiol. 2015, 115, 1339–1349. [Google Scholar] [CrossRef]
- Scott, T.J.; Black, C.R.; Quinn, J.; Coutts, A.J. Validity and Reliability of the Session-RPE Method for Quantifying Training in Australian Football: A Comparison of the CR10 and CR100 Scales. J. Strength. Cond. Res. 2013, 27, 270–276. [Google Scholar] [CrossRef]
- Impellizzeri, F.M.; Rampinini, E.; Coutts, A.J.; Sassi, A.; Marcora, S.M. Use of RPE-Based Training Load in Soccer. Med. Sci. Sport. Exerc. 2004, 36, 1042–1047. [Google Scholar] [CrossRef] [PubMed]
- Shaw, A.G.; Chae, S.; Levitt, D.E.; Nicholson, J.L.; Vingren, J.L.; Hill, D.W. Effect of Previous-Day Alcohol Ingestion on Muscle Function and Performance of Severe-Intensity Exercise. Int. J. Sport. Physiol. Perform. 2021, 17, 44–49. [Google Scholar] [CrossRef] [PubMed]
- Del Coso, J.; Pérez-López, A.; Abian-Vicen, J.; Salinero, J.J.; Lara, B.; Valadés, D. Enhancing Physical Performance in Male Volleyball Players with a Caffeine-Containing Energy Drink. Int. J. Sport. Physiol. Perform. 2014, 9, 1013–1018. [Google Scholar] [CrossRef] [PubMed]
- Jeffreys, I. The Warm-Up: Maximize Performance and Improve Long-Term Athletic Development; Human Kinetics: Champaign, IL, USA, 2018; ISBN 9781492571278. [Google Scholar]
- Moir, G.L. Three Different Methods of Calculating Vertical Jump Height from Force Platform Data in Men and Women. Meas. Phys. Educ. Exerc. Sci. 2008, 12, 207–218. [Google Scholar] [CrossRef]
- Byrne, P.J.; Moran, K.; Rankin, P.; Kinsella, S. A Comparison of Methods Used to Identify Optimal Drop Height for Early Phase Adaptations in Depth Jump Training. J. Strength. Cond. Res. 2010, 24, 2050–2055. [Google Scholar] [CrossRef]
- Hopkins, W.G. Spreadsheets for Analysis of Validity and Reliability. Sportscience 2015, 19, 36–42. [Google Scholar]
- Borg, D.N.; Bach, A.J.E.; O’Brien, J.L.; Sainani, K.L. Calculating Sample Size for Reliability Studies. PM R 2022, 14, 1018–1025. [Google Scholar] [CrossRef]
- McMahon, J.J.; Ripley, N.J.; Comfort, P. Force Plate-Derived Countermovement Jump Normative Data and Benchmarks for Professional Rugby League Players. Sensors 2022, 22, 8669. [Google Scholar] [CrossRef]
- Heishman, A.D.; Daub, B.D.; Miller, R.M.; Freitas, E.D.S.; Frantz, B.A.; Bemben, M.G. Countermovement Jump Reliability Performed with and without an Arm Swing in NCAA Division 1 Intercollegiate Basketball Players. J. Strength. Cond. Res. 2018, 34, 546–558. [Google Scholar] [CrossRef]
- Baumgartner, T.A. Norm-Referenced Measurement: Reliability. Meas. Concepts Phys. Educ. Exerc. Sci. 1989, 20, 45–47. [Google Scholar]
- Weir, J.P. Quantifying Test-Retest Reliability Using the Intraclass Correlation Coefficient and the SEM. J. Strength. Cond. Res. 2005, 19, 231–240. [Google Scholar] [CrossRef]
- Portney, L.G.; Watkins, M.P. Foundations of Clinical Research: Applications to Practice, 3rd ed.; Pearson: New Jersey, NJ, USA, 2008. [Google Scholar]
- Atkinson, G.; Nevill, A.M. Statistical Methods for Assessing Measurement Error (Reliability) in Variables Relevant to Sports Medicine. Sport. Med. 1998, 26, 217–238. [Google Scholar] [CrossRef] [PubMed]
- Hartmann, H.; Wirth, K.; Klusemann, M.; Dalic, J.; Matuschek, C.; Schmidtbleicher, D. Influence of Squatting Depth on Jumping Performance. J. Strength. Cond. Res. 2012, 26, 3243–3261. [Google Scholar] [CrossRef] [PubMed]
- Pérez-Castilla, A.; Rojas, F.J.; Gómez-Martínez, F.; García-Ramos, A. Vertical Jump Performance Is Affected by the Velocity and Depth of the Countermovement. Sport. Biomech. 2021, 20, 1015–1030. [Google Scholar] [CrossRef] [PubMed]
- Cormie, P.; McGuigan, M.R.; Newton, R.U. Changes in the Eccentric Phase Contribute to Improved Stretch-Shorten Cycle Performance after Training. Med. Sci. Sport. Exerc. 2010, 42, 1731–1744. [Google Scholar] [CrossRef] [PubMed]
- Feldmann, C.R.; Weiss, L.W.; Schilling, B.K.; Whitehead, P.N. Association of Drop Vertical Jump Displacement with Select Performance Variables. J. Strength. Cond. Res. 2012, 26, 1215–1225. [Google Scholar] [CrossRef]
- Tenelsen, F.; Brueckner, D.; Muehlbauer, T.; Hagen, M. Validity and Reliability of an Electronic Contact Mat for Drop Jump Assessment in Physically Active Adults. Sports 2019, 7, 114. [Google Scholar] [CrossRef] [PubMed]
- Keller, M.; Lauber, B.; Gottschalk, M.; Taube, W. Enhanced Jump Performance When Providing Augmented Feedback Compared to an External or Internal Focus of Attention. J. Sport. Sci. 2015, 33, 1067–1075. [Google Scholar] [CrossRef]
- Pérez-Castilla, A.; Weakley, J.; García-Pinillos, F.; Rojas, F.J.; García-Ramos, A. Influence of Countermovement Depth on the Countermovement Jump-Derived Reactive Strength Index Modified. Eur. J. Sport. Sci. 2021, 21, 1606–1616. [Google Scholar] [CrossRef]
- Ruddock, A.D.; Winter, E.M. Jumping Depends on Impulse Not Power. J. Sport. Sci. 2016, 34, 584–585. [Google Scholar] [CrossRef]

| Mean | SD | |
|---|---|---|
| Age (Years) | 20.3 | 2.5 |
| Weight (kg) | 61.3 | 8.4 |
| Height (m) | 1.6 | 0.04 |
| Body Mass Index (kg/m2) | 21.9 | 2.6 |
| Fat percentage (%) | 24.7 | 4.9 |
| Fat mass (kg) | 15.6 | 4.3 |
| Fat free mass (kg) | 15.5 | 4.1 |
| Basal metabolic rate (Kcal) | 1454 | 108.2 |
| Trial 1 | Trial 2 | Trial 3 | p Value | ICC (95%CI) | SEM | CV (95%CI) | ||||||||||||||
|---|---|---|---|---|---|---|---|---|---|---|---|---|---|---|---|---|---|---|---|---|
| Mean | SD | x͂ | Mean | SD | x͂ | Mean | SD | x͂ | ICC | LL | UL | SEM | MD 95%CI | MD 90%CI | CV (%) | LL | UL | |||
| Jump outcomes | ||||||||||||||||||||
| Jump Height (Imp-Mom) [cm] | 25.5 | 5.5 | 25.1 | 27.3 | 4.8 | 26.2 | 27.5 | 5.1 | 27.2 | 0.007 | 0.91 | 0.77 | 0.97 | 2.2 | 6.0 | 5.0 | 6.7 | 1.9 | 11.5 | |
| Jump Height (Flight Time) [cm] | 25.4 | 5.5 | 25.0 | 27.3 | 4.8 | 26.3 | 27.5 | 5.1 | 27.1 | 0.021 | 0.91 | 0.76 | 0.97 | 2.2 | 6.1 | 5.1 | 6.8 | 1.9 | 11.6 | |
| RSImod [m/s] | 0.98 | 0.24 | 1.80 | 1.11 | 0.21 | 1.88 | 1.13 | 0.26 | 1.86 | 0.011 | 0.79 | 0.48 | 0.93 | 0.17 | 0.47 | 0.39 | 11.7 | 3.3 | 20.1 | |
| Kinetics | ||||||||||||||||||||
| Concentric Mean Force [N] | 1630 | 223.1 | 1620 | 1718 | 196.9 | 1682 | 1715 | 230.7 | 1723 | 0.062 | 0.78 | 0.44 | 0.92 | 141.8 | 393.1 | 329.9 | 6.7 | 1.9 | 11.4 | |
| Concentric Impulse [N s] | 142.5 | 17.0 | 140.8 | 147.9 | 18.2 | 145.0 | 146.2 | 15.0 | 144.9 | 0.008 | 0.94 | 0.82 | 0.98 | 6.3 | 17.4 | 14.6 | 3.4 | 1.0 | 5.8 | |
| Eccentric Mean Force [N] | 2017 | 363.1 | 1940 | 2106 | 347.2 | 2072 | 2094 | 391.5 | 2063 | 0.164 | 0.88 | 0.87 | 0.96 | 210.2 | 582.5 | 488.9 | 8.1 | 2.3 | 14.0 | |
| Eccentric Impulse [N s] | 160.2 | 23.0 | 153.2 | 162.2 | 22.8 | 158.2 | 159.2 | 23.9 | 156.9 | 0.512 | 0.94 | 0.82 | 0.98 | 6.2 | 17.2 | 14.4 | 3.4 | 1.0 | 5.7 | |
| Kinematics | ||||||||||||||||||||
| Concentric Mean Power [W] | 6167 | 870.1 | 6079 | 6604 | 726.8 | 6372 | 6570 | 788.9 | 6740 | 0.012 | 0.78 | 0.40 | 0.91 | 570.2 | 1580 | 1326 | 7.0 | 2.0 | 12.0 | |
| Concentric Mean Power /BM [W/kg] | 96.4 | 13.3 | 96.0 | 103.3 | 11.6 | 103.1 | 104.1 | 13.0 | 102.0 | 0.015 | 0.81 | 0.50 | 0.93 | 9.2 | 25.6 | 21.5 | 7.0 | 2.0 | 12.0 | |
| Peak Power [W] | 8556 | 1496 | 8427 | 9193 | 1189 | 8986 | 9183 | 1317.8 | 9201 | 0.069 | 0.73 | 0.34 | 0.90 | 1059.7 | 2937 | 2465 | 9.3 | 2.6 | 15.9 | |
| Peak Power/BM [W/kg] | 133.6 | 22.8 | 134.8 | 143.8 | 19.4 | 143.9 | 145.2 | 19.7 | 143.4 | 0.110 | 0.75 | 0.39 | 0.91 | 17.4 | 48.1 | 40.4 | 9.3 | 2.6 | 15.9 | |
| Concentric Peak Velocity [m/s] | 2.36 | 0.21 | 2.35 | 2.43 | 0.18 | 2.40 | 2.44 | 0.18 | 2.42 | 0.016 | 0.91 | 0.76 | 0.97 | 0.09 | 0.24 | 0.20 | 2.7 | 0.8 | 4.7 | |
| Jump strategy | ||||||||||||||||||||
| Contact Time [s] | 0.3 | 0.0 | 0.3 | 0.2 | 0.0 | 0.2 | 0.2 | 0.0 | 0.3 | 0.296 | 0.68 | 0.25 | 0.88 | 0.0 | 0.1 | 0.1 | 10.6 | 3.0 | 18.2 | |
| Countermovement Depth [cm] | 18.3 | 2.7 | −17.9 | 17.5 | 2.1 | −17.3 | 17.7 | 3.4 | −18.4 | 0.392 | 0.70 | 0.29 | 0.89 | 2.2 | 6.0 | 5.1 | 9.6 | 2.7 | 16.5 | |
| Day 1 | Day 2 | p Value | ICC (95%CI) | SEM | CV (95%CI) | |||||||||
|---|---|---|---|---|---|---|---|---|---|---|---|---|---|---|
| Mean | SD | Mean | SD | ICC | UL | LL | SEM | MD 95%CI | MD 90%CI | CV (%) | LL | UL | ||
| Jump outcomes | ||||||||||||||
| Jump Height (Imp-Mom) [cm] | 26.8 | 4.9 | 27.1 | 3.4 | 0.332 | 0.81 | 0.55 | 0.93 | 1.9 | 5.2 | 4.4 | 6.1 | 1.7 | 10.4 |
| Jump Height (Flight Time) [cm] | 26.8 | 4.9 | 27.1 | 3.4 | 0.332 | 0.81 | 0.53 | 0.93 | 1.9 | 5.3 | 4.4 | 6.2 | 1.8 | 10.6 |
| RSImod[m/s] | 1.08 | 0.20 | 0.97 | 0.15 | 0.003 | 0.73 | 0.38 | 0.90 | 0.12 | 0.33 | 0.28 | 10.6 | 3.0 | 18.3 |
| Kinetics | ||||||||||||||
| Concentric Mean Force [N] | 1694 | 183.8 | 1601 | 220.4 | 0.010 | 0.78 | 0.47 | 0.92 | 117.8 | 326.5 | 274.0 | 5.8 | 1.7 | 10.0 |
| Concentric Impulse [N s] | 146.4 | 16.4 | 148.8 | 16.5 | 0.107 | 0.91 | 0.76 | 0.97 | 5.4 | 15.0 | 12.6 | 3.0 | 0.9 | 5.2 |
| Eccentric Mean Force [N] | 2087 | 324.1 | 1912 | 339.5 | 0.001 | 0.89 | 0.70 | 0.96 | 169.6 | 470.2 | 394.6 | 6.8 | 1.9 | 11.6 |
| Eccentric Impulse [N s] | 161.4 | 22.5 | 158.9 | 21.4 | 0.014 | 0.99 | 0.96 | 0.99 | 3.3 | 9.2 | 7.7 | 1.7 | 0.5 | 2.9 |
| Kinematics | ||||||||||||||
| Concentric Mean Power [W] | 6482 | 684.2 | 6063 | 758.3 | 0.004 | 0.74 | 0.40 | 0.90 | 478.8 | 1327 | 1113 | 6.6 | 1.9 | 11.3 |
| Concentric Mean Power/BM [W/kg] | 101.4 | 10.7 | 93.8 | 8.1 | 0.001 | 0.70 | 0.33 | 0.88 | 7.5 | 20.8 | 17.4 | 7.1 | 2.0 | 12.1 |
| Peak Power [W] | 9019 | 1039 | 8210 | 1201 | 0.001 | 0.70 | 0.34 | 0.89 | 842.9 | 2336 | 1960 | 8.0 | 2.3 | 13.8 |
| Peak Power/BM [W/kg] | 140.9 | 15.2 | 127.1 | 14.2 | 0.001 | 0.65 | 0.24 | 0.86 | 13.2 | 36.5 | 30.6 | 8.4 | 2.4 | 14.4 |
| Concentric Peak Velocity [m/s] | 2.42 | 0.18 | 2.44 | 0.13 | 0.211 | 0.81 | 0.54 | 0.93 | 0.07 | 0.20 | 0.17 | 2.5 | 0.7 | 4.3 |
| Jump strategy | ||||||||||||||
| Contact Time [s] | 0.3 | 0.0 | 0.3 | 0.0 | 0.002 | 0.49 | 0.02 | 0.79 | 0.0 | 0.1 | 0.1 | 9.1 | 2.6 | 15.7 |
| Countermovement Depth [cm] | 17.8 | 2.0 | 19.7 | 3.1 | 0.004 | 0.56 | 0.11 | 0.82 | 2.2 | 6.1 | 5.2 | 8.1 | 2.3 | 13.9 |
Disclaimer/Publisher’s Note: The statements, opinions and data contained in all publications are solely those of the individual author(s) and contributor(s) and not of MDPI and/or the editor(s). MDPI and/or the editor(s) disclaim responsibility for any injury to people or property resulting from any ideas, methods, instructions or products referred to in the content. |
© 2024 by the authors. Licensee MDPI, Basel, Switzerland. This article is an open access article distributed under the terms and conditions of the Creative Commons Attribution (CC BY) license (https://creativecommons.org/licenses/by/4.0/).
Share and Cite
González-García, J.; Conejero, M.; Gutiérrez-Hellín, J. Assessing Jump Performance: Intra- and Interday Reliability and Minimum Difference of Countermovement Jump and Drop Jump Outcomes, Kinetics, Kinematics, and Jump Strategy. Appl. Sci. 2024, 14, 2662. https://doi.org/10.3390/app14062662
González-García J, Conejero M, Gutiérrez-Hellín J. Assessing Jump Performance: Intra- and Interday Reliability and Minimum Difference of Countermovement Jump and Drop Jump Outcomes, Kinetics, Kinematics, and Jump Strategy. Applied Sciences. 2024; 14(6):2662. https://doi.org/10.3390/app14062662
Chicago/Turabian StyleGonzález-García, Jaime, Manuel Conejero, and Jorge Gutiérrez-Hellín. 2024. "Assessing Jump Performance: Intra- and Interday Reliability and Minimum Difference of Countermovement Jump and Drop Jump Outcomes, Kinetics, Kinematics, and Jump Strategy" Applied Sciences 14, no. 6: 2662. https://doi.org/10.3390/app14062662