Article

The Advanced Assessment of Nanoindentation-Based Mechanical Properties of a Refractory MoTaNbWV High-Entropy Alloy: Metallurgical Considerations and Extensive Variable Correlation Analysis

by
Vassiliki Sokoli
1,
Spyros Kamnis
2,3,
Konstantinos Delibasis
3,
Emmanuel Georgatis
1,
Stavros Kiape
1 and
Alexander E. Karantzalis
1,*
1
Department of Materials Science and Engineering, University of Ioannina, 45500 Ioannina, Greece
2
Castolin Eutectic-Monitor Coatings Ltd., Newcastle upon Tyne NE29 8SE, UK
3
Department of Computer Science and Biomedical Informatics, University of Thessaly, 35100 Lamia, Greece
*
Author to whom correspondence should be addressed.
Appl. Sci. 2024, 14(7), 2752; https://doi.org/10.3390/app14072752
Submission received: 29 February 2024 / Revised: 21 March 2024 / Accepted: 21 March 2024 / Published: 25 March 2024
(This article belongs to the Section Mechanical Engineering)

Abstract

:
In the present study, a thorough examination of nanoindentation-based mechanical properties of a refractory MoTaNbVW high-entropy alloy (RHEA) was conducted. Basic mechanical properties, such as the indentation modulus of elasticity, indentation hardness, and indentation-absorbed elastic energy, were assessed by means of different input testing variables, such as the loading speed and indentation depth. The obtained results were discussed in terms of the elasto-plastic behavior of the affected material by the indentation process and material volume. Detailed analysis of the RHEA alloy’s nanoindentation creep behavior was also assessed. The effect of testing parameters such as preset indentation depth, loading speed, and holding—at the creep stage—time were selected for their impact. The results were explained in terms of the availability of mobile dislocations to accommodate creep deformation. Crucial parameters, such as maximum shear stress developed during testing (τmax), critical volume for dislocation nucleation (Vcr), and creep deformation stress exponent n, were taken into consideration to explain the observed behavior. Additionally, in all cases of mechanical property examination and in order to identify those input testing parameters—in case—that have the most severe effect, an extensive statistical analysis was conducted using four different methods, namely ANOVA, correlation matrix analysis, Random Forest analysis, and Partial Dependence Plots. It was observed that in most of the cases, the statistical treatment of the obtained testing data was in agreement with the microstructural and metallurgical observations and postulates.

1. Introduction

(a)
High-Entropy Alloys and Nanoindentation-based mechanical properties
In recent decades, the emergence of high-entropy alloys (HEAs) marked a significant shift in the field of metallic materials, showcasing their potential for a wide range of industrial and structural applications. Originating from a novel strategy that involves blending multiple metallic elements (a minimum of five) in nearly equal proportions (equi-atomic or near equi-atomic ratios), HEAs aim to achieve simple solid solution microstructures. This innovative approach is grounded in the principle of maximizing entropic content [1], steering alloy design beyond traditional metallurgical boundaries, and paving the way for the creation of materials with unparalleled properties, thus broadening the scope of metallic system research. Since their inception, HEAs, including both 3D transition metal and refractory metal variants, have been extensively explored and evaluated for their diverse physical, chemical, and mechanical characteristics [1]. Among these properties, creep resistance stands out as particularly critical for the performance of both traditional and advanced alloys across numerous industrial applications. Consequently, the study of HEAs’ creep behavior has become indispensable. Traditionally, the examination of creep behavior relied heavily on meticulously designed experimental tests, primarily utilizing standard tensile testing equipment, which has been crucial for understanding material performance under extreme conditions. However, the introduction of dynamic indentation techniques for evaluating creep response, among other mechanical attributes, has marked a significant advancement. The benefits of such indentation methods include the simplicity of both the testing process and the required sample size and shape, as well as the reduced duration of experiments. Nonetheless, the complexity of the stress fields induced during indentation necessitates a thorough and accurate analysis of test parameters at both practical and theoretical levels [2,3]. The pioneering systematic study on the creep behavior of various materials via indentation techniques was conducted by Li et al. [4]. They identified two distinct zones beneath the indenter: a hydrostatic pressure zone devoid of plasticity, followed by an elastic–plastic zone where plastic deformation and, consequently, creep phenomena could occur. Li et al. [4] outlined several creep mechanisms, including dislocation glide under high stress in the elastic–plastic region (predominant at lower temperatures), a mixed mode of power law dislocation climb–glide at higher temperatures; a mixed climb–glide mode under conditions of high temperature and stress; and diffusion creep, where stress field differences between zones create chemical potential gradients, facilitating atomic diffusion and material flow. Notably, diffusion creep was highlighted as the mechanism most influenced by external load, although the study did not explore the pre-creep stage’s loading rate impact. Subsequent research by Li et al. [4] and others emphasized the significance of factors such as grain size, applied load–indentation depth, loading rates, and creep holding time in determining material creep response. These factors were integrated into assessment metrics like the Indentation Size Effect (ISE) and the Loading Rate Sensitivity (LRS), as demonstrated in various studies by Zhang et al. [5], Ding et al. [6], Lin et al. [7], Choi et al. [2], and Ma et al. [8,9]. Indentation creep studies on HEAs have predominantly focused on FCC structure HEAs, noting a pronounced sensitivity of creep behavior during the holding stage to loading rate, applied force, penetration depth, and test temperature. These parameters influence the transition between different material flaw mechanisms, such as dislocation glide and climb and self-diffusion, determining the overall creep response [5,9,10,11,12]. Despite the extensive research on FCC HEAs, studies on BCC systems have been relatively limited. For instance, Ma et al. [9] investigated the creep behavior of HEA films with both FCC and BCC structures, uncovering significant differences in creep behavior between the FCC HEA (CoCrFeNiCu) and the BCC alloy (CoCrFeNiCuAl0.25) attributed to the distinct mobility of edge and screw dislocations and the activation volume required for dislocation nucleation between the two crystal structures.
(b)
Analysis of Input Importance on Mechanical Properties Using Various Models
Exploration of the intricate relationship between various inputs and their impact on mechanical properties necessitates a multifaceted analytical approach. Our investigation employs four distinct models—ANOVA [13], Random Forest Regression, [14] Partial Dependence Plots [15] from Artificial Neural Networks (ANNs) [16], and correlation analysis [17]—each chosen for its unique ability to interpret complex data. This integrative strategy not only discusses the rationale behind selecting these models and their implementation but also highlights the specific python libraries utilized, thereby providing a comprehensive view of the dataset’s intricacies.
Utilizing the scipy.stats [18] python library, ANOVA acts as a fundamental statistical tool to compare means across different groups, thereby identifying significant differences that suggest the impact of various input variables on mechanical properties. This method was pivotal for highlighting significant predictors, such as loading speed and creep duration, and understanding their variance on mechanical outcomes. The Random Forest Regression analysis was implemented using the python sklearn.ensemble.RandomForestRegressor [19] class. Random Forest Regression delves into non-linear relationships and variable interactions. By constructing multiple decision trees and assessing feature importance, this model excels in revealing intricate dependencies within the data, thus identifying inputs that significantly affect mechanical properties. Partial Dependence Plots from Artificial Neural Networks (ANNs) were employed using the python sklearn.inspection.plot_partial_dependence [15] library alongside neural networks developed using the keras library (or tensorflow.keras for TensorFlow users [20]). ANNs offer an advanced approach to modeling complex relationships. Partial Dependence Plots provide detailed visualizations of how specific inputs influence mechanical properties, highlighting the sophisticated analytical capabilities of ANNs in capturing non-linear interactions.
Finally, the correlation analysis used the pandas.DataFrame.corr method [21] from the pandas library. Correlation analysis serves as a preliminary step to assess linear relationships between variables. This method is essential for identifying potential predictors, setting the stage for a more detailed investigation with the more complex models mentioned above. The comprehensive analytical strategy adopted via the integration of ANOVA, Random Forest Regression, ANNs, and correlation analysis, supported by specific python libraries, underscores the complex and multifaceted nature of understanding input importance on mechanical properties. By leveraging the unique strengths of each model, a nuanced understanding of how various inputs influence mechanical properties is presented. This holistic approach not only deepens our comprehension of the intricate dependencies within the data but also emphasizes the importance of employing a diverse methodological framework in material science research, ensuring a thorough and insightful exploration of the dataset’s complexities.

2. Experimental Procedure

2.1. Materials and Methods

The preparation of the specimens for the system under study involved several steps. Firstly, elemental powders with a purity exceeding 99.5% were blended to achieve the desired chemical composition. Subsequently, these blends were portioned into approximately 8 g for each specimen. Following this, the specimens were shaped into cylindrical pellets with a diameter of 14 mm using a custom-built hydraulic press at a pressure of 200 bar. The next phase involved melting these pellets into coupons using an arc melting furnace developed in-house. This furnace utilized a tungsten electrode that was not consumed during the process. The operation was performed under a current of 120 A in an argon atmosphere, with titanium getters deployed within the chamber to enhance oxidation resistance. The peak temperature at the arc’s center reached approximately 2500 °C. To ensure uniformity in elemental distribution, the melting procedure was repeated five times for each specimen, conducted on a water-cooled copper mold, resulting in samples with a meniscus-like curvature and a base diameter of about 10 mm.
For microstructural analysis, microhardness testing, and mechanical property evaluation via nanoindentation, all specimens underwent standardized metallographic preparations. This included grinding with silicon carbide (SiC) papers of various grits (120, 400, 600, 800, 1000, and 1200) and polishing with diamond suspensions of 3 and 1 μm.
Dynamic nanoindentation assessments were carried out using a Shimadzu DUH-211S nanoindenter equipped with a standard Berkovich diamond tip provided by Shimadzu Ltd., Kyoto, Japan. Calibration was performed using a fused silica sample, maintaining thermal drift at a negligible 0.05 nm/s to minimize thermal influences on the measurements. Testing parameters included two holding times (10 and 30 s), three loading speeds (13.4, 4.4, and 2.24 mN/s), and three preset depths (1000, 1500, and 2000 nm). The analysis was based on averages and standard deviations calculated from at least ten trials per condition set. This equipment was also employed to measure fundamental mechanical properties such as the indentation modulus of elasticity, indentation hardness, and indentation absorbed elastic energy under varying conditions, as previously described.

2.2. Creep Assessment Calculation Framework

To evaluate the creep response of the system via nanoindentation, the mathematical frameworks referenced in studies [5,12,22,23] were utilized. These frameworks detail the calculations necessary for understanding the system’s behavior under specific conditions.
In a typical nanoindentation experiment using a Berkovitch indenter, the expressed strain rate ( ε ˙ ) and hardness (H) values are determined as follows:
ε ˙ = 1   h   d h d t = h ˙ h
H = P 24.5 h 2
where h ˙ is the rate of change of the indentation depth, and P represents the applied load as a function of time.
In this study, the creep stage was initiated when the indentation depth reached the preset values (1000, 1500, and 2000 nm). Following this, a holding stage of 10 or 30 s at the maximum load (Pmax) was applied. The depth caused by creep during this holding stage is modeled as follows:
h ( t ) c r e e p = a t p + k t
where t represents the holding time, and a, p, and k are the fitting parameters determined experimentally.
The total indentation depth, accounting for both the loading and creep stages, is thus calculated as
h t o t a l = h 0 + a t p + k t
where h 0 is the indentation depth at the start of the creep stage, achieved upon reaching the preset depth.
Following the empirical power law described by Lin et al. [7] and Yu et al. [24], the strain rate ( ε ˙ ) obeys the equation
ε ˙ = A σ n   e x p   ( Q R T )
where A is a constant, n the creep stress exponent, σ the applied stress, and Q the activation energy. Given that these experiments were conducted at room temperature, the exponential factor exp(−Q/RT) is considered a constant, simplifying Equation (5) to
ε ˙ = λ σ n
Taking logarithms on both sides of this equation, we obtain
l n ( ε ˙ ) = l n λ + n l n σ
A similar treatment at the very first equation gives
l n ε ˙ = l n 1 h d h d t
Additionally, the relationship between applied stress σ and hardness H is represented by
σ = kH
where k is a material constant, as proposed by Zhang et al. [5] and Wang et al. [12,23].
Plotting ln( ε ˙ ) against ln(H) allows for the derivation of the creep stress exponent n from the slope and, subsequently, the strain rate sensitivity m, defined as m = 1/n.
To calculate the critical volume for dislocation nucleation ( V c r ), the formulas provided by Ding et al. [6], Ma et al. [9], and Wang et al. [23] are applied, yielding
V c r = k T τ m a x m
where T is the temperature in Kelvin (298 K in this study), m is the strain rate sensitivity, k is the Boltzmann constant, and τmax is the maximum shear stress during the creep stage.
The maximum shear stress ( τ m a x ) is estimated as
τ m a x = H m a x 3 3
where the maximum hardness ( H m a x ) is calculated using the maximum load experienced at the preset indentation depth, according to
H m a x = P m a x 24.5 h 0 2
This comprehensive mathematical approach allows for a detailed analysis of the system’s creep response via nanoindentation, providing valuable insights into the material’s mechanical properties under various loading conditions.

3. Results and Discussion

3.1. Brief Discussion on the System’s Microstructure

Detailed examination of the microstructural features of the examined high-entropy alloy system can be found in the work of Poulia et al. [25]. Briefly, the alloy consists of a single-phase BCC solid solution, as revealed by the associated XRD analysis [25]. Morphologically, the microstructure demonstrates almost equiaxed grains of size lying within the range of 50–100 μm. SEM–EDX analysis demonstrates a uniform elemental distribution throughout the alloy’s microstructure.

3.2. Nanoindentation-Based Basic Mechanical Property Assessment

3.2.1. Obtained Data and Metallurgical–Microstructural Evaluation

Table 1 summarizes the results concerning the calculation of the standard mechanical properties, i.e., hardness (HV), modulus of elasticity (Eit), and the energy absorbed in the elastic area over the overall absorbed energy (nit). It must be mentioned that the values in Table 1 are given directly by the software of the nanoindentation apparatus and are based on the approach of Oliver–Pharr [26,27]. It must be mentioned that in Table 1, the designation input and outcome variables are reported, which is important for the correlation analysis that is demonstrated in the following paragraphs.
Graphical representations of Table 1 data are presented in Figure 1, Figure 2 and Figure 3. More specifically, Figure 1 shows the effect of the preset depth and the loading speed on the indentation hardness Hit, Figure 2 shows the corresponding effect on the indentation modulus of elasticity Eit, and Figure 3 presents the effects on the absorbed elastic energy nit.
Based on the data of Table 1 and Figure 1, Figure 2 and Figure 3, the following points are addressed:
(a)
The indentation hardness values lie within a broad range of roughly 800–1000 HV and are, in general, in good agreement with other experimental efforts dealing with this refractory high-entropy alloy [25]. The two different input parameters, i.e., preset depth and loading speed, seem to have, in general, the opposite effect: the higher the preset depth, the lower the hardness values, whereas the lower the loading speed, the higher the hardness. Concerning the effect of the preset depth, the observed trend is expected since (a) according to the Oliver–Pharr approach [26,27], the contribution of the load P and the indentation depth h in calculating the hardness is not analogous (hardness is a function of P/h2), and as such, as the indentation depth increases, the hardness values decrease; (b) furthermore, if we recall that hardness is practically the resistance to plastic deformation, the observed trend shows that at higher indentation depths, the plastic deformation can be expressed more easily. This is attributed to the fact that at higher indentation depths, the affected material volume underneath the indenter increases, which implies that the number of dislocations to accommodate the plastic deformation increases, which, in this way, increases the capability for the plastic flow to be expressed. The effect of the loading speed, as already stated, is, in general, the opposite. Hardness values decrease as the loading speed increases. It must be mentioned, however, that the effect of the loading speed is not as severe as the effect of the indentation depth. The trend concerning the effect of the loading speed is also associated with the availability for plastic deformation dislocations. As the loading speed increases, the rate of dislocation generation increases, ensuring that there are enough dislocations to contribute to the plastic flow of the alloy. The effect is more profound at lower indentation depths and seems to fade as the indentation depths increase. This is attributed to the fact that the affected material volume where dislocations can generate increases, and this increase gradually compensates for the restriction of dislocations at the lower depths.
(b)
The analysis of the indentation modulus of elasticity (Eit) presents a nuanced picture, particularly when considering the effect of preset depth. Identifying a clear trend in Eit values in relation to preset depth proves challenging. However, an observable influence is noted with changes in loading speed; a decrease in loading speed generally leads to a reduction in Eit, an effect that becomes more pronounced at preset depths of 1500 and 2000 nm. Several critical factors contribute to this behavior. Firstly, Eit and elasticity (E), more broadly, are intrinsically linked to the elastic strain field within the lattice and the bond energy among atoms. This fundamental relationship underscores the mechanical response of materials under indentation. Secondly, the concept of Local Chemical Order (LCO), as discussed in studies [28,29,30,31,32], highlights the degree of atomic ordering within alloys. Li et al. [28] illustrate that alloys, when subjected to high heat treatment temperatures, tend to resemble a fully disordered solid solution characterized by a random atomic distribution within the lattice. This state is associated with high configurational entropy and minimal ordering. In contrast, at lower temperatures or in the as-cast condition, there is invariably some presence of LCO, leading to the regional formation of ordered atomic clusters. Such conditions lower configurational entropy and elevate LCO values. The manifestation of LCO, where atomic movement and organization into ordered clusters occur, serves to alleviate the elastic strain energy in highly disordered structures, consequently reducing elastic moduli. Thirdly, the impact of LCO extends beyond temperature influences, encompassing potential stress fields induced during mechanical loading. For instance, Kang et al. [10] observed in their nanoindentation study of a CoCrFeMnNi high-entropy alloy that a stress gradient between dislocations and the bulk material promotes the segregation of elements from the distorted lattice to dislocation lines. This process aims to mitigate the intense lattice stress field and foster the formation of thermodynamically stable atomic clusters driven by enthalpy of formation. Notably, the propensity for atomic migration, leading to enhanced LCO, is greater when dislocations show low mobility or are stationary. Considering these insights, it is logical to deduce that at reduced loading speeds, the diminished mobility of dislocations augments atomic movement and LCO formation. Consequently, this results in a more effectively relieved lattice stress field, reflected in decreased Eit values.
(c)
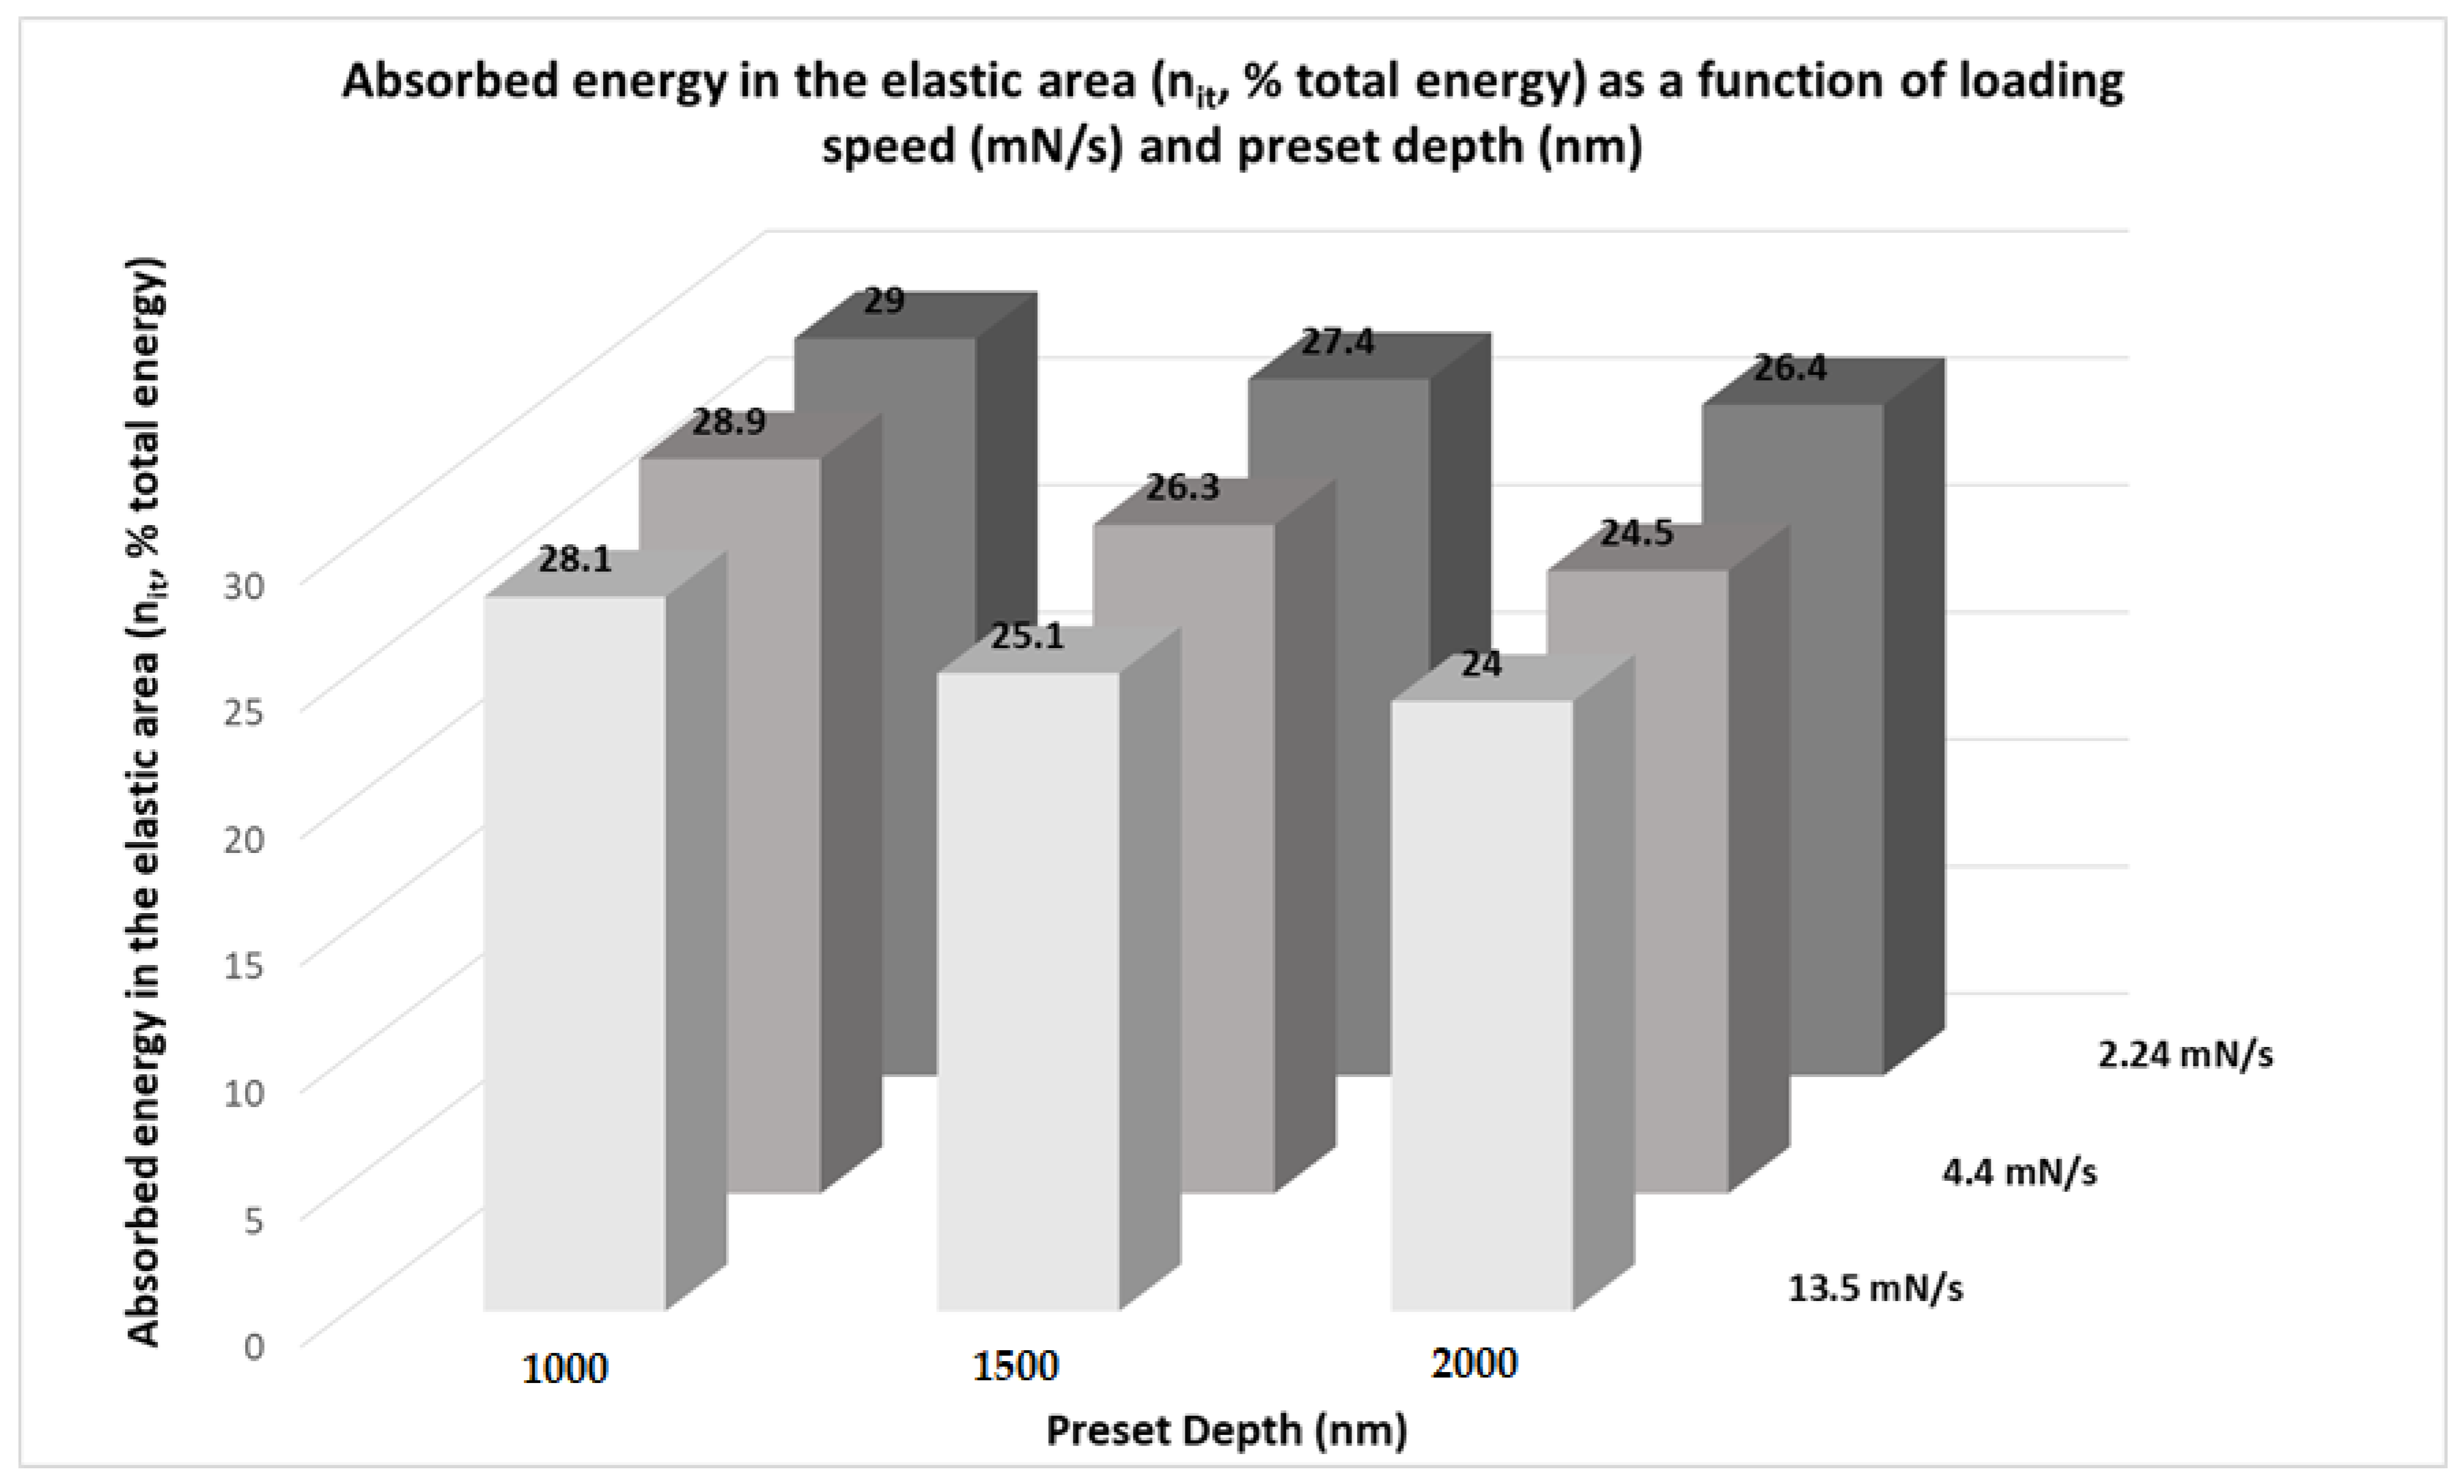
Regarding the nit factor, which denotes the ratio of energy observed in the elastic region to the total absorbed energy, it exhibits trends analogous to hardness as detailed in study [33]. This parallel suggests a consistent relationship between the material’s hardness and its ability to absorb and release energy during indentation, highlighting the nit factor as a crucial parameter for understanding material behavior under mechanical stress.

3.2.2. Statistical Analysis

In order to further examine the significance of the loading speed and the preset depth on the basic mechanical properties measured in the present effort, four different techniques were adopted to ascertain the strength of each input parameter and their impact on the resulting values.
Method 1: Correlation Matrix Analysis
The correlation matrix visualizes the linear correlation coefficients between various inputs and outputs. In the matrix, the color intensity and the sign of the values indicate the strength and direction of the linear relationship between variables. Red shades represent positive correlations, and blue shades represent negative correlations. The closer the value is to 1 or −1, the stronger the positive or negative linear relationship, respectively. Graphical representation of the correlation matrix is shown in Figure 4.
Based on the image analysis, the most significant correlations identified are as follows: The correlation between the input initial indentation depth (nm) and the output hardness value (Hit) is marked by a correlation coefficient of −0.90, indicating a strong negative correlation. This suggests that an increase in indentation depth leads to a significant decrease in the hardness value. Similarly, the initial indentation depth and the nit percentage show a strong negative correlation with a coefficient of −0.86, meaning that a deeper indentation correlates with a lower nIt percentage. Conversely, the input loading speed (mN/s) and the output modulus of elasticity (EIt, in GPa) have a positive correlation coefficient of 0.67, implying that higher loading speeds result in increased EIt values. There is also a strong positive correlation between the output hardness value (HV) and the nit percentage, with a correlation coefficient of 0.78, indicating that these outputs tend to increase or decrease in tandem. However, the correlation between output EIt (GPa) and output nIt (%) is moderately negative, with a coefficient of −0.50, suggesting that an increase in EIt is associated with a decrease in nit, or vice versa. The matrix also displays weaker correlations, as denoted by coefficients closer to zero, highlighting less significant linear relationships. While these correlations offer insights into the dataset’s linear relationships, it is crucial to remember that correlation does not equate to causation. Non-linear relationships might not be adequately represented by these coefficients. For a thorough understanding of the variables’ inter-relations, further analyses, including causation analysis and non-linear modeling, might be required. Despite the need for cautious interpretation of correlation analysis outcomes, these results confirm earlier speculations regarding the impact of indentation depth on hardness values and the effect of loading speed on the modulus of elasticity.
Method 2: Random Forest Analysis
In the Random Forest analysis, Figure 5 showcases bar charts that depict the relative significance of each input feature toward predicting the output variables. Feature importance scores are assigned to indicate the utility and value of each feature within the model’s construction. A higher score denotes greater importance, offering insights into the model’s decision-making mechanisms.
Observations from Figure 5 reveal that for the output variable HV (hardness value), the “Input Initial Indentation Depth” emerges as a crucial predictor, boasting a very high importance score. This underscores its primary role in determining the hardness value. On the other hand, the “Input Loading Speed” holds a considerably lower importance score, suggesting its subordinate influence on the hardness value compared to indentation depth. Regarding the output variable Eit (elastic indentation), a similar pattern is observed. The “Input Initial Indentation Depth” stands out as the most influential feature, asserting its significance in the model’s predictions. Although the “Input Loading Speed” ranks lower in importance, it still plays a role in forecasting elastic indentation. For the output variable nit (strain rate sensitivity factor), the importance scores are more evenly distributed between the “Input Initial Indentation Depth” and the “Input Loading Speed”, with the former maintaining a slight lead. This indicates that both features are considered relevant by the model in predicting the strain rate sensitivity factor, with indentation depth being a tad more predictive. Conclusively, the “Input Initial Indentation Depth” is identified as the consistently dominant feature across all output variables, suggesting that variations in indentation depth are likely to exert a more significant impact on the modeled material properties than changes in loading speed. Nevertheless, the contribution of the “Input Loading Speed” to the prediction process, while lesser, is still deemed valuable.
Method 3: ANOVA Analysis
The ANOVA analysis results, organized into Table 2, shed light on the influence of input features such as loading speed and indentation depth on various output variables, specifically focusing on their F-values, p-values, and statistical significance at a 0.05 significance level. This analysis offers insights into how these input features affect Output Eit (GPa), Output HV, and Output nit (%).
From Table 2, it is clear that indentation depth significantly influences Output HV and Output nit (%), as demonstrated by statistically significant p-values. In contrast, Output Eit (GPa) shows no significant impact from either loading speed or indentation depth. Additionally, loading speed consistently emerges as a non-significant predictor across all output variables, as evidenced by uniformly high p-values. Delving deeper into the specifics from Table 2, the analysis highlights that the Indentation Depth Category has a profound impact on Output HV, with an F-value of 15.44 and a p-value of 0.004, indicating a statistically significant difference in hardness values across different indentation depths. However, when examining Output HV’s relationship with the loading speed category, the analysis shows an F-value of 0.048 and a p-value of 0.953, suggesting no significant variance in hardness values across loading speeds. For Output Eit (elastic indentation) in relation to Indentation Depth Category, the high p-value of 0.769 alongside an F-value of 0.275 indicates that indentation depth does not significantly influence elastic indentation values. Meanwhile, the relationship between Output Eit and loading speed category, with a slightly elevated F-value of 3.306 and a p-value of 0.108, points to a non-significant but potentially noteworthy trend that could benefit from further exploration. The significance of indentation depth is further underscored in its relationship with Output nit (%), where an F-value of 10.00 and a p-value of 0.012 reveal a statistically significant difference in strain rate sensitivity across different indentation depths. Conversely, the comparison of Output nit with loading speed category yields an F-value of 0.708 and a p-value of 0.530, indicating no significant effect of loading speed on strain rate sensitivity. In essence, the ANOVA results underline the paramount importance of indentation depth in affecting Output HV and Output nit (%)while suggesting that Output Eit (GPa) may not be significantly influenced by the examined input features. Despite some input features, like indentation depth, displaying a marked impact on certain outputs, others, such as loading speed, appear to have a minimal influence. The consistently high p-values associated with loading speed point to its limited effect on the outputs tested. It is important to note that ANOVA helps in identifying the presence of significant differences but does not detail which groups differ or describe the nature of these differences, necessitating further analysis for a comprehensive understanding.
Method 4: Partial Dependence Plots
The Partial Dependence Plots (PDPs) displayed in Figure 6 visualize the impact of input features on output features within a fitted regressor model, arranged such that each row represents a different output feature, and two columns correspond to the PDPs for “Input Initial Indentation Depth (nm)” and “Input Loading Speed (mN/s)”, respectively.
From these plots, several relationships between input features and output features emerge. For the “Input Initial Indentation Depth (nm)”, the plots reveal a decreasing trend in hardness value (HV) with increasing indentation depth, suggesting that deeper indentations may lead to lower hardness values. The elastic indentation (Eit) also shows a decreasing trend with increased indentation depth, implying a reduction in the material’s elastic response with deeper indentations. Conversely, the strain rate sensitivity factor (nit %) exhibits a fluctuating yet overall increasing trend with increased indentation depth, indicating higher nit (%) at deeper indentations, possibly due to enhanced plastic deformation effects.
Regarding the “Input Loading Speed (mN/s)”, the dependence plots indicate a positive relationship between loading speed and hardness value (HV), where an increase in loading speed leads to an increase in HV. This relationship could stem from the material’s rate-dependent deformation characteristics. Similarly, the elastic modulus (Eit) appears to increase with the loading speed, suggesting higher elastic modulus values at higher speeds, possibly due to rate-dependent elasticity. The nit (%) shows a less definitive, although slightly positive, trend with the increased loading speed, hinting at a subtle dependence of plastic deformation characteristics on the rate of loading.
Summarizing the insights from PDPs, indentation depth significantly affects all three output parameters, highlighting that deeper indentations generally result in decreased hardness and elastic modulus, while nit (%) tends to increase. Loading speed also significantly impacts the outputs, with both hardness and elastic modulus increasing with higher loading speeds, although its effect on nit (%) is less pronounced but slightly positive.
These observations underline a complex interaction between loading speed and indentation depth on the material’s mechanical properties, including hardness, elastic modulus, and strain rate sensitivity. The PDPs provide a nuanced understanding of how variations in loading conditions and indentation depths influence the mechanical behavior of materials, reflecting the intricate dynamics between the rate of loading and depth of indentation on material properties.
In synthesizing the insights from correlation analysis, Random Forest Feature Importance, ANOVA, and Partial Dependence Plots, a detailed examination of each input-output relationship helps to identify consensus or divergence across these analytical methods:
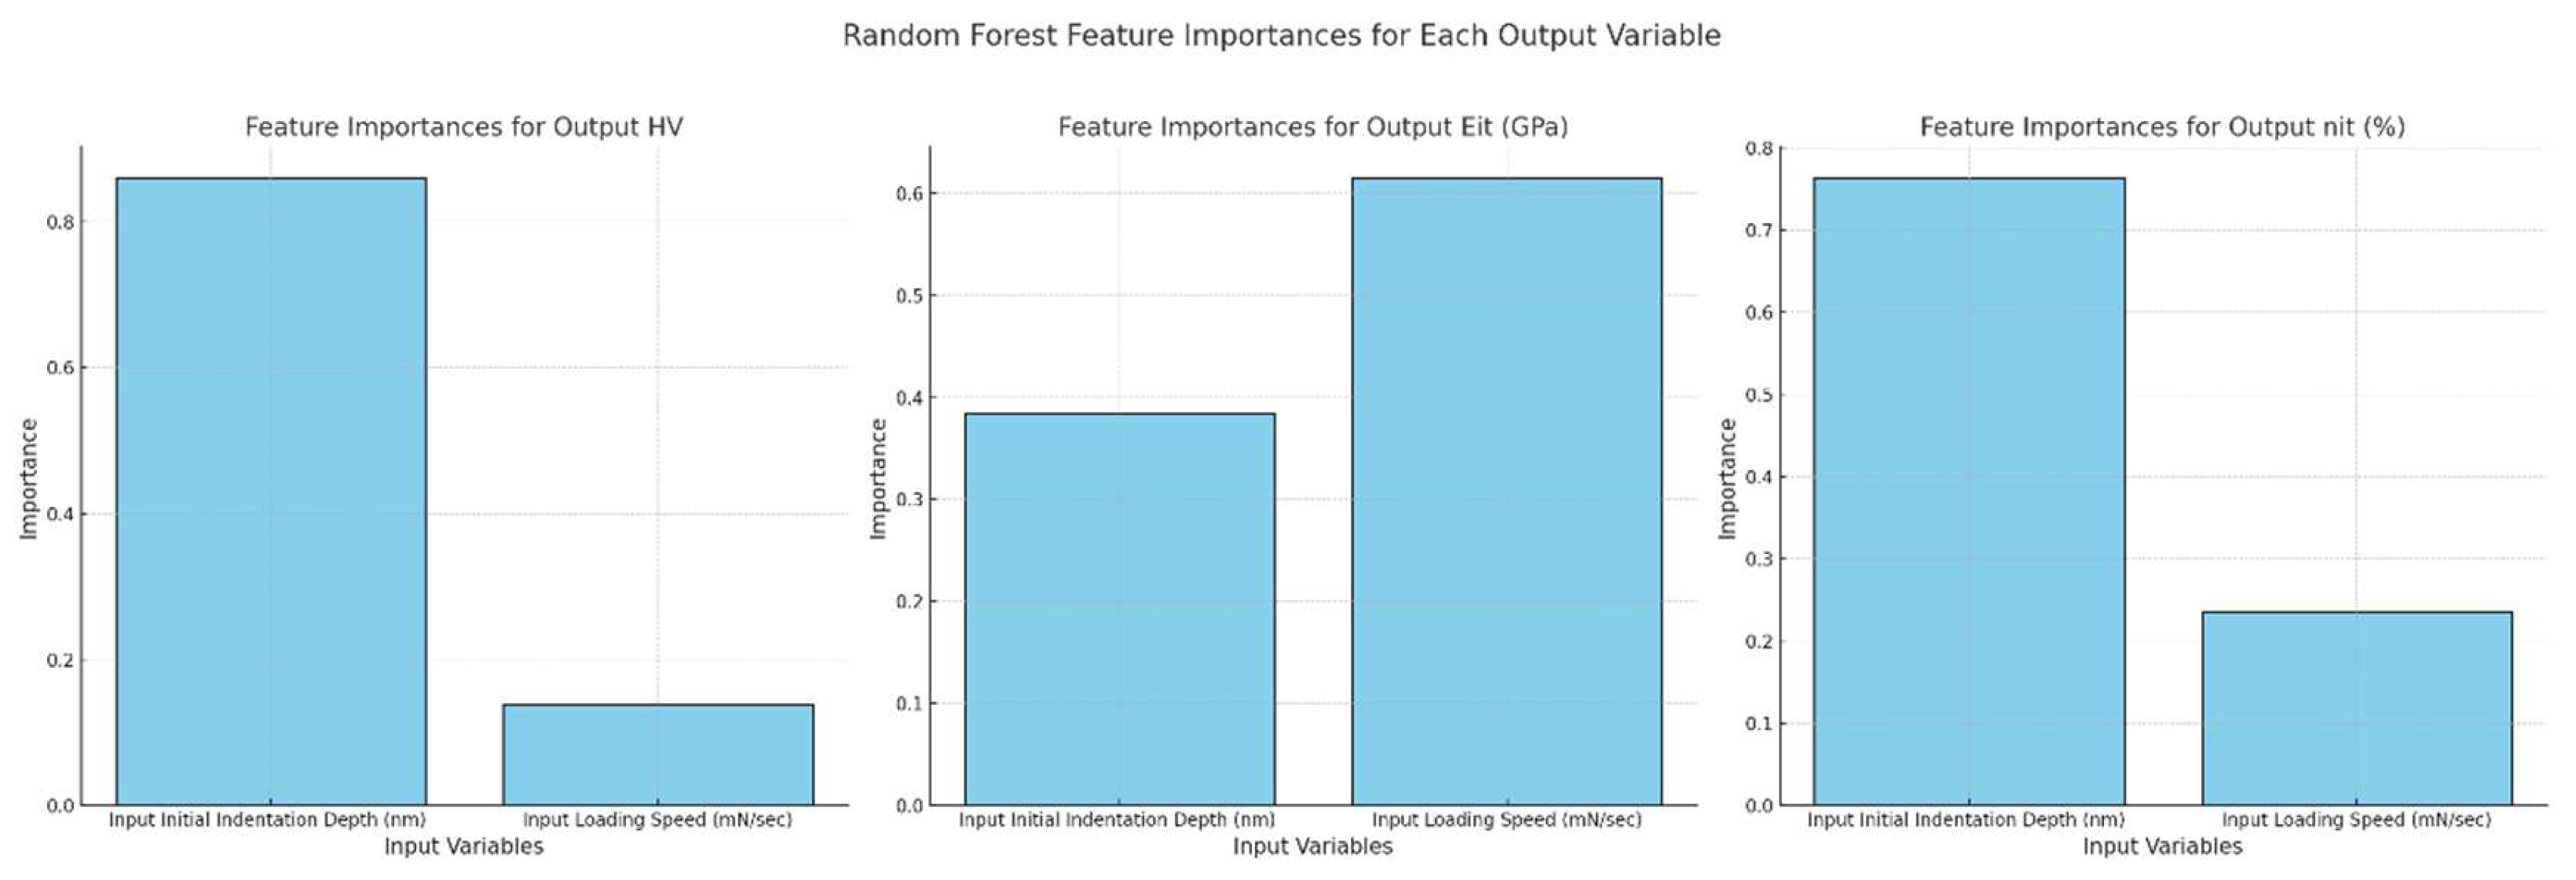
  • For the relationship between Input Initial Indentation Depth and Output HV (hardness value), correlation analysis reveals a strong negative correlation of −0.90, while Random Forest analysis assigns a high importance score to indentation depth. ANOVA underscores this with a statistically significant effect, and Partial Dependence Plots illustrate a decreasing trend in HV as indentation depth increases. The unified conclusion from all methods is that indentation depth significantly and negatively impacts hardness value, indicating lower hardness at greater indentation depths.
  • Regarding Input Initial Indentation Depth and Output nIt (%), there is a strong negative correlation of −0.86 from correlation analysis and a high importance score from Random Forest, slightly lower than that for HV. ANOVA shows a statistically significant effect, whereas Partial Dependence Plots suggest an increasing trend in nIt (%) with deeper indentations. Despite the negative correlation, the increasing trend in nIt (%) indicated by PDPs points to a potential increase in nIt (%) with indentation depth, highlighting possible non-linear relationships not captured by the correlation coefficient.
  • In the case of Input Loading Speed and Output EIt (GPa), correlation analysis shows a moderate positive correlation of 0.67. Random Forest assigns a lower importance score to loading speed compared to indentation depth, and ANOVA does not find a statistically significant effect. However, Partial Dependence Plots depict an increasing trend in EIt with higher loading speeds. This suggests a generally positive effect of loading speed on EIt, although the lack of statistical significance in ANOVA indicates a potentially weaker or more complex relationship.
  • For the correlation between Output HV and Output nIt (%), a strong positive correlation of 0.78 suggests that these outputs tend to increase or decrease in tandem, hinting at an underlying material property that influences both. Lastly, the moderate negative correlation of −0.50 between Output EIt (GPa) and Output nIt (%) suggests an inverse relationship, possibly reflecting different material responses under elastic and plastic deformations.
In summary, indentation depth emerges as a pivotal factor influencing both HV and nIt, corroborated by all analytical methods, with deeper indentations associated with lower hardness and possibly higher nIt. The impact of loading speed on material properties like EIt and HV is less definitive; while PDPs and correlation analyses suggest a positive influence, ANOVA’s lack of statistical significance and its reduced feature importance in Random Forest highlight a more nuanced effect. The observed discrepancies, particularly in the analysis of nIt (%), underscore the presence of non-linear relationships that correlation coefficients alone cannot fully capture. Additionally, the inter-relations between different output variables suggest complex dependencies in material responses under varied conditions, emphasizing the intricate dynamics of mechanical behavior in materials science.

3.3. Creep Assessment

Before any attempt to assess the creep behavior of the system, it is crucial to observe the loading stage before the actual creep interval. Figure 7a–f shows the loading stage at preset depth 1000 nm for different experimental conditions (loading speed and creep holding time), Figure 8a–f shows similar results at preset depth, and Figure 9a–f presents the results for preset depth 2000 nm.
What is evident from these diagrams is that, especially in the case of preset depth 1000 nm (Figure 7), the curves do not appear entirely smooth, but they indicate the presence of the characteristic feature called “serrations”. Serrations during the loading stage are a characteristic indication of micro-creep phenomena occurring during this stage [12,33]. If serrations are expressed, part of the creep deformation occurs during the loading stage, an event that prevents the overall creep deformation from being expressed during the net creep stage [12,33]. In the present effort, the presence of serrations is mostly observed in the case of a preset depth of 1000 nm (Figure 7), whereas the phenomenon seems to fade at a higher preset depth. Some traces of serrations can be recognized, such as in the case of the preset depth 1500 nm (Figure 8). In the case of preset depth 2000 nm (Figure 9), the loading curves are, in general, smooth with no significant presence of serrations, i.e., no micro-creep deformation takes place prior to the actual creep deformation step. One final observation that must be mentioned is the fact that serrations, if present, are found in most of the cases associated with the lower loading speeds. This observation is in agreement with other experimental efforts [5,6,7,8,9,10,11,22], according to which the most important factor influencing the formation of serrations is the strain rate. Various research efforts have shown that high strain rates during the loading stage result in the absence of serrations, i.e., lack of creep deformation during loading [5,6,7,8,9,10,11]. On the contrary, low strain rates usually lead to serration formation and creep deformation [5,6,7,8,9,10,11]. The reason for this behavior is that at high strain rates, the dislocation generation is also high, yet the applied stress is not adequate enough to activate a slip plane in order for a dislocation to move. Multiple slip planes have to be activated for dislocation movement to commence. However, the high strain rate does not provide adequate time for this activation. In simple words, at high strain rates, dislocations can multiply but not move. In this case, the loading stage curve appears quite smooth [5]. Furthermore, when no creep deformation is observed in the loading stage, the system will express its creep potential during the holding stage.

3.3.1. Creep Behaviour Assessment—Metallurgical Approach

Prior to the application frame, a typical creep depth, as a function of the holding time diagram, can be seen in Figure 10a. After the application of the calculation frame on the curves of the type of Figure 10a, the diagrams l n 1 h d h d t as a function of l n H can be constructed (Figure 10b), based on which the stress exponent n and the stress sensitivity factor m can be calculated. Table 3 summarizes all the crucial parameters that are the outcome of the application of the calculation frame, and which are important for analyzing the creep response of the system at the different testing parameters.
Based on the data in Table 3, a series of diagrams can be produced in order to assist both the visualization of the obtained results and the analysis of the creep response. As such, Figure 11 presents the effect of the different testing parameters on the net creep (hcreep) depth. Figure 12 shows a similar analysis of the maximum shear stress (τmax).
Figure 13 shows the effect of the different testing parameters on the stress exponent n, and Figure 14 shows the effect of the same parameters on the critical volume for dislocation nucleation.
Based on the information provided by Table 3 and Figure 11, Figure 12, Figure 13 and Figure 14, the following points can be addressed:
(1)
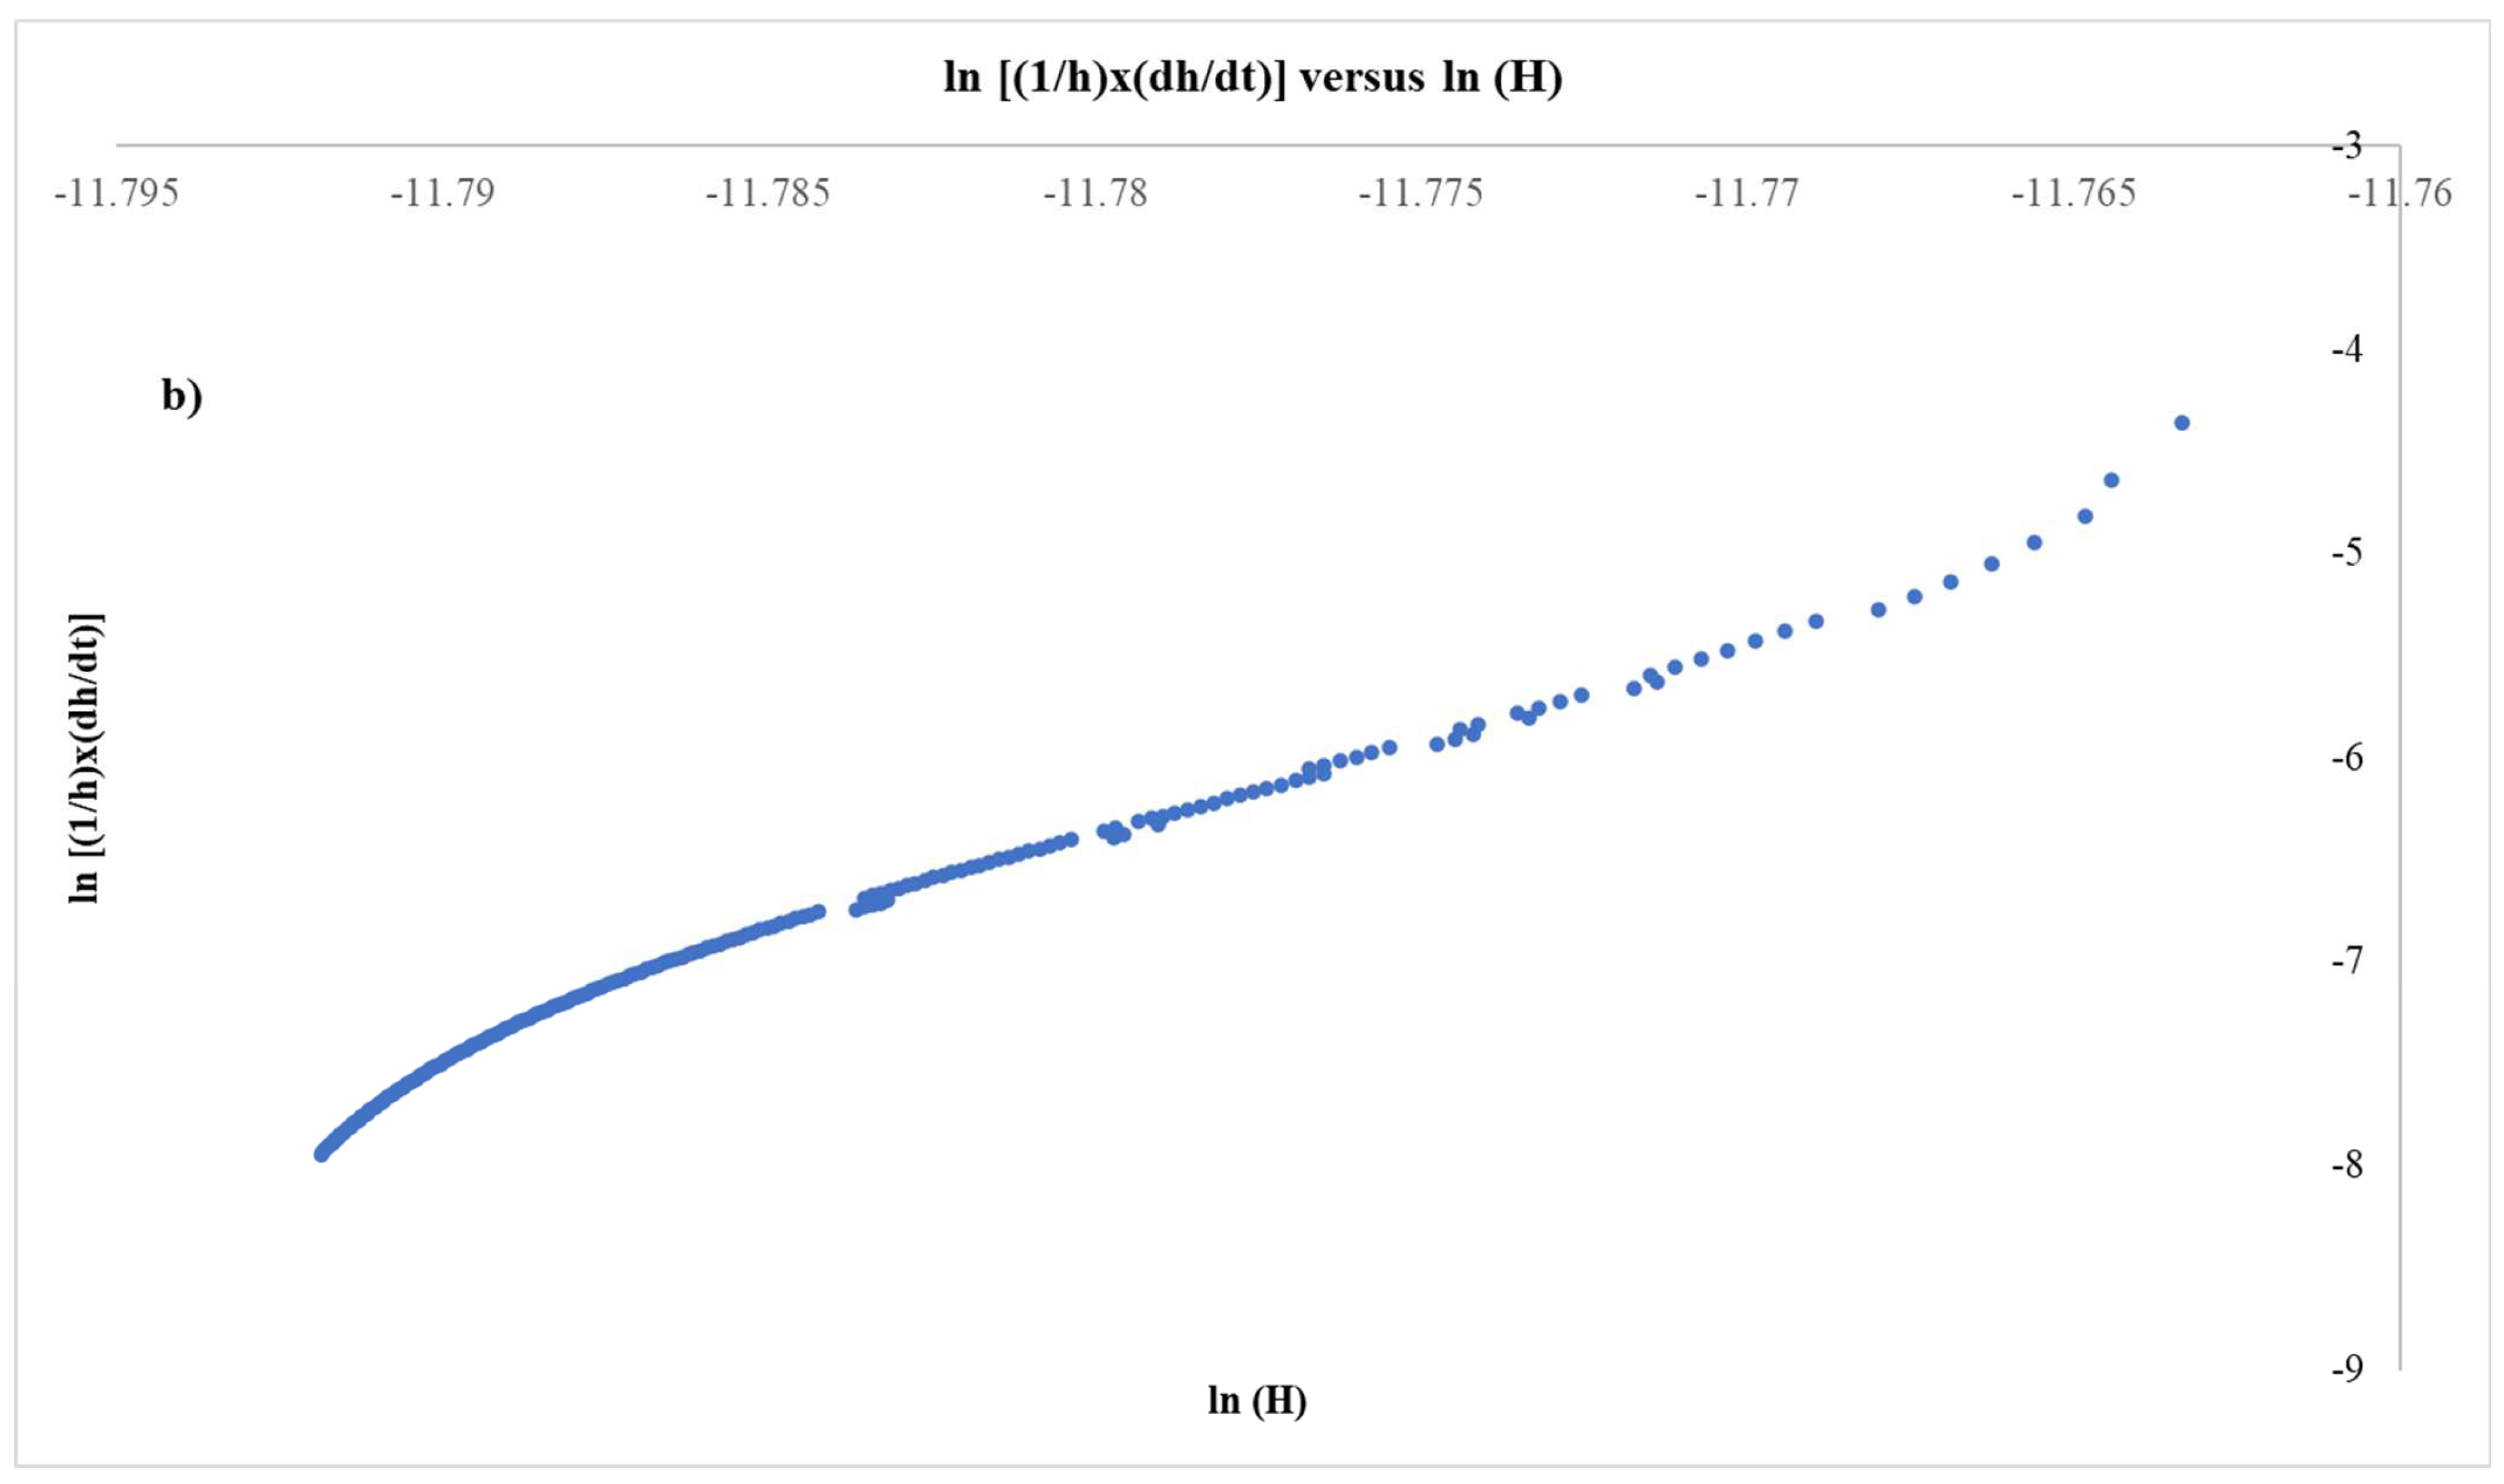
Figure 10a presents a typical indentation displacement (Δh) vs. time (t) curve for the holding stage (creep stage) along with the typical correlation parameters. These correlation parameters were obtained by applying a power law fitting. This observation is very important. It has been proposed by many researchers that a power law fitting of the creep displacement as a function of the holding time suggests a dislocation-driven creep deformation and, more specifically, a dislocation glide mode [2,5,9,11,12,34]. Despite the fact that Li et al. [4], in their early work, pointed out that a power law creep behavior is mainly associated with dislocation climb and/or dislocation climb–glide mixed mode at intermediate to high temperatures, in their concluding remarks, they admit that at low temperatures, dislocation glide-induced plasticity must be the predominant mechanism due to the high stresses being developed within the elastic–plastic zone. As such, in the present effort, since a power law of extremely good fitting was observed, dislocation glide is considered the main creep deformation mechanism.
(2)
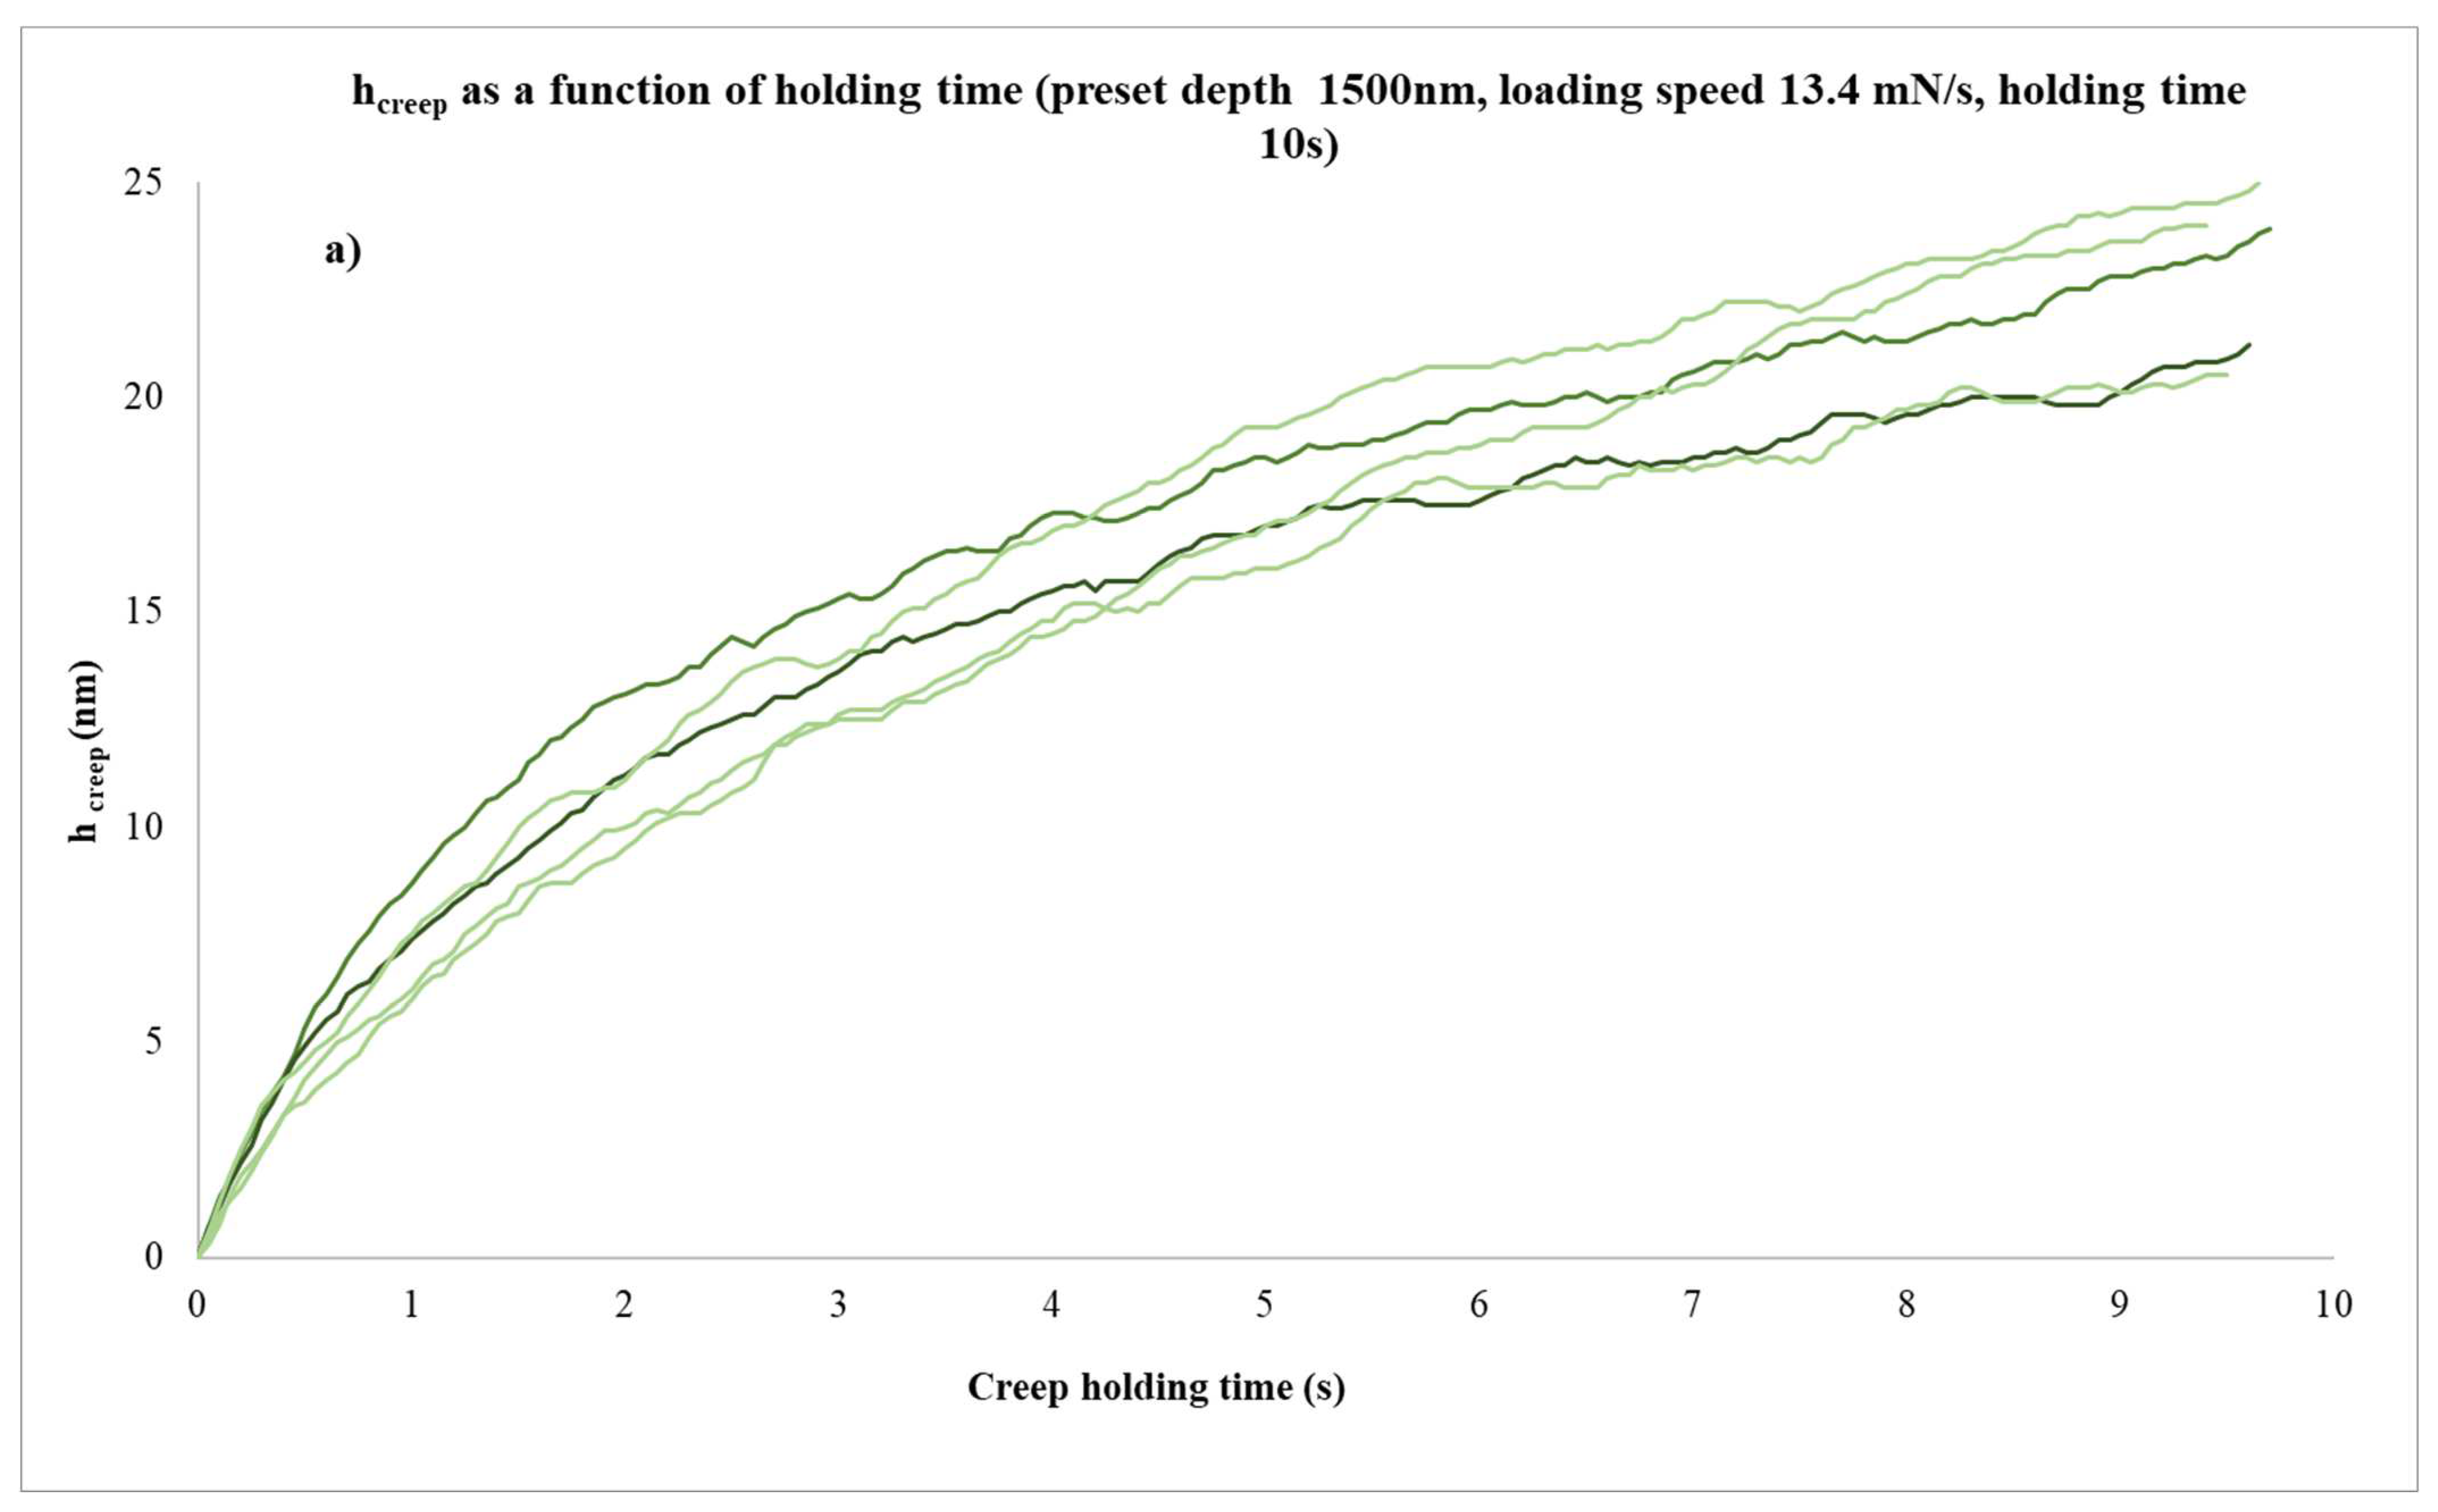
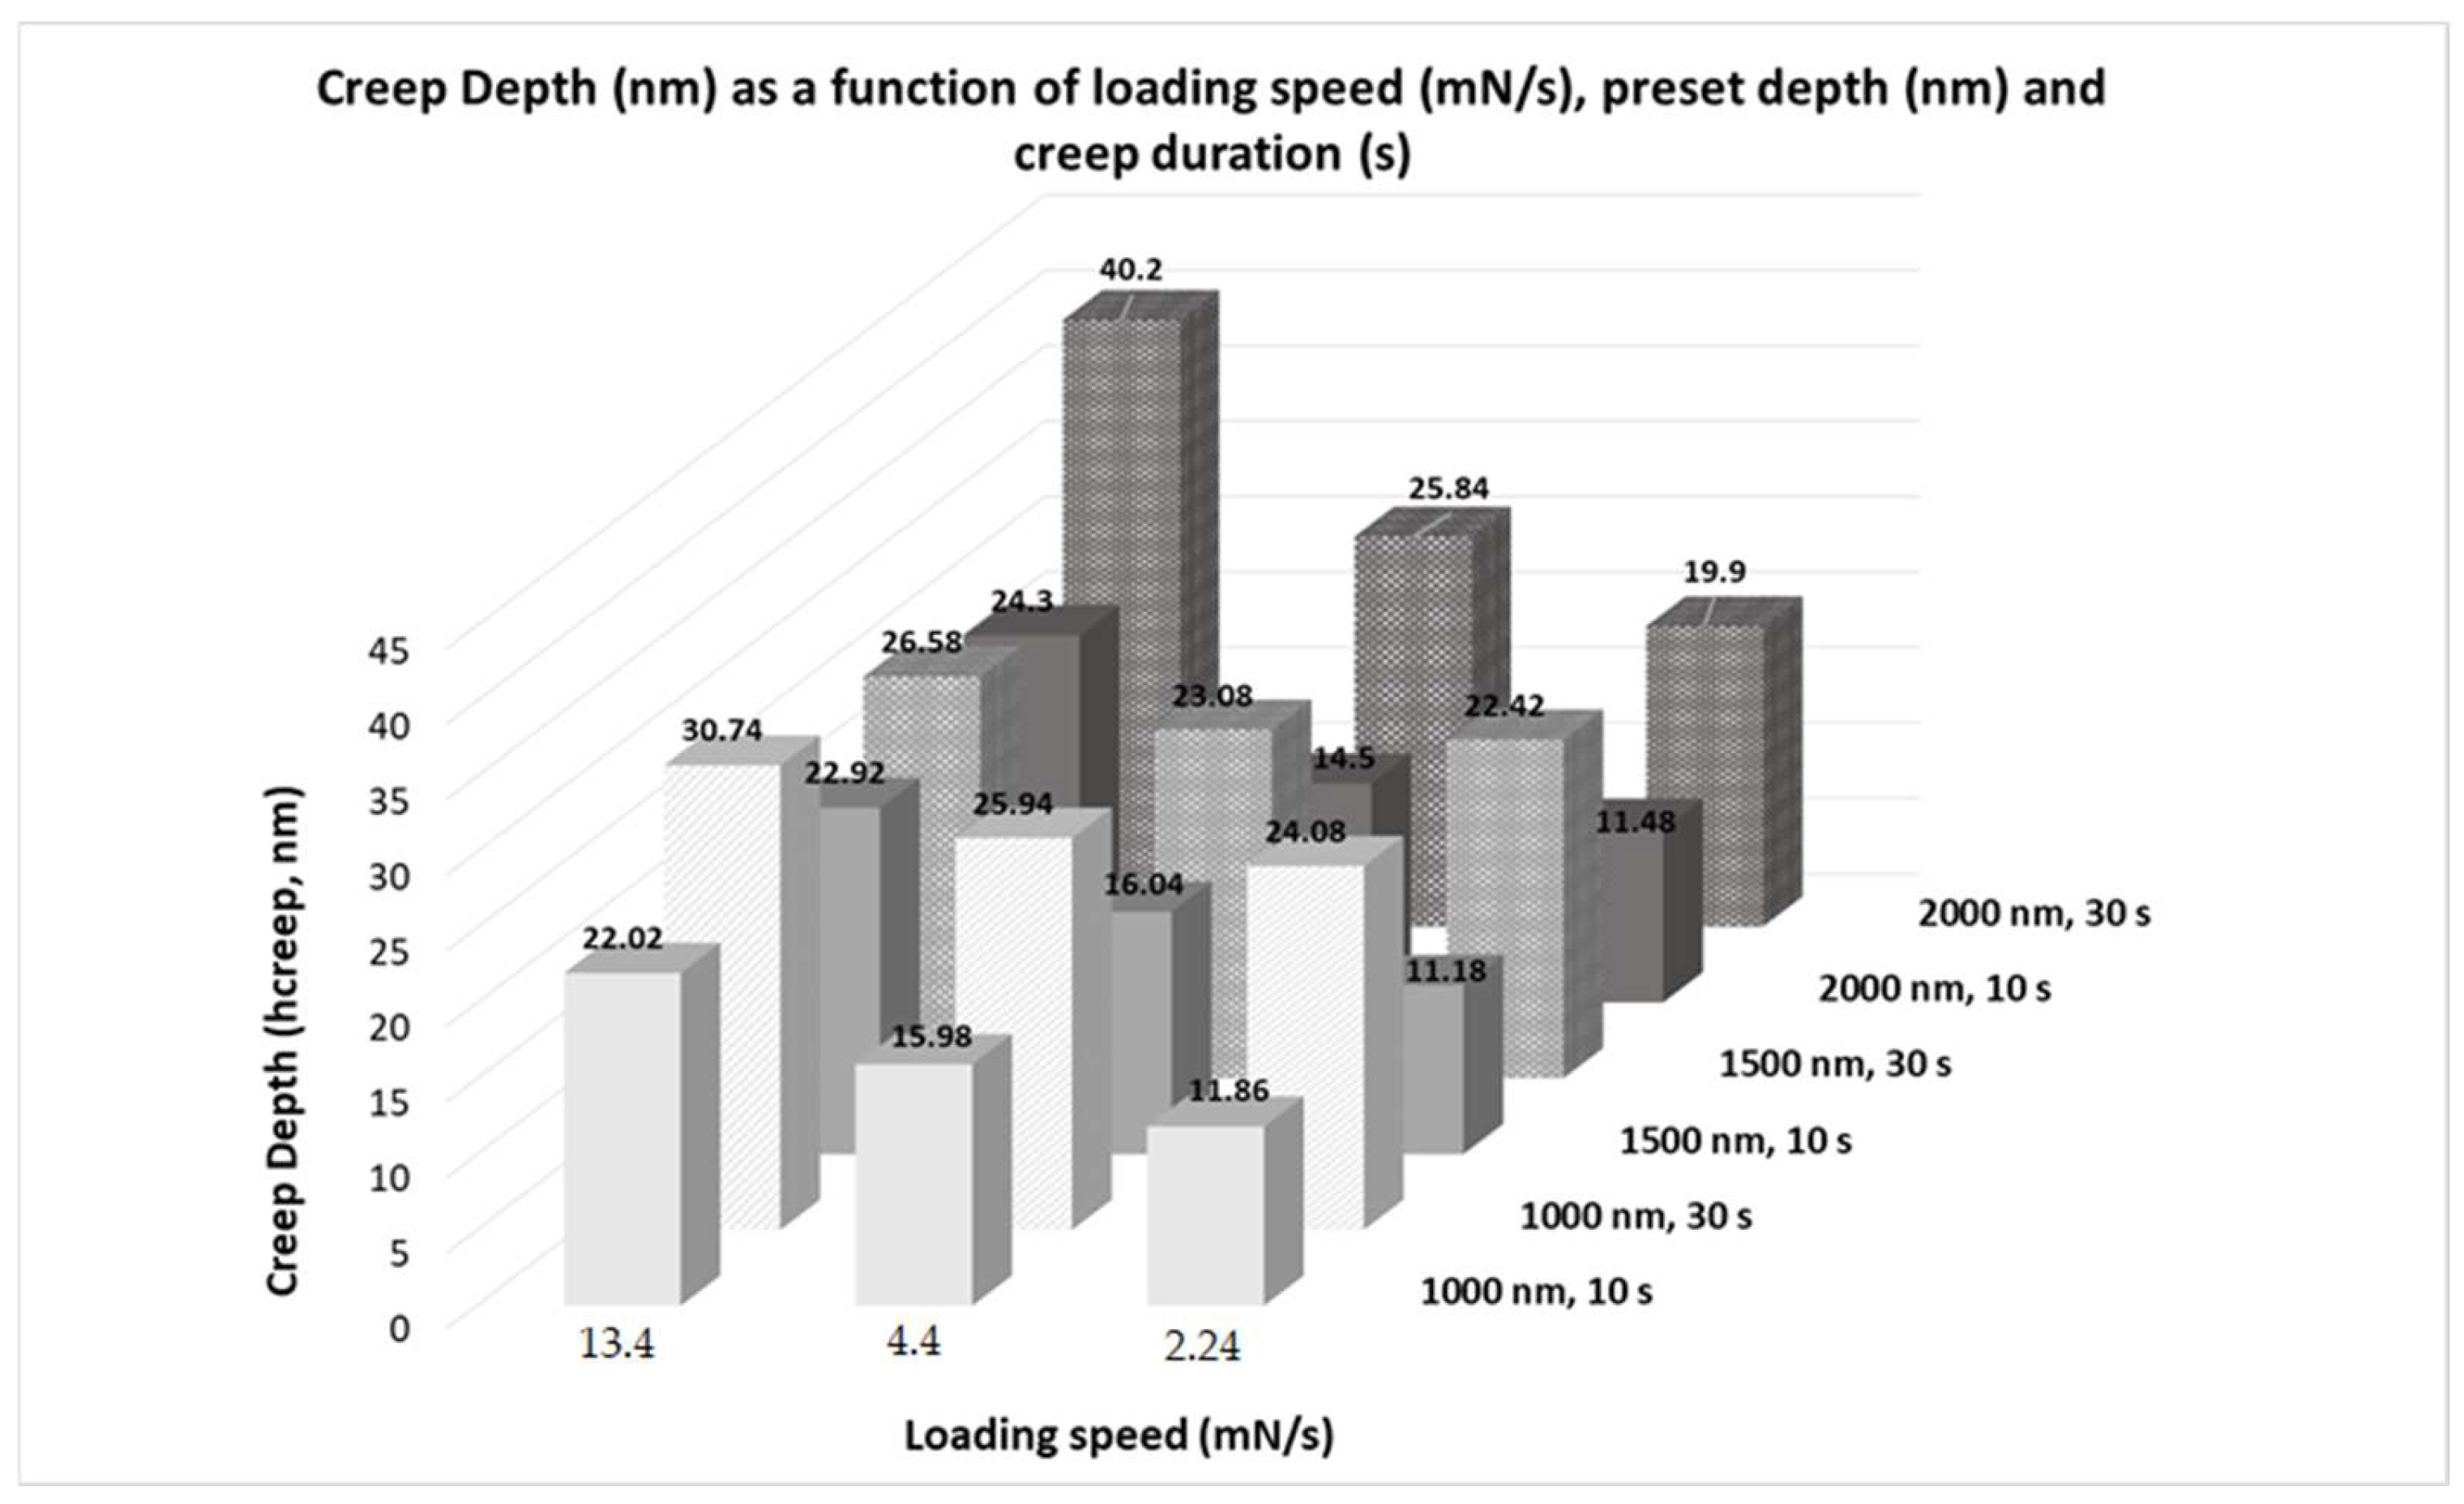
Net Creep deformation (hcreep): The first important observation is the fact that, irrespective of the testing conditions, creep deformation increases as the creep period increases. This is expected since the more prolonged the time, the more time for the available dislocations to move and provide plastic flaws, i.e., plastic deformation. Similar observations can also be found in other experimental efforts [8,9,22].
The second important outcome is the fact that the higher the preset depth, the higher the creep deformation, which is particularly profound during the prolonged creep stage (30 s). On the contrary, for the short creep duration (10 s), it can be seen from Table 3 and Figure 11 that there is no significant alteration in creep deformation for a given loading speed. The answer behind this behavior is based on the type of the relation, hcreep versus time. As previously mentioned, the fitting parameters used to show an exceptional correlation suggest the presence of a power law creep, which is mostly associated with dislocation glide mechanisms [2,4,5,9,11,12,34]. During this mode of deformation, creep displacement is significantly high at the initial periods of the creep stage and gradually reduces. As such, during the first 10 s, the highest proportion of the overall creep deformation is obtained, which seems to be a common behavior for all the different preset depths. For the more prolonged creep duration, however (30 s), the situation is altered and, as already stated, the preset depth seems to affect the net creep displacement. In this case, the parameter that is activated is the volume underneath the indenter that is plastically deformed. According to Li [4], the higher the indentation depth, the more expanded this plastically deformed zone. Since this zone is expanded and in conjunction with the fact that the time is considerably increased, the mobile dislocations within this zone, can move more extensively to provide plastic deformation. Karantzalis et al. [22] and [2,5,9,11,12,34] also reported similar observations concerning the effect of the preset depth.
The third point to be discussed is the effect of the loading speed at the loading stage prior to the net creep stage. It can be seen from Table 3 that as the loading speed decreases, the creep deformation decreases. This behaviour is most likely (a) associated with the number of dislocations being generated at the loading stage. At low loading speeds (i.e., low strain rate), the rate of dislocation generation is reduced, a fact that has a direct impact on the number of available mobile dislocations that could accommodate the plastic deformation; (b) the expression of micro-creep phenomena prior to the net creep stage. If we recall the loading stage presented in Figure 7, Figure 8 and Figure 9, it was observed that at low preset depths and lower loading speeds, the presence of serrations was traced. Serrations indicated micro-creep phenomena at the loading stage, and this premature micro- creep drains the creep deformation that could be expressed at the net creep stage. These observations agree with other research efforts [5,6,7,8,9,10,11,22,23].
(3)
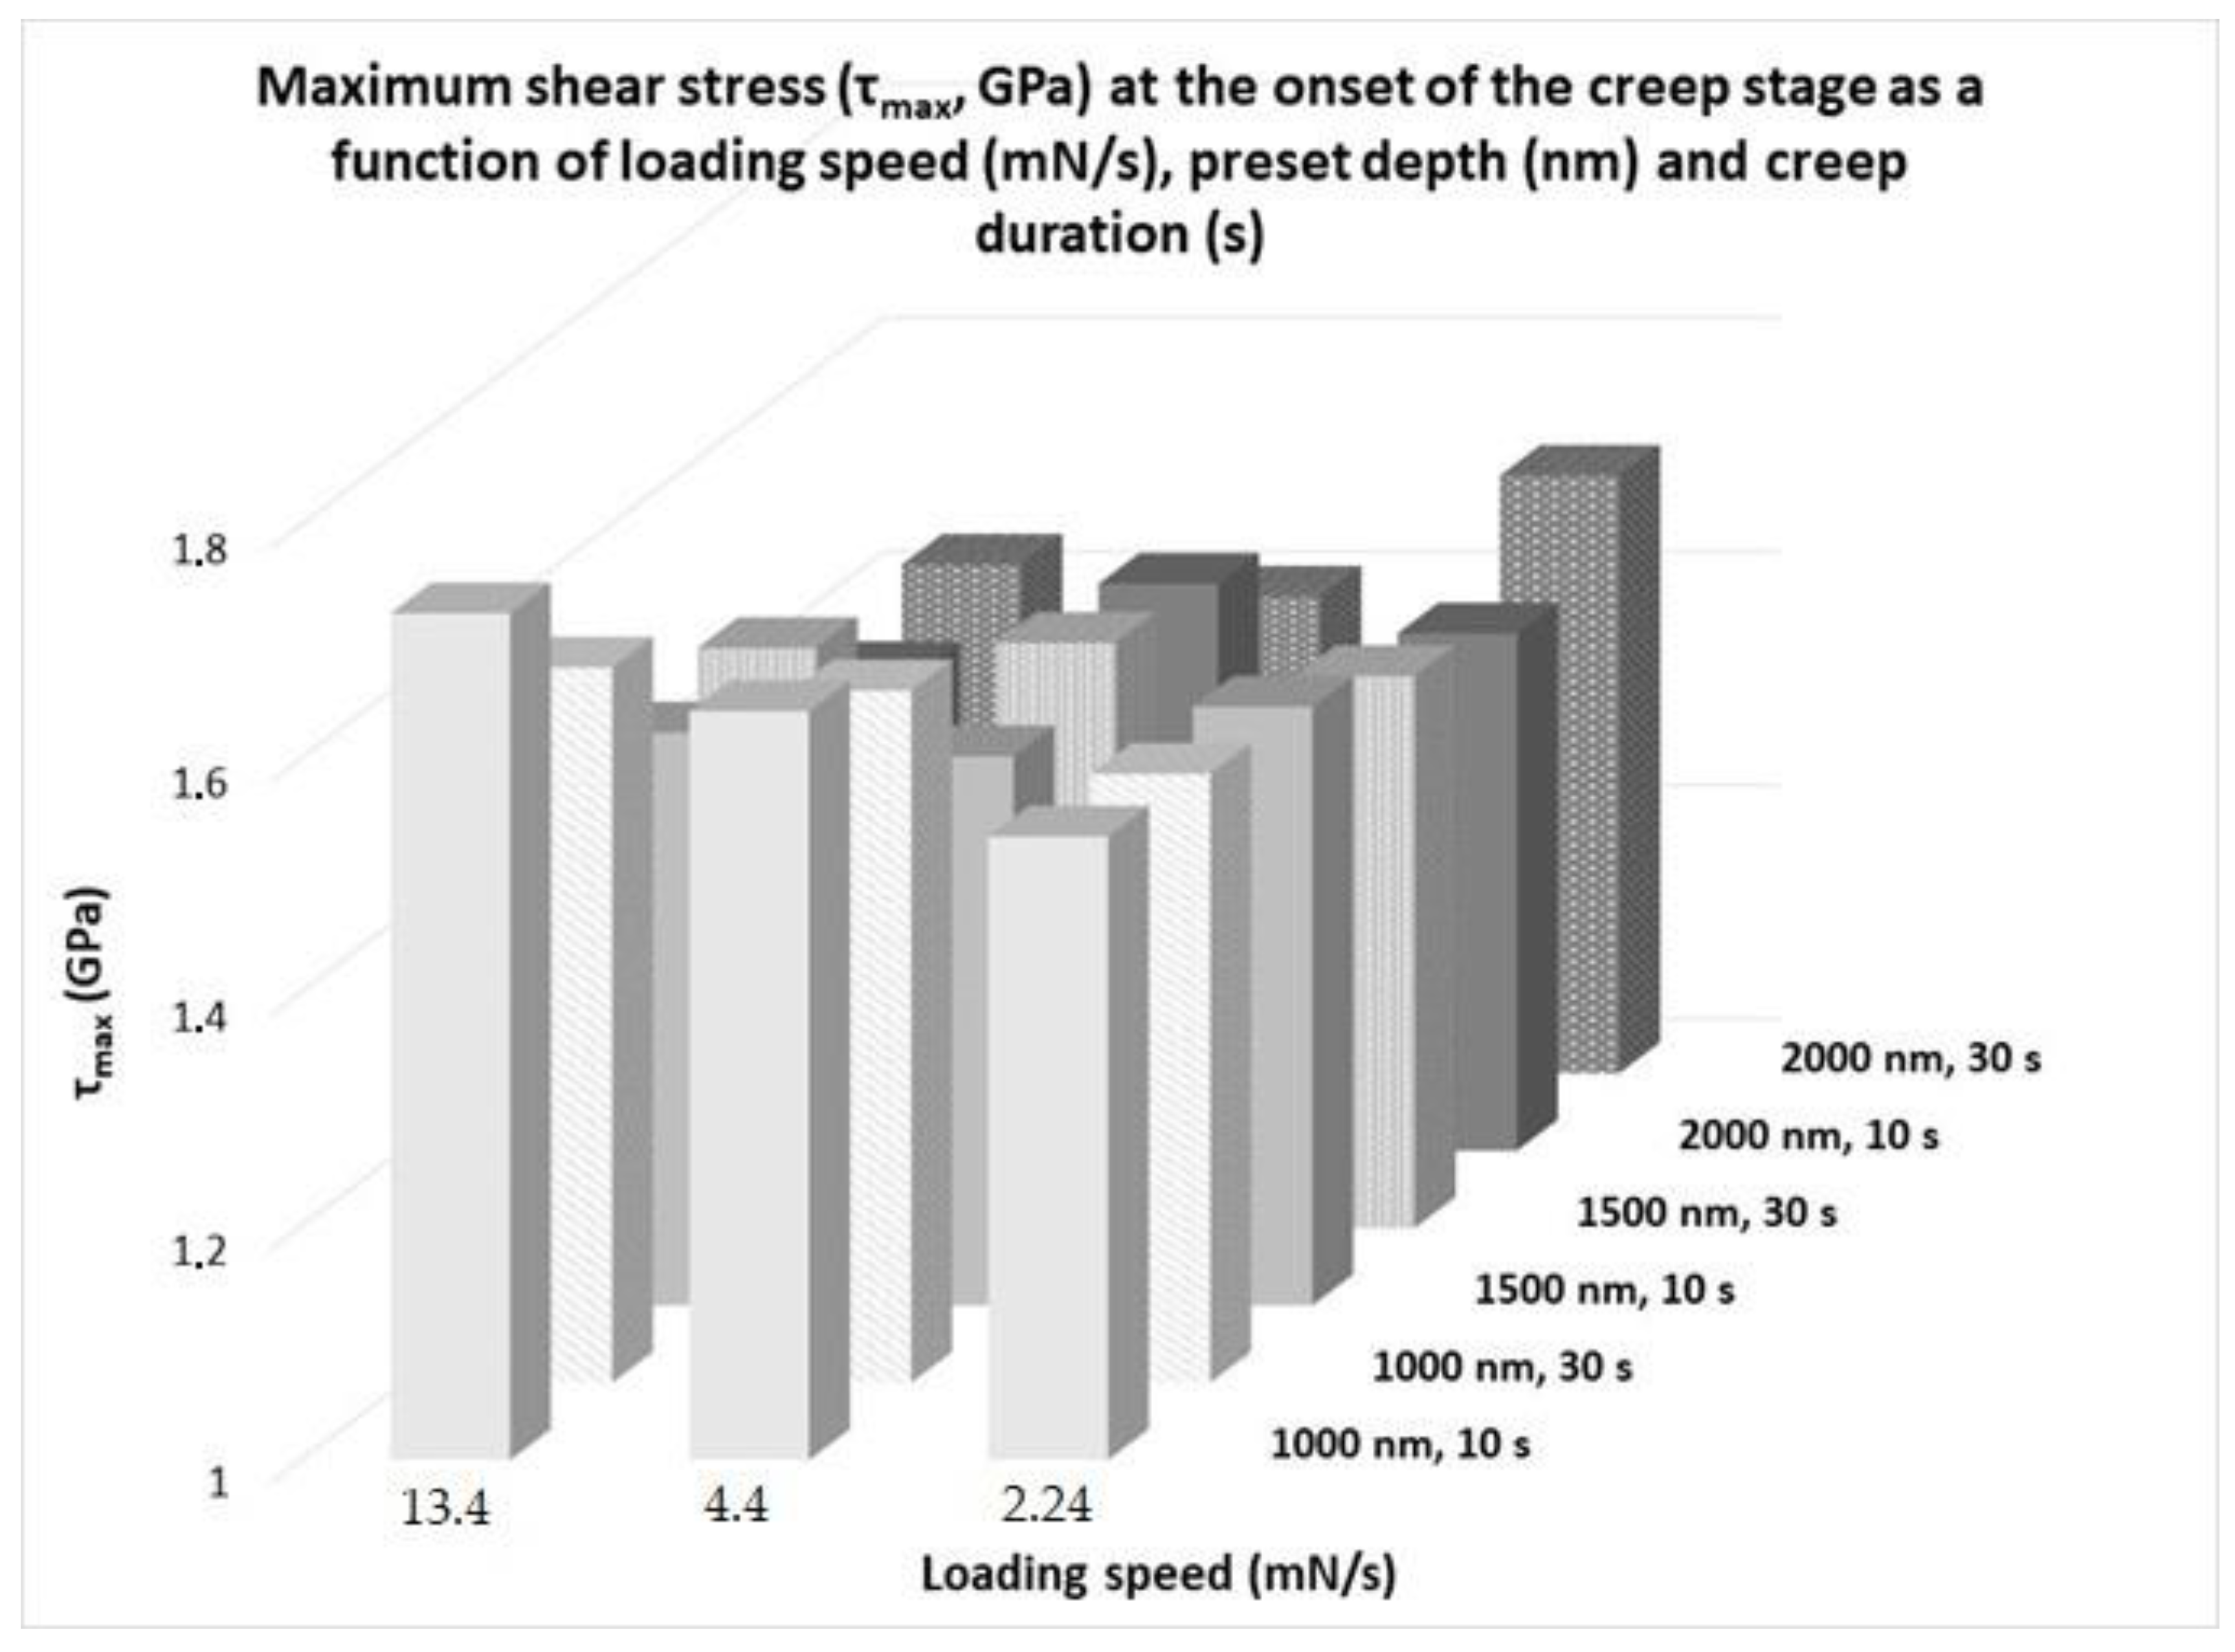
For a more thorough assessment of creep behavior, it is important to take into consideration other parameters in addition to the net creep deformation obtained from the previous paragraphs. Maximum shear stress (τmax): τmax is the stress that practically drives the deformation process since it is the stress that makes the dislocation move and provide the plastic flow of the material. It can be seen from the data of Table 3 and Figure 12 that τmax decreases, in general, as the preset depth increases. This is expected since, according to the calculation sequence, τmax is directly related to the hardness, which, as shown and explained previously, is also reduced as the indentation depth increases. What is significant is that this trend is more profound for the lower creep periods (10 s). Additionally, it appears that τmax is also slightly affected by the loading speed, with this effect being more significant for the lower preset depths. It could be thus postulated that in general lines, τmax follows similar trends as the net creep depth but in reverse order. According to the comments of Karantzalis et al. [23], this behavior and inter-relation are expected and are exactly associated with the extent of the dislocation mobility the τmax provides.
(4)
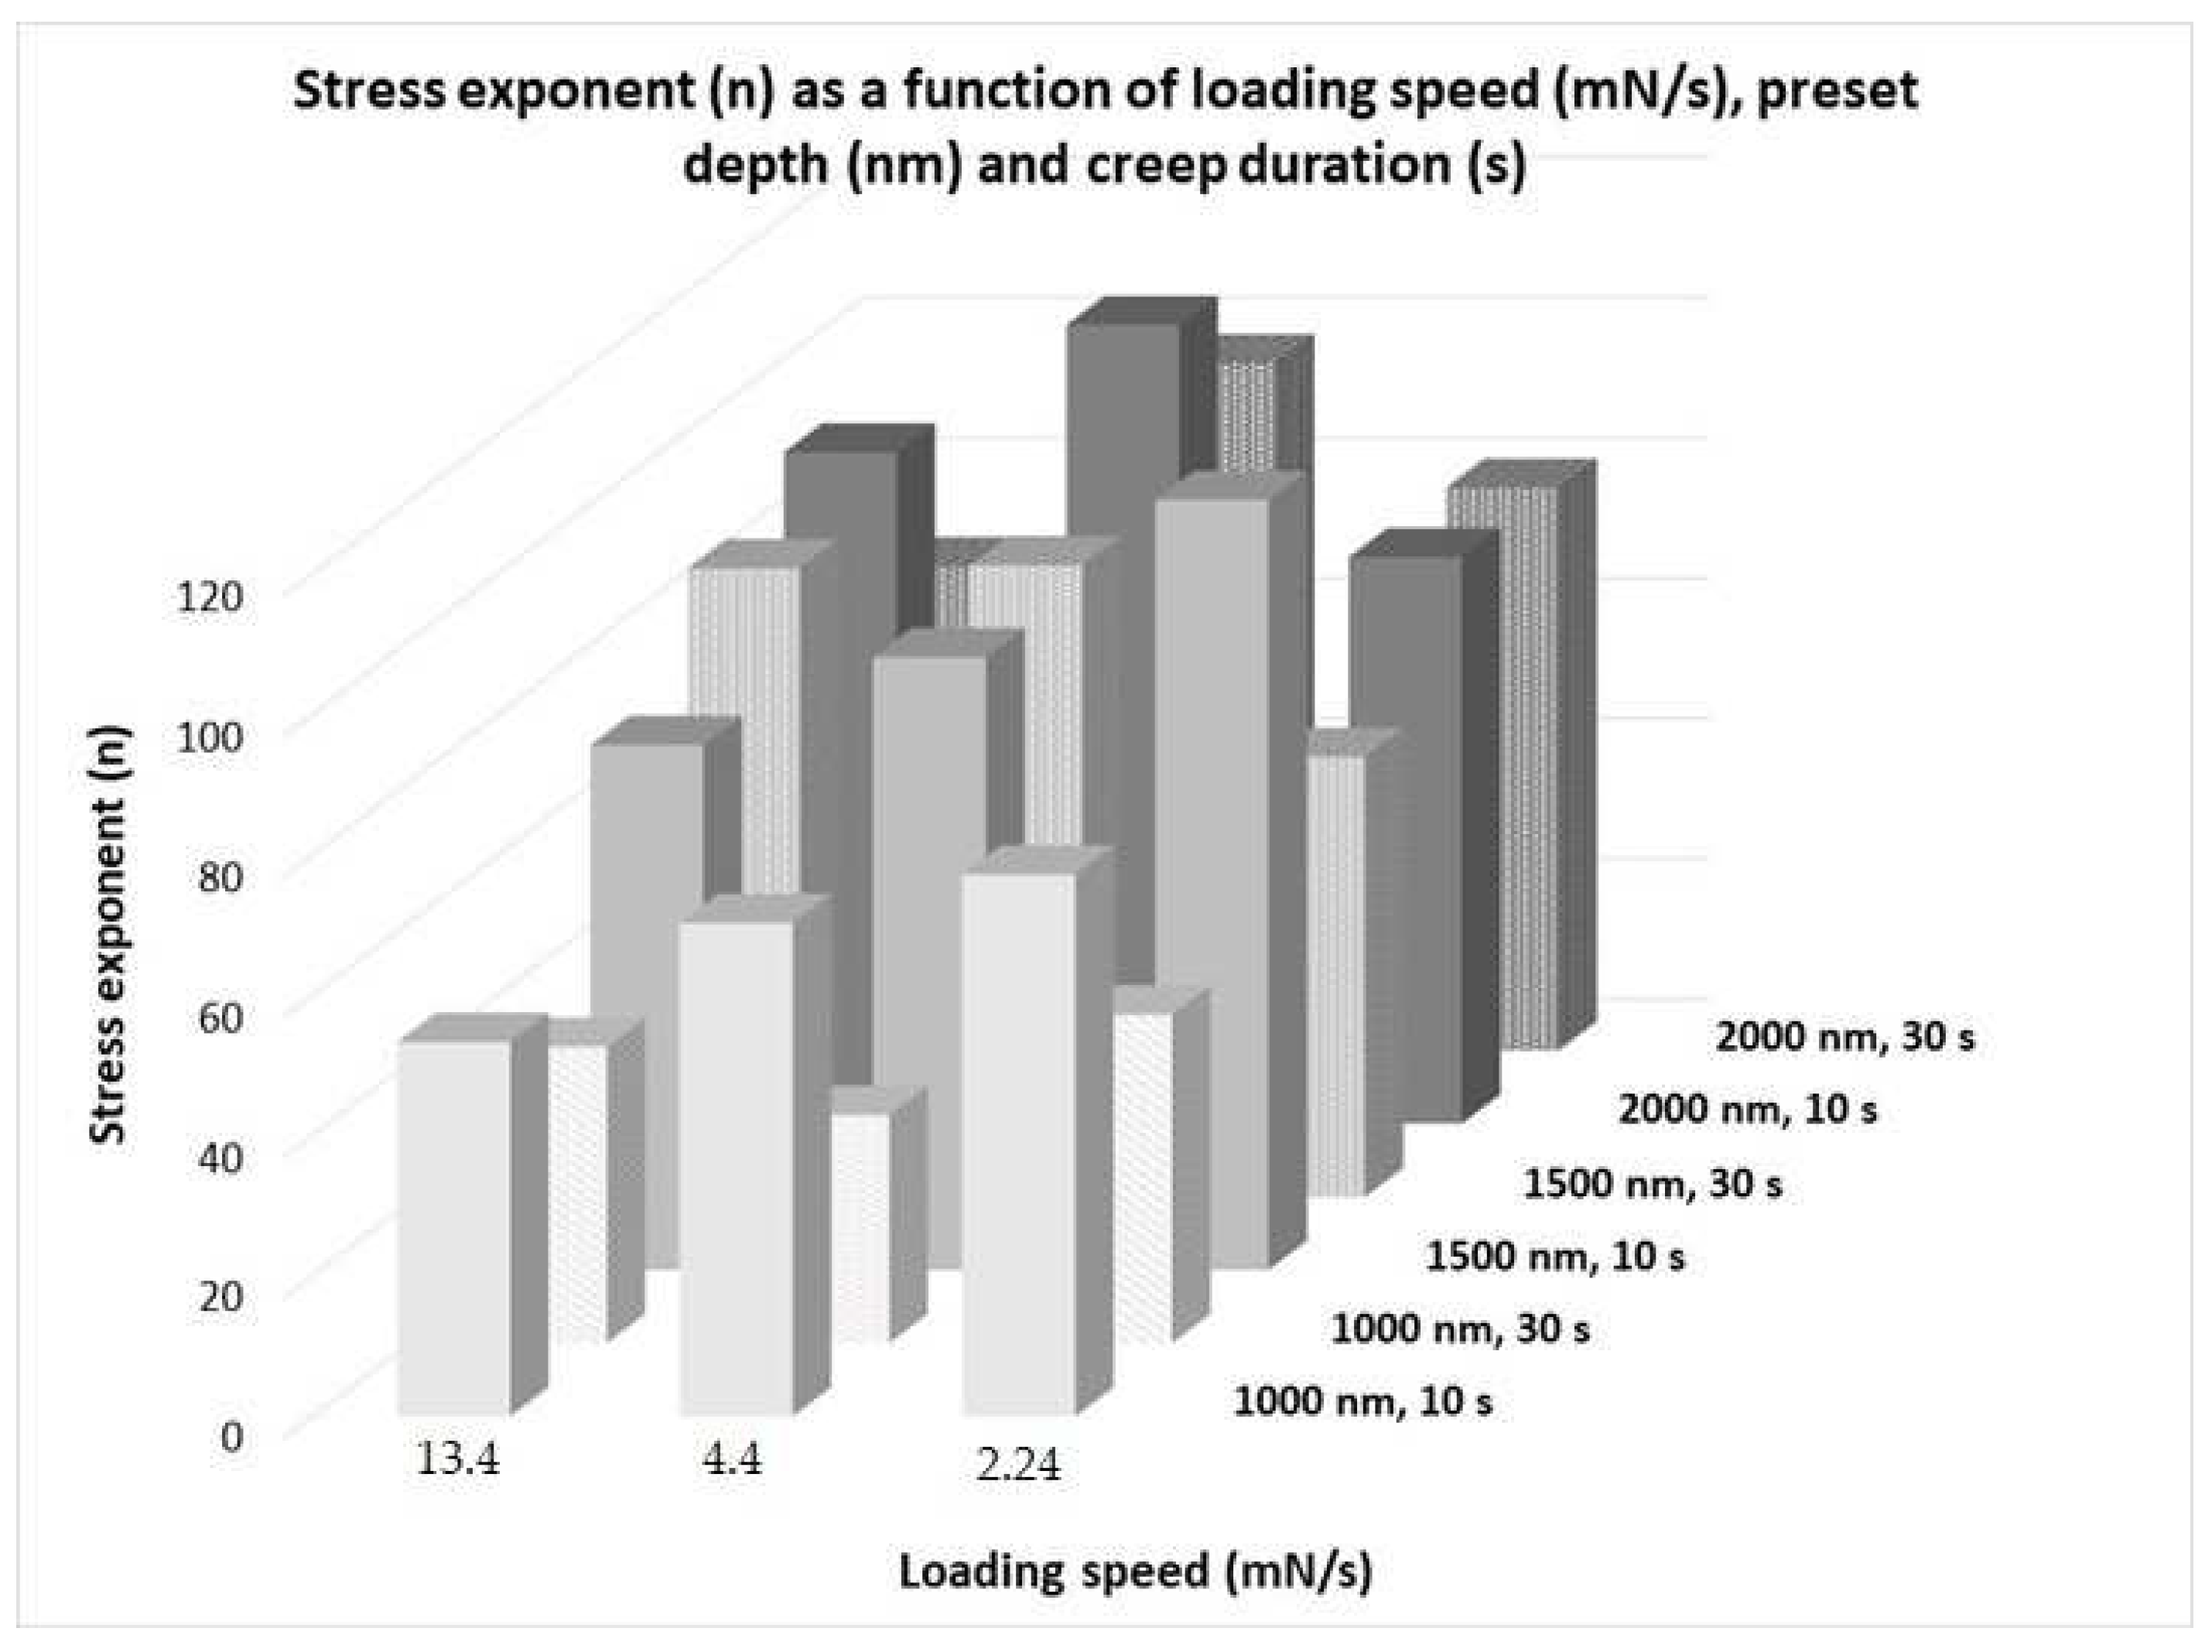
Stress exponent n: Stress exponent n is an indirect measure of how easily the creep deformation is achieved, and, as a general rule, the higher its values, the more restrained the creep deformation. The stress exponent n, in many cases, dictates the mode and the type of creep behavior [5,6,7,8,9,10,11]. As previously mentioned, in the present effort, the type of creep is a power law creep, which imposes a dislocation glide creep mechanism. The values of n obtained in the present effort also support this type and are in agreement with other experimental efforts [6,7,8,9,10,22]. According to the data of Table 3 and Figure 13, it can be observed that the stress exponent n is reduced with creep duration time, in general. The second important observation is that the stress exponent n increases as the preset depth increases. The last important observation is that n increases as the loading speed decreases, especially in the case of lower loading speeds. As far as the effect of the creep period is concerned, the reduction in time implies that once the primary stage of creep (the stage where the greater portion of the creep deformation is achieved) is met, the creep deformation is not that affected by the applied stress. This is due to the fact that a considerable number of dislocations, as the period increases, are generated that can lead to plastic flow of the material irrespective of the applied stresses. The second effect to be discussed is the effect of the loading speed. It is observed that stress exponent n increases as the loading speed decreases. This behaviour is associated with the dislocations generated at the initial loading stage. The lower the loading speed, the less the generated dislocations; and the fewer the overall number of dislocations available at the creep stage, the more restricted the deformation they provide, and thus the higher the stress exponent n. Despite these effects, the most important—and obscure, in a sense—is the fact that stress exponent n increases as the preset depth increases. This trend, as reported in many experimental efforts [7,8,9], is a trend mainly associated with FCC high-entropy alloy systems. On the contrary, Ma et al. [9] reported that in the BCC nanocrystalline coatings, the stress exponent remained unaffected by the indentation depth, and recently, Karantzalis et al. [22] reported that stress exponent n in the MoTaNbVxTi systems they examined was reduced upon increasing the preset depth. It must be mentioned, nevertheless, that during the last effort, the systems consisted of a combination of BCC and HCP phases and not solely of a BCC structure. What also must be mentioned at this point is the fact that the treatment and the discussion of Ma et al. [9] when comparing BCC and FCC structures, are somehow different compared to the present case. Ma et al. [9] compared the BCC structure, which was formed by the addition of Al to a system (Co, Cr, Fe, Ni, and Cu) that, at its equi-atomic composition, possesses FCC structure. In the present effort, the BCC structure is formed solely by BCC refractory metals. The net characteristics between the two BCC structures can be significantly different. The addition of Al creates a more significant lattice distortion, whereas, in the pure BBC refractory high-entropy alloy, the lattice can be undergo further changes. The same trend may occur as far as the stress–elastic strain field within the lattice is concerned. Additionally, lattice defects that can accommodate, incubate, and eventually grow dislocation loops may also be significantly different. If such is the case, this different dislocation sequence may severely affect the critical volume for dislocation nucleation, Vcr, which is a crucial factor, as will be presented later, for the creep behavior. These hints suggest that in the present effort, at higher preset depths, there must be mechanisms that are activated that obstruct the dislocation movement to provide plastic flow. Possible mechanisms can be (a) dislocation entanglement either at the loading stage or between the dislocations generated at the creep stage, (b) reduced number of dislocations available to accommodate plastic deformation, or (c) a lack of mechanisms such as dislocation climb that will assist the continuance of their movement. The authors recognize, nevertheless, that further experimentation is required in order to clarify this behavior. It must be mentioned, however, that the critical volume for dislocation generation Vcr, presented in Figure 14, also contributes toward the postulate of the low number of available dislocations. Indeed, it can be seen from Table 3 and Figure 14 that this volume increases with the preset depth. This practically means that at higher preset depths, the volume of the system underneath the indenter and within the plastic zone, which has to be activated in order for new and fresh dislocations to be generated, increases. According to Ma et al. [9], dislocation loops are generated and grow at lattice defects from atomic-sized regions. A higher activation volume practically means that the flow unit is hard to activate, reducing in such terms the number of glissile dislocations. A very important parameter that influences the extent of Vcr is the type of dislocation type and movement. In BCC structures, the movement of screw dislocations by climbing is severely restrained, causing the continuance of the plastic flow to be even more difficult to sustain. This behavior could also be a cause for the increased values of Vcr. Nevertheless, Vcr should not be treated independently of τmax: τmax directly affects Vcr in a reversed manner. It was observed in Figure 12 that τmax reduces with preset depth, and this has a direct opposite effect of Vcr, which increases.

3.3.2. Creep Response—Statistical Analysis

In order to further examine the significance of the loading speed and the preset depth on the basic mechanical properties measured in the present effort, four different techniques were adopted to ascertain the strength of each input parameter and their impact on the resulting values.
Method 1: ANOVA
The ANOVA analysis results presented in Table 4 delve into the relationship between various input and output variables by examining the Sum of Squares, Degrees of Freedom, F-statistic, and p-value. These metrics are crucial for determining the statistical significance of the impacts that each input variable has on the output variables. In this context, a p-value less than 0.05 generally signals a statistically significant effect.
When assessing the strength of the correlations among the various input–output pairs within the dataset, the F-statistic and p-value are of particular importance. The F-statistic gauges the ratio of the variance that is explained by an input variable against the variance that remains unexplained, whereas the p-value calculates the probability of observing the gathered data if the input variable had no actual impact. A combination of a higher F-statistic and a lower p-value often points to a stronger correlation between the input and output variables.
From the ANOVA, several input–output pairs emerge as having notably strong correlations, as evidenced by their high F-statistics and low p-values. Among these, the correlation between the Output “Net Creep Depth (nm)” and the Input “Loading Speed (mN/s)” stands out with the highest F-statistic of 52.91 and a p-value of 0.000768, making it the most significant correlation identified. Following closely is the correlation between the Output “Net Creep Depth (nm)” and the Input “Creep duration (s)”, marked by an F-statistic of 21.26 and a p-value of 0.005783. Other significant correlations include the Output “Critical Volume for Dislocation Nucleation” with the Input “Preset Depth (nm)” featuring an F-statistic of 15.74 and a p-value of 0.010658; the Output “Strain Rate Exponent” with the Input “Preset Depth (nm)”, an F-statistic of 13.56, and a p-value of 0.014264; and the Output “Maximum Shear Stress (Gpa)” with the Input “Preset Depth (nm)” showing an F-statistic of 11.35 and a p-value of 0.019919.
These results underscore that the “Input Loading Speed (mN/s)” is paramount in its correlation with “Output Net Creep Depth (nm)”, closely followed by the correlation between “Input Creep duration (s)” and “Output Net Creep Depth (nm)”. Additionally, the analysis reveals that “Input Preset Depth (nm)” is significantly correlated with various outputs, highlighting the substantial influence of certain input variables on specific outputs. This analytical approach facilitates the identification of the most influential input variables for each output, guiding the direction for subsequent investigations or optimizations.
Method 2: Random Forest Regression Analysis
The Random Forest Regression analysis depicted in Figure 15 provides a visual representation of feature importances for various output variables. Feature importance in the context of a Random Forest model is an indication of the utility of each input variable in the construction of the model and its effectiveness in predicting the output variable. This utility is assessed based on the contribution of each feature to the reduction in impurity within the trees that make up the forest.
In constructing the ensemble of trees that constitute a Random Forest, each tree is generated from a sample drawn with replacement (a bootstrap sample) from the training dataset. A key aspect of this process is the consideration of a random subset of features for determining the best split at each node within a tree. The cumulative measure of a feature’s contribution to decreasing node impurity across all trees provides the basis for determining feature importance. The analysis yields several observations regarding the significance of input variables for predicting different output variables. For the output variable Peak Hardness (Gpa), the input variable Preset Depth (nm) is identified as the most crucial, with Loading Speed (mN/s) and Creep duration (s) also contributing, albeit to a lesser extent. This pattern of Preset Depth (nm) as a dominant feature is also observed in the analysis of Maximum Shear Stress (Gpa) and Strain Rate Exponent, where it stands out as the most significant input variable.
A deviation from this pattern occurs in the case of the strain rate sensitivity fFactor, where Loading Speed (mN/s) emerges as the most significant feature, contrasting with the predominant influence of Preset Depth (nm) seen in other output variables. Similarly, Critical Volume for Dislocation Nucleation is another output where Preset Depth (nm) ranks highest in terms of importance. However, when analyzing Net Creep Depth (nm), both Loading Speed (mN/s) and Creep duration (s) are found to be significant, with Loading Speed (mN/s) slightly more influential.
These insights from the Random Forest Regression analysis are instrumental in identifying the most predictive input variables for each output variable. Understanding which inputs have the greatest impact on specific outputs can significantly influence decision-making processes in engineering and product design, directing attention to the most influential factors for further investigation or optimization.
Method 3: Partial Dependent Plots from ANNs
Figure 16 presents a collection of Partial Dependence Plots (PDPs) generated from an Artificial Neural Network (ANN) model for a variety of output variables. PDPs serve as a graphical tool in machine learning, illustrating the influence of one or two features on the predicted outcome while holding other features constant. These plots effectively demonstrate the relationship between changes in feature values and shifts in the average predicted response.
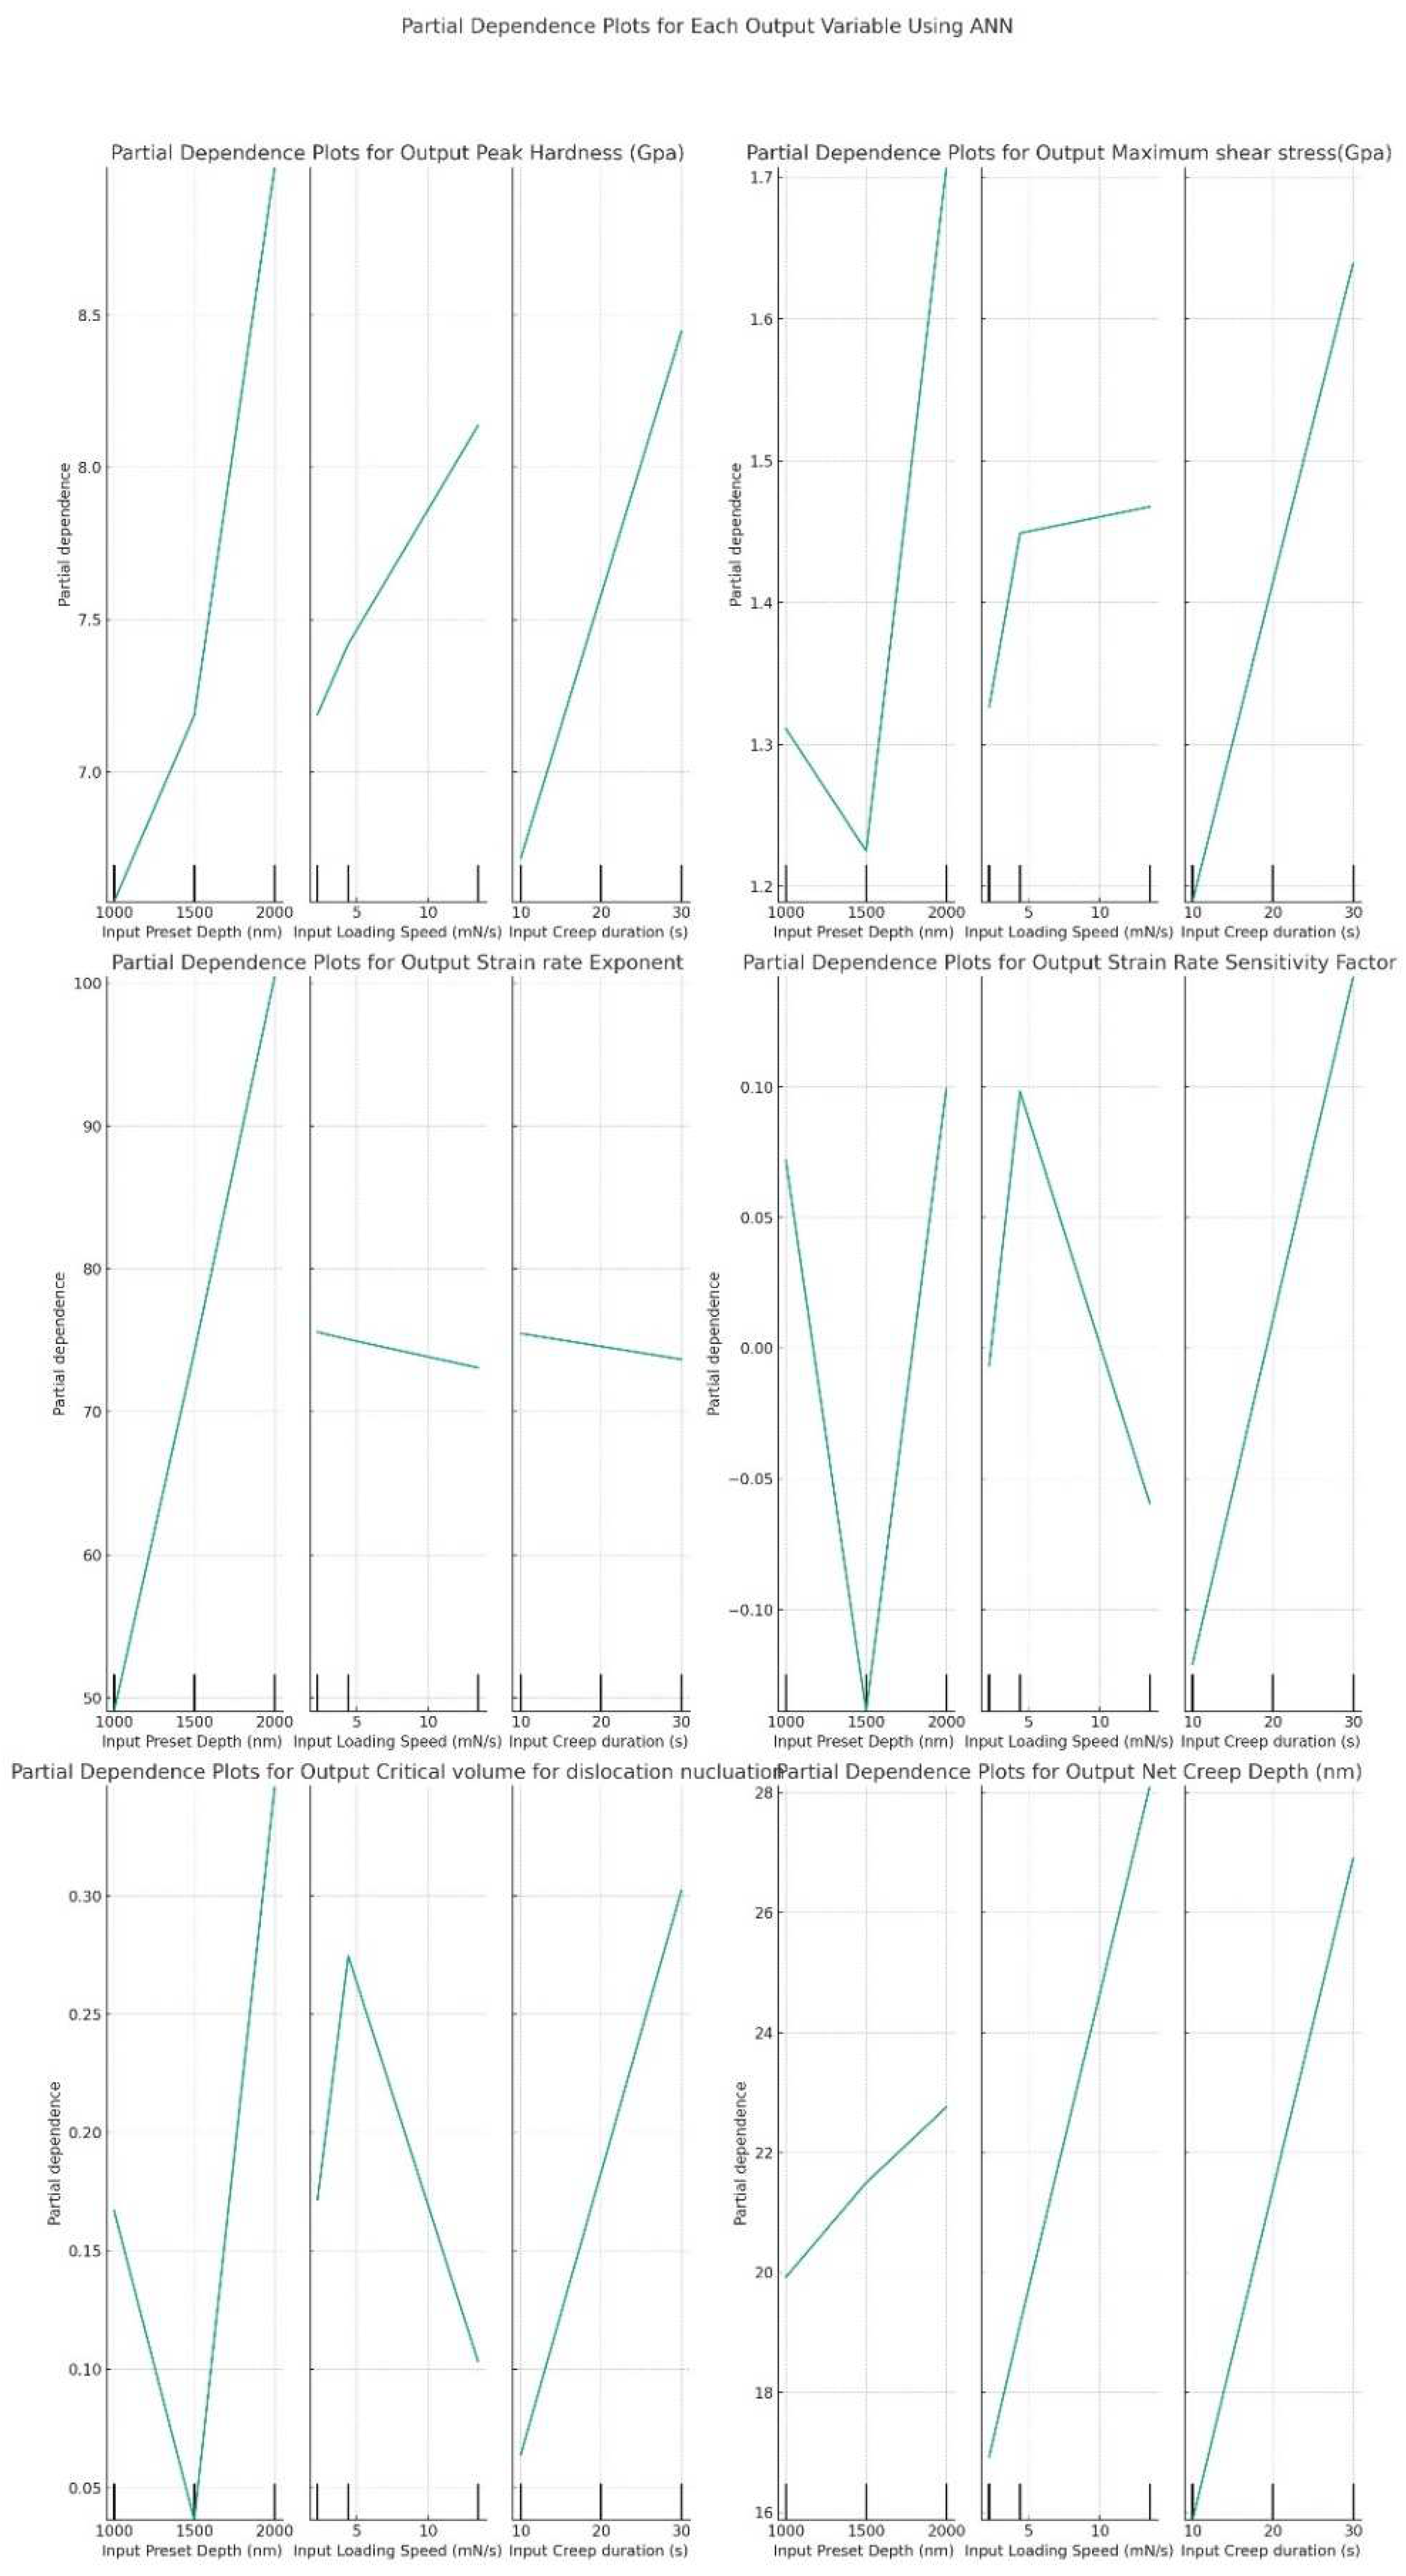
  • For the output variable Peak Hardness (Gpa), the PDP indicates a consistent rise in predicted hardness with an increase in “Input Preset Depth (nm)”. This upward trend is also observed for “Input Loading Speed (mN/s)” and “Input Creep duration (s)”, suggesting that increases in these input values are associated with higher predicted hardness values.
  • The analysis of Maximum Shear Stress (Gpa) via PDPs reveals a strong positive correlation with “Input Preset Depth (nm)” and “Input Creep duration (s)”, indicating that higher values of these inputs predict greater shear stress. Conversely, the plot for “Input Loading Speed (mN/s)” displays a slight upward trend that eventually plateaus, suggesting a more nuanced relationship with predicted shear stress.
  • Regarding the Output Strain Rate Exponent, the PDP underscores a marked increase in the predicted exponent with a rise in “Input Preset Depth (nm),” while the trends for the other inputs are more subdued.
  • The PDPs for the Output Strain Rate Sensitivity Factor exhibit erratic behavior, pointing to potentially complex or non-linear interactions between these inputs and the output, hinting at the intricacies of the underlying relationships.
  • For Output Critical Volume for Dislocation Nucleation, the plots for “Input Preset Depth (nm)” and “Input Loading Speed (mN/s)” reveal sharp peaks, highlighting specific input values that correspond to drastic changes in the predicted response. In contrast, the plot for “Input Creep duration (s)” shows a smoother, more gradual relationship, indicating a different pattern of influence on the predicted outcome.
  • Lastly, the PDPs for Output Net Creep Depth (nm) illustrate increasing trends for all three input variables, with notably steep slopes for “Input Loading Speed (mN/s)” and “Input Creep duration (s)”. This indicates a strong positive relationship between these inputs and the predicted net creep depth, suggesting that higher input values lead to greater predicted creep depths.
These PDPs offer insights into the average predicted outcomes based on the dataset under the assumption that the ANN model accurately captures the relationships between input and output variables. However, the presence of sharp changes or non-linear trends in the plots may also reflect limitations in the data or the need for more sophisticated modeling approaches to fully elucidate the underlying patterns and interactions.
Method 4: Correlation analysis (Linear and very basic)
Figure 17 presents a correlation matrix that evaluates the linear relationships between various input factors and output variables, utilizing correlation coefficients that range from −1 to 1. In this matrix, a coefficient of 1 signifies a perfect positive linear relationship, indicating that as one variable increases, so does the other. Conversely, a coefficient of −1 denotes a perfect negative linear relationship, where an increase in one variable leads to a decrease in another. A coefficient of 0 means there is no linear relationship between the variables. The matrix visually represents these relationships via a color spectrum from blue (indicating negative correlation) to red (indicating positive correlation), with the intensity of the color corresponding to the strength of the relationship.
From the analysis of the correlation matrix, several key observations emerge. The Input Preset Depth (nm) shows a strong negative correlation with both “Output Peak Hardness (GPa)” and “Output Maximum Shear Stress (GPa)”, with coefficients of −0.79, suggesting that an increase in the preset depth is associated with reductions in peak hardness and maximum shear stress. The Input Loading Speed (mN/s) has a moderately positive correlation with “Output Net Creep Depth (nm)”, at a coefficient of 0.63, indicating that higher loading speeds may lead to an increase in net creep depth. Similarly, Input Creep duration (s) is strongly positively correlated with “Output Net Creep Depth (nm)” at a coefficient of 0.68, highlighting that longer durations of creep are linked to greater net creep depths.
Furthermore, there is a nearly perfect correlation between the “Output Strain Rate Exponent” and “Output Strain Rate Sensitivity Factor”, with a coefficient of 0.99, indicating these two outputs vary in almost identical manners with changes in input factors. Additionally, Output Critical Volume for Dislocation Nucleation is strongly negatively correlated with both “Output Strain Rate Exponent” and “Output Strain Rate Sensitivity Factor”, with coefficients of −0.66 and −0.23, respectively. This suggests that as the critical volume for dislocation nucleation increases, there tends to be a decrease in the strain rate exponent and sensitivity factor.
The correlation matrix thus offers a succinct overview of how each input might influence the outputs, which is pivotal for grasping the dynamics within the dataset. Leveraging these insights can aid in focusing efforts on factors that warrant further investigation, modeling, or process enhancement.
To synthesize the insights derived from various analytical methods, including ANOVA, Random Forest, Partial Dependence Plots (PDPs), and the correlation matrix, a comprehensive comparison of the findings related to key input variables is provided:
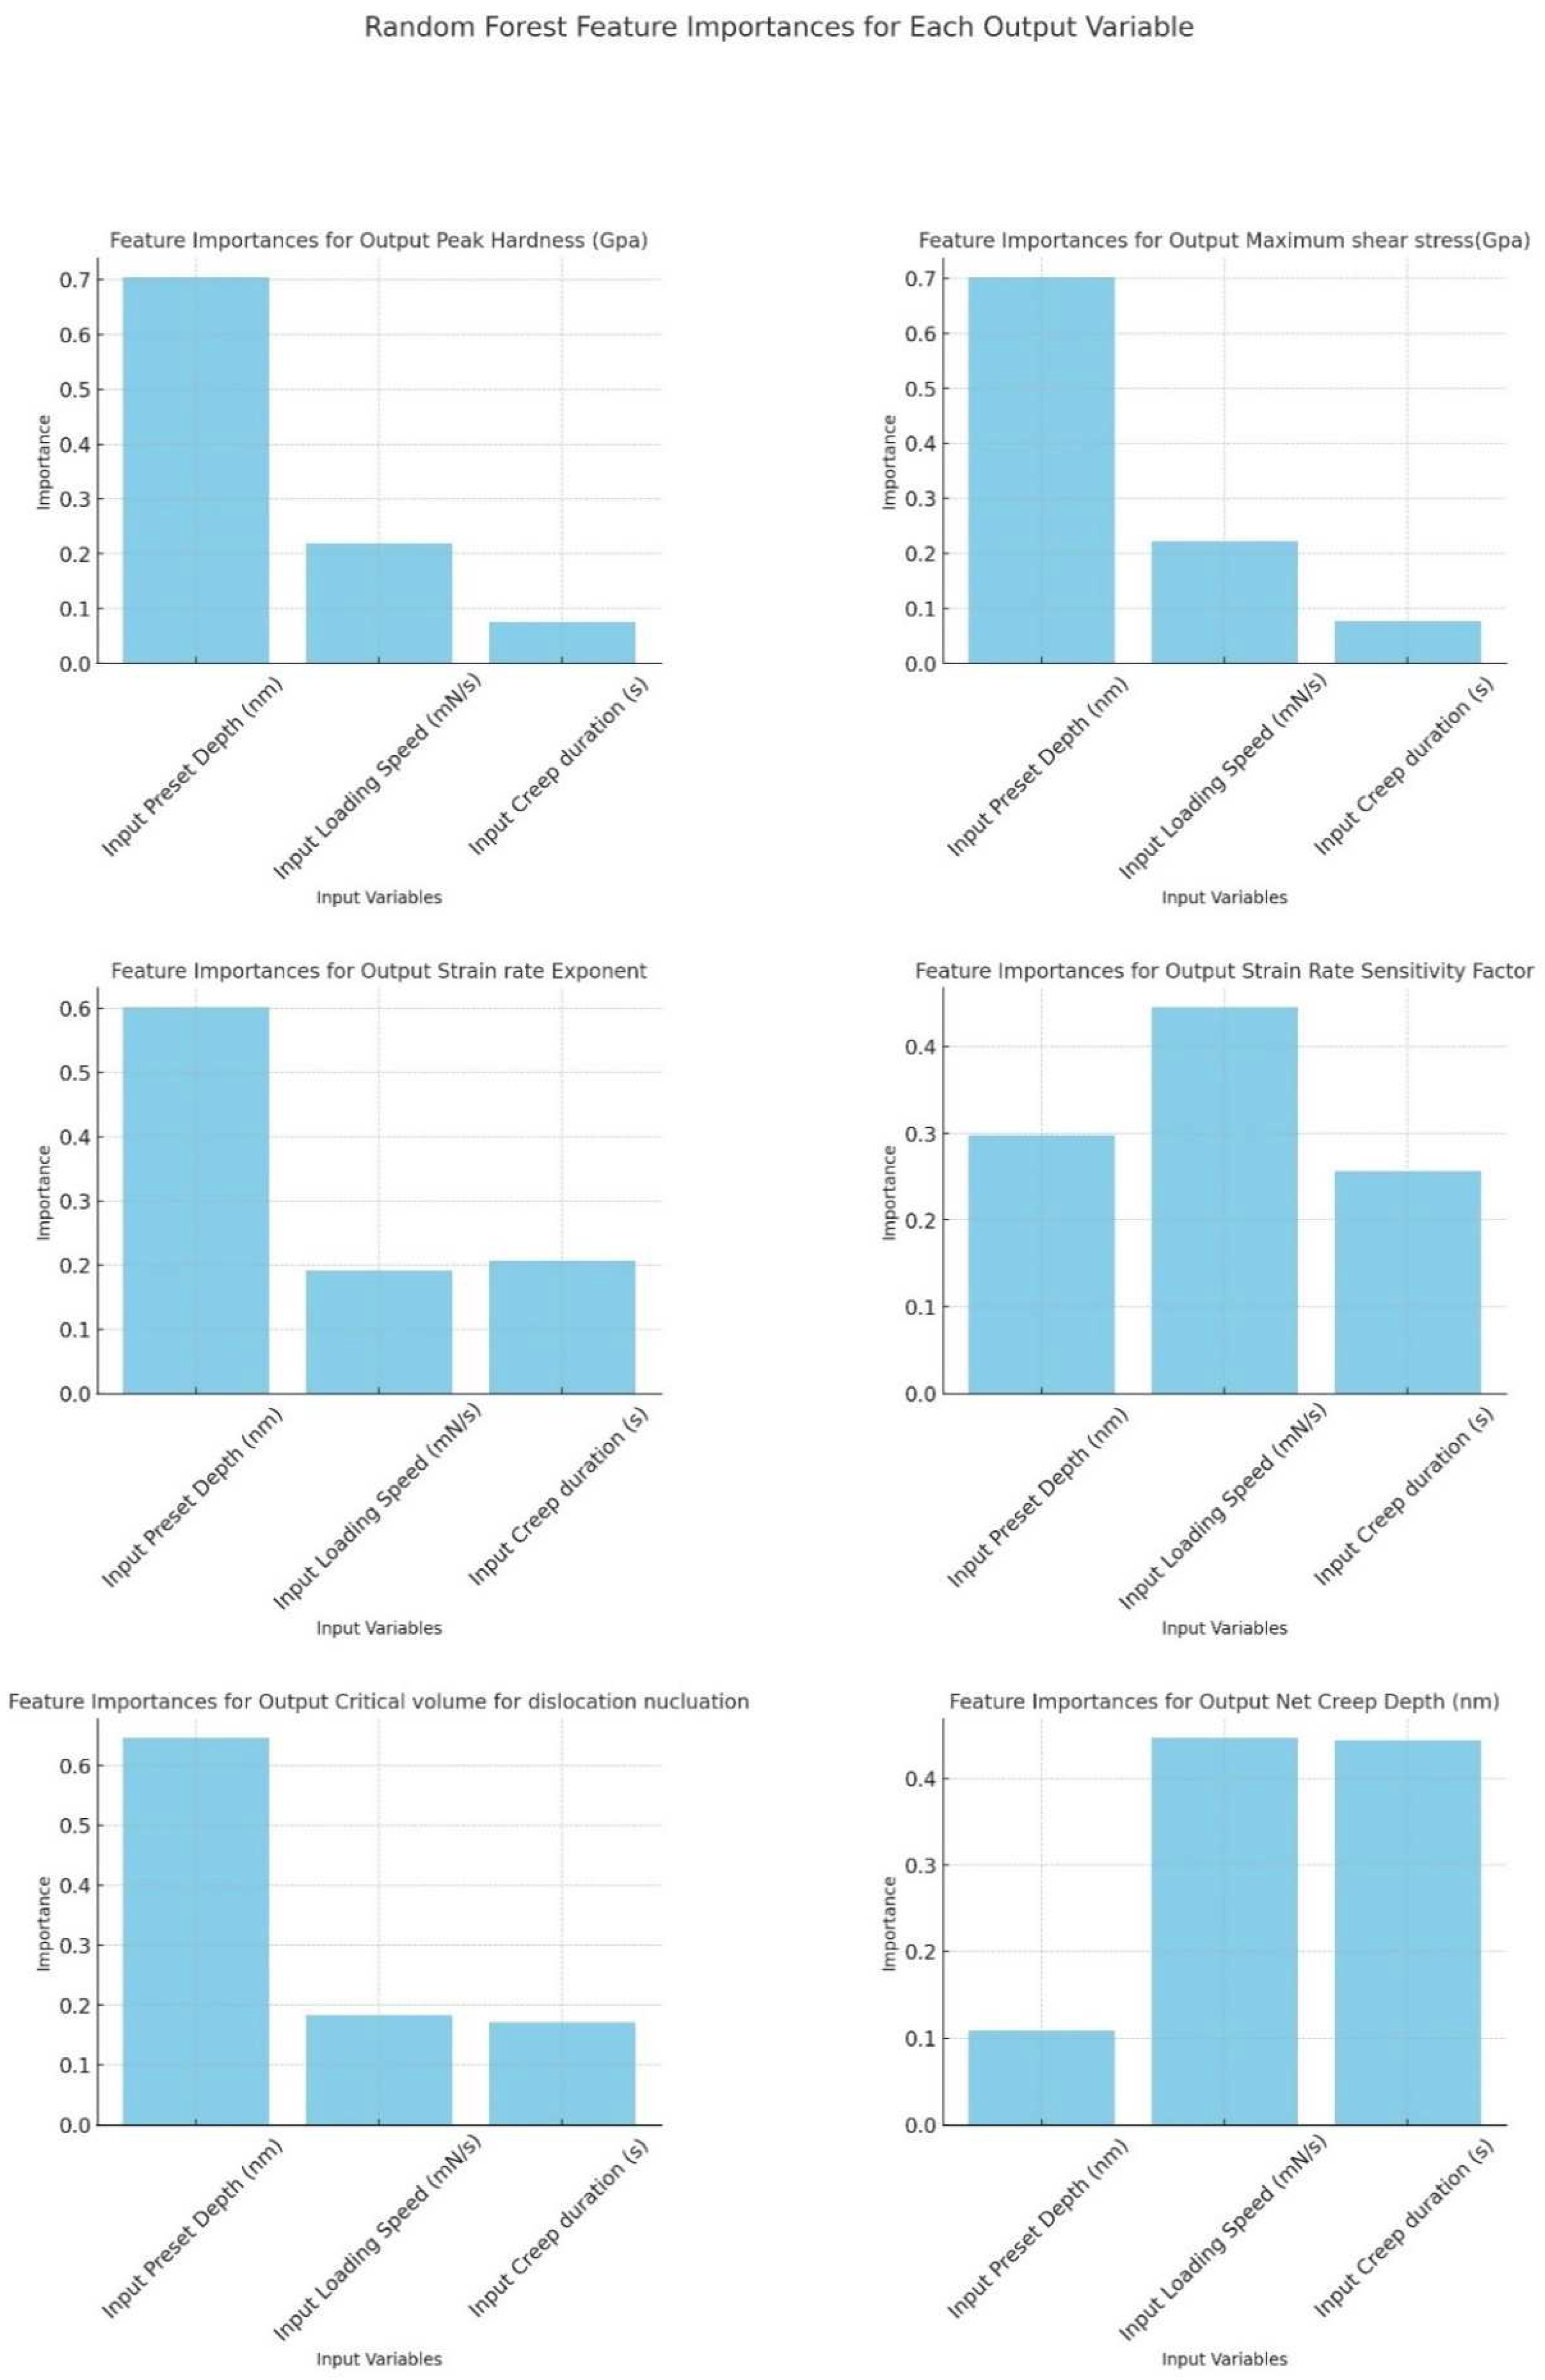
  • Regarding Input Preset Depth (nm), ANOVA highlights its significant effect on both “Output Peak Hardness (GPa)” and “Output Maximum Shear Stress (GPa)”. The Random Forest analysis identifies it as an important feature for several outputs, while PDPs suggest a positive impact on the outputs. However, the correlation matrix reveals a negative correlation between “Output Peak Hardness (GPa)” and “Output Maximum Shear Stress (GPa)”. This consensus indicates that while ANOVA and Random Forest recognize the significance of this input, the negative correlation observed in the correlation matrix contrasts with the positive relationship indicated by PDPs and the significant effects noted in ANOVA, hinting at possible non-linear effects that may not be captured in linear analyses.
  • For Input Loading Speed (mN/s), ANOVA shows a significant effect on “Output Net Creep Depth (nm)”, which is echoed by its noted importance for “Output Strain Rate Sensitivity Factor” and “Output Net Creep Depth (nm)” in Random Forest analysis. PDPs also depict a positive relationship with “Output Net Creep Depth (nm)”, a finding supported by a moderate positive correlation in the correlation matrix. The consensus across all methods underscores the importance and positive impact of this input on “Output Net Creep Depth (nm)”, indicating a uniform agreement on its role.
  • Input Creep duration (s) is identified by ANOVA as having a significant effect on “Output Net Creep Depth (nm)”, with Random Forest attributing some importance to it for this output. PDPs and the correlation matrix further affirm a positive relationship with “Output Net Creep Depth (nm)”, marked by a strong positive correlation. This general agreement among all methods on the significant and positive relationship between this input and “Output Net Creep Depth (nm)” highlights a clear consensus on its impact.
The alignment between ANOVA findings and those from other methods reinforces the conclusions regarding the relationships between these input variables and their respective outputs. Notably, there is strong evidence from multiple analytical angles supporting the impact of “Input Loading Speed (mN/s)” and “Input Creep duration (s)” on “Output Net Creep Depth (nm)”. The mixed results concerning “Input Preset Depth (nm)” suggest the need for further exploration, possibly employing non-linear modeling techniques to bridge the gap between the linear and non-linear findings and fully understand the underlying dynamics.

4. Conclusions

(1)
An in-depth examination of the mechanical properties of a refractory MoTaNbVW high-entropy alloy was conducted, and the effects of the different testing parameters were assessed.
(2)
The hardness of the alloy was affected by the two input parameters, i.e., the preset depth and the loading speed. It was found that these two factors have opposite effects. A clear trend of the preset depth on the modulus of elasticity Eit was not ascertained. On the contrary, it was shown that a reduction in the loading speeds leads to lower Eit values, especially for higher indentation depths (1500 and 2000 nm, respectively). The ratio of the absorbed elastic energy, nit, seems to follow the same trend as hardness.
(3)
The four different statistical analysis techniques verified the preset indentation depth as the most crucial parameter for the obtained hardness values. Additionally, and even though three of the four techniques showed some relation between the loading speed and the Eit, this relation is characterized as weak, and more complex approaches should be taken into consideration. This outcome is also in alignment with the related metallurgical and microstructural postulates.
(4)
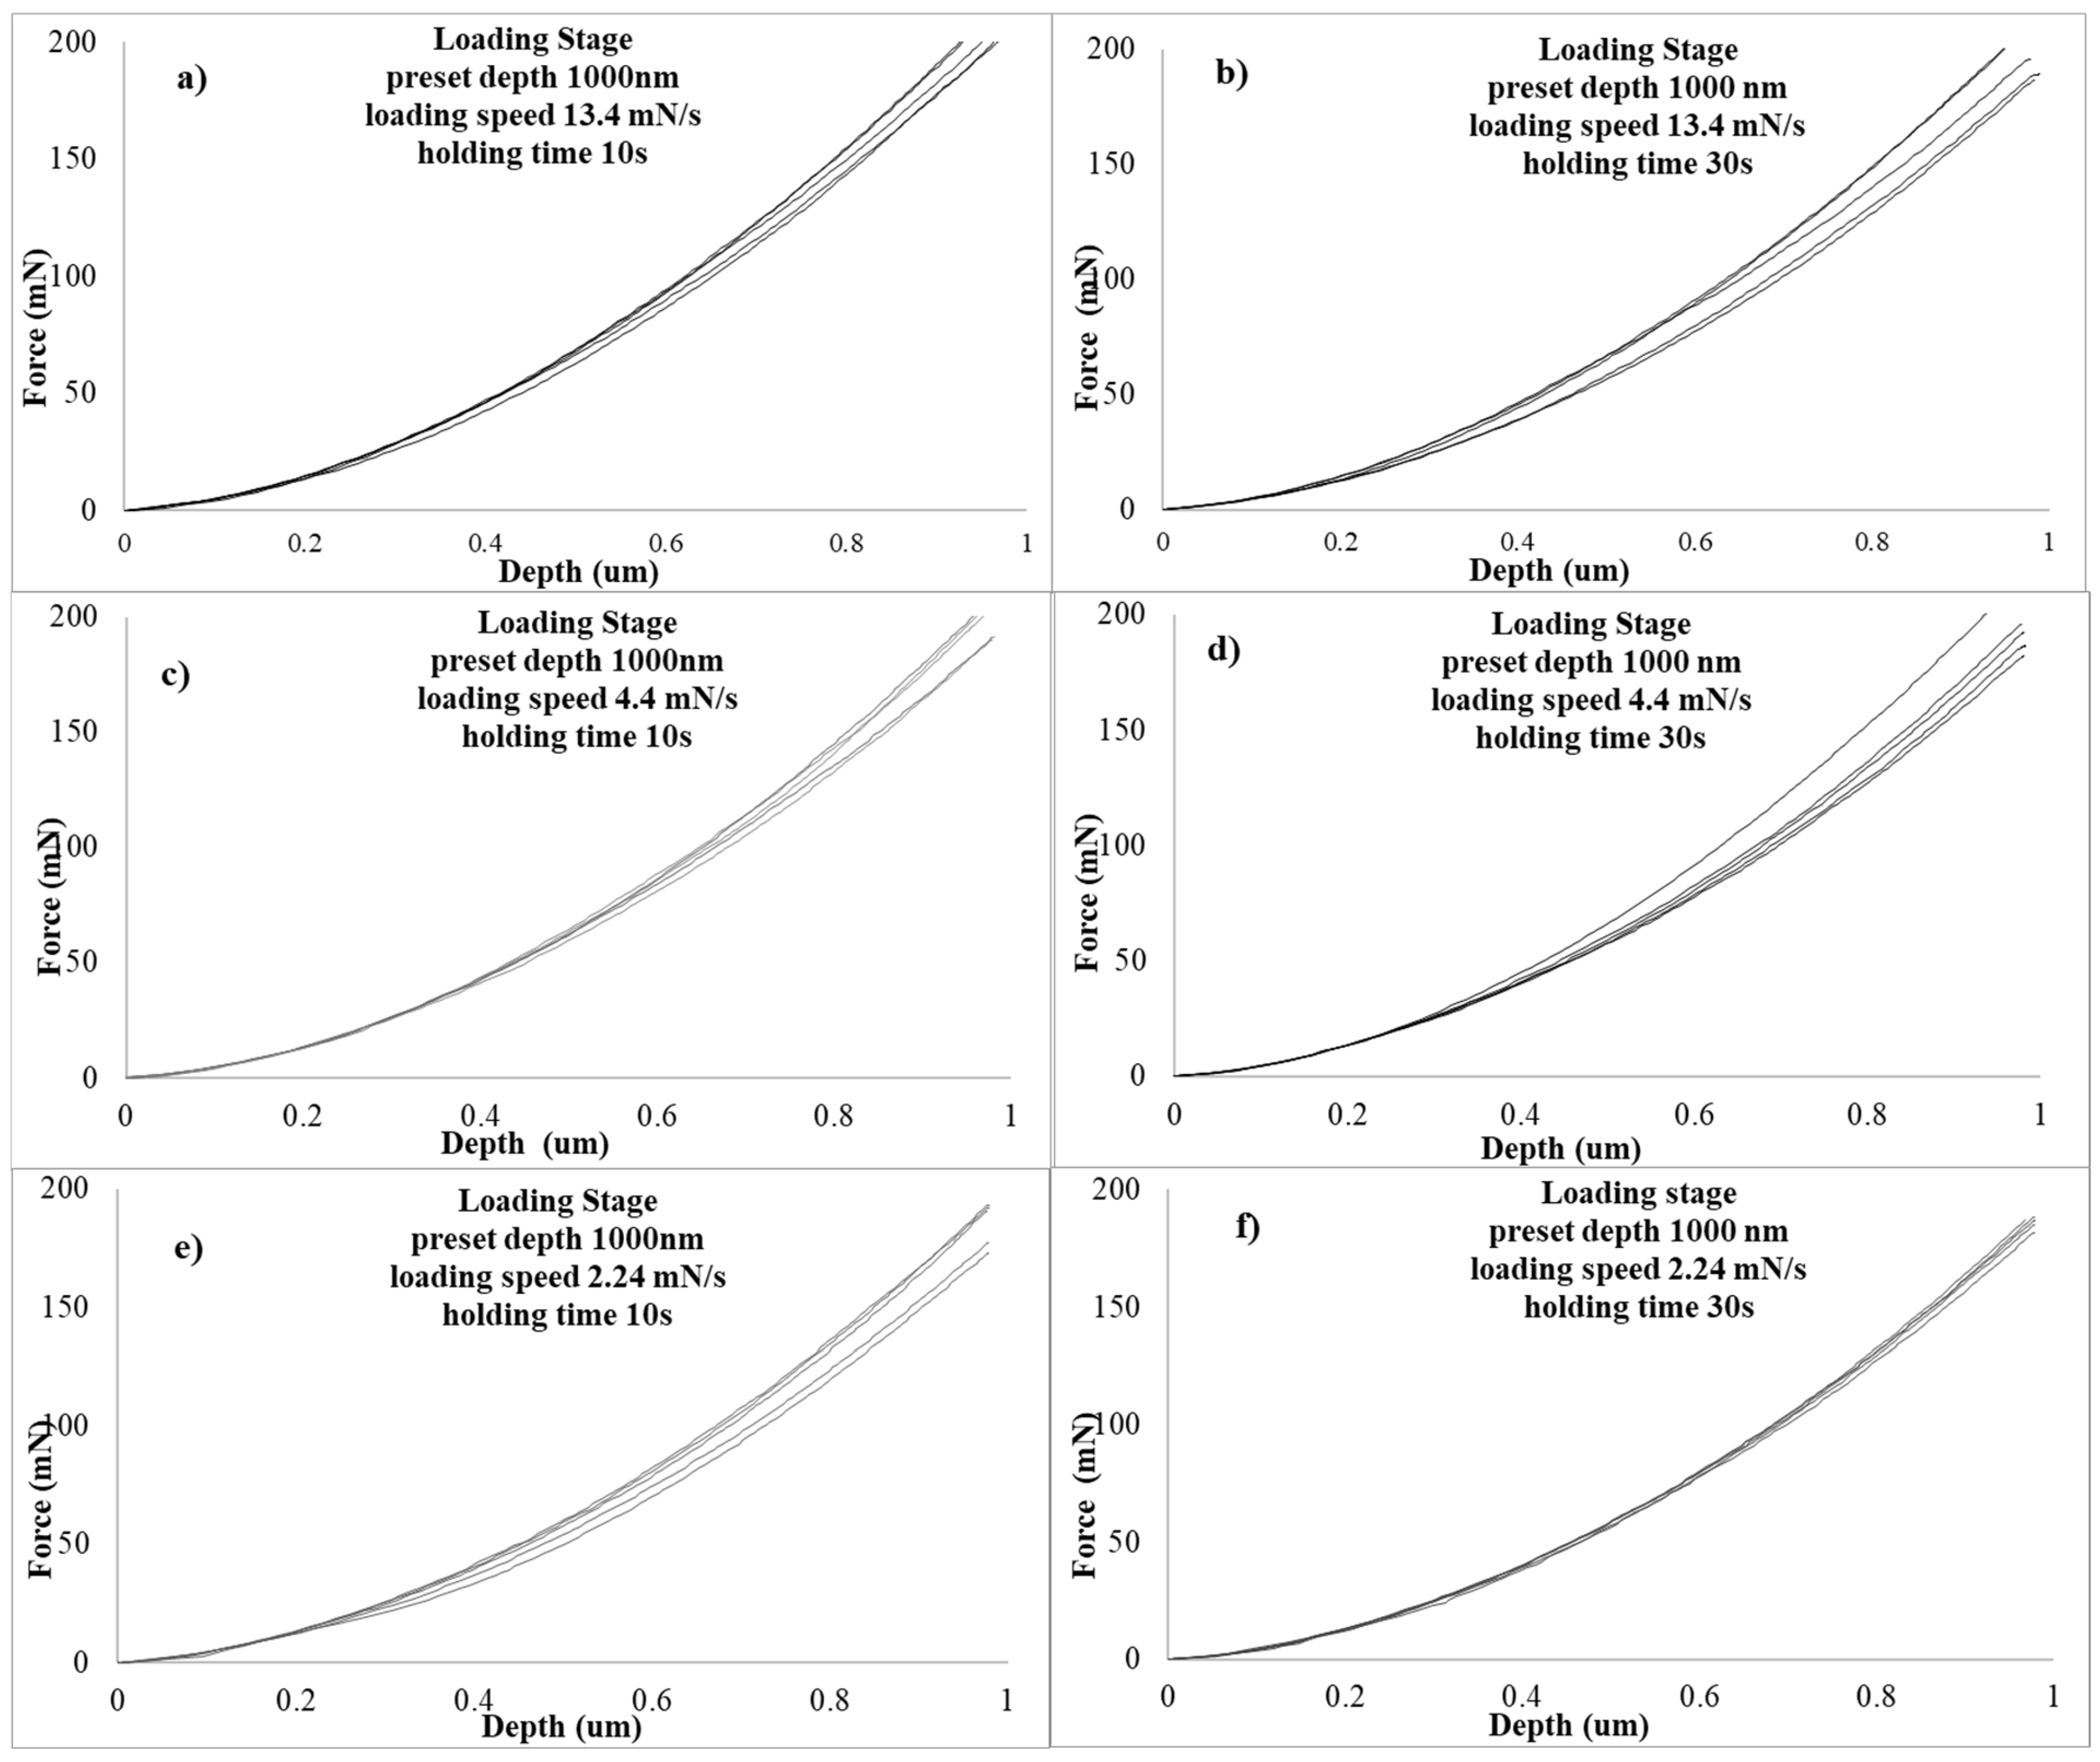
The pre-creep loading stage revealed the presence of serrations, especially at the lower preset depths and the lower loading speeds. These serrations manifest premature creep behaviour at the loading stage.
(5)
The net creep deformation was found to be affected by all the different testing variables: the creep deformation increases as the present depth increases, the creep duration increases, and the loading speed increases. The maximum shear stress, τmax, i.e., the stress which is directly associated with the dislocation mobility to provide the plastic deformation during creep, shows a similar behaviour as the net creep deformation in reversed order. The stress exponent n was reduced as the creep duration decreased, the preset depth increased, and the loading speed decreased. The Vcr was also taken into consideration since it is also associated with the number of the associated with the deformation dislocations.
(6)
The correlation analysis methods showed the importance of the loading speed and the creep duration on the output values, such as the net creep depth, and verified the tendencies expressed in metallurgical and microstructural terms. Correlation analysis also revealed, in some cases, that the involved phenomena governing individual input–output inter-relations may have an extensive degree of complexity, and as such, more sophisticated modeling approaches may be required.

Author Contributions

Conceptualization, A.E.K.,V.S., S.K. (Spyros Kamnis) and K.D.; methodology, A.E.K., V.S. and E.G.; software, S.K. (Spyros Kamnis) and K.D.; validation, A.E.K., V.S., S.K. (Spyros Kamnis), K.D., S.K. (Stavros Kiape) and E.G.; formal analysis, A.E.K., S.K. (Spyros Kamnis) and V.S.; investigation, V.S., S.K. (Spyros Kamnis), A.E.K. and S.K. (Stavros Kiape); resources, S.K. (Spyros Kamnis) and A.E.K.; data curation, V.S., S.K. (Spyros Kamnis), K.D., A.E.K. and S.K. (Stavros Kiape); writing—original A.E.K., S.K. (Spyros Kamnis) and S.K. (Stavros Kiape); writing—review and editing, A.E.K., S.K. (Spyros Kamnis), S.K. (Stavros Kiape) and E.G.; visualization, A.E.K. and S.K. (Spyros Kamnis); supervision, A.E.K. All authors have read and agreed to the published version of the manuscript.

Funding

This research received no external funding.

Institutional Review Board Statement

Not applicable.

Informed Consent Statement

Not applicable.

Data Availability Statement

Data will be available at request.

Conflicts of Interest

Author Spyros Kamnis was employed by the company Castonlin Eutectic-Monitor Coatings Ltd. The remaining authors declare that the research was conducted in the absence of any commercial or financial relationships that could be construed as a potential conflict of interest.

References

  1. Miracle, D.B.; Senkov, O.N.; Wilks, J. A critical review of high entropy alloys and related concepts. Acta Mater. 2017, 122, 448–511. [Google Scholar] [CrossRef]
  2. Choi, I.-C.; Yoo, B.-G.; Kim, Y.-J.; Jang, J.-I. Indentation creep revisited. J. Mater. Res. 2011, 27, 3–11. [Google Scholar] [CrossRef]
  3. Bull, S.J. Nanoindentation of coatings. J. Phys. D Appl. Phys. 2005, 38, R393–R413. [Google Scholar] [CrossRef]
  4. Li, W.; Henshall, J.; Hooper, R.; Easterling, K. The mechanisms of indentation creep. Acta Met. Mater. 1991, 39, 3099–3110. [Google Scholar] [CrossRef]
  5. Zhang, L.; Yu, P.; Cheng, H.; Zhang, H.; Diao, H.; Shi, Y.; Chen, B.; Chen, P.; Feng, R.; Bai, J.; et al. Nanoindentation Creep Behavior of an Al0.3CoCrFeNi High-Entropy Alloy. Met. Mater. Trans. A 2016, 47, 5871–5875. [Google Scholar] [CrossRef]
  6. Ding, Z.Y.; Song, Y.X.; Ma, Y.; Huang, X.W.; Zhang, T.H. Nanoindentation Investigation on the Size-Dependent Creep Behavior in a Zr-Cu-Ag-Al Bulk Metallic Glass. Metals 2019, 9, 613. [Google Scholar] [CrossRef]
  7. Lin, P.; Chou, H.; Huang, J.; Chuang, W.; Jang, J.; Nieh, T. Elevated-temperature creep of high-entropy alloys via nanoindentation. MRS Bull. 2019, 44, 860–866. [Google Scholar] [CrossRef]
  8. Ma, Z.; Long, S.; Zhou, Y.; Pan, Y. Indentation scale dependence of tip-in creep behavior in Ni thin films. Scr. Mater. 2008, 59, 195–198. [Google Scholar] [CrossRef]
  9. Ma, Y.; Feng, Y.; Debela, T.T.; Peng, G.; Zhang, T. Nanoindentation study on the creep characteristics of high-entropy alloy films: Fcc versus bcc structures. Int. J. Refract. Met. Hard Mater. 2016, 54, 395–400. [Google Scholar] [CrossRef]
  10. Bin Kang, Y.; Shim, S.H.; Lee, K.H.; Hong, S.I. Dislocation creep behavior of CoCrFeMnNi high entropy alloy at intermediate temperatures. Mater. Res. Lett. 2018, 6, 689–695. [Google Scholar] [CrossRef]
  11. Jiao, Z.M.; Chu, M.Y.; Yang, H.J.; Wang, Z.H.; Qiao, J.W. Nanoindentation characterised plastic deformation of a Al0.5CoCrFeNi high entropy alloy. Mater. Sci. Technol. 2015, 31, 1244–1249. [Google Scholar] [CrossRef]
  12. Wang, Z.; Guo, S.; Wang, Q.; Liu, Z.; Wang, J.; Yang, Y.; Liu, C. Nanoindentation characterized initial creep behavior of a high-entropy-based alloy CoFeNi. Intermetallics 2014, 53, 183–186. [Google Scholar] [CrossRef]
  13. Kaufmann, J.; Schering, A.G. Analysis of Variance ANOVA; Wiley: New York, NY, USA, 2014. [Google Scholar] [CrossRef]
  14. Breiman, L. Random forests. Mach. Learn. 2001, 45, 5–32. [Google Scholar] [CrossRef]
  15. Available online: https://scikit-learn.org/0.24/modules/generated/sklearn.inspection.plot_partial_dependence.html (accessed on 15 November 2023).
  16. Reed, S. Artificial Neural Networks. In Encyclopedia of Structural Health Monitoring; Boller, C., Chang, F.-K., Fujino, Y., Eds.; Wiley: New York, NY, USA, 2009. [Google Scholar] [CrossRef]
  17. Hüsser, A.P. Correlation Analysis. In The International Encyclopedia of communication Research Methods; Matthes, J., Davis, C.S., Potter, R.F., Eds.; Wiley: New York, NY, USA, 2017. [Google Scholar] [CrossRef]
  18. Available online: https://docs.scipy.org/doc/scipy/reference/stats.html (accessed on 15 November 2023).
  19. Available online: https://scikit-learn.org/stable/modules/generated/sklearn.ensemble.RandomForestRegressor.html (accessed on 15 November 2023).
  20. Available online: https://www.tensorflow.org/about/bib (accessed on 15 November 2023).
  21. Available online: https://pandas.pydata.org/docs/reference/api/pandas.DataFrame.corr.htm (accessed on 15 November 2023).
  22. Karantzalis, A.E.; Sioulas, D.; Poulia, A.; Mathiou, C.; Georgatis, E. A first approach on the assessment of the creep behavior of MoTaNbVxTi high entropy alloys by indentation testing. SN Appl. Sci. 2020, 2, 950. [Google Scholar] [CrossRef]
  23. Wang, D.; Tan, J.; Li, C.J.; Qin, X.M.; Guo, S.F. Enhanced creep resistance of Ti30Al25Zr25Nb20 high-entropy alloy at room temperature. J. Alloy. Compd. 2021, 885, 161038. [Google Scholar] [CrossRef]
  24. Yu, P.F.; Feng, S.D.; Xu, G.S.; Guo, X.L.; Wang, Y.Y.; Zhao, W.; Qi, L.; Li, G.; Liaw, P.K.; Liu, R.P. Room-temperature creep resistance of Co-based metallic glasses. Scr. Mater. 2014, 90, 45–48. [Google Scholar] [CrossRef]
  25. Poulia, A.; Georgatis, E.; Lekatou, A.; Karantzalis, A. Microstructure and wear behavior of a refractory high entropy alloy. Int. J. Refract. Met. Hard Mater. 2016, 57, 50–63. [Google Scholar] [CrossRef]
  26. Oliver, W.C.; Pharr, G.M. An improved technique for determining hardness and elastic modulus using load and displacement sensing indentation experiments. J. Mater. Res. 1992, 7, 1564–1583. [Google Scholar] [CrossRef]
  27. Oliver, W.C.; Pharr, G.M. Measurement of hardness and elastic modulus by instrumented indentation: Advances in under-standing and refinements to methodology. J. Mater. Res. 2004, 19, 3–20. [Google Scholar] [CrossRef]
  28. Li, Q.-J.; Sheng, H.; Ma, E. Strengthening in multi-principal element alloys with local-chemical-order roughened dislocation pathways. Nat. Commun. 2019, 10, 3563. [Google Scholar] [CrossRef]
  29. Jian, W.-R.; Xie, Z.; Xu, S.; Su, Y.; Yao, X.; Beyerlein, I.J. Effects of lattice distortion and chemical short-range order on the mechanisms of deformation in medium entropy alloy CoCrNi. Acta Mater. 2020, 199, 352–369. [Google Scholar] [CrossRef]
  30. Wu, Y.; Zhang, F.; Yuan, X.; Huang, H.; Wen, X.; Wang, Y. Short-range ordering and its effects on mechanical properties of high-entropy alloys. J. Mater. Sci. Technol. 2021, 62, 214–220. [Google Scholar] [CrossRef]
  31. Antillon, E.; Woodward, C.; Rao, S.I.; Akdim, B.; Parthasarathy, T.A. Chemical short range order strengthening in a model FCC high entropy Alloy. Acta Mater. 2020, 190, 29–42. [Google Scholar] [CrossRef]
  32. Yang, X.; Xi, Y.; He, C.; Chen, H.; Zhang, X.; Tu, S. Chemical short-range order strengthening mechanism in CoCrNi medium-entropy alloy under nanoindentation. Scr. Mater. 2022, 209, 114364. [Google Scholar] [CrossRef]
  33. Mathiou, C.; Kyrtsidou, K.; Georgatis, E.; Karantzalis, A.E. Primary nano-indentation assessment of low entropy NiAl-Cr alloys. SOJ Mater. Sci. Eng. 2022, 10, 1–15. [Google Scholar]
  34. Zhao, J.; Wang, F.; Huang, P.; Lu, T.; Xu, K. Depth dependent strain rate sensitivity and inverse indentation size effect of hardness in body-centered cubic nanocrystalline metals. Mater. Sci. Eng. A 2014, 615, 87–91. [Google Scholar] [CrossRef]
Figure 1. Effect of preset depth and loading speed on the indentation hardness Hit.
Applsci 14 02752 g001
Figure 2. Effect of preset depth and loading speed on the indentation modulus of elasticity Eit.
Applsci 14 02752 g002
Figure 3. Effect of preset depth and loading speed on the indentation absorbed elastic energy nit.
Applsci 14 02752 g003
Figure 4. Graphical representation of the correlation matrix.
Applsci 14 02752 g004
Figure 5. Bar charts showing the results of the Random Forest analysis.
Applsci 14 02752 g005
Figure 6. The Partial Dependence Plots (PDPs) constructed in the present effort.
Applsci 14 02752 g006
Figure 7. Loading stage curves for preset depth 1000 nm: (a,b) loading speed 13.4 mN/s, (c,d) loading speed 4.4 mN/s, and (e,f) loading speed 2.24 mN/s.
Applsci 14 02752 g007
Figure 8. Loading stage curves for preset depth 1500 nm: (a,b) loading speed 13.4 mN/s, (c,d) loading speed 4.4 mN/s, and (e,f) loading speed 2.24 mN/s.
Applsci 14 02752 g008
Figure 9. Loading stage curves for preset depth 2000 nm: (a,b) loading speed 13.4 mN/s, (c,d) loading speed 4.4 mN/s, and (e,f) loading speed 2.24 mN/s.
Applsci 14 02752 g009
Figure 10. (a) typical diagram of creep depth (hcreep) as a function of the holding time and (b) typical curve of l n 1 h d h d t as a function of l n H .
Applsci 14 02752 g010aApplsci 14 02752 g010b
Figure 11. The effect of different testing parameters on the net creep depth (hcreep).
Applsci 14 02752 g011
Figure 12. The effect of the different testing parameters on the maximum shear stress (τmax).
Applsci 14 02752 g012
Figure 13. The effect of the different testing parameters on the stress exponent n.
Applsci 14 02752 g013
Figure 14. The effect of the different testing parameters on the critical volume for dislocation nucleation (Vcr).
Applsci 14 02752 g014
Figure 15. Bar charts as the outcome of the Random Forest Regression analysis.
Applsci 14 02752 g015
Figure 16. Partial Dependence Plots (PDPs) for various output variables using an Artificial Neural Network (ANN) model.
Applsci 14 02752 g016
Figure 17. The matrix obtained by the linear correlation analysis.
Applsci 14 02752 g017
Table 1. Summary of the results of the effect of loading speed and preset depth on the hardness (Hit), the modulus of elasticity (Eit), and the elastic absorbed energy (nit).
Input VariablesOutcome Parameters
Overall Hardness HitIndentation Modulus of Elasticity EitFraction of the Elastic Absorbed Energy nit
Initial Indentation Depth (nm)Loading Speed (mN/s)HVEit (GPa)nit (%)
13.592924428.1
10004.494923528.9
2.2496324529
13.586426725.1
15004.489525526.3
2.2479922727.4
13.580025524
20004.479724624.5
2.2482622726.4
Table 2. ANOVA analysis results.
Output
Variable
Input Feature CategoryF-Valuep-ValueSignificant
1Output Eit (GPa)Loading Speed Category3.3060.108No
2Output Eit (GPa)Indentation Depth Category0.2750.769No
3Output HVIndentation Depth Category15.4430.004Yes
4Output HVLoading Speed Category0.0480.953No
5Output nit (%)Indentation Depth Category10.0030.012Yes
6Output nit (%)Loading Speed Category0.7080.530No
Table 3. Summary of the outcomes (peak hardness, maximum shear stress, strain rate exponent, strain rate sensitivity factor, critical volume for dislocation nucleation, and net creep depth) as a function of the different testing variables (preset depth, loading speed, and creep duration).
Testing VariablesMeasured Parameters (Outcomes)
Preset Depth (nm)Loading Speed (mN/s)Creep Duration (s)Peak Hardness (GPa)Maximum Shear Stress (GPa)Strain Rate ExponentStrain Rate Sensitivity FactorCritical Volume for Dislocation NucluationNet Creep Depth (nm)
H (GPa)τmax (GPa)nmV (nm3)h creep
13.5108.96181.724453.340.019140.1256422.02
308.37521.611842.2420.02590.1050830.74
10004.4108.52621.640670.3020.346360.1738415.98
308.27281.5922432.5060.061860.0832425.94
2.24107.96721.533477.2080.013280.2040611.86
307.9041.520846.8260.02250.1236624.08
13.5107.74421.4974.8120.014740.2035622.92
307.68421.496289.560.011641280.2419226.58
15004.4107.6371.469687.320.0116423130.2403616.04
307.79921.500689.980.0130499410.2416623.08
2.24107.8591.5122109.7720.010222610.2901211.18
307.65221.472262.7080.021740.16386822.42
13.5107.32481.409495.6360.0105002090.2756424.3
307.46021.435268.9960.0153636580.1939640.2
20004.4107.71661.4848113.8040.0087971070.3102414.5
307.31681.407697.9380.0109735420.278125.84
2.24107.49681.442480.7040.0155915840.22511.48
307.85441.511280.1840.0164515010.2146619.9
Table 4. ANOVA results.
Output VariableInput VariableSum of SquaresDegrees of FreedomF-Statisticp-Value
Output Critical volume for dislocation nucleationInput Creep duration (s)0.00413.7170.112
Output Critical volume for dislocation nucleationInput Loading Speed (mN/s)0.00312.5500.171
Output Critical volume for dislocation nucleationInput Preset Depth (nm)0.017115.7450.011
Output Maximum shear stress (Gpa)Input Creep duration (s)0.00211.2820.309
Output Maximum shear stress (Gpa)Input Loading Speed (mN/s)0.00010.1510.714
Output Maximum shear stress (Gpa)Input Preset Depth (nm)0.020111.3480.020
Output Net Creep Depth (nm)Input Creep duration (s)99.552121.2600.006
Output Net Creep Depth (nm)Input Loading Speed (mN/s)247.741152.9080.001
Output Net Creep Depth (nm)Input Preset Depth (nm)1.59110.3400.585
Output Peak Hardness (Gpa)Input Creep duration (s)0.06011.2910.307
Output Peak Hardness (Gpa)Input Loading Speed (mN/s)0.00710.1500.714
Output Peak Hardness (Gpa)Input Preset Depth (nm)0.527111.3070.020
Output Strain Rate Sensitivity FactorInput Creep duration (s)0.00010.0120.917
Output Strain Rate Sensitivity FactorInput Loading Speed (mN/s)0.00110.1270.736
Output Strain Rate Sensitivity FactorInput Preset Depth (nm)0.00711.4470.283
Output Strain rate ExponentInput Creep duration (s)475.58013.4790.121
Output Strain rate ExponentInput Loading Speed (mN/s)499.09313.6510.114
Output Strain rate ExponentInput Preset Depth (nm)1853.284113.5570.014
Disclaimer/Publisher’s Note: The statements, opinions and data contained in all publications are solely those of the individual author(s) and contributor(s) and not of MDPI and/or the editor(s). MDPI and/or the editor(s) disclaim responsibility for any injury to people or property resulting from any ideas, methods, instructions or products referred to in the content.

