
Assessment of the Performance of Oat Flakes and Pumpkin Seed Powders in Gluten-Free Dough and Bread Based on Rice Flour

Faculty of Food Science and Engineering, Dunarea de Jos University of Galati, 111 Domneasca Street, 800201 Galati, Romania
*
Author to whom correspondence should be addressed.
Appl. Sci. 2024, 14(8), 3479; https://doi.org/10.3390/app14083479
Submission received: 22 March 2024
/
Revised: 17 April 2024
/
Accepted: 19 April 2024
/
Published: 20 April 2024
(This article belongs to the Special Issue Functional Bakery Products: Technological, Chemical and Nutritional Modification)
Abstract
:The performance of oat flake flour and pumpkin seed protein powder in gluten-free dough and bread based on rice flours was assessed in this study. After studying the thermo-mechanical properties of the rice and oat flake flours at different water absorption capacities, two composite flours obtained by mixing the rice and oat flake flours with and without pumpkin seed protein powder were investigated. Regardless of the sample subjected to thermo-mechanical behavior analysis, the increase in the water adsorption level when preparing the dough caused a decrease in protein weakening, as well as starch retrogradation. The dough with added oat flake flour had a higher resistance to kneading compared to the control prepared with rice flour. Additionally, the substitution of rice flour with oat flake flour produced important changes in the gelatinization temperature, which decreases from 84–86 °C to 76 °C. The addition of pumpkin seed protein powder increased the maximum torque during kneading at 30 °C and decreased breakdown and starch retrogradation compared to the composite flour based on rice flour and oat flake flour. The higher amount of water used for preparing the dough improved the specific volume and crumb firmness of the bread prepared with the pumpkin seed protein-enriched composite flours.
1. Introduction
Celiac disease has a rising incidence worldwide, with reported annual values in recent years of 21.3 people with celiac disease per 100,000 persons among children and 12.9 per 100,000 persons among adults [1]. Because of this high incidence, the need to ensure an appropriate diet for people with celiac disease has increased, a goal for which researchers and the food industry must closely collaborate. The most important problems faced by patients with celiac disease in ensuring a gluten-free diet are related to the scarce availability, rather low nutritional and sensorial quality, high cost, and safety of gluten-free foods, associated with possible cross-contamination [2].
Ensuring the nutritional and sensorial quality of these foods needs to start with an adequate selection of the ingredients based on valuable nutritional qualities and technological functionalities, while considering their compatibility within gluten-free blends. Most often, gluten-free bakery products are obtained from composite flours based on cereal or/and pseudocereal flours and other ingredients such as starch, protein, and dietary fibers from different sources [3].
Rice flour is known to be a basic ingredient for baking gluten-free products. Because of the hypoallergenic properties of its proteins and its overall good digestibility [4,5], rice flour is considered the most suitable ingredient to be used as a base for gluten-free baking products, in spite of the poor technological and functional properties which are important for the overall quality of the final products. In addition, rice flour has nutritional limitations, residing in its low content of vitamins, minerals, and fiber [6].
Most of the people with celiac disease tolerate oats well [7]. Therefore, oats can be used as an ingredient in gluten-free products, but their label must include the mention of “OATS”. Because of its high content of nutrients, the oat grain is considered a functional ingredient. According to the USDA [8], the average values of the main chemical components per 100 g of oats are the following: carbohydrates 69.9 g, proteins 13.2 g, total dietary fibers 12.9 g, and lipids 6.31 g, varying with the genetic features and growing conditions of the oats. The major fraction of oat proteins consists of globulins (70–80%), and, compared to other cereals, this fraction, together with albumin, has a higher lysine concentration [9]. Oats have a low glycemic index because they include high amounts of resistant starch (25%), followed by slowly digestible starch (22%) and only a small amount of rapidly digestible starch (7%) [9]. The particularities of the pasting properties of oat starch are related to the shorter time needed to achieve peak viscosity and lower pasting temperatures [10]. Regarding dietary fibers, oats are a good source of soluble β-glucans (82% of the total β-glucans content of 3–8 g/100 g dry weight). The importance of oat β-glucan is reinforced by the EFSA health claims regarding balancing blood glucose, increasing fecal bulk, and reducing blood cholesterol [11]. Additional heart and vascular system health claims have been assigned to high amounts of unsaturated fatty acids, residing mainly in oat grain endosperm [9,11]. A wholegrain diet based on oats is also recommended because of its important contents of polyphenols and avenanthramides, with antioxidant and anti-inflammatory properties [11]. A limitation in the utilization of oat flour is related to its stability. Oat flour processing through fermentation, germination, defatting, and hydrothermal treatment proved to be efficient for improving its stability, whereas extrusion and treatments based on pulsed electric field or enzymes can additionally increase the antioxidant properties and soluble dietary fiber content of oat flours [9].
Pumpkins are rich in nutrients and compounds with human health-promoting benefits, such as proteins, peptides, amino acids, essential oils, fibers, pectins, vitamins, minerals, phenolic compounds with antioxidant activity, carotenoids, tocopherols, and phytosterols [12]. Of particular importance for producing functional food ingredients are pumpkin seeds because of their high content of oil, proteins, fibers, minerals, and phenolic compounds [12]. The main products obtained by processing pumpkin seeds are oil and proteins. According to Vinayashreea and Vasu [13], pumpkin seed protein isolates are rich in essential amino acids and have good functional properties, comparable to those of soybean protein isolates. Regarding their amino acid profile, pumpkin seed protein isolates have high amounts of Arg, Glu, and Gln, and their essential amino acids comply with the requirements of the FAO/WHO for pre-school children and adults. The major fraction of pumpkin proteins is globulins, about 68%, while the prolamin fraction is about 4% [14]. Pumpkin seed protein isolates offer the advantage of a low presence of antinutritional factors. Vinayashreea and Vasu [13] reported the absence of trypsin inhibitors in pumpkin seed protein isolates, while their amount of phytic acids and tannins was rather low.
The objective of this study was to evaluate the possibility of using oat flake flour and pumpkin seed proteins for improving the rheological properties of rice flour-based dough and gluten-free bread-making potential. The thermo-mechanical properties of the individual and composite flours at various water absorption levels was tested, as well as the physical-chemical properties of the gluten-free breads enriched with valuable compounds from oat flakes and pumpkin seed proteins.
2. Materials and Methods
2.1. Materials
Whole rice flour (distributed by Adam Vision SRL, Targu Mures, Romania), and oat flakes (Solaris Plant SRL, Bucharest, Romania) were purchased from the Galati market (Galati, Romania). The pumpkin seed protein powder was provided by Kuk SRL (Bucharest, Romania). Oat flake flour was obtained using a blade mill grinder (Bosch MKM6003, Gailingen, Germany).
2.2. Proximate Compositions
The proximate composition of whole rice flour (RF), oat flake flour (OFF), and pumpkin seed protein powder (PP) was assessed as follows: moisture content through the SR ISO 712:2005 method [15], ash content through the SR ISO 2171/2002 method [15], protein content by means of semimicro-Kjeldahl (Raypa Trade, R Espinar, SL, Barcelona, Spain), fat content using Soxhlet (SER-148; VELP Scientifica, UsmateVelate (MB), Italy) extraction, and the crude fiber content using the Fibretherm Analyser (C. Gerhardt GmbH & Co. KG, Königswinter, Germany). The starch content was finally calculated by subtracting, from 100 g of RF or OFF, the amount of compounds determined as indicated before.
2.3. Thermo-Mechanical Properties
The thermo-mechanical behavior of the dough prepared with RF, OFF, and flour blends consisting of RF and OFF with and without PP addition was determined using the Mixolab device (Chopin Technology, Villeneuve La Garenne, France). The RF + OFF blend was obtained by mixing RF with OFF in the ratio of 80:20. In the RF + OFF + PP blend, the RF:OFF:PP ratio was 65:20:15, such as to obtain a total protein content of the flour blend within the 15–20% range.
The Chopin+ protocol was used to investigate the thermo-mechanical behavior of the dough samples at different water absorption (WA) levels. All the investigated dough samples were prepared in the mixing bowl of the Mixolab device. The weight of the dough prepared in the Mixolab bowl was always 90 g per batch. The RF doughs were prepared using three WA levels of 65, 70, and 75%, while for the OFF-based dough samples WA levels of 70, 80, and 90% were considered. Larger WA levels of the OFF, compared to the RF, were considered due the higher amounts of total and soluble fibers in OFF [9,16,17]. The thermo-mechanical behavior of the dough samples obtained using the two composite flours, RF + OFF and RF + OFF + PP, were investigated at WA levels of 70 and 75%.
The torque values registered while running the Chopin+ protocol were used to assess the behavior of the proteins and starch within the investigated dough samples: maximum C1 torque during initial mixing at 30 °C; CS consistency of the dough measured after 8 min of mixing at 30 °C; minimum C2 torque associated with the thermal weakening of the proteins in the matrix; C3 and C4 torques related to starch gelatinization and the stability of the gel at high temperatures, respectively; and C5 registered when starch retrogradation occurred during the cooling phase [18,19]. Furthermore, starch gelatinization (pasting), breakdown, and starch retrogradation were estimated based on (C3-C2), (C3-C4), and (C5-C4) values, respectively. The mechanical weakening of the proteins (MWPs) and the thermo-mechanical weakening of the proteins (TMWPs) were calculated using the following equations:
2.4. Bread-Making Procedure and Bread Characterization
The baking test was carried out, as indicated by Patraşcu et al. [20], using the one-stage method to prepare the dough. The ingredients used for preparing the breads were 100 g flour (100 g RF; 80 g RF and 20 g OFF; 65 g RF, 20 g OFF, and 15 g PP), 1.5 g salt, 1.5 g sugar, 3 g fresh baker’s yeast (Rompak SRL, Pascani, Romania), and water according to the WA levels mentioned above for each type of flour.
A gas oven (Electrolux, Poland) was used to bake the breads for 35 min at 200 °C. Bread sample characterization was further carried out after equilibration to room temperature.
The specific volume of the breads was determined using the rapeseed displacement method SR 91:2007 [15]. Two slices selected from the center of each bread loaf were used to measure the crumb firmness, with the MLFTA apparatus (Guss, Strand, South Africa) fitted with a probe with ø 7.9 mm. The maximum force needed for a 25 mm wide penetration of the bread slices at a penetration speed of 5 mm/s and a trigger threshold force of 20 g was registered to estimate the crumb firmness.
The brightness (L*), redness (a*), and yellowness (b*) of the crumb were measured using the Chroma Meter CR-410 (Konica Minolta Inc, Tokyo, Japan) colorimeter. The total color difference (ΔE) obtained upon partial replacement of the RF by OFF and PP in the bread formulation was calculated as follows:
The color intensity was estimated by calculating chroma (C*) using Equation (4):
2.5. Statistical Analysis
The results of triplicate measurements were reported as the mean ± standard deviation. One-way ANOVA was applied using the Minitab 19 (Minitab Inc., State College, PA, USA) software to identify the significant differences among the samples. A post hoc analysis using Tukey’s method at a confidence of 95% was applied (p < 0.05).
3. Results and Discussion
3.1. Proximate Composition
The proximate composition of RF and OFF is presented in Table 1. The RF had a low protein content of 7.40% and a medium fiber content of 4.20%. RF was chosen as the basis for the gluten-free composite flour and bread due to its high content of starch and particular pasting properties. Significantly higher contents of protein (13.10%), fiber (9.80%), and fat (6.33%) were found in the OFF (Table 1). Because of the high protein concentration of 9–20% with respect to other gluten-free flours, Mao et al. [9] indicated that oat is a good source of low-cost protein. Additional reasons for choosing OFF in this study were related to its high fiber content and high antioxidant potential [21]. Finally, PP was selected as a vector for increasing the protein content of the composite flour consisting of RF and OFF.
3.2. The Thermo-Mechanical Properties of RF and OFF
The primary and secondary Mixolab parameters, registered while running the Chopin+ protocol, are presented in Table 2.
The investigation of the thermo-mechanical properties for RF and OFF was performed at different WA levels, decided based on the assumption that high dough consistencies are not necessary for gluten-free breads, as in the case of dough systems based of wheat [22]. Considering the higher fiber and protein contents but also the fact that the OFF had been obtained from extruded oats, the WA levels selected for the OFF were higher compared to those for the RF.
Analyzing the Mixolab parameters registered during mixing at 30 °C, it can be seen that WA increase caused a decrease in the C1 and CS values (Table 2). In the case of RF, the maximum value of C1 was 0.70 Nm at 65% WA and decreased to 0.29 Nm at 75% WA, while, in the case of OFF, the maximum value of C1 was 2.20 Nm, which decreased to 0.85 Nm at 90% WA. For the same WA level of 70%, the C1 registered for OFF was about 5.8 times higher compared to RF. In case of RF dough, the CS was significantly lower (p < 0.05) compared to the C1 for 75% WA; smaller differences between C1 and CS were found for WA levels of 65 and 70%. As a consequence, the MWP values increased with the WA (Table 2), suggesting that, at lower values of WA, the RF dough was more stable, having a higher resistance to kneading at a constant temperature of 30 °C. On the other hand, although WA increases caused the decrease in the C1 and CS values of the OFF dough, the dough was more stable at a WA level of 90%, because of the closer C1 and CS values, which resulted in a lower MWP (Table 2). These important differences between the behaviors of the OFF and RF doughs at increasing WA levels were most likely due to the different protein and fiber profiles and contents. OFF has higher protein and fiber contents than RF (Table 1). High-molecular-weight glutelins are the major protein fraction in milled rice, representing 79–93% of the total protein, followed by globulins (6–13%), albumins (4–6%), and prolamins (2–7%) [23]. The main proteins in oats are globulins (50–80%), followed by prolamins, albumins, and glutelins, representing 4–15%, 1–12%, and 10%, respectively, or the total proteins content [24,25]. Nonetheless, it is important to mention that their physicochemical properties are modified in oat flakes because of hydrothermal treatment and shearing. As mentioned by Gates [26], flaking changes the structure of oat groats, affecting the cell walls’ integrity. Moreover, because of the high shear and work inputs, damages in the starch granules and protein bodies have been noticed. In addition, Gu et al. [27] reported that the use of gelatinized oat flour with increased water absorption and swelling allowed them to obtain oat dough with an improved elastic behavior. The changes observed in the rheological behavior of the dough are related to the changes observed in the ratio between the main forces involved in stabilizing the matrix: a higher contribution of the hydrogen and covalent bonds and a lower participation of the hydrophobic and ionic interactions were reported in the dough samples based on gelatinized oat flour compared to the control dough.
Regarding the fiber content, it should be noted that oats have the highest content of β-glucans among all cereals, largely distributed in the endosperm cell wall (75%) [9]. The ratio between soluble and insoluble β-glucans as well as the properties of the soluble fraction of β-glucans suffer changes in oat flake flour compared to native oat flour. Torbica et al. [17] noted that oat flour prepared by hydrothermal pre-treatment needed a high water level for dough preparation, compared to native flour, such as to avoid obtaining a hard and sticky dough. A high level of WA improves the protein and carbohydrate network. An improvement in the functionality of the soluble fiber content was noted by Zhang et al. [28]. They studied the effect of oat bran extrusion on soluble fibers’ properties and reported an improvement in water-related properties like solubility, solvent retention capacity, swelling ability, and apparent viscosity. In addition, the presence of resistant starch most likely influences the level of water addition needed during kneading. Oats have a high resistant starch content [9], which increases during extrusion as a result of shearing and the thermal treatment meant to improve the gelatinization, retrogradation, and recrystallization properties of the starch [29].
In the second phase of the Mixolab curves, characterized by temperature increases while keeping the dough’s mixing constraint, a torque decrease in all the tested dough samples was noticed (Figure 1). Regardless of the tested flour type, the values of the minimum C2 torques varied significantly (p < 0.05) with the WA level (Table 2). The C2 of the RF-based dough decreased from 0.33 to 0.11 Nm, and from 1.20 to 0.59 Nm in case of the OFF-based dough, with the increase in the WA level. An important decrease in the TMWP from 50.01 to 23.97% with a WA level increase from 65% to 75% was registered in case of the RF dough samples, whereas no significant differences were noticed in the case of the OFF dough (Table 2). These differences between RF and OFF dough behavior might be partially assigned to the differences regarding the quality of the proteins from the two sources. In addition, considering the important changes regarding the properties of the main oat constituents occurring during flaking, as discussed before, the influence of the way in which water is bound within the dough matrix during kneading at 30 °C [17] should not be neglected.
The results from Table 2 and Table 3, as well as from Figure 1, indicate very different behaviors of the starch in the two flours during heating and cooling. This behavior was determined, on the one hand, by the structural particularities of the starch of the two investigated cereals—rice and oats—and, on the other hand, by the modifications that the starch underwent during the oats’ flaking process. The size of starch granules is similar in the two cereals [10], and amylose has a similar molecular weight [30], but the amylopectin chains are longer in oats compared to rice [31]. For this reason, oat starch has unique pasting properties that require a shorter time to reach maximum gelatinization and a lower temperature at which this maximum is reached [10]. From Figure 1, it can be seen that C3 was achieved much faster (after 20 min) and at a lower temperature (67–71 °C) in the case of OFF, compared to RF (after 28 min, at 84–86 °C). The increasing WA level led to significantly lower C3 and C4 values (p < 0.05) in the case of both investigated flours (Table 2). However, the larger amount of water available in the dough system led to changes in starch gelatinization behavior, depending on the flour type: the WA increase caused a significant reduction in the (C3-C2) values in the RF-based dough (p < 0.05), whereas a significant increase in the (C3-C2) from 1 to 1.1 Nm (p < 0.05) was noticed when raising the WA level of the OFF dough from 80 to 90% (Table 2). The heat treatment applied during oat flakes’ processing influenced the pasting properties and the moisture of the OFF, limiting starch gelatinization. It was also found that the heat treatment during drying and steaming led to the decrease in the temperature and enthalpy of gelatinization, determined by differential scanning calorimetry, but also to the increase in the viscosity after pasting, and this could be explained by enzyme inactivation [26].
As can be observed in Figure 1 and Table 2, the breakdown (C3-C4) was significantly higher in OFF compared to RF, suggesting that gelatinized OFF starch had a lower stability to heating and kneading compared to RF. However, the (C3-C4) values registered for OFF (0.72–0.73 Nm at WA levels of 80 and 90%) were lower compared to those of native oat flour (1.01 Nm at 85% WA) [32].
3.3. The Thermo-Mechanical Properties of the Composite Flours
Table 3, as well as Figure 2, presents the results registered from the Mixolab curves corresponding to the dough samples prepared using the composite flours. The use of WA levels of 70 and 75% for preparing the doughs based on composite (RF + OFF) flour was decided upon analyzing the results of the investigations carried out on the individual flours.
The RF + OFF composite flour showed major differences in terms of C1, CS, and C2 compared to RF and OFF, as, in this area of the Mixolab curve, the largest differences between the three types of flours were observed. Briefly, by substituting 20% of the RF with OFF, s significant increase (p < 0.05) in C1, CS, and C2 (Table 3) was observed with respect to the RF (Table 2). This thermo-mechanical behavior of the dough based on composite flour was due to presence of higher amounts of protein and fiber in the OFF compared to the RF. The dough based on composite flour exhibited a higher resistance to kneading compared to the RF, as evidenced by lower MPW values (Table 3). The C2 value increase in the case of the RF + OFF samples could be attributed to the β-glucan intake from the OFF, with Duta et al. [33] reporting a positive correlation between protein weakening and β-glucan content. The TMWT increased relative to both the RF and the OFF, indicating that the dough presented a lower resistance to kneading and heating.
Regardless of the water absorption level, the addition of PP caused an increase in the C1 and CS values with respect to the RF + OFF composite flour, most probably as the result of high protein and fiber intakes from the PP which had been used to substitute 15% of the RF. Alshehry [34] noted that the ratio of insoluble-to-soluble fiber in pumpkin seed powder is 2:1, and this may explain the high C1 and CS values compared to the RF dough. Vinayashreea and Vasu [13] reported water holding capacity values of 1.29–1.35 mL/g for PP. They highlighted that the water-related properties of the proteins are influenced by intrinsic and extrinsic properties like structural properties of the proteins, namely, amino acid composition, conformation particularities, and surface hydrophobicity, protein concentration, temperature, pH, and ionic strength [13]. Regarding the particular influence of the secondary structure elements, Litvynchuk et al. [14] indicated that the α-helical content is mainly responsible for the viscosity of the dough. Analyzing the secondary structure of proteins from pumpkin seed protein isolates, Du et al. [35] observed the presence of 38.2% α-helix conformation, while Vinayashreea and Vasu [13] reported, for the water-soluble fraction in the protein isolate, the presence of 38.8% α-helical content, whereas the rest of the amino acids were organized as β-strands (17.7%), turns (8.4%), or random coils (35.0%). One could assume that kneading and the heat treatment resulted in structural changes in the proteins, causing the TMWT to increase from 42.15 to 47.52% in the case of the dough with a WA level of 70% and from 34.01 to 43.77% for the samples with a WA level of 75% (Table 3). Mechanical action, combined with the temperature increase, most likely caused disulfide bonds’ breaking, therefore exposing more sulfhydryl groups on the surface of the protein molecules. It should be noted that the C2 value was obtained at a temperature of about 53 °C, which was higher compared to that required for the RF + OFF composite flour, for which C2 was obtained at 49–50 °C.
Compared to the RF samples, the addition of OFF produced small effects on C3 but significantly decreased the (C3-C2) and increased the (C3-C4) (p < 0.05). These changes were due to the properties of starch and non-starch polysaccharides from the OFF. The dough with a WA level of 70% had higher C5 and (C5-C4) values compared to the sample with a WA of 75%. One could estimate that, in the dough prepared with 70% WA, the amount of water was insufficient to well hydrate the flour matrix rich in non-starch polysaccharides originating from the OFF. The addition of OFF also produced important changes in the gelatinization temperature, which decreased from 84–86 °C to 76 °C upon substituting 20% of the RF with the OFF. The addition of PP decreased the C3, (C3-C2), and (C3-C4) values compared to the RF + OFF (Table 2 and Table 3). The C3 decrease could also be attributed to the high lipid content of the PP (Table 1) but also to starch dilution by substituting 15% RF with the PP [4]. Marco and Rosell [4] reported a 23% decrease in C3, from 0.82 to 0.63 Nm, by substituting 13% RF with soy protein isolate at 95% WA. In the case of our experiment, the RF substitution with 15% PP resulted in a smaller C3 decrease, from 1.95 to 1.85 Nm, in the case of the dough prepared with a WA level of 70%, and from 1.81 to 1.66 Nm in the case of the samples with a WA level of 75%. These observations are in good agreement with Zheng et al. [36], who reported on the higher strength of the gel based on native pumpkin seed protein isolate compared to soybean or pea protein isolates.
PP addition to the RF + OFF composite flour caused a significant decrease in C5 and (C5-C4) (Table 4 and Table 5), which may be a good premise for using this high protein content composite flour for obtaining bakery products. When comparing the PP-containing dough samples with WA levels of 70 and 75%, one could observe that (C3-C2), (C3-C4), and C4 had very close values, while (C5-C4) was lower in the case of the dough with a higher amount of water. Therefore, one can expect a better crumb firmness quality from bread at a WA level of 75% compared to bread at a WA level of 70%.
3.4. Breads’ Characterization
The physical properties of the gluten-free bread samples prepared with composite flour with and without pumpkin seed protein powder are shown in Table 4 and Table 5.
The breads prepared with higher amounts of water presented higher specific volumes, regardless of the flour used. The specific volume was positively correlated with C2 (R2 of 0.787 and p < 0.05). The breads prepared with the composite flours (RF + OFF and RF + OFF + PP) presented lower values of specific volumes compared to the control breads prepared with the RF. Martinez et al. [37] also reported specific volume decrease when using extruded flour to replace 10% of rice flour in gluten-free breads’ formulation. Nonetheless, the specific volume of the breads prepared using the composite flours at a WA level of 75% was higher compared to the control bread with a lower amount of water (WA of 70%). Dabash et al. [38] reported the reduction in the specific volume of bread when partially substituting rice flour with pumpkin flour. They explained these results through the high fiber content derived from pumpkin flour, which weakened the dough structure, interfering with its ability to retain CO2 while baking. This observation is also supported by the study of El-Soukkari [39], who compared the effect of pumpkin seed meal and pumpkin protein isolate addition on the bread-making properties of wheat flour and reported a lower reduction in the specific volume of bread in the latter case.
No significant differences in terms of firmness were registered between the bread samples with a WA level of 70%, whereas at a higher WA level of 75%, RF substitution with OFF or OFF and PP had a stronger effect on crumb firmness, which increased significantly from 716.09 to 1263.38 g force (Table 4). Nonetheless, it should be noted that the firmness of the bread sample prepared with the RF + OFF + PP composite flour was better at WA 75% compared to WA 70%. The firmness of the bread prepared at 70% WA was correlated with C5 (R2 of 0.986 and p < 0.05), while the firmness of the bread with 75% WA was correlated with (C5-C4) (R2 of 0.997 and p < 0.05). Gallagher et al. [40] tested the effect of different levels of gluten-free flour substitution with various dairy protein products on the quality of the bread and indicated a significant crumb softness reduction compared to the control. Moreover, Patraşcu et al. [20] reported the important increase in crumb hardness when supplementing wholegrain rice flour with 15% soy protein concentrate or powdered egg. Gormley and Morrissey [41] reported that the addition of oat flakes to wheat flour supplemented with gluten resulted in an improvement in the specific volume and crumb firmness. Nonetheless, they reported a crumb firmness increase and a specific volume decrease for the sample with no gluten addition. The authors explained away these results by the large particle size of the oat flakes compared to that of wheat flour, with the presence of higher amounts of gluten being able to blur their effect. Additionally, Huttner et al. [42] investigated the bread-making potential of different oat varieties and found that the most important differences in bread quality were related to the crumb properties.
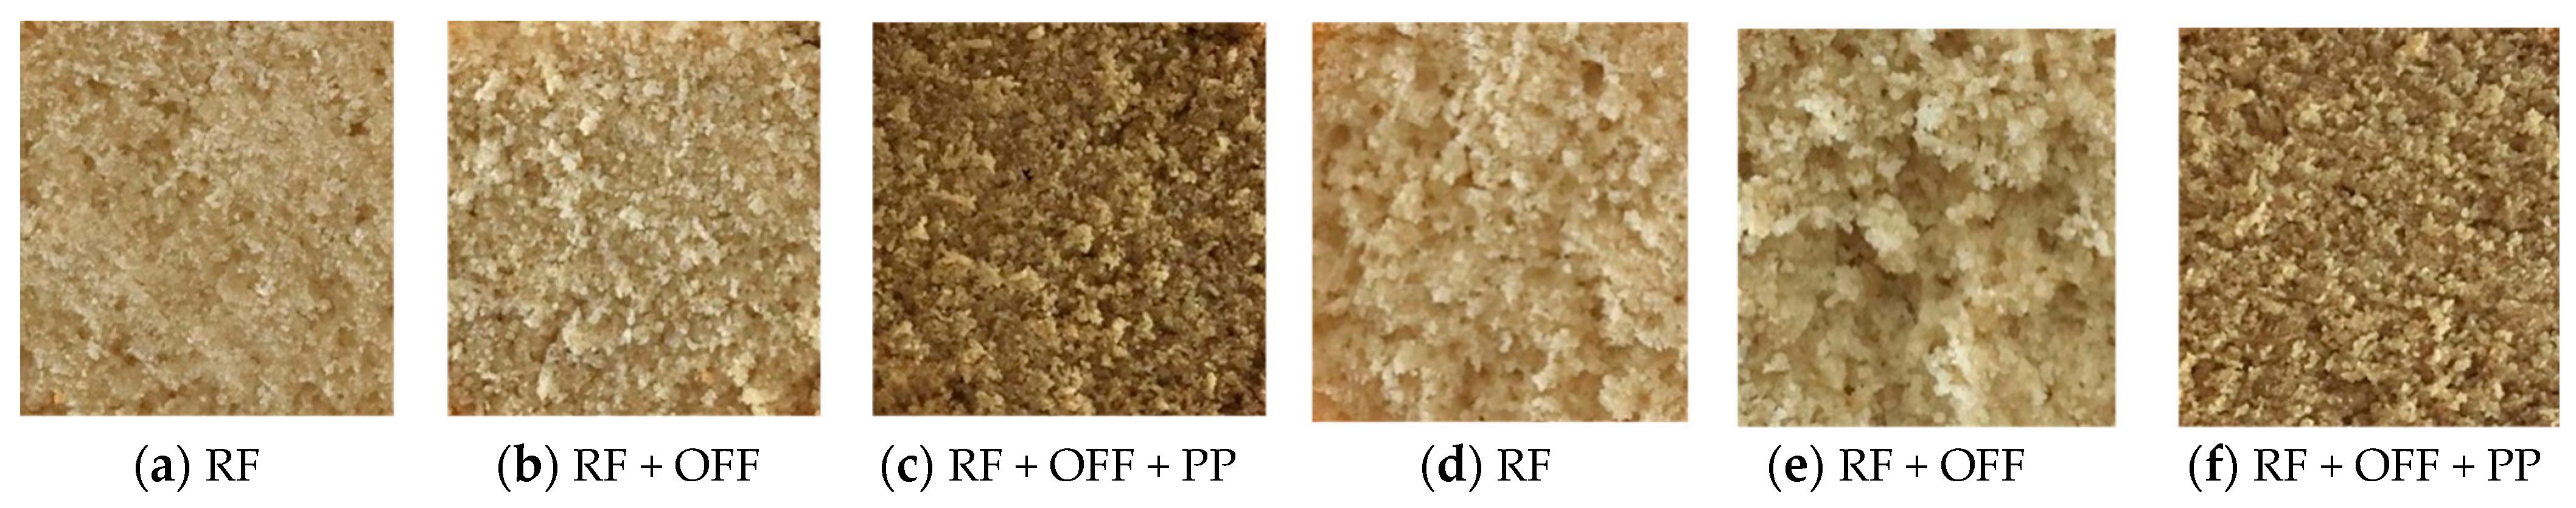
Regardless of the WA level used for dough preparation, the substitution of RF with OFF and PP significantly decreased the brightness (L*) (p < 0.05) and increased the redness (a*) and yellowness (b*) (p < 0.05) of the gluten-free breads (Table 5, Figure 3). Our results are in good agreement with those of Belc et al. [43], who tested the quality of high-protein breads and reported significant darkness, redness, and yellowness increases when incorporating soy and pea protein concentrates at various levels, ranging from 5 to 15%, into the wheat flour. The color difference (ΔE) between the control breads, prepared with RF, and the breads with RF + OFF was 5.53–5.72, which is visible to the human eye [38]. The ΔE significantly increased to 17.70–17.29 (p < 0.05) when PP was used in the composite flour’s formulation. These differences were mainly due to the L* values, even though OFF addition induced a more pronounced red tone (higher a* values), and PP contributed to the yellow tone’s intensification (higher b* value) compared to the RF. The color intensity (C*) increased when increasing the percentage of RF substituted by OFF and OFF + PP, with higher values being obtained in the case of the bread samples prepared with higher amounts of water (WA of 75%).
4. Conclusions
The influence of oat flake flour and pumpkin seed protein powder addition on the thermo-mechanical and bread-making performance of rice flour was investigated. The oat flake flour presented a higher maximum consistency during kneading at 30 °C and after 8 min of kneading at the same temperature and a lower mechanical weakening protein value compared to the rice flour. Moreover, the oat flake flour presented a higher breakdown and lower starch retrogradation compared to the rice flour. The substitution of rice flour with oat flake flour caused starch retrogradation decreases, with the breakdown being lower compared to that recorded for the oat flake flour. Pumpkin seed protein powder addition enhanced the thermo-mechanical protein weakening observed. In addition, decreases in starch gelatinization, breakdown, and starch retrogradation were observed when substituting rice flour with pumpkin seed protein powder. The breads prepared with higher amounts of water presented better specific volumes and crumb firmness.
Author Contributions
Conceptualization, I.A. and I.B.; methodology, I.B.; validation, I.A.; formal analysis, I.B.; investigation, I.B. and I.A.; writing—original draft preparation, I.B.; writing—review and editing, I.A.; supervision, I.A. All authors have read and agreed to the published version of the manuscript.
Funding
This research received no external funding.
Data Availability Statement
Data are contained within the article.
Acknowledgments
The Integrated Center for Research, Expertise, and Technological Transfer in the Food Industry is acknowledged for providing technical support.
Conflicts of Interest
The authors declare no conflicts of interest.
References
- Celiac Disease Foundation. Incidence of Celiac Disease Steadily Increasing. 2020. Available online: https://celiac.org/about-the-foundation/featured-news/2020/02/incidence-of-celiac-disease-steadily-increasing/ (accessed on 23 February 2023).
- See, J.A.; Kaukinen, K.; Makharia, G.K.; Gibson, P.R.; Murray, J.A. Practical insights into gluten-free diets. Nat. Rev. Gastroenterol. Hepatol. 2015, 12, 580–591. [Google Scholar] [CrossRef] [PubMed]
- Badiu, E.; Aprodu, I.; Banu, I. Trends in the development of gluten-free bakery products. Ann. Univ. Dunarea Galati Fascic. VI-Food Technol. 2014, 38, 21–36. [Google Scholar]
- Marco, C.; Rosell, C.M. Breadmaking performance of protein enriched, gluten-free breads. Eur. Food Res. Technol. 2008, 227, 1205–1213. [Google Scholar] [CrossRef]
- Ghanghas, N.; Mukilan, M.T.; Sharma, S.; Prabhakar, P. Classification, composition, extraction, functional modification and application of rice (Oryza sativa) seed protein: A comprehensive review. Food Rev. Int. 2022, 38, 354–383. [Google Scholar] [CrossRef]
- Kadan, R.S.; Bryant, R.J.; Miller, J.A. Effects of milling on functional properties of rice flour. J. Food Sci. 2008, 73, 151–154. [Google Scholar] [CrossRef] [PubMed]
- AOECS. AOECS Standard for Gluten-Free Foods; Association of European Coeliac Societies: Brussels, Belgium, 2016. [Google Scholar]
- USDA. 2022. Available online: https://fdc.nal.usda.gov/fdc-app.html#/food-details/2261421/nutrients (accessed on 23 February 2023).
- Mao, H.; Xu, M.; Ji, J.; Zhou, M.; Li, H.; Wen, Y.; Wang, J.; Sun, B. The utilization of oat for the production of wholegrain foods: Processing technology and products. Food Front. 2022, 4, 28–45. [Google Scholar] [CrossRef]
- Punia, S.; Sandhu, K.S.; Dhull, S.B.; Siroha, A.K.; Purewal, S.S.; Kaur, M.; Kidwai, M.K. Oat starch: Physico-chemical, morphological, rheological characteristics and its applications—A review. Int. J. Biol. Macromol. 2020, 154, 493–498. [Google Scholar] [CrossRef] [PubMed]
- Smulders, M.J.M.; van de Wiel, C.C.M.; van den Broeck, H.C.; van der Meer, I.M.; Israel-Hoevelaken, T.P.M.; Timmer, R.D.; van Dinter, B.-J.; Braun, S.; Gilissen, L.J.W.J. Oats in healthy gluten-free and regular diets: A perspective. Food Res. Int. 2018, 110, 3–10. [Google Scholar] [CrossRef] [PubMed]
- Hussain, A.; Kausar, T.; Sehar, S.; Sarwar, A.; Ashraf, A.H.; Jamil, M.A.; Noreen, S.; Rafique, A.; Iftikhar, K.; Aslam, J.; et al. Utilization of pumpkin, pumpkin powders, extracts, isolates, purified bioactives and pumpkin based functional food products: A key strategy to improve health in current post COVID 19 period: An updated review. Appl. Food Res. 2022, 2, 100241. [Google Scholar] [CrossRef]
- Vinayashreea, S.; Vasu, P. Biochemical, nutritional and functional properties of protein isolate and fractions from pumpkin (Cucurbita moschata var. Kashi Harit) seeds. Food Chem. 2021, 340, 128177. [Google Scholar] [CrossRef]
- Litvynchuk, S.; Galenko, O.; Cavicchi, A.; Ceccanti, C.; Mignani, C.; Guidi, L.; Shevchenko, A. Conformational Changes in the Structure of Dough and Bread Enriched with Pumpkin Seed Flour. Plants 2022, 11, 2762. [Google Scholar] [CrossRef] [PubMed]
- SR ISO 712:2005, SR ISO 2171:2002 and SR 91:2007; Romanian Standards Catalog for Cereal and Milling Products Analysis. ASRO: Bucharest, Romania, 2008.
- Flander, L.; Salmenkallio-Marttila, M.; Suortti, T.; Autio, K. Optimization of ingredients and baking process for improved wholemeal oat bread quality. LWT-Food Sci. Technol. 2007, 40, 860–870. [Google Scholar] [CrossRef]
- Torbica, A.; Belovic, M.; Tomic, J. Novel breads of non-wheat flours. Food Chem. 2019, 282, 134–140. [Google Scholar] [CrossRef] [PubMed]
- Dubat, A.; Boinot, N. Mixolab Applications Handbook. Rheological and Enzymes Analyses; Chopin Technology: Villenueve, France, 2012; p. 14. [Google Scholar]
- Svec, I.; Hruskova, M. The Mixolab parameters of composite wheat/hemp flour and their relation to quality features. LWT-Food Sci. Technol. 2015, 60, 623–629. [Google Scholar] [CrossRef]
- Pătraşcu, L.; Banu, I.; Vasilean, I.; Aprodu, I. Effect of gluten, egg and soy proteins on the rheological and thermo-mechanical properties of wholegrain rice flour. Food Sci. Technol. Int. 2017, 23, 142–155. [Google Scholar] [CrossRef] [PubMed]
- Hüttner, E.K.; Dal Bello, F.; Arendt, E.K. Rheological properties and bread making performance of commercial wholegrain oat flours. J. Cereal Sci. 2010, 52, 65–71. [Google Scholar] [CrossRef]
- Cappa, C.; Lucisano, M.; Mariotti, M. Influence of Psyllium, sugar beet fibre and water on gluten-free dough properties and bread quality. Carbohydr. Polym. 2013, 98, 1657–1666. [Google Scholar] [CrossRef] [PubMed]
- Amagliani, L.; O’Regan, J.; Kelly, A.L.; O’Mahony, J.A. The composition, extraction, functionality and applications of rice proteins: A review. Trends Food Sci. Technol. 2017, 64, 1–12. [Google Scholar] [CrossRef]
- Boukid, F. Oat proteins as emerging ingredients for food formulation: Where we stand? Eur. Food Res. Technol. 2021, 247, 535–544. [Google Scholar] [CrossRef]
- Yue, J.; Gu, X.; Zhu, Z.; Yi, J.; Ohm, J.B.; Chen, B.; Rao, J. Impact of defatting treatment and oat varieties on structural, functional properties, and aromatic profile of oat protein. Food Hydrocoll. 2021, 112, 106368. [Google Scholar] [CrossRef]
- Gates, F. Role of Heat Treatment in the Processing and Quality of Oat Flakes; University of Helsinki: Helsinki, Finland, 2007. [Google Scholar]
- Gu, Y.; Qian, X.; Sun, B.; Wang, X.; Ma, S. Effects of gelatinization degree and boiling water kneading on the rheology characteristics of gluten-free oat dough. Food Chem. 2023, 404, 13471. [Google Scholar] [CrossRef] [PubMed]
- Zhang, M.; Bai, X.; Zhang, Z. Extrusion process improves the functionality of soluble dietary fiber in oat bran. J. Cereal Sci. 2011, 54, 98–103. [Google Scholar] [CrossRef]
- Huth, M.; Dongowski, G.; Gebhardt, E.; Flamme, W. Functional properties of dietary fibre enriched extrudates from barley. J. Cereal Sci. 2000, 32, 115–128. [Google Scholar] [CrossRef]
- Li, H.Y.; Wen, Y.Y.; Wang, J.; Sun, B.G. Relations between chain length distribution, molecular size, and amylose content of rice starches. Int. J. Biol. Macromol. 2018, 120, 2017–2025. [Google Scholar] [CrossRef] [PubMed]
- Li, H.Y.; Lei, N.Y.; Yan, S.; Gao, M.Y.; Yang, J.Y.; Wang, J.; Sun, B.G. Molecular causes for the effect of cooking methods on rice stickiness: A mechanism explanation from the view of starch leaching. Int. J. Biol. Macromol. 2019, 128, 49–53. [Google Scholar] [CrossRef] [PubMed]
- Banu, I.; Aprodu, I. Investigations on functional and thermo-mechanical properties of gluten free cereal and pseudocereal flours. Foods 2022, 11, 1857. [Google Scholar] [CrossRef] [PubMed]
- Duta, D.E.; Culetu, A. Evaluation of rheological, physicochemical, thermal, mechanical and sensory properties of oat-based gluten free cookies. J. Food Eng. 2015, 162, 1–8. [Google Scholar] [CrossRef]
- Alshehry, G.A. Preparation and nutritional properties of cookies from the partial replacement of wheat flour using pumpkin seeds powder. World J. Environ. Biosci. 2020, 9, 48–56. [Google Scholar]
- Du, H.; Zhang, J.; Wang, S.; Manyande, A.; Wang, J. Effect of high-intensity ultrasonic treatment on the physicochemical, structural, rheological, behavioral, and foaming properties of pumpkin (Cucurbita moschata Duch.)-seed protein isolates. LWT-Food Sci. Technol. 2022, 155, 112952. [Google Scholar] [CrossRef]
- Zheng, L.; Wang, Z.; He, Z.; Zeng, M.; Qui, F.; Chen, J. Physicochemical and gel properties of pumpkin seed protein: A comparative study. Int. J. Food Sci. Technol. 2023, 58, 1639–1651. [Google Scholar] [CrossRef]
- Martinez, M.M.; Oliete, B.; Roman, L.; Gomez, M. Influence of the addition of extruded flours on rice bread quality. J. Food Qual. 2014, 37, 83–94. [Google Scholar] [CrossRef]
- Dabash, V.; Buresova, I.; Tokar, M.; Zacharova, M.; Gal, R. The effect of added pumpkin flour on sensory and textural quality of rice bread. J. Microbiol. Biotechnol. Food Sci. 2017, 6, 1269–1271. [Google Scholar] [CrossRef]
- El-Soukkary, F.A.H. Evaluation of pumpkin seed products for bread fortification. Plant Foods Hum. Nutr. 2001, 56, 365–384. [Google Scholar] [CrossRef]
- Gallagher, E.; Gormley, T.R.; Arendt, E.K. Crust and crumb characteristics of gluten free breads. J. Food Eng. 2003, 56, 153–161. [Google Scholar] [CrossRef]
- Gormley, T.R.; Morrissey, A. A note on the evaluation of wheaten breads containing oat flour or oat flakes. Ir. J. Agric. Food Res. 1993, 32, 205–209. [Google Scholar]
- Huttner, E.K.; Dal Bello, F.; Zannini, E.; Titze, J.; Beuch, S.; Arendt, E.K. Physicochemical properties of oat varieties and their potential for breadmaking. Cereal Chem. 2011, 88, 602–608. [Google Scholar] [CrossRef]
- Belc, N.; Duta, D.E.; Culetu, A.; Stamatie, G.D. Type and amount of legume protein concentrate influencing the technological, nutritional, and sensorial properties of wheat bread. Appl. Sci. 2021, 11, 436. [Google Scholar] [CrossRef]
Figure 1.
Mixolab curve of the dough samples prepared with rice flour (a) and oat flake flour (b) at various water absorption (WA) levels.
Figure 1.
Mixolab curve of the dough samples prepared with rice flour (a) and oat flake flour (b) at various water absorption (WA) levels.

Figure 2.
Mixolab curve of the dough samples prepared with composite flour consisting of 80% rice flour + 20% oat flake flour (RF + OFF) and 65% rice flour + 20% oat flake flour + 15% pumpkin seed protein powder (RF + OFF + PP). Measurements were carried out at water absorption (WA) levels of 70 (a) and 75% (b).

Figure 3.
Appearance of the crumbs of breads prepared at 70% WA with RF (a), RF + OFF (b), and RF + OFF + PP (c) and at 75% WA with RF (d), RF + OFF (e), and RF + OFF + PP (f).
Figure 3.
Appearance of the crumbs of breads prepared at 70% WA with RF (a), RF + OFF (b), and RF + OFF + PP (c) and at 75% WA with RF (d), RF + OFF (e), and RF + OFF + PP (f).


Table 1.
Proximate composition of rice flour (RF), oat flake flour (OFF), and pumpkin seed protein powder (PP).
Table 1.
Proximate composition of rice flour (RF), oat flake flour (OFF), and pumpkin seed protein powder (PP).
| Sample | Moisture, % | Proteins, % | Fat, % | Fiber, % | Ash, % | Carbohydrates, % |
|---|---|---|---|---|---|---|
| RF | 11.45 ± 0.01 a | 7.40 ± 0.10 c | 2.50 ± 0.08 c | 4.20 ± 0.10 c | 1.52 ± 0.02 a | 72.93 a |
| OFF | 11.35 ± 0.01 b | 13.10 ± 0.10 b | 6.33 ± 0.05 b | 9.80 ± 0.15 b | 1.49 ± 0.02 a | 57.86 b |
| PP | 9.55 ± 0.01 c | 62.15 ± 0.17 a | 12.67 ± 0.06 a | 12.90 ± 0.10 a | 0.62 ± 0.02 b | 2.11 c |
n.d.—not determined. Different superscript letters accompanying mean values in the same column indicate statistically significant differences at p < 0.05, based on Tukey’s post hoc test.
Table 2.
Primary and secondary Mixolab parameters of the dough prepared with rice flour (RF) and oat flake flour (OFF) at different water absorption (WA) levels.
Table 2.
Primary and secondary Mixolab parameters of the dough prepared with rice flour (RF) and oat flake flour (OFF) at different water absorption (WA) levels.
| Parameter/ Sample and WA | Rice Flour | Oat Flake Flour | ||||
|---|---|---|---|---|---|---|
| 65 | 70 | 75 | 70 | 80 | 90 | |
| Primary Mixolab parameters | ||||||
| C1, Nm | 0.70 ± 0.01 a | 0.38 ± 0.01 b | 0.29 ± 0.01 c | 2.20 ± 0.01 a | 1.49 ± 0.01 b | 0.85 ± 0.01 c |
| CS, Nm | 0.68 ± 0.01 a | 0.34 ± 0.01 b | 0.18 ± 0.01 c | 1.93 ± 0.02 a | 1.34 ± 0.01 b | 0.84 ± 0.02 c |
| C2, Nm | 0.33 ± 0.01 a | 0.19 ± 0.01 b | 0.11 ± 0.01 c | 1.20 ± 0.01 a | 0.86 ± 0.02 b | 0.59 ± 0.01 c |
| C3, Nm | 2.20 ± 0.01 a | 1.97 ± 0.01 b | 1.76 ± 0.02 c | 2.16 ± 0.01 a | 1.86 ± 0.02 b | 1.69 ± 0.01 c |
| C4, Nm | 2.16 ± 0.02 a | 1.92 ± 0.01 b | 1.69 ± 0.01 c | 1.33 ± 0.02 a | 1.13 ± 0.01 b | 0.97 ± 0.01 c |
| C5, Nm | 3.57 ± 0.02 a | 3.08 ± 0.02 b | 2.77 ± 0.02 c | 1.95 ± 0.01 a | 1.73 ± 0.02 b | 1.46 ± 0.02 c |
| Secondary Mixolab parameters | ||||||
| C3-C2, Nm | 1.87 ± 0.02 a | 1.78 ± 0.02 b | 1.65 ± 0.03 c | 0.95 ± 0.03 b | 1.00 ± 0.03 b | 1.10 ± 0.02 a |
| C3-C4, Nm | 0.04 ± 0.03 a | 0.05 ± 0.02 a | 0.07 ± 0.01 a | 0.82 ± 0.01 a | 0.73 ± 0.01 b | 0.72 ± 0.02 b |
| C5-C4, Nm | 1.41 ± 0.02 a | 1.16 ± 0.01 b | 1.08 ± 0.03 c | 0.62 ± 0.01 a | 0.60 ± 0.02 a | 0.49 ± 0.01 b |
| MWP, % | 3.32 ± 1.74 b | 10.46 ± 4.26 b | 38.57 ± 4.15 a | 12.42 ± 1.09 a | 10.09 ± 0.53 a | 1.57 ± 1.47 b |
| TMWP, % | 50.01 ± 0.58 a | 39.49 ± 3.79 b | 23.97 ± 3.53 c | 32.88 ± 1.25 a | 32.07 ± 0.46 a | 29.01 ± 2.31 a |
For a flour sample, different superscript letters accompanying means values on the same line indicate statistically significant differences at p < 0.05, based on Tukey’s post hoc test.
Table 3.
Primary and secondary Mixolab parameters of the dough prepared with composite flours at different water absorption (WA) levels. RF + OFF consisted of 80% rice flour and 20% oat flake flour, while RF + OFF + PP consisted of 65% rice flour, 20% oat flake flour, and 15% pumpkin seed protein powder.
| Parameter/ Sample and WA | RF + OFF | RF + OFF + PP | RF + OFF | RF + OFF + PP |
|---|---|---|---|---|
| 70 | 75 | |||
| Primary Mixolab parameters | ||||
| C1, Nm | 0.81 ± 0.02 b | 0.94 ± 0.01 a | 0.46 ± 0.01 d | 0.58 ± 0.02 c |
| CS, Nm | 0.80 ± 0.02 b | 0.93 ± 0.03 a | 0.43 ± 0.01 d | 0.56 ± 0.01 c |
| C2, Nm | 0.46 ± 0.02 a | 0.48 ± 0.01 a | 0.27 ± 0.01 b | 0.31 ± 0.02 b |
| C3, Nm | 1.95 ± 0.02 a | 1.85 ± 0.02 b | 1.81 ± 0.02 c | 1.66 ± 0.01 d |
| C4, Nm | 1.66 ± 0.02 a | 1.63 ± 0.02 a | 1.51 ± 0.01 b | 1.45 ± 0.02 c |
| C5, Nm | 2.88 ± 0.01 a | 2.52 ± 0.01 b | 2.38 ± 0.02 c | 2.18 ± 0.01 d |
| Secondary Mixolab parameters | ||||
| C3-C2, Nm | 1.50 ± 0.03 a | 1.37 ± 0.03 b | 1.54 ± 0.03 a | 1.35 ± 0.03 b |
| C3-C4, Nm | 0.30 ± 0.02 a | 0.22 ± 0.03 b | 0.30 ± 0.02 a | 0.21 ± 0.01 b |
| C5-C4, Nm | 1.21 ± 0.01 a | 0.88 ± 0.01 b | 0.87 ± 0.01 b | 0.73 ± 0.02 c |
| MWP, % | 1.19 ± 3.27 a | 1.42 ± 2.22 a | 7.25 ± 1.27 a | 3.33 ± 5.06 a |
| TMWP, % | 42.15 ± 4.17 a,b | 47.52 ± 2.15 a | 34.01 ± 3.79 b | 43.77 ± 5.48 a,b |
For a flour sample, different superscript letters accompanying mean values on the same line indicate statistically significant differences at p < 0.05, based on Tukey’s post hoc test.
Table 4.
Specific volume and firmness of the gluten-free bread samples prepared at different water absorption (WA) levels. RF + OFF consisted of 80% rice flour and 20% oat flake flour, while RF + OFF + PP consisted of 65% rice flour, 20% oat flake flour, and 15% pumpkin seed protein powder.
Table 4.
Specific volume and firmness of the gluten-free bread samples prepared at different water absorption (WA) levels. RF + OFF consisted of 80% rice flour and 20% oat flake flour, while RF + OFF + PP consisted of 65% rice flour, 20% oat flake flour, and 15% pumpkin seed protein powder.
| Bread Sample | WA, % | Specific Volume, cm3/g | Firmness, g Force |
|---|---|---|---|
| RF | 70 | 2.43 ± 0.03 a | 1366.03 ± 21.23 a |
| RF + OFF | 70 | 2.40 ± 0.02 a,b | 1414.64 ± 47.98 a |
| RF + OFF + PP | 70 | 2.34 ± 0.04 b | 1462.22 ± 43.35 a |
| RF | 75 | 2.84 ± 0.04 a | 716.09 ± 16.47 c |
| RF + OFF | 75 | 2.61 ± 0.04 b | 1007.44 ± 49.96 b |
| RF + OFF + PP | 75 | 2.47 ± 0.03 c | 1263.38 ± 37.21 a |
Different superscript letters accompanying mean values in the same column indicate statistically significant differences at p < 0.05, based on Tukey’s post hoc test.
Table 5.
Color characteristics of gluten-free bread samples prepared at different water absorption (WA) levels. RF + OFF consisted of 80% rice flour and 20% oat flake flour, while RF + OFF + PP consisted of 65% rice flour, 20% oat flake flour, and 15% pumpkin seed protein powder.
Table 5.
Color characteristics of gluten-free bread samples prepared at different water absorption (WA) levels. RF + OFF consisted of 80% rice flour and 20% oat flake flour, while RF + OFF + PP consisted of 65% rice flour, 20% oat flake flour, and 15% pumpkin seed protein powder.
| Bread | WA, % | L* | a* | b* | ΔE | C* |
|---|---|---|---|---|---|---|
| RF | 70 | 55.42 ± 0.02 a | 2.89 ± 0.01 c | 14.45 ± 0.04 c | - | 14.74 ± 0.03 c |
| RF + OFF | 70 | 49.98 ± 0.79 b | 3.06 ± 0.01 b | 15.38 ± 0.18 b | 5.53 ± 0.73 b | 15.68 ± 0.18 b |
| RF + OFF + PP | 70 | 37.87 ± 0.12 c | 4.66 ± 0.03 a | 15.91 ± 0.03 a | 17.70 ± 0.13 a | 16.58 ± 0.04 a |
| RF | 75 | 54.69 ± 0.09 a | 3.00 ± 0.01 c | 15.20 ± 0.01 c | - | 15.49 ± 0.01 c |
| RF + OFF | 75 | 49.01 ± 0.10 b | 3.18 ± 0.01 b | 15.90 ± 0.02 b | 5.72 ± 0.19 b | 16.21 ± 0.02 b |
| RF + OFF + PP | 75 | 37.49 ± 0.26 c | 4.43 ± 0.03 a | 16.21 ± 0.19 a | 17.29 ± 0.25 a | 16.81 ± 0.18 a |
Different superscript letters accompanying mean values in the same column indicate statistically significant differences at p < 0.05, based on Tukey’s post hoc test.
Disclaimer/Publisher’s Note: The statements, opinions and data contained in all publications are solely those of the individual author(s) and contributor(s) and not of MDPI and/or the editor(s). MDPI and/or the editor(s) disclaim responsibility for any injury to people or property resulting from any ideas, methods, instructions or products referred to in the content. |
© 2024 by the authors. Licensee MDPI, Basel, Switzerland. This article is an open access article distributed under the terms and conditions of the Creative Commons Attribution (CC BY) license (https://creativecommons.org/licenses/by/4.0/).
Share and Cite
MDPI and ACS Style
Banu, I.; Aprodu, I. Assessment of the Performance of Oat Flakes and Pumpkin Seed Powders in Gluten-Free Dough and Bread Based on Rice Flour. Appl. Sci. 2024, 14, 3479. https://doi.org/10.3390/app14083479
AMA Style
Banu I, Aprodu I. Assessment of the Performance of Oat Flakes and Pumpkin Seed Powders in Gluten-Free Dough and Bread Based on Rice Flour. Applied Sciences. 2024; 14(8):3479. https://doi.org/10.3390/app14083479
Chicago/Turabian StyleBanu, Iuliana, and Iuliana Aprodu. 2024. "Assessment of the Performance of Oat Flakes and Pumpkin Seed Powders in Gluten-Free Dough and Bread Based on Rice Flour" Applied Sciences 14, no. 8: 3479. https://doi.org/10.3390/app14083479
Note that from the first issue of 2016, this journal uses article numbers instead of page numbers. See further details here.