Article

Enhancing Wireless Sensor Network in Structural Health Monitoring through TCP/IP Socket Programming-Based Mimic Broadcasting: Experimental Validation

by
Srikulnath Nilnoree
1,
Attaphongse Taparugssanagorn
2,*,
Kamol Kaemarungsi
3 and
Tsukasa Mizutani
4
1
Structural Engineering, Department of Civil and Infrastructure Engineering, School of Engineering and Technology, Asian Institute of Technology, Pathum Thani 12120, Thailand
2
Department of Information and Communications Technologies, School of Engineering and Technology, Asian Institute of Technology, Pathum Thani 12120, Thailand
3
National Electronics and Computer Technology Center, National Science and Technology Development Agency, Pathum Thani 12120, Thailand
4
Institute of Industrial Science, The University of Tokyo, Komaba 4-6-1, Meguro-ku, Tokyo 153-8505, Japan
*
Author to whom correspondence should be addressed.
Appl. Sci. 2024, 14(8), 3494; https://doi.org/10.3390/app14083494
Submission received: 20 March 2024 / Revised: 18 April 2024 / Accepted: 18 April 2024 / Published: 20 April 2024

Abstract

:
This paper presents the implementation of a synchronous Structural Health Monitoring (SHM) framework utilizing wireless, low-cost, and off-the-shelf components. Vibration-based condition monitoring plays a crucial role in assessing the reliability of structural systems by detecting damage through changes in vibration parameters. The adoption of low-cost Micro-Electro-Mechanical Systems (MEMS) sensors in Wireless Sensor Networks (WSNs) has gained traction, emphasizing the need for precise time synchronization to schedule wake-up times of multiple sensor nodes for data collection. To address this challenge, our proposed method introduces a TCP/IP socket programming-based mimic broadcasting mechanism and a scalable sensing network controlled by a central gateway, leveraging the Raspberry Pi Python platform. The system operates using Internet of Things (IoT) concepts and adopts a star topology, where a packet is transmitted from the gateway to initiate measurements simultaneously on multiple sensor nodes. The sensor node comprises a MEMS accelerometer, a real time clock DS3231 module and Raspberry Pi Zero 2W (RPi0-2W), while the gateway employs a Raspberry Pi 4 (RPi4). To ensure accurate time synchronization, all Pi0-2W nodes were configured as Network Time Protocol (NTP) clients, synchronizing with an RPi4 server using chrony, the reliable implementation of the NTP. Through experimental evaluations, the system demonstrates its effectiveness and reliability in achieving initial time synchronization. This study addresses the challenge of achieving precise time alignment between sensor nodes through the utilization of the Dynamic Time Wrapping (DTW) method for Frequency Domain Decomposition (FDD) applications. The contribution of this research significantly enhances the field by improving the accuracy and reliability of time-aligned measurements, with a specific focus on utilizing low-cost sensors. By developing a practical and cost-effective SHM framework, this work advances the accessibility and scalability of structural health monitoring solutions, facilitating more widespread adoption and implementation in various engineering applications

1. Introduction

The domain of Structural Health Monitoring (SHM) is of paramount significance in the realm of infrastructure maintenance and management, driven by the urgent necessity for the efficient upkeep of essential structures, which serve as linchpins for both public safety and economic stability. SHM entails the continuous surveillance of structures to detect and evaluate potential damage or degradation, enabling proactive maintenance and minimizing the risk of structural failures. An essential facet of damage detection in structural systems involves the observation of changes in structural modal parameters, particularly natural frequencies. These modal parameters serve as invaluable indicators of potential damage within the structure.
Among the array of methodologies employed in SHM, vibration-based techniques have emerged as particularly favored, owing to their high sensitivity in discerning subtle structural alterations and their non-intrusive nature, rendering them ideally suited for long-term monitoring endeavors. Vibration-based methods in SHM utilize the inherent dynamic characteristics of structures to identify and quantify damage [1]. These methods rely on the measurement and analysis of vibration signals induced by external forces or internal excitations. In addition, vibration measurement plays a crucial role in non-invasive fault detection and prediction of rotating machine components [2].
Sensors play a pivotal role in acquiring accurate structural responses. Conventional force balanced accelerometers have been conventionally employed for capturing structural behavior [3]. However, recent advancements in sensor and measurement technology have introduced the adoption of fiber Bragg gratings [4] and fiber Bragg grating tiltmeters [5] to estimate fundamental characteristics of structural vibrations, such as primary natural frequencies. In the context of SHM systems, it is crucial to consider the optimal number of sensors required for effective monitoring [6].
Signal processing techniques are instrumental in analyzing vibration-based data to detect and assess structural abnormalities. By applying these techniques to vibration parameters, such as natural frequencies, mode shapes, and damping ratios, it becomes possible to extract valuable insights regarding the structural integrity [7]. In the case of non-stationary responses, the Hilbert-Huang Transform (HHT) and Empirical Mode Decomposition (EMD) have emerged as prominent techniques [8,9]. However, the adoption of traditional wired vibration monitoring systems can be hindered by high costs associated with sensors, data acquisition, and peripherals.
Over the past few decades, the Internet of Things (IoT) has emerged as a robust platform for wireless communications [10,11]. The integration of sensors and IoT in SHM has revolutionized the field by enabling remote and continuous data acquisition, real-time analysis, and proactive maintenance strategies. Compact embedded devices and low energy requirements have paved the way for Micro-Electro-Mechanical Systems (MEMS)-based vibration monitoring systems [12,13,14,15]. These systems have found applications in various research areas, including machine industries, civil infrastructures, earthquake engineering, and geotechnical engineering [16,17,18,19]. However, accurate measurement of a wide range of acceleration amplitudes poses a significant challenge in structural vibration analysis [16,20,21,22]. Despite this challenge, MEMS accelerometers have maintained their compact size, diverse range of models, and cost-effectiveness, making them highly suitable for structural monitoring applications [23,24,25,26,27].
On the other hand, ad hoc networks have garnered significant attention as they introduce a novel communication paradigm in recent decades [28]. These networks are characterized by decentralized wireless nodes that engage in collaborative interactions to achieve common objectives. This decentralized nature allows for enhanced flexibility and scalability in establishing and maintaining communication links. In the context of mobile ad hoc networks, which are highly dynamic and subject to frequent and unpredictable changes in network topology, several routing protocols have been proposed to address the associated challenges [29]. Furthermore, in the rapidly evolving landscape of heterogeneous IoT scenarios, proactive edge caching techniques have been rapidly developed to cater to the unique requirements of ad hoc networks [30]. However, one of the critical challenges in both IoT and ad hoc networks, including decentralized wireless networks, pertains to achieving accurate time synchronization among the network nodes [31,32].
In IoT and ad hoc networks, achieving time synchronization for SHM is particularly challenging due to several factors. Traditional approaches use Global Positioning System (GPS) receivers for synchronization, but power dependency and signal obstruction pose challenges [33,34,35]. In the realm of precise clock synchronization, the Precise Time Protocol (PTP), also known as IEEE 1588, emerges as a notable option [36]. PTP leverages standard network lines to provide hardware-level time accuracy. This is achieved through hardware-assisted time stamping, which effectively reduces the physical distance between the reference clock’s receive/transmit ports. However, it is important to consider that PTP requires additional hardware clocks and relies on packet exchange mechanisms [37].
An alternative approach is leveraging the Network Time Protocol (NTP) for synchronization [38,39,40,41]. NTP synchronization offers the advantage of leveraging existing network infrastructure, eliminating the need for additional hardware investments. It enables the synchronization of clocks across diverse devices, including computers, servers, and IoT devices. However, it is crucial to acknowledge that network disruptions or NTP server downtime can impact synchronization reliability. Additionally, network delays, packet loss, or congestion may affect synchronization accuracy. For a comprehensive comparison between NTP and PTP, an in-depth analysis can be found in [42]. In the scope of this research, NTP was selected as the preferred methodology for clock synchronization, primarily due to its straightforwardness and convenient implementation process that obviated the need for supplementary hardware clocks.
The analysis presented in Table 1 provides a comprehensive summary of the clock modules and wireless technologies employed in the relevant studies. It is important to note that the abbreviation “N/A” in Table 1 indicates that the number of end nodes participating in the synchronization test was not provided or specified.
The authors conducted a series of experiments to continuously retrieve time information from an NTP stratum 1 server using the ntplib library on a Raspberry Pi. The experimental procedure, described in Algorithm A1, involved performing a total of 100 measurements, repeated 10 times. However, five out of the ten experiments exhibited instability, indicating that ntplib is not robust for capturing the entire time axis in correlation with MEMS sensor vibration capture. The results of these experiments are summarized in Table A1 and visualized in Figure A1. Furthermore, each experiment revealed a time difference of approximately 2 s or more based on 100 readings from NTP. This corresponds to a sampling rate of approximately 50 Hz or less, which is insufficient for capturing the desired level of detail in the vibration data.
The deployment of a low-cost vibration-based SHM sensor network presents inherent challenges that need to be addressed. Although, Ref. [44] provides comprehensive details about the hardware and source code of the system in an open repository, there are still limitations in terms of transmission and local storage. Another major challenge arises from the need for simultaneous data collection from multiple sensors, especially at a high sampling rate exceeding 100 Hz, which is typical for vibration-based monitoring. Consequently, this results in the generation of large volumes of data, especially when considering the data recorded by multiple sensors on a given structure. Technical obstacles, such as data synchronization between nodes, network scalability, and efficient data transmission within the network, further compound the challenges.
This study builds upon previous research in the field, drawing inspiration specifically from the works of [39,40,41,43], which have provided valuable insights into the utilization of wireless sensor networks with NTP for synchronization purposes. Examining the findings presented in Table A1, we observe that this discrepancy results in a sampling rate of approximately 50 Hz or lower, which proves insufficient for capturing the desired level of detail in the vibration data. It is evident that relying solely on an NTP stratum 1 server may not ensure the robustness necessary to establish a dependable time axis for vibration-based monitoring. To address this limitation and achieve greater precision, we propose the implementation of a local NTP server powered by chrony [45,46], complemented by the incorporation of the DS3231 Real-Time Clock (RTC) module as a reliable time source. Integrating the DS3231 RTC module not only guarantees resilient timekeeping, especially during power outages but also enhances synchronization, thereby fortifying the platform’s robustness and reliability.
Nonetheless, a notable gap remains in the implementation of scheduled tasks to enhance the synchronous operation of sensors, as well as the development of a precise time-alignment method to ensure the reliability of acceleration time history data. Our research acknowledges the comprehensive examination of wireless network components conducted by Rocha et al. [44], which has contributed to advancements in the SHM applications. However, this previous work falls short in addressing the crucial aspect of transmission ability, central storage, and precise time alignment of acceleration time history data acquired from wireless sensor nodes.
To emphasize the novelty of our approach within our current understanding, this article addresses the issue of time synchronization and achieving precise time alignment among wireless sensor nodes while simultaneously managing scheduled tasks across all nodes. In response, we propose an innovative method for synchronous sensing that leverages TCP/IP socket mimic broadcasting. This approach capitalizes on the Python platform running on the Raspberry Pi. Our primary goal is to improve the accuracy and reliability of synchronized measurements, thereby advancing the accessibility and scalability of structural health monitoring solutions. We implement our approach using readily available electronic components. Additionally, we aim to provide comprehensive construction and programming instructions for this technique, establishing an open-source platform conducive to continuous updates and enhancements.
A key differentiator of our study from previous endeavors is the application of TCP/IP-based mimic broadcasting mechanisms for vibration-based SHM. We prioritize the effective utilization of affordable off-the-shelf sensors in this domain, rather than exclusively focusing on accuracy comparisons with high-grade accelerometers. Developed in Python, this mechanism ensures the reliability of transmitted data. Our article presents several significant contributions, including:
  • Effective scheduling and execution of measurement tasks:The proposed approach incorporates the use of multi-threading techniques during the data streaming process. The utilization of multi-threading enhances the scheduling and execution of measurement tasks, ensuring efficient data storage and management.
  • Synchronization mechanisms between nodes for accurate data alignment: A novel method for synchronous sensing, utilizing a mimic broadcasting mechanism, is presented to achieve the initial alignment of acceleration data from different sensor nodes. Additionally, NTP is implemented using chrony, while the DS3231 RTC module is employed to establish a temporal reference. This approach ensures the comprehensive and reliable collection of data from multiple end nodes and facilitates the initialization of a synchronized start schedule for multiple end nodes from a centralized gateway.
  • Scalability of the network to accommodate expanding sensor deployments: The proposed system offers a scalable solution for sensor deployments. The system allows for the flexible addition of end nodes to the network.
  • Seamless communication and networking capabilities: The integration of TCP/IP socket programming provides seamless communication and networking capabilities between the end nodes and the gateway. This integration ensures efficient data transmission and real-time monitoring of the sensor network. The comprehensive explanation of the implementation of socket programming is provided in detail.
  • Sufficient data storage capacity to manage the substantial volume of collected data: The implementation of multi-threading techniques enables simultaneous data storage on both the end nodes and the gateway’s local micro SD cards. This ensures the availability of ample data storage capacity to manage the substantial volume of collected data.
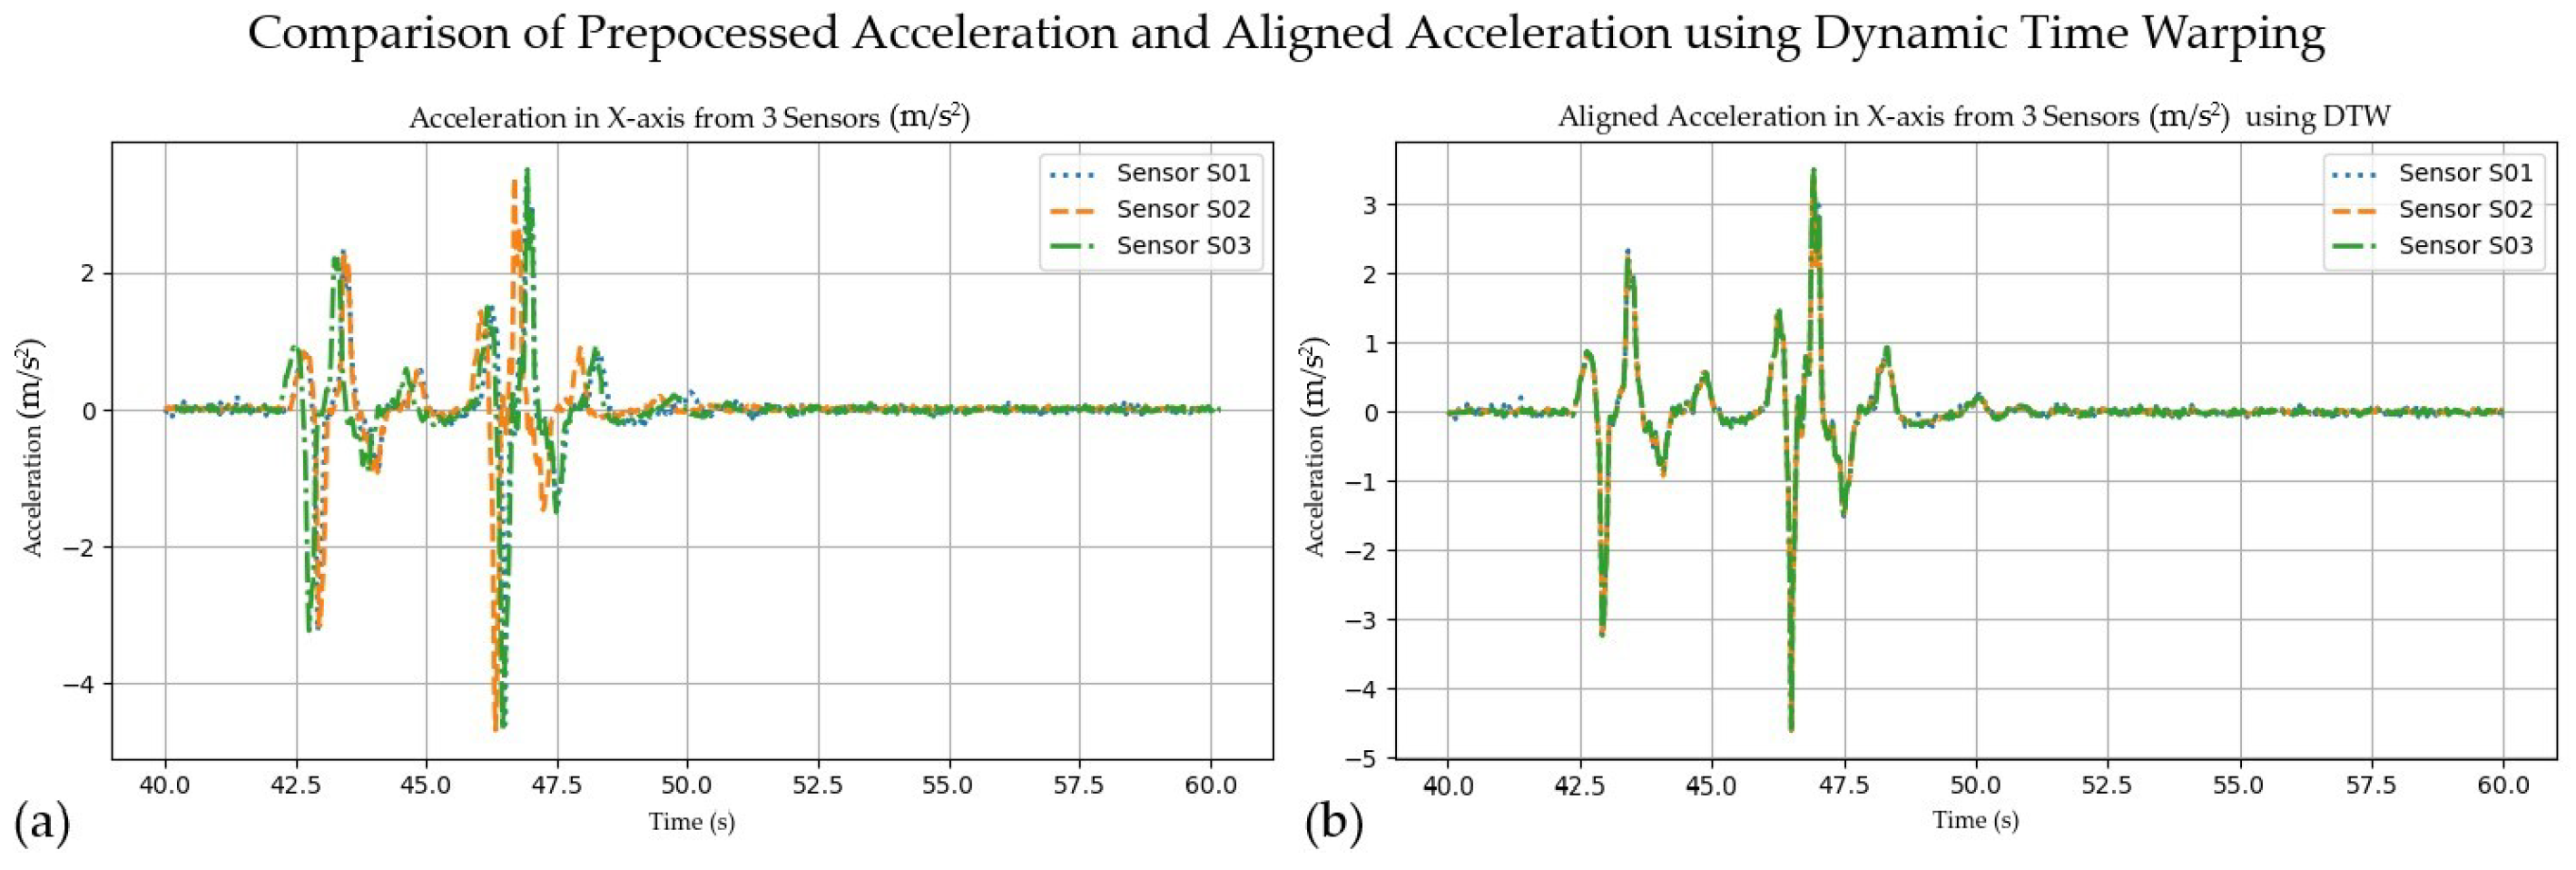
  • Precise time-alignment method for acceleration time history from wireless sensor nodes: This study underscores the significance of employing Dynamic Time Warping (DTW) for achieving precise time alignment in the context of Structural Health Monitoring (SHM) applications. DTW, originally introduced as dynamic programming by Sakoe and Chiba in 1978 [47], serves as a powerful technique for time optimization in time series data.
In conclusion, the establishment of a resilient infrastructure encompassing essential functions is vital in tackling the intricate challenges discussed. The present research endeavors to address these gaps by integrating and extending insights from previous studies, providing comprehensive solutions that effectively overcome identified limitations and facilitate further advancements in the field. By elucidating the methodology and guidelines outlined in this study, researchers and developers can leverage this platform to construct their own synchronized sensing systems. This approach effectively addresses the challenges associated with deploying low-cost vibration-based SHM sensor networks.

2. Materials and Methods

This section presents a detailed exposition of the components constituting the proposed low-cost wireless sensing platform, devised to facilitate the accurate measurement of vibrations with a high degree of synchronization. The platform leverages a TCP/IP-based mimic broadcasting mechanism as its core framework for efficient vibration monitoring. In order to enhance the reader’s understanding of the rationale for choosing TCP/IP sockets over IoT protocols, the details and advantageous aspects of TCP/IP sockets will be presented first. Furthermore, a comprehensive review of the requisite equipment for each end node is provided, accompanied by a detailed protocol for their setup.

2.1. Overview of IoT Protocols

In the context of IoT application protocols, including Extensible Messaging and Presence Protocol (XMPP), Constrained Application Protocol (CoAP), Data Distribution Service (DDS), Message Queuing Telemetry Transport (MQTT), and Advanced Message Queuing Protocol (AMQP), TCP and User Datagram Protocol (UDP) are the prevalent transport protocols employed [48,49,50]. However, in the realm of IoT applications, messaging protocols often provide additional functionality not offered by transport protocols like HyperText Transfer Protocol (HTTP) and WebSocket. Nonetheless, it is feasible to design an IoT system without relying on messaging protocols by developing application programs on a flexible transport protocol foundation like UDP and TCP [51]. In this study, which centers on vibration-based monitoring, TCP was chosen as the preferred protocol due to its crucial role in ensuring dependable data transfer from multiple end nodes to a centralized server.
Consideration of the architecture is crucial when selecting an IoT protocol for a specific application. IoT protocols can be broadly categorized as either Client-Server or Publish-Subscribe [52]. The MQTT protocol is widely recognized among TCP-based IoT protocols [53]. It is a lightweight messaging protocol specifically designed for IoT and Machine-to-Machine (M2M) communication. Operating on top of TCP/IP and utilizing a publish-subscribe messaging model, MQTT offers three levels of Quality of Service (QoS) to ensure message reliability. However, transmitting large acceleration data, such as in vibration monitoring, still poses a challenge [54].
WebSocket has gained popularity due to its ability to overcome communication obstacles imposed by restrictive firewalls commonly found in enterprise and institutional networks. It has been observed that WebSocket is more suitable for applications that require near-instantaneous Round Trip Time (RTT) [55]. This protocol provides a standardized solution for full-duplex communication between web browsers and servers, and it has found applications in various domains [54]. Several attempts have confirmed the stability of WebSocket as a reliable network solution in the context of vibration monitoring [38]. WebSocket is widely employed in web-based applications, particularly in scenarios that demand real-time or interactive communication.
On the other hand, plain sockets find utility in a broad spectrum of network applications, encompassing both web and non-web domains, where precise control and adaptability play a pivotal role. In light of the challenges associated with wireless networks for vibration-based SHM, this research leverages plain sockets for its networking requirements. Serving as a lower-level networking abstraction, plain sockets offer a general interface for network communication, affording flexibility and customizable capabilities that enable direct control over the communication process.

2.2. TCP/IP Socket

Socket programming, based on the TCP/IP protocol, serves as a foundational element in network communication. It encompasses two prevalent architectural patterns: the client-server architecture and the peer-to-peer architecture. This study focuses specifically on the client-server architecture, characterized by a hierarchical model where multiple clients establish connections with a central server to request services or retrieve information. At the core of socket programming lies the concept of a socket, which serves as an abstract representation of a network endpoint [56].
These functions encompass various essential aspects of socket communication, including (1) socket creation, (2) binding to specific addresses, (3) listening for incoming connections, (4) connecting to specific addresses, (5) accepting connections, (6) transmitting data, (7) receiving data, (8) closing connections, and (9) handling encountered errors. This robust set of functions provides the necessary capabilities for efficient and reliable socket-based communication.
Our objective of synchronizing the initiation of correct acceleration among all end nodes necessitates addressing the limitations of plain socket-based communication. While sockets lack native support for simultaneously broadcasting messages to multiple clients, it is feasible to implement a broadcasting mechanism by introducing additional functionality using plain sockets. This can be achieved by maintaining a list of connected clients on the server-side and iterative sending ’start’ message to each client individually. By adopting this approach, the server can effectively disseminate messages to multiple clients, simulating a mimic broadcasting behavior within the socket-based communication system.

2.3. System Description

The wireless sensing platform proposed in this study consists of two key components: a centralized gateway implemented as the server socket and end nodes implemented as client sockets. The gateway is deployed on a Raspberry Pi 4 (RPi4), whereas the end nodes utilize Raspberry Pi Zero 2W (RPi0-2W) devices. Each individual end node is responsible for initiating a single client connection.
In accordance with the discussion in Section 2.2, socket programming serves as the foundational framework for wireless communication, forming the backbone of the proposed system. Furthermore, the client sockets implemented on RPi0-2W devices are equipped with ADXL345 MEMS sensors and a DS3231 RTC module. The selection of the Raspberry Pi Zero 2W is driven by its compact size, microSD card slot, and versatile wireless capabilities, which include Bluetooth and WiFi. These inherent features empower the client sockets not only to collect data but also to store it locally, distinguishing them from conventional MicroController.

2.3.1. Sensor Node and Gateway Device

The sensor node utilized in the system incorporates an RPi0-2W device, which is a cost-effective solution. It is equipped with an ADXL345 MEMS accelerometer as depicted in Figure 1a, offering a 12-bit resolution for measurements ranging from ±2 g to ±16 g. The accelerometer demonstrates a sensitivity of 3.9 mg/LSB [57]. Additionally, to ensure precise timekeeping within the system, a DS3231 RTC module as depicted in Figure 1b is integrated into the sensor node. This choice is motivated by the fact that the RPi0-2W lacks an internal clock and experiences time loss during power outages. The DS3231 RTC module is a well-established component that has been employed in numerous prior research studies [44,58,59].
The selection of the ADXL345 accelerometer is motivated by its widespread use and proven effectiveness in various vibration applications. It has established itself as a versatile and reliable sensor. Varanis et al. conducted a study [16] highlighting the ADXL345’s capability to accurately measure vibrations within a frequency range below 45 Hz. This sensor has been successfully employed in spectral analysis and machine vibration monitoring due to its high-resolution measurements and accurate capture of vibration data [60,61]. Moreover, the ADXL345’s fast response and high accuracy make it valuable for achieving stable flight dynamics in drones [62]. It has also found extensive use in SHM for detecting structural changes, predicting failures, and advancing SHM techniques [63,64,65,66]. The study by Rehman et al. [67] demonstrated the superior capabilities of the ADXL345 accelerometer compared to a commercial accelerometer in terms of accuracy and reliability. Leveraging the availability of numerous open-source libraries and building upon previous research, this study employs the ADXL345 accelerometer for wireless vibration-based SHM, showcasing its suitability and effectiveness in this specific application.
The communication between the ADXL345 accelerometer and DS3231 RTC module with the RPi0-2W device is established using the Inter-Integrated Circuit (I2C) communication protocol as depicted in Figure 1c. The I2C protocol utilizes only two wires: the Serial Data Wire Line (SDA) and the Serial Clock Wire Line (SCL). Unlike parallel communication where multiple wires are used to transmit data simultaneously, I2C transfers data bit by bit sequentially along a single wire. It is worth mentioning that while I2C may be slightly slower compared to Serial Peripheral Interface(SPI), in the case of the ADXL345 sensor which supports both I2C and SPI communication, the use of I2C is adequate for the vibration-based SHM applications. In this study, the sampling rate was set at 100 Hz, which does not require high-speed data transfer. Therefore, the I2C communication protocol is sufficient for the intended purposes.
The selection of the RPi4, as depicted in Figure 1d, as a gateway or server in this study is based on its notable characteristics. The RPi4 is equipped with a robust 64-bit Quad-core Cortex-A72 processor, which offers advanced processing capabilities suitable for demanding tasks. Its dual Wi-Fi and Bluetooth connectivity further enhance its communication capabilities, allowing seamless interaction with other devices. Moreover, the inclusion of a micro HDMI port, supporting dual display functionality, adds to its versatility and suitability for the experimental test. These features enable efficient data transfer and convenient integration with monitors, facilitating the visualization. Therefore, considering its robust processing power, versatile connectivity options, and compatibility with monitors, the RPi4 serves as an optimal choice for the designated gateway or server role.

2.3.2. Server Socket

The server socket plays a central role in the system as the main node for data aggregation and storage. It receives data from multiple client nodes and consolidates the sensor readings. One of the key features of the server socket is its implementation of the mimic broadcasting mechanism. This mechanism enables the server to seamlessly distribute the ‘start’ message to all connected clients, allowing them to simultaneously begin collecting acceleration data from the ADXL345 sensor.
It is noteworthy that the terms ‘end node’ and ‘client’ as well as ‘gateway’ and ‘server’ are used interchangeably to refer to the same underlying concept. The former denotes the physical end node or physical gateway, while the latter represents the role of a client within the TCP/IP socket when connected to the server. Furthermore, it should be acknowledged that both the RPi4 and RPi0-2W can be accessed via Secure SHell (SSH), and in this research, they were controlled through SSH. Figure 2 illustrates the interaction between the server socket and multiple client sockets in the proposed system, showcasing the server-client communication utilizing mimic broadcasting to initiate all clients simultaneously.
To begin, the server socket establishes the address and port configuration for incoming client connections and generates a dedicated socket exclusively responsible for handling these connections. Subsequently, once the server socket is bound to the designated address, it initiates the process of monitoring incoming connections. The listen() function is utilized in server implementations to enable the server to accept these connections. In this particular study, the backlog parameter, which determines the number of end nodes to be connected to the server, is obtained through user input. Subsequently, this quantity of end nodes is utilized as the backlog parameter in the listen() function. When a connection request is received, the server utilizes the accept() function to accept the connection and create a client socket for communication. The server then enters a loop to continuously listen for more connections, allowing it to handle multiple clients concurrently.
Upon successful establishment of a connection from the individual client, the server-side interaction depicted in Figure 2 encompasses functionalities that align with the underlying operations of the server socket. The AF_INET address family is deliberately chosen to facilitate communication using the IPv4 protocol. Additionally, the SOCK_STREAM socket type is selected to establish a connection-oriented and reliable channel for seamless data transmission. Subsequently, the accept() function plays a pivotal role in establishing the connection between the server and the respective connected client. Subsequently, the server promptly transmits an acceptance message to the connected client, serving as an indication of successful communication initiation. This initial exchange of messages confirms the establishment of a reliable communication channel between the server and the client. Prior to our design program, the server actively retrieves the sensor name provided by each client, as denoted by the assignment statement (a) sensor_name = msg. This step assumes significance as it enables the server to associate the received data with specific clients, thereby facilitating accurate identification and differentiation of data sources.
Simultaneously, the server undertakes the creation of dedicated CSV files for each connected client, as illustrated by the notation (b) sensor_name.csv. By utilizing the unique sensor name as a criterion for organizing the collected data, the server ensures the segregation and proper categorization of measurements originating from distinct clients. To handle the data from each end node individually, the server creates a new thread for each connected client, as illustrated by the description (c) a new thread is created. To manage and keep track of all the clients that have successfully established a connection, the server stores the connection information in a list called “connected_clients”. This list, depicted in Figure 2 as the variable ‘conn’, serves as a repository to maintain the connections and facilitates the management of multiple simultaneous clients.
Once the desired number of end nodes is attained, as determined by the number of connected_clients, the server initiates the mimic mechanism by simultaneously dispatching a ‘start’ message to all connected clients. This operation can be achieved by maintaining a list of connected clients on the server-side and systematically transmitting the ‘start’ message to each client individually in a sequential manner. This initial synchronization of schedule messages enables the clients to commence the concurrent collection of acceleration data. As the clients transmit their respective data streams, the server, employing separate threads, diligently receives and meticulously stores the received data in their corresponding CSV files, with each client’s data being stored concurrently.

2.3.3. Client Socket

The client socket implementation on the RPi0-2W system, as elucidated in Section 2.3.1, encompasses key functionalities such as capturing vibration data with precise time synchronization, storing it in local CSV files, and transmitting it to the server socket via a TCP/IP socket connection. Each client, dedicated to an individual RPi0-2W end node device, diligently acquires continuous data from three axes ADXL345 accelerometers and obtains precise time readings from the DS3231 RTC module. This data acquisition process is initiated upon receiving a ‘start’ message from the server.
Upon the server-side entering the accept() process, as illustrated in Figure 2, the client socket is initiated, and the client socket creation is finalized during the initial stage on the client-side. Following this, the program prompts the user to provide the essential server IP address and port number. Specifically, the user is expected to input the server’s IP address and port number. These details are crucial for establishing a seamless connection between the client socket and the server socket. The connect() function is subsequently employed to establish the connection with the server socket, utilizing the provided server IP address and port number.
Similar to the server-side functionalities, an acceptance message is transmitted from the server to the connected client upon successful establishment of the connection. Subsequently, the user is prompted once again to provide the sensor name, which is then forwarded to the server. Concurrently, the client generates a corresponding CSV file named “sensor_name.csv” to locally store the acquired sensor data readings, as denoted by the assignment statement (a) a local .csv file is created.
Within the client-side implementation, a while loop is employed, utilizing the recv() function to wait for the receipt of the ‘start’ message from the server. Upon receiving the ‘start’ message, a new thread is spawned to retrieve sensor data and precise time, ensuring thread synchronization through the use of a lock. Additionally, another thread is created and initiated to manage the local CSV file and stream the acquired data to the server, as denoted by the assignment statements (b) A new thread is created to retrieve the sensor data and store into a sensor_data list and (c) Another thread is created to manage the local.csv file, respectively.

2.3.4. Synchronization Method

The research effectively utilized the chrony protocol and the DS3231 RTC module to establish highly accurate and synchronized time throughout the network. The configuration of the RPi4 gateway as a local NTP server, operating at stratum 1, allowed it to obtain precise UTC time from a reliable NTP server. Concurrently, all other RPi0-2W nodes in the network were appropriately configured as stratum 2 (by modifying chrony.conf [68]), enabling them to synchronize their time with the RPi4 gateway. Consequently, the RPi4 gateway served as a reliable source of synchronized time for all RPi0-2W nodes in the network. Moreover, the strategic utilization of the DS3231 RTC module as a redundant timekeeping mechanism ensured uninterrupted time synchronization across the network, particularly during instances of internet connectivity loss. Overall, these measures enhanced the precision and reliability of time synchronization within the network.

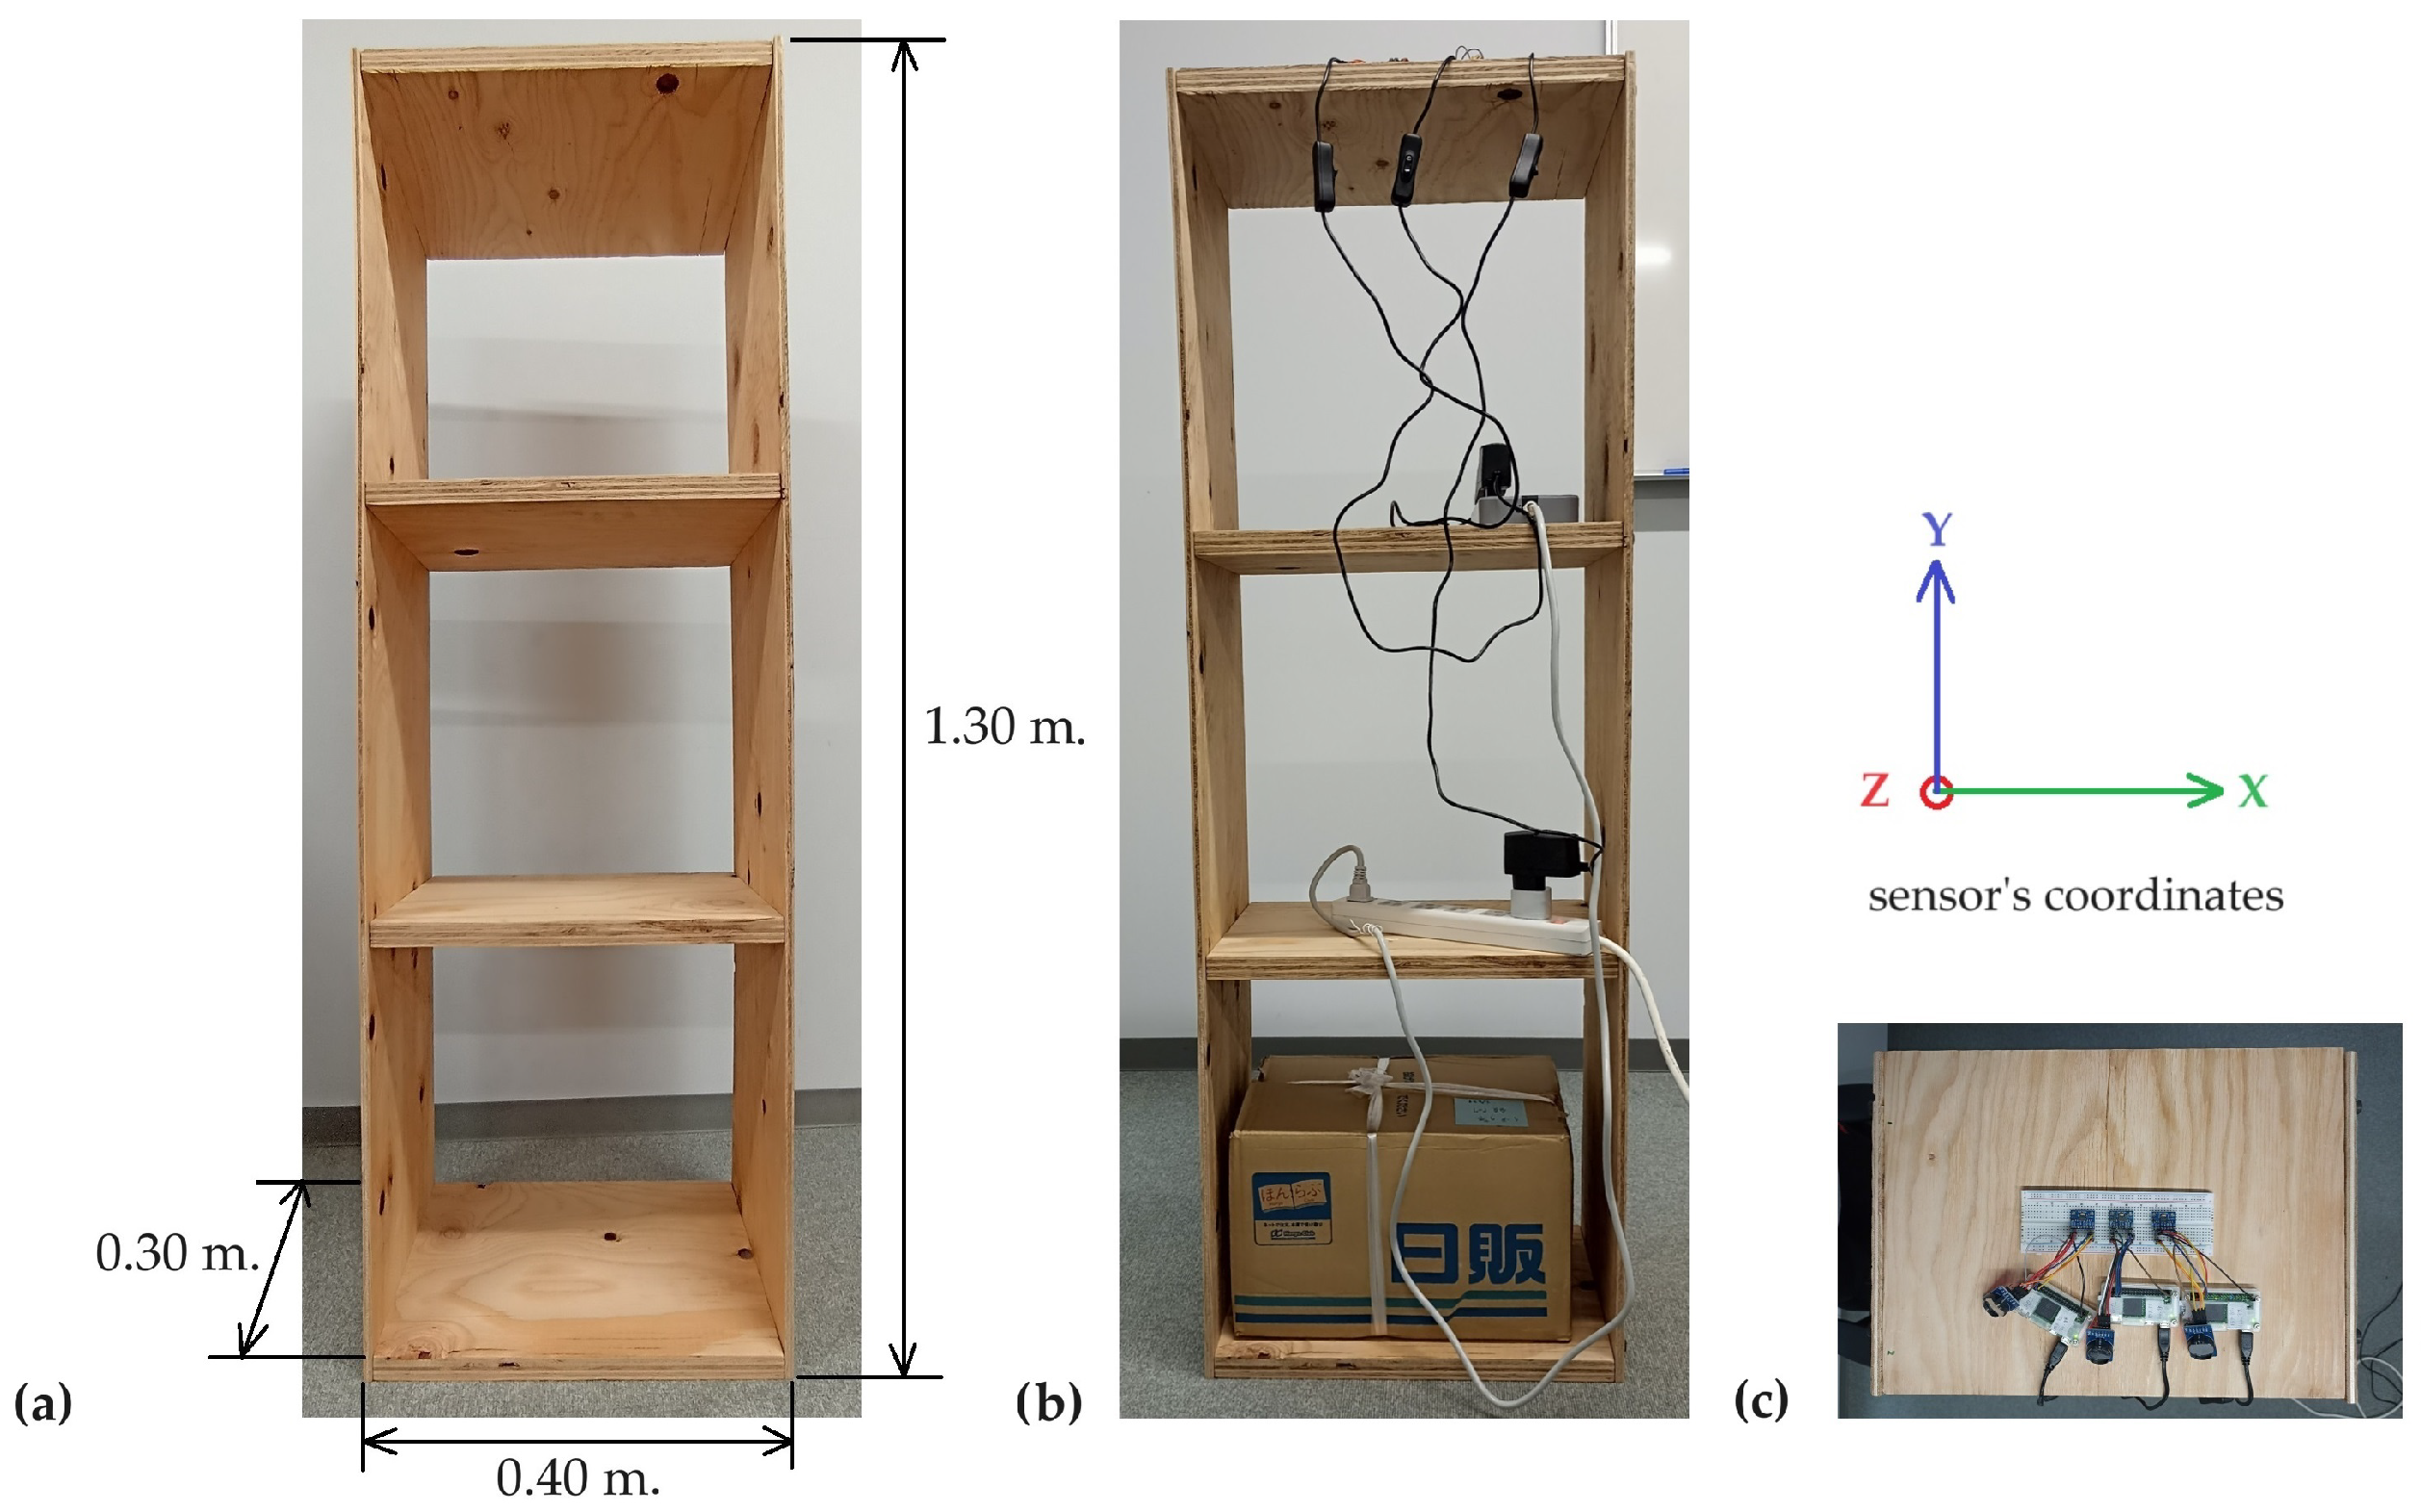
2.3.5. Experimental Setup and Verification

In light of the identified gaps in SHM applications, this article presents a comprehensive effort to bridge these gaps through the experimental exploration of a novel framework for synchronous wireless sensor networks. The research encompasses two primary experiments to validate the proposed framework: (i) synchronization validation and (ii) the application of Frequency FDD in Operational Modal Analysis (OMA) of a Three-Degree-Of-Freedom (3DOF) system. The vibration signals are resampled based on the optimal warping path obtained through DTW, leading to an improved spectrum of the resampled vibration signal [69]. This enhancement contributes to the effectiveness of the proposed framework in SHM applications.
The experimental setup for the proposed TCP/IP socket programming-based mimic broadcasting was evaluated through the experiment depicted in Figure 3. The main objectives of this experiment was twofold: first, to assess the system’s capability in achieving initial time synchronization among multiple end nodes, and second, to evaluate its wireless control functionality using SSH. Furthermore, the application of this framework in SHM scenarios, specifically in the context of DTW adaptive resampling [70,71] for FDD [72,73], is thoroughly examined.

Synchronization Validation

The first experimental investigation focused on a 3DOF system constructed from wood, with dimensions measuring 0.40 × 0.30 × 1.30 m, as depicted in Figure 4a. Wood was specifically chosen as the material for the 3DOF structure due to its characteristics, including lower stiffness and density compared to alternative materials such as light metals. Consequently, the wood structure exhibited a lower natural frequency. Additionally, the viscoelastic nature of wood imparted inherent damping properties, enabling effective energy dissipation and vibration reduction, thereby resulting in higher damping characteristics.
To ensure stability during the experiments, a 5 kg mass was added to the base floor of the 3DOF structures as shown in Figure 4b. This precautionary measure minimized any potential motion or vibrations that could affect the accuracy of the recorded data. To facilitate data collection, three end nodes were strategically positioned on the top storey of the 3DOF structure. The sensors were integrated onto the same breadboard, which was then securely affixed to the top of the 3DOF structure using commercial adhesive tape. The specific coordinates of the sensor arrangement are illustrated in Figure 4c.
To simulate dynamic loading conditions, several impacts were introduced to the side panel of the top storey. These impacts were carefully investigated and used to investigate time alignment between RPi0-2W sensor nodes. This allowed for the assessment of the system’s performance under varying external factors, further validating its synchronization capabilities in practical scenarios. The resulting acceleration responses recorded by the three RPi0-2W sensor nodes were analyzed and explored.

The Application of Frequency Domain Decomposition

In the second experiment depicted in Figure 5, the study adopts a distinct approach from conventional comparative studies that aim to evaluate the accuracy of low-cost sensors compared to commercial-grade sensors, which can pose challenges in real-life practical scenarios. Instead, our investigation focuses on meticulously utilizing low-cost sensors to differentiate between structural parameters in two distinct structures with varying stiffness properties.
Specifically, in the experimental setup, each RPi0-2W sensor node was carefully placed on a designated storey of the more rigid structure, which was distinguished by its full side panels (shown in Figure 5a). The sensor placement was intentionally altered at the center of each storey. Moreover, while the sensors were positioned at the same location, the partition side panel was used instead of the full side panel (shown in Figure 5b). To ensure secure attachment, commercial adhesive tape was employed to firmly affix the breadboard containing each sensor. The structural responses were captured by collecting data from the x-axis of the sensor nodes, as depicted in Figure 5c–e.
During the experimental sessions, the wood 3D structure was subjected to several impact loadings. To ensure the robustness and reliability of the findings, each data recording session lasted approximately 15 min to ensure an adequate experimental period. This collection of 3DOF structural responses from both sensor placement schemes allows for a comparative analysis to evaluate the quality of the collected data in terms of modal analysis results. Such analysis enables an assessment of the effectiveness and reliability of the collected data in capturing the structural response and modal characteristics of the system.
Figure 6 presents the schematic diagram of FDD process applied to raw low-cost acceleration data. The FDD scheme consists of five steps: (1) reading the raw data, (2) detrending and resampling the data, (3) selecting a window size that contains the impulse response, (4) refining the alignment using adaptive sampling DTW, and (5) performing the FDD analysis.
Achieving perfect time alignment of low-cost sensors is often unattainable. Nevertheless, the starting times provided by our proposed method serve as a valuable aid in the initial alignment. To overcome the challenge posed by imperfect temporal alignment, DTW is employed for time series alignment. The optimal warping path obtained through DTW can be regarded as the optimal temporal axis for point-wise alignment of the time series.
The time series signal from the j-th low-cost sensor is denoted as Y j = ( Y j [ 1 ] , , Y j [ N ] ) , with N representing the number of data points for sensor Y j . The processing of unevenly sampled acceleration data involves the two primary steps, i.e., detrending and resampling. To perform detrending, the mean value of the j-th sensor, denoted as μ j , is calculated as
μ j = 1 N i = 1 N Y j [ i ] ,
where Y j [ i ] is the i-th data point of the j-th sensor. Subsequently, this mean value μ j is subtracted from each data point of the j-th sensor, yielding the detrended discrete signal Y j , detrended [ k ] , given by
Y j , detrended [ k ] = Y j [ k ] μ j .
where Y j [ k ] represents the original signal from the j-th sensor and k denotes the index of the data point. This process removes any systematic trend or bias from the original data, resulting in a detrended signal suitable for further analysis or processing.
The second step involves the resampling of the data to a frequency of 100 Hz. In practical scenarios of this study, the sampling frequency of the low-cost sensor is typically set to 100 Hz. However, the actual time sampling may not be consistently stable as desired. Therefore, the original sampling rate, denoted as f original , j , is examined first before proceeding as follows:
  • If f original , j is greater than 100 Hz, the detrended signal Y j , detrended [ k ] is downsampled using the decimation method as
    Y j , downsampled [ k ] = Decimate ( Y j , detrended [ k ] , f original , j , 100 ) .
  • If f original , j is less than 100 Hz, the detrended signal Y j , detrended is upsampled using the interpolation method as
    Y j , upsampled [ k ] = Interpolate ( Y j , detrended [ k ] , f original , j , 100 ) .
The resulting signal, either the upsampled signal Y j , upsampled [ k ] or the downsampled signal Y j , downsampled [ k ] , is represented by Y j , resampled [ k ] . Consequently, a windowing approach is employed to focus on the segments surrounding the peak response. The windowed segments of Y j , resampled [ k ] and Y l , resampled [ k ] , denoted as Y j , window [ k ] and Y l , window [ k ] respectively, are defined as
Y j , window [ k ] = Y j , resampled [ k ] , if k [ k start , k end ] , 0 , otherwise ,
Y l , window [ k ] = Y l , resampled [ k ] , if k [ k start , k end ] , 0 , otherwise ,
where [ k start , k end ] represents the time window centered around the peak response. By selecting the same time window for both signals, the focus is directed towards aligning the corresponding segments that encompass the peak responses. Within this window, the original resampled signal is retained, while outside the window, the signal is set to zero. This process isolates the segments of interest for further analysis, ensuring that both signals are aligned and comparable within the specified window.
To align the windowed time series signals Y j , window [ k ] and Y l , window [ k ] , the DTW algorithm is employed. DTW quantifies the dissimilarity between two sequences by accounting for temporal warping. The algorithm determines an optimal warping path denoted as X = ( x 1 , x 2 , , x p , , x q ) . Each element x p represents a pair of indices ( m , n ) , where m and n correspond to an index in time series Y j , window [ k ] and Y l , window [ k ] , respectively. The DTW algorithm computes a distance matrix, often referred to as the two-dimensional cost matrix, denoted as D R ( N j + 1 ) × ( N l + 1 ) , where D [ m , n ] represents the cumulative distance between the m-th element of Y j , window [ k ] and the n-th element of Y l , window [ k ] given by
D [ m , n ] = d ( Y j , window [ m ] , Y l , window [ n ] ) + min D [ m 1 , n ] , D [ m , n 1 ] , D [ m 1 , n 1 ] ,
where d ( Y j , window [ m ] , Y k , window [ n ] ) represents the local distance or similarity measure between Y j , window [ m ] and Y k , window [ n ] and min is minimum function calculating the minimum value among the three values D [ m 1 , n ] , D [ m , n 1 ] , and   D [ m 1 , n 1 ] . The alignment between Y j , window [ k ] and Y l , window [ k ] can be obtained by tracing back the optimal path through the distance matrix D . For more comprehensive information on DTW, refer to [70,71].
After applying DTW, the aligned signals Y j , aligned [ k ] and Y l , aligned [ k ] can be obtained by warping the original signals based on the optimal alignment path. Implementing DTW allows for the alignment of the windowed time series signals, enabling further analysis of FDD for OMA applications.
FDD is a widely employed method in the field of structural dynamics and vibration analysis for extracting modal parameters from measured data [72,73]. FDD proves particularly valuable in scenarios where there is a lack of prior knowledge regarding excitation forces or precise boundary conditions. The theoretical validation of this method relies on the modal expansion of the structural response. In this study, the aligned signals Y j , aligned [ t ] from the j-th sensor is used in the FDD analysis.
Given a set of aligned signals Y j , aligned [ k ] , where j = 1 , 2 , , M represents the sensor index and k = 1 , , N represents the time (or discrete sample) index, and the aligned signals are stored in the matrix Y as
Y = Y 1 , aligned [ 1 ] Y 2 , aligned [ 1 ] Y M , aligned [ 1 ] Y 1 , aligned [ 2 ] Y 2 , aligned [ 2 ] Y M , aligned [ 2 ] Y 1 , aligned [ N ] Y 2 , aligned [ N ] Y M , aligned [ N ] .
Additionally, in modal expansion, the matrix Y , which contains the aligned signals with dimensions N × M , representing the time history records for each sensor, is expressed as
Y = Φ q [ k ] .
Each element Y j , aligned [ k ] represents the aligned signal value at discrete time index k for sensor j. The correlation matrix of the responses matrix Y , i.e.,  R Y Y [ τ ] is calculated as
R Y Y [ τ ] = E [ Y T Y ] = Φ R q q [ τ ] Φ T ,
where Y T denotes the transpose of the responses matrix Y . The Power Spectral Density (PSD) matrix S Y Y obtained by performing the Fast Fourier Transform (FFT), is given by
S Y Y [ ω ] = PSD ( R Y Y [ τ ] ) = Φ S q q [ ω ] Φ T .
The Singular Value Decomposition (SVD) of the PSD matrix at a specific radian frequency ω can be expressed as
S Y Y [ ω ] = U Σ V T ,
where S Y Y is the PSD matrix, U and V T are the left and right singular vectors matrices, and  Σ is the diagonal matrix of singular values (arranged in descending order). The singular values relate to modal responses, enabling the definition of spectra for equivalent SDOF systems with matching modal parameters. The resulting matrices, i.e.,  U , Σ , and  V T , provide valuable information about the dominant modes and their corresponding magnitudes. This simplifies complex MDOF systems by representing them with simpler SDOF systems, facilitating analysis and understanding of the system’s behavior at the given frequency.
By conducting these experiments, the proposed synchronous wireless sensor network framework and the application of FDD in SHM can be thoroughly evaluated and validated, providing valuable insights for future research and practical implementations in the field.

3. Experimental Results

This section provides a comprehensive overview of a series of experiments conducted to implement a novel synchronous wireless Structural Health Monitoring (SHM) framework. The framework utilizes wireless, low-cost, and readily available components. The primary objective of this study is to bridge the gap in the utilization of low-cost off-the-shelf sensors, shifting the focus from mere accuracy comparisons with high-grade accelerometers.
The initial validation involves assessing the performance of a TCP/IP socket programming-based mimic broadcasting mechanism. This mechanism aims to achieve initial alignment and ensure consistent performance across each low-cost sensor. This validation step is crucial for establishing the reliability and effectiveness of the wireless SHM framework.
Central to the employed framework for wireless communication is the TCP/IP socket programming-based mimic broadcasting. This framework serves as the backbone for data collection from three RPi0-2W sensor nodes. All nodes are controlled seamlessly through a personal computer using the SSH (Secure SHell) protocol. Notably, the operation of the RPi0-2W sensor nodes can be easily managed, with continuous operation halted upon user interruption via keyboard input. This wireless control mechanism offers convenient start and stop control of the sensor nodes.
Additionally, the section delves into the utilization of low-cost sensors in a Three Degrees of Freedom (3DOF) structure to differentiate between structural parameters in two distinct structures with varying stiffness properties. This investigation aims to shed light on the potential of low-cost sensors in effectively identifying and characterizing structural parameters. By showcasing the capability of low-cost sensors in discerning between different structural properties, the study underscores their practical utility in SHM applications. This contribution advances cost-effective monitoring solutions, fostering progress in the field of structural health monitoring.

3.1. Evaluation of Synchronization Performance

To validate the functionality of the proposed framework, a rigorous experimental evaluation was conducted. The responses from three sensor nodes, as depicted in Figure 4, were meticulously examined, following the explanation in Section 2.3.5. In this evaluation, the three RPi0-2W sensor nodes were subjected to identical impulse forces, generated by manually applying an external force to the side panel. Notably, the x-axis of all RPi0-2W sensor nodes was precisely aligned with the direction of the external force, ensuring that the 3DOF system predominantly vibrated in the x-direction.
Figure 7 illustrates the preprocessed raw acceleration responses obtained from the three RPi0-2W sensor nodes positioned at the top storey of the 3DOF structure. These responses were captured after applying a series of impulse forces to the top of the side panel of the 3DOF structure.
In Figure 7a, the preprocessed raw acceleration data is presented, obtained from the three sensor nodes positioned at the top storey of the 3DOF structure. The preprocessing steps involved detrending and 100 Hz resampling, implemented using Equations (1)–(4). Notably, the figure illustrates a remarkable alignment among the peaks of the impulse response, confirming the effectiveness of the synchronization mechanism employed in the study. Additionally, it is noteworthy that the aligned signals exhibit similar amplitudes, which further highlights the efficacy of the low-cost sensor capabilities. However, Figure 7b reveals a persistent milli to centisecond-level clock drift, despite configuring the chrony NTP client to synchronize with the NTP server and perform system clock adjustments for deviations exceeding 0.1 s. These observations emphasize the ongoing necessity for continuous monitoring and adjustment to address temporal inconsistencies, ensuring reliable synchronization over extended periods. Consequently, these findings underscore the importance of considering the complexities of time synchronization and the need for adaptive strategies to mitigate clock drift.
In addition to exploring the time domain characteristics, it is imperative to delve into the frequency domain attributes of the preprocessed signals. Figure 8 offers a comprehensive overview of the frequency domain analysis performed on these signals. Each row within the figure presents the time domain signal, the linear magnitude spectrum computed via FFT, and the spectrogram of each sensor, respectively. The magnitude spectrum was derived from the complete record using a Hanning window.
Upon meticulous examination, the analysis uncovers that the initial three peaks of all three sensors consistently center around frequencies ranging from 0.8 to 0.9 Hz, 1.26 to 1.28 Hz, and 1.6 to 1.7 Hz. This observation suggests the existence of coherent frequency components across the preprocessed signals. Furthermore, it’s noteworthy that the impulse forces exhibit a distinctive trait of being governed by a narrow-band frequency content, characterized by dominant frequencies concentrated within a limited range.
When examining the frequency qualities, specifically the magnitude spectrum and spectrogram, within the time interval from 40 s to 100 s with centered around the first five peaks of the record signals, it becomes evident that the consistent detection of the same frequency patterns, as depicted in Figure 9, is observed across the data obtained from three low-cost sensors. By narrowing the analysis to this specific time interval and examining the frequency content, it becomes apparent that the identified frequency patterns exhibit a remarkable level of consistency and display similar characteristics across the low-cost sensors.
A meticulous examination of the initial two peaks in the acceleration responses reveals a discernible millisecond drift between each peak. The primary objective of this research is to optimize the alignment path using DTW to enhance the quality of the time series data, as discussed in Section 2.3.5. In Figure 10, we present the results obtained from comparing the preprocessed acceleration and the aligned acceleration using DTW for three low-cost sensors. Figure 10a illustrates the time history of the preprocessed acceleration along the x-axis, while Figure 10b illustrates the time history of the aligned acceleration obtained using DTW.

3.2. Analysis of Precise Time Alignment Using DTW

As discussed, this study focuses on elucidating the utilization of low-cost sensors within a wireless SHM framework to accurately distinguish various structural parameters, such as natural frequencies. This is particularly relevant when the practicality of using high-grade reference accelerometers is limited. To validate the research objectives, two types of 3DOF structures, namely full side panel (denoted as Structure 1) and partition side panel (denoted as Structure 2), were selected for experimental analysis. The proposed scheme, illustrated in Figure 6, was utilized to conduct the experimentation and analyze the collected data.
The acceleration time history responses of the two structures for the initial 10-min duration are presented in Figure 11. Figure 11a displays the preprocessed acceleration time history of the full side panel (Structure 1), while Figure 11b exhibits the preprocessed acceleration time history of the partition side panel (Structure 2). Upon analyzing the response of the structures, it is evident that Sensor S03, positioned on the top storey, exhibits the highest magnitude of vibration. Conversely, Sensor S01, located on the first storey, demonstrates relatively lower levels of vibration.
Consequently, a meticulous segmentation process was conducted to isolate and analyze three prominent peaks within the preprocessed response data obtained from the two structures. This segmentation process is illustrated in Figure 12. Specifically, for Structure 1, the response data within the time interval of 25 s to 65 s was selected, as depicted in Figure 12a. Similarly, for Structure 2, the response data within the time interval of 35 s to 75 s was chosen, as shown in Figure 12b. It is important to note that the labels S01, S02, and S03 assigned to the sensors in the figures represent their respective positions on the 3DOF structure, indicating the first, second, and third storeys, respectively.
The windowed vibration signals obtained from the aforementioned process were further evaluated by calculating the magnitude spectrum to assess their frequency content. The analysis of Structure 1, conducted on the data collected from the three sensor nodes in each storey, revealed a dominant frequency range of approximately 1.40–1.50 Hz. In contrast, the analysis of Structure 2, based on the data obtained from the three sensor nodes in each storey, indicated a dominant frequency of approximately 1.25 Hz. This discrepancy in dominant frequencies can be attributed to the variation in stiffness between Structure 1 and Structure 2, with Structure 2 exhibiting lower stiffness compared to Structure 1.
Furthermore, the utilization of the DTW algorithm played a crucial role in computing the optimal warping path within the aforementioned 40-second duration. This process was instrumental in achieving precise synchronization among the segmented and preprocessed response data from the two distinct structures, resulting in an enhanced spectrum of the windowed vibration signal.
Importantly, this synchronization process ensured the accurate alignment of the windowed acceleration data and their corresponding magnitude spectra, leading to a significant improvement in coherence. The synchronized signals are clearly depicted in Figure 13. Figure 13a showcases the resampled acceleration data alongside its corresponding magnitude spectrum for Structure 1, highlighting the effectiveness of the alignment. Similarly, Figure 13b effectively demonstrates the resampled acceleration data and its corresponding magnitude spectrum for Structure 2, further illustrating the benefits of the synchronization process.
Figure 13a,b further illustrate the benefits of the synchronization process, highlighting the improved coherence and distinguishability of the synchronized signals. In particular, the magnitude spectra reveal distinct characteristics for each structure. Structure 1 exhibits its first peak around 1.50 Hz, while Structure 2 shows its first peak at approximately 1.25 Hz. This difference in dominant frequencies further emphasizes the contrasting nature of the two structures.
In addition to the magnitude spectrum analysis of Structure 1, illustrated in Figure 13a, two distinct peaks were observed in the frequency spectrum, indicating the presence of the first two fundamental frequencies of the structure. These frequencies were identified as 1.50 Hz and 3.15 Hz, representing the primary modes of vibration for Structure 1.
On the other hand, Figure 13b showcases the magnitude spectrum analysis of Structure 2, where multiple peaks at higher modes are observed. Specifically, a prominent peak can be identified at around 8.40–8.90 Hz, indicating the presence of a higher mode of vibration within Structure 2. Due to the lower stiffness, Structure 2 exhibits more pronounced deformations and larger displacements when subjected to dynamic loading. These larger displacements enable the higher-order modes to contribute significantly to the overall structural response.

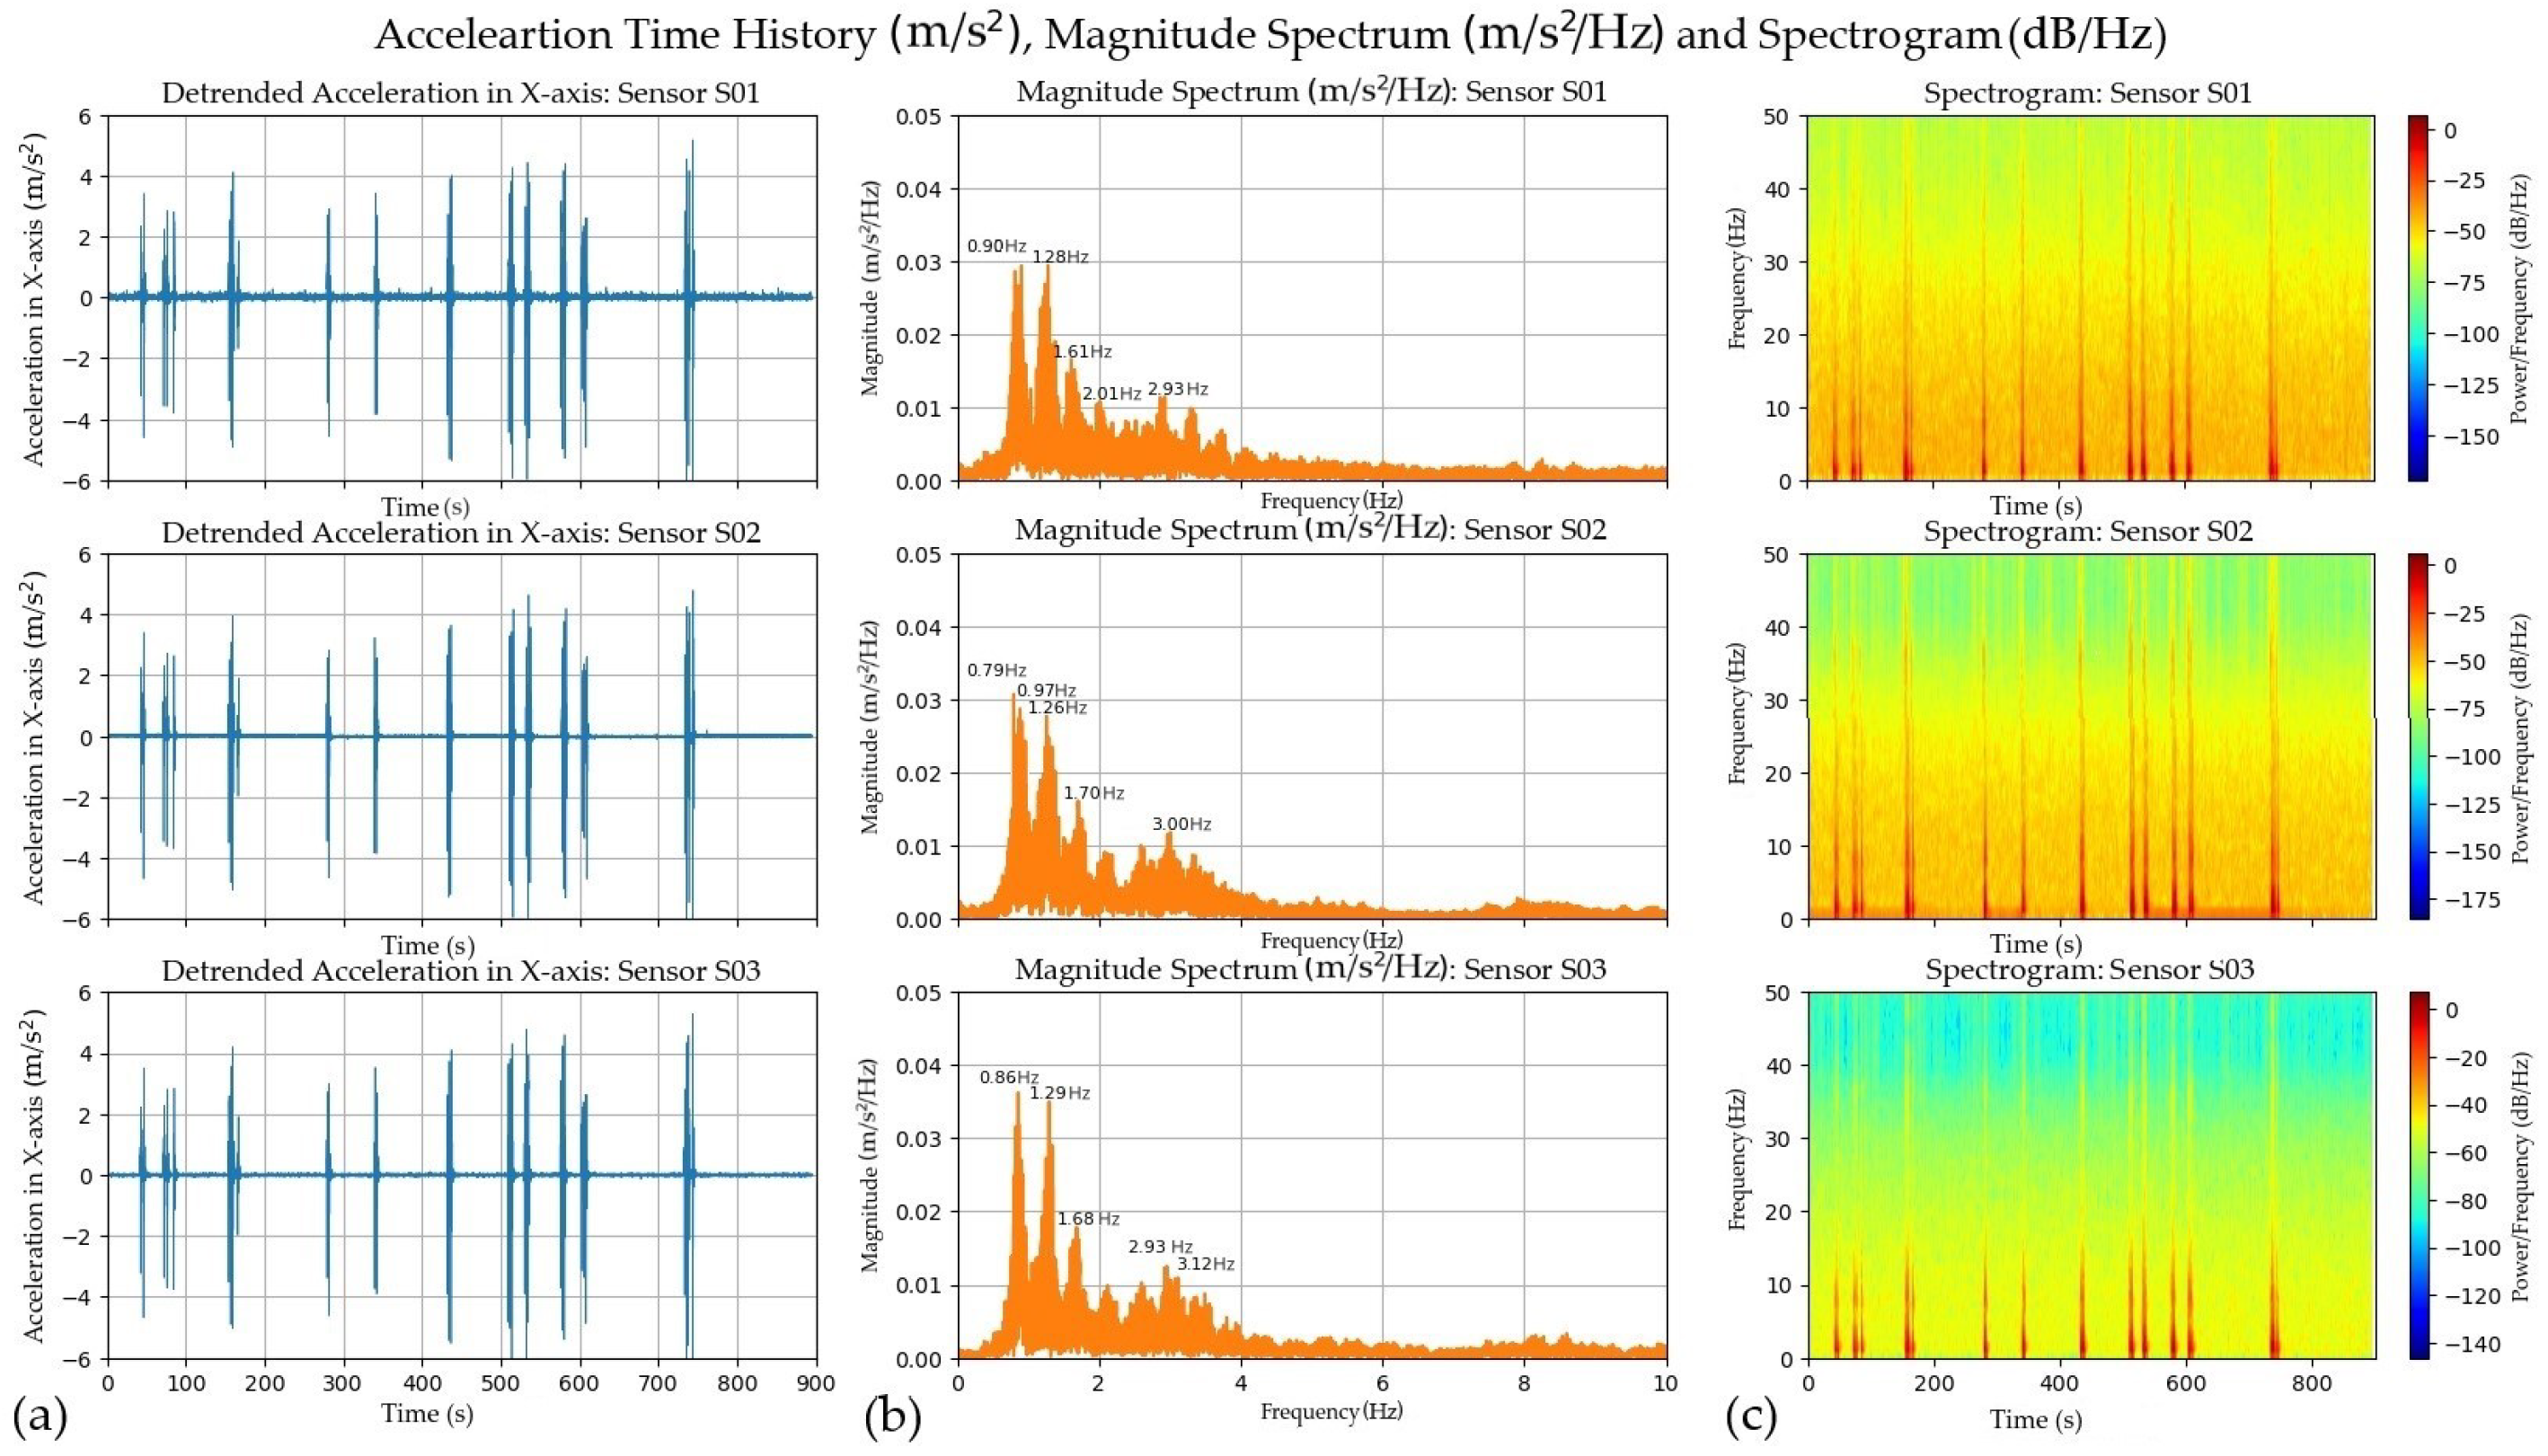
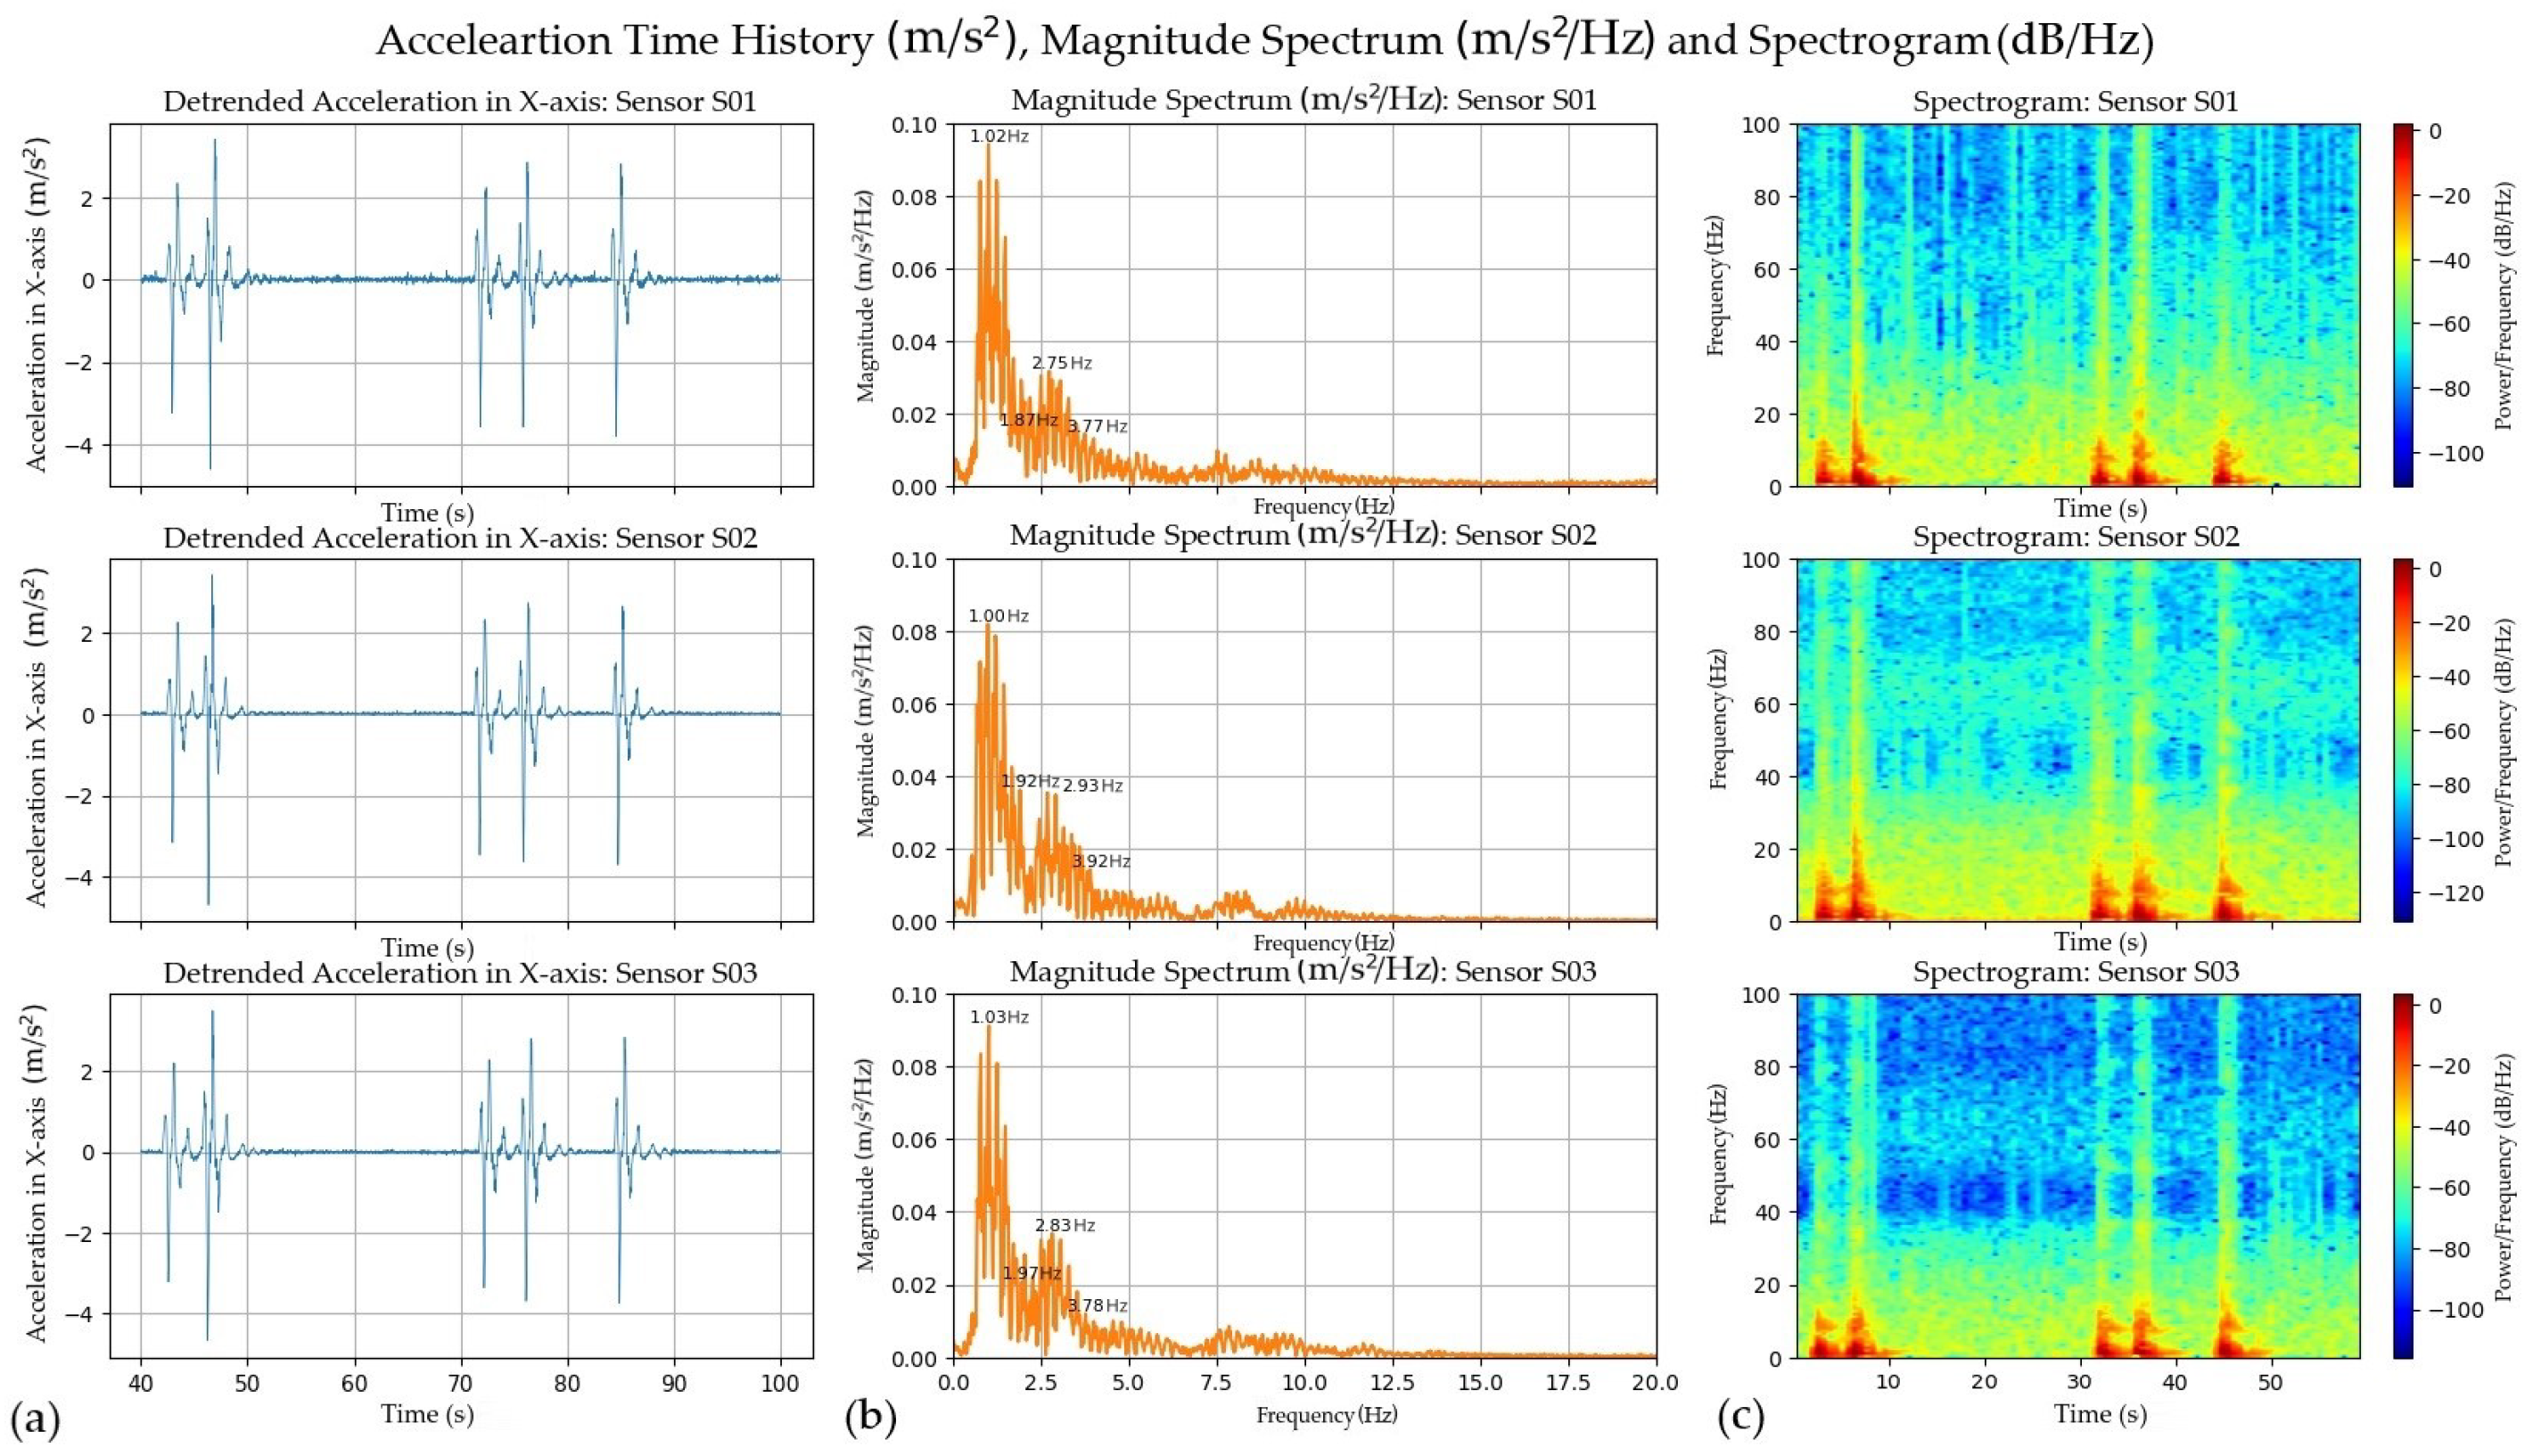
3.3. Analysis of Structural Response Using FDD

The Frequency Domain Decomposition (FDD) algorithm serves as a convenient and accessible method for structural parameter identification. In our experiment, we initiate the process by organizing the aligned signals, obtained through the DTW algorithm, into a matrix structure, as outlined in Equation (8). Each row of the matrix corresponds to a specific data point, while the columns represent the number of sensor nodes employed, which, in our case, is three.
Once the matrix is constructed, the subsequent step involves computing the PSD using the matrix data. This computation provides valuable insights into the frequency content of the signals. Subsequently, we apply SVD to decompose the PSD matrix at discrete frequencies, as described in Equation (12). Through the SVD, we obtain the singular values, which highlight the significance of each frequency component within the signal. To facilitate comprehension and interpretation, we visually represent these singular values using graphical plots. This graphical representation offers an intuitive visualization of the frequency characteristics exhibited by the system.
Figure 14 illustrates the plot of singular values in dB versus frequency obtained through the FDD algorithm applied to the DTW-aligned signals. In this plot, the topmost line represents the first singular value, followed by the second singular value in the middle, and the third singular value at the bottom. Figure 14a corresponds to the singular values plot of the responses from Structure 1, providing insights into its frequency characteristics. Similarly, Figure 14b showcases the singular values plot of the responses from Structure 2, offering a visual representation of its distinct frequency characteristics.
Additionally, it is important to highlight that the natural frequencies of the first mode obtained from the FDD analysis for Structure 1 and Structure 2 are 1.30 Hz and 0.90 Hz, respectively. However, the magnitude spectra analysis indicates that the natural frequencies of the first mode for Structure 1 and Structure 2 are 1.50 Hz and 1.25 Hz, respectively. This discrepancy arises due to the difference in frequency resolution between the two analysis techniques.
The presence of a structural imbalance in Structure 2 leads to the manifestation of a torsional mode when subjected to excitation. The dissipation of vibrations associated with the torsional mode can potentially disrupt the higher modes of natural frequency. This influence of the torsional mode is reflected in the singular value results, which indicate the presence of higher mode natural frequencies in Structure 2.
Nevertheless, it is noteworthy that even with low-cost, off-the-shelf sensors, the natural frequencies of the two distinct structures can still be distinguished. This emphasizes the capability of these sensors to capture and differentiate the unique frequency characteristics of structural responses, despite potential limitations in frequency resolution.

4. Discussion and Future Works

This study presents valuable insights into employing TCP/IP socket programming-based mimic broadcasting with the Chrony NTP synchronization in a local WSN utilizing low-cost ADXL345 sensors. By utilizing two series of Raspberry Pi devices—specifically, the Raspberry Pi Zero 2W as sensor nodes and the Raspberry Pi 4 as the gateway—we demonstrate the feasibility of leveraging readily available hardware for data collection and synchronization tasks.
The choice of TCP/IP socket programming as the data transmission backbone stems from its reliability. The implementation of the mimic broadcasting mechanism ensures efficient initiation of the start schedule for all RPi0-2W sensor nodes. Here, the RPi0-2W sensor nodes operate as clients, while the RPi4 serves as the server in socket programming. Additionally, the RPi4 plays the roles of receiving data as the gateway and providing NTP server functionality for RPi0-2W synchronization using Chrony in the background. Successful synchronization via Chrony NTP ensures precise time alignment among the sensor nodes. The integration of the DS3231 RTC module further enhances the functionality of the RPi0-2W sensor nodes, enabling them to maintain accurate time even during internet loss or power outages.
The consistent amplitude of the collected data from ADXL345 sensors within RPi0-2W end nodes indicates the stability and reliability of the sensor nodes in capturing acceleration information. The absence of peak loss in the collected impulse response from the 3DOF structure vibration under various impulse forces confirms the effectiveness of the sensor nodes in capturing the full range of vibrations. The synchronization using Chrony proves to be robust and efficient, as evidenced by the consistent dominant frequency observed in the magnitude spectrum of the preprocessed acceleration data. Spectrogram analysis provides additional insights into the frequency and time characteristics of the collected data, enhancing our understanding of the relationship between time and response to excitation in the structural system under study. Moreover, these findings pave the way for exploring new opportunities in the application of low-cost sensors within WSNs for SHM applications.
In the context of FDD, where precise time alignment is crucial, further optimization in achieving precise time synchronization can be accomplished by leveraging the optimal wrapping path obtained from DTW. In this research, precise synchronization among the RPi0-2W sensor nodes was successfully achieved through the utilization of DTW synchronization. The DTW algorithm computed the optimal warping path, facilitating accurate alignment between the windowed acceleration data and their corresponding magnitude spectra. This study extends the application of DTW synchronization to WSNs using low-cost ADXL345 sensors, which are widely used due to their affordability and compact size. While DTW synchronization has been explored in various domains such as audio and speech recognition [47], domain adaptation [70], and time series analysis [71], this research demonstrates its effectiveness in WSNs.
The implications of the findings are significant for the development and deployment of WSNs for OMA. The successful implementation of TCP/IP mimic broadcasting coupled with DTW precise synchronization addresses the challenges associated with achieving synchronization among sensor nodes in a cost-effective manner. This opens up possibilities for applications in structural health monitoring, environmental sensing, and industrial automation, where precise synchronization and reliable data transmission are crucial. From a broader perspective, the findings highlight the potential of synchronization techniques in enhancing the overall performance and reliability of WSNs. The utilization of low-cost sensors, such as the ADXL345, in combination with synchronization algorithms like DTW, offers a cost-effective solution for real-time data collection and analysis in diverse domains. This not only enables more accurate and reliable measurements but also contributes to the advancement of monitoring and analysis techniques in OMA.

Limitations and Considerations for Future Research

While this experimental study provides evidence of the feasibility and effectiveness of the proposed TCP/IP socket programming-based mimic broadcasting system with Chrony NTP synchronization and DTW precise time alignment using low-cost ADXL345 sensors, several limitations and areas for future research should be acknowledged. The detailed summary can be found in Table 2, which outlines these limitations and suggests potential avenues for further investigation.
To apply the proposed system in field applications, it will be necessary to validate the system in SHM scenarios within dense sensor networks. This validation process should involve comprehensive testing that considers various environmental effects, long-term stability, network security, and analysis using a wider range of techniques and data parameters. Furthermore, exploring the integration of artificial intelligence and machine learning techniques will enable the system to detect anomalies and make informed decisions, leading to more advanced and automated SHM processes.
In terms of the scalability of the proposed system, particularly in larger and densely populated sensor networks, such as those commonly found in urban environments where interference and network congestion may arise, it is crucial to explore alternative network topologies. While the star topology used in this study served as a starting point, investigating other network configurations like tree or complex cluster-tree typologies can optimize network performance and mitigate potential scalability issues. Tree or complex cluster-tree typologies provide a hierarchical structure that can enhance network scalability by enabling data to traverse multiple paths, reducing reliance on a single central node. This approach facilitates the efficient management of network traffic and ensures robustness against interference and congestion in urban environments.
The assessment of the system’s applicability and reliability across diverse scenarios and environmental conditions is indeed essential, considering factors such as temperature variations, humidity, external vibrations, and potential sensor drift. In the conducted experimental study, only linear detrending was used to shift the time history data to have a zero mean, without incorporating a digital signal filter. However, for real-world applications where sensors are exposed to varying environmental factors, including those mentioned earlier, it is crucial to ensure data accuracy by implementing appropriate sensor calibration and compensation techniques. These techniques may include temperature compensation, humidity correction, vibration isolation, and signal filtering to mitigate the effects of environmental influences on sensor readings. By employing such techniques, the system can maintain its accuracy and reliability across a wide range of environmental conditions, enhancing its suitability for practical deployment in diverse applications.
In addition to addressing environmental factors, long-term stability and maintenance requirements are critical considerations for the proposed system. Power management, particularly utilizing solar energy, can play a significant role in ensuring sustained and reliable operation. Furthermore, regular network maintenance protocols are essential to maintain the system’s reliability and longevity. This includes monitoring the network performance, addressing any potential issues or failures promptly, and conducting periodic maintenance activities to ensure optimal system functionality.
One promising approach to enhance the performance of low-cost sensors in the presence of environmental factors and ensure long-term stability is the utilization of machine learning techniques. By collecting data on environmental conditions alongside sensor measurements, machine learning algorithms can be trained to adaptively calibrate the sensor outputs and predict the system’s maintenance needs. This adaptive calibration, guided by machine learning, can significantly improve the accuracy and reliability of the sensor measurements over time. This adaptability allows the system to adjust its calibration parameters dynamically, compensating for variations caused by environmental factors and ensuring accurate measurements. Furthermore, machine learning algorithms can be trained to predict the maintenance needs of the system.
Comparative analysis with other time synchronization methods is crucial to evaluate the proposed system’s performance. In this study, the sampling frequency was set at 100 Hz, making the millisecond-level accuracy provided by Chrony NTP sufficient. However, if the proposed system is applied in applications requiring higher sampling rates, conducting a comparative analysis with methods such as PPS-GPS or PTP would provide valuable insights into synchronization accuracy, latency, and resilience to network variations. It is important to consider the hardware requirements of these methods, as PTP relies on specialized IEEE 1588-compliant network switches and Network Interface Cards (NICs), while GPS may have limitations in indoor environments. Furthermore, the implementation complexity of PTP is generally higher compared to Chrony. PTP requires careful configuration and calibration of network switches and NICs to ensure accurate time synchronization. The selection of the most suitable synchronization method should be based on the specific requirements of the application.
In terms of data security and network protection against unauthorized access, Socket programming in Python emerges as a valuable platform for real-world applications. It offers a wide array of libraries and frameworks equipped with robust security features such as AES encryption, authentication, and support for Secure Sockets Layer and Transport Layer Security (SSL/TLS). Notably, the cryptography library [74] is widely recognized and frequently employed for implementing cryptographic operations in Python. Its high-level Application Programming Interface (API) encompasses various cryptographic tasks including AES encryption, authentication, digital signatures, key management, and secure networking. Furthermore, SSL/TLS, commonly referred to as SSL, is a protocol that leverages a session-level layer on the Internet to establish a secure channel. The Python Standard Library includes the ssl module [75], which facilitates the creation of SSL/TLS connections by offering functionality for authentication, encryption, and secure socket communication using SSL/TLS protocols.
Furthermore, exploring Fast Dynamic Time Warping (FDTW) techniques [76] shows promise for reducing the computational costs involved in achieving precise time alignment. By delving into FDTW methods, researchers can potentially streamline the synchronization process while maintaining high levels of accuracy. This avenue of investigation holds significant potential for advancing the state-of-the-art in time synchronization within WSNs, paving the way for improved performance and scalability in practical applications.
Moreover, in the context of anomaly detection in time series data, particularly for applications in damage detection within SHM, the utilization of ML techniques offers opportunities for improvement. Ensemble methods, such as Random Forests or Gradient Boosting, have the potential to overcome the limitations of individual models, thereby enhancing robustness and reliability. Additionally, the combination of K-Nearest Neighbors (KNN) with DTW or FDTW allows for effective classification by leveraging the temporal alignment capabilities of DTW or FDTW and the nearest neighbor approach of KNN. By incorporating these ML techniques, the accuracy and effectiveness of anomaly detection and damage identification in SHM applications can be significantly enhanced.

5. Conclusions

In conclusion, this study demonstrates the feasibility of employing TCP/IP socket programming-based mimic broadcasting with Chrony NTP synchronization in a local WSN using low-cost ADXL345 sensors. The integration of Raspberry Pi devices as sensor nodes and gateway, along with the utilization of DS3231 RTC module and Chrony NTP, enables reliable data collection and precise time alignment among the sensor nodes. The collected data from ADXL345 sensors shows stability and reliability in capturing acceleration information, and the synchronization using Chrony proves to be robust and efficient. The study also explores the application of Dynamic Time Warping (DTW) synchronization in WSNs, achieving precise synchronization among the sensor nodes. These findings have significant implications for SHM applications, as they highlight the potential of synchronization techniques and low-cost sensors in enhancing the performance and reliability of SHM wireless networks. By leveraging synchronization techniques and low-cost sensors, SHM wireless networks can be effectively deployed to investigate the structural integrity of various infrastructure systems.
However, further research is needed to validate the system in real-field scenarios, explore scalability in larger networks, address environmental factors, ensure long-term stability and maintenance, and compare the proposed system with other synchronization methods. ML algorithms can be utilized to enhance the performance of low-cost sensors in the presence of environmental factors and ensure long-term stability. Additionally, considerations for data security and network protection should be taken into account in real-world applications.

Author Contributions

Conceptualization, S.N., A.T., K.K. and T.M.; methodology, S.N., A.T., K.K. and T.M.; software, S.N.; validation, S.N.; formal analysis, S.N.; investigation, S.N., A.T., K.K. and T.M.; resources, T.M.; data curation, S.N.; writing—original draft preparation, S.N.; writing—review and editing, A.T., K.K. and T.M.; visualization, S.N.; supervision, A.T., K.K. and T.M.; funding acquisition, S.N. and T.M. All authors have read and agreed to the published version of the manuscript.

Funding

This research was supported by the National Electronics and Computer Technology Center (NECTEC) and National Science and Technology Development Agency (NSTDA).

Institutional Review Board Statement

Not applicable.

Informed Consent Statement

Not applicable.

Data Availability Statement

The data that support the findings of this study are available from the corresponding author upon reasonable request due to the data are part of an ongoing study.

Acknowledgments

The authors would like to extend our sincere gratitude to Mizutani Laboratory at the Institute of Industrial Science, the University of Tokyo, for their invaluable support and provision of resources during the experiments of this research project. Additionally, we would like to express our appreciation to the researchers at the National Electronics and Computer Technology Center (NECTEC) for their guidance and assistance in obtaining relevant information.

Conflicts of Interest

The authors declare no conflict of interest.

Appendix A

Algorithm A1 Measure Time from NTP (Multiple Experiments)
  1:
Initialize variables: t first = 0 , t last = 0 , i = 0 , n = 10
  2:
for  j = 1 to n do
  3:
   Connect to NTP server ‘jp.pool.ntp.org’
  4:
   for  i = 1 to 100 do
  5:
     Measure current time t current from NTP server
  6:
     if  i = 1  then
  7:
         t first t current
  8:
     else if  i = 100  then
  9:
         t last t current
10:
     end if
11:
   end for
12:
   Calculate time difference: Δ t = t last t first
13:
   Format Δ t with 5 decimal places: Δ t formatted = : . 5 f . format ( Δ t )
14:
   Display time difference for experiment j: Δ t formatted
15:
end for
Table A1. NTP instabilities resulted from the Algorithm A1.
No.Time Difference of the Experiment No. (Seconds)
12345678910
11.983651.937622.138882.197042.150082.057392.02428Error--
22.078772.097522.032002.166792.136822.100962.190472.180572.050752.03307
32.025222.108282.196802.023302.090531.98940Error--
41.938042.040742.083222.080452.074172.008412.223132.343171.935831.96760
51.873681.994032.203942.184452.210962.045692.020962.106542.234752.16026
62.275082.55489Error-------
72.084542.124342.207022.199222.226402.260722.28497Error--
82.285572.370972.282302.372242.573492.338242.351392.407542.303062.25227
9Error---------
102.673962.291902.113551.993942.129212.161272.247132.038712.173922.09608
Figure A1. Visualization of the NTP instabilities resulted from the Algorithm A1. The experimental outcomes reveal that a significant proportion, specifically five out of the ten conducted experiments, demonstrated instability and provide evidence that the ntplib library lacks robustness in effectively capturing the entirety of the temporal axis, particularly in correlation with the capture of MEMS sensor vibration.
Applsci 14 03494 g0a1

References

  1. Avci, O.; Abdeljaber, O.; Kiranyaz, S.; Hussein, M.; Gabbouj, M.; Inman, D.J. A review of vibration-based damage detection in civil structures: From traditional methods to Machine Learning and Deep Learning applications. Mech. Syst. Signal Process. 2021, 147, 107077. [Google Scholar] [CrossRef]
  2. Tiboni, M.; Remino, C.; Bussola, R.; Amici, C. A review on vibration-based condition monitoring of rotating machinery. Appl. Sci. 2022, 12, 972. [Google Scholar] [CrossRef]
  3. Huffman, J.T.; Xiao, F.; Chen, G.; Hulsey, J.L. Detection of soil-abutment interaction by monitoring bridge response using vehicle excitation. J. Civ. Struct. Health Monit. 2015, 5, 389–395. [Google Scholar] [CrossRef]
  4. Xiao, F.; Hulsey, J.L.; Balasubramanian, R. Fiber optic health monitoring and temperature behavior of bridge in cold region. Struct. Control Health Monit. 2017, 24, e2020. [Google Scholar] [CrossRef]
  5. Xiao, F.; Chen, G.S.; Hulsey, J.L. Monitoring bridge dynamic responses using fiber Bragg grating tiltmeters. Sensors 2017, 17, 2390. [Google Scholar] [CrossRef]
  6. Xiao, F.; Hulsey, J.L.; Chen, G.S.; Xiang, Y. Optimal static strain sensor placement for truss bridges. Int. J. Distrib. Sens. Netw. 2017, 13, 1550147717707929. [Google Scholar] [CrossRef]
  7. Amezquita-Sanchez, J.P.; Adeli, H. Signal processing techniques for vibration-based health monitoring of smart structures. Arch. Comput. Methods Eng. 2016, 23, 1–15. [Google Scholar] [CrossRef]
  8. Xiao, F.; Chen, G.S.; Zatar, W.; Hulsey, J.L. Signature extraction from the dynamic responses of a bridge subjected to a moving vehicle using complete ensemble empirical mode decomposition. J. Low Freq. Noise Vib. Act. Control 2021, 40, 278–294. [Google Scholar] [CrossRef]
  9. Barbosh, M.; Singh, P.; Sadhu, A. Empirical mode decomposition and its variants: A review with applications in structural health monitoring. Smart Mater. Struct. 2020, 29, 093001. [Google Scholar] [CrossRef]
  10. Hassan, Q.F. Internet of Things A to Z: Technologies and Applications; John Wiley & Sons: Hoboken, NJ, USA, 2018. [Google Scholar]
  11. Yang, Y.; Zhong, M.; Yao, H.; Yu, F.; Fu, X.; Postolache, O. Internet of things for smart ports: Technologies and challenges. IEEE Instrum. Meas. Mag. 2018, 21, 34–43. [Google Scholar] [CrossRef]
  12. Tokognon, C.A.; Gao, B.; Tian, G.Y.; Yan, Y. Structural health monitoring framework based on Internet of Things: A survey. IEEE Internet Things J. 2017, 4, 619–635. [Google Scholar] [CrossRef]
  13. Haque, M.E.; Asikuzzaman, M.; Khan, I.U.; Ra, I.H.; Hossain, M.S.; Shah, S.B.H. Comparative study of IoT-based topology maintenance protocol in a wireless sensor network for structural health monitoring. Remote Sens. 2020, 12, 2358. [Google Scholar] [CrossRef]
  14. Villa, V.; Naticchia, B.; Bruno, G.; Aliev, K.; Piantanida, P.; Antonelli, D. IoT open-source architecture for the maintenance of building facilities. Appl. Sci. 2021, 11, 5374. [Google Scholar] [CrossRef]
  15. Mishra, M.; Lourenço, P.B.; Ramana, G.V. Structural health monitoring of civil engineering structures by using the internet of things: A review. J. Build. Eng. 2022, 48, 103954. [Google Scholar] [CrossRef]
  16. Varanis, M.; Silva, A.; Mereles, A.; Pederiva, R. MEMS accelerometers for mechanical vibrations analysis: A comprehensive review with applications. J. Braz. Soc. Mech. Sci. Eng. 2018, 40, 527. [Google Scholar] [CrossRef]
  17. Sabato, A.; Niezrecki, C.; Fortino, G. Wireless MEMS-based accelerometer sensor boards for structural vibration monitoring: A review. IEEE Sens. J. 2016, 17, 226–235. [Google Scholar] [CrossRef]
  18. Bravo-Haro, M.; Ding, X.; Elghazouli, A. MEMS-based low-cost and open-source accelerograph for earthquake strong-motion. Eng. Struct. 2021, 230, 111675. [Google Scholar] [CrossRef]
  19. Barzegar, M.; Blanks, S.; Sainsbury, B.A.; Timms, W. MEMS technology and applications in geotechnical monitoring: A review. Meas. Sci. Technol. 2022, 33, 052001. [Google Scholar] [CrossRef]
  20. Albarbar, A.; Mekid, S.; Starr, A.; Pietruszkiewicz, R. Suitability of MEMS accelerometers for condition monitoring: An experimental study. Sensors 2008, 8, 784–799. [Google Scholar] [CrossRef]
  21. Ribeiro, R.R.; Lameiras, R.d.M. Evaluation of low-cost MEMS accelerometers for SHM: Frequency and damping identification of civil structures. Lat. Am. J. Solids Struct. 2019, 16, e203. [Google Scholar] [CrossRef]
  22. Lee, J.; Khan, I.; Choi, S.; Kwon, Y.W. A smart iot device for detecting and responding to earthquakes. Electronics 2019, 8, 1546. [Google Scholar] [CrossRef]
  23. Ali, A.; Sandhu, T.Y.; Usman, M. Ambient vibration testing of a pedestrian bridge using low-cost accelerometers for SHM applications. Smart Cities 2019, 2, 20–30. [Google Scholar] [CrossRef]
  24. Omidalizarandi, M.; Herrmann, R.; Kargoll, B.; Marx, S.; Paffenholz, J.A.; Neumann, I. A validated robust and automatic procedure for vibration analysis of bridge structures using MEMS accelerometers. J. Appl. Geod. 2020, 14, 327–354. [Google Scholar] [CrossRef]
  25. Khan, S.M.; Hanif, M.U.; Khan, A.; Hassan, M.U.; Javanmardi, A.; Ahmad, A. Damage assessment of reinforced concrete beams using cost-effective MEMS accelerometers. In Structures; Elsevier: Amsterdam, The Netherlands, 2022; Volume 41, pp. 602–618. [Google Scholar]
  26. Caballero-Russi, D.; Ortiz, A.R.; Guzmán, A.; Canchila, C. Design and Validation of a Low-Cost Structural Health Monitoring System for Dynamic Characterization of Structures. Appl. Sci. 2022, 12, 2807. [Google Scholar] [CrossRef]
  27. El Dahr, R.; Lignos, X.; Papavieros, S.; Vayas, I. Design and Validation of an Accurate Low-Cost Data Acquisition System for Structural Health Monitoring of a Pedestrian Bridge. J. Civ. Eng. Constr. 2022, 11, 113–126. [Google Scholar] [CrossRef]
  28. Sarkar, S.K.; Basavaraju, T.G.; Puttamadappa, C. Ad Hoc Mobile Wireless Networks: Principles, Protocols and Applications; Auerbach Publications: Boca Raton, FL, USA, 2007. [Google Scholar]
  29. Sarkar, A.; Murugan, T.S. Routing protocols for wireless sensor networks: What the literature says? Alex. Eng. J. 2016, 55, 3173–3183. [Google Scholar] [CrossRef]
  30. Zyrianoff, I.; Gigli, L.; Montori, F.; Sciullo, L.; Kamienski, C.; Di Felice, M. Cache-it: A distributed architecture for proactive edge caching in heterogeneous iot scenarios. Ad Hoc Netw. 2024, 156, 103413. [Google Scholar] [CrossRef]
  31. Hasan, K.F.; Wang, C.; Feng, Y.; Tian, Y.C. Time synchronization in vehicular ad-hoc networks: A survey on theory and practice. Veh. Commun. 2018, 14, 39–51. [Google Scholar] [CrossRef]
  32. Dhall, R.; Dhongdi, S. Review of protocol stack development of flying ad-hoc networks for disaster monitoring applications. Arch. Comput. Methods Eng. 2023, 30, 37–68. [Google Scholar] [CrossRef]
  33. De Angelis, A.; Santoni, F.; Carbone, P.; Cecconi, M.; Vecchietti, A.; Di Lorenzo, F. Development of an IoT Structural Monitoring System Applied to a Hypogeal Site. Sensors 2020, 20, 6769. [Google Scholar] [CrossRef]
  34. AbdelRaheem, M.; Hassan, M.; Mohammed, U.S.; Nassr, A.A. Design and implementation of a synchronized IoT-based structural health monitoring system. Internet Things 2022, 20, 100639. [Google Scholar] [CrossRef]
  35. Fort, E.H.; Blanco-Carmona, P.; Garcia-Oya, J.R.; Muñoz-Chavero, F.; Gonzalez-Carvajal, R.; Serrano-Chacon, A.R.; Mascort-Albea, E.J. Wireless and Low-Power System for Synchronous and Real-Time Structural-Damage Assessment. IEEE Sen. J. 2023, 23, 13648–13658. [Google Scholar] [CrossRef]
  36. Cho, H.; Jung, J.; Cho, B.; Jin, Y.; Lee, S.W.; Baek, Y. Precision time synchronization using IEEE 1588 for wireless sensor networks. In Proceedings of the 2009 International Conference on Computational Science and Engineering, Vancouver, BC, Canada, 29–31 August 2009; IEEE: Piscateville, NJ, USA, 2009; Volume 2, pp. 579–586. [Google Scholar]
  37. Gao, S.; Dai, X.; Liu, Z.; Tian, G. High-performance wireless piezoelectric sensor network for distributed structural health monitoring. Int. J. Distrib. Sens. Netw. 2016, 12, 3846804. [Google Scholar] [CrossRef]
  38. Jornet-Monteverde, J.A.; Galiana-Merino, J.J.; Soler-Llorens, J.L. Design and implementation of a wireless sensor network for seismic monitoring of buildings. Sensors 2021, 21, 3875. [Google Scholar] [CrossRef] [PubMed]
  39. Meng, Q.; Zhu, S. Developing iot sensing system for construction-induced vibration monitoring and impact assessment. Sensors 2020, 20, 6120. [Google Scholar] [CrossRef] [PubMed]
  40. Barsocchi, P.; Bartoli, G.; Betti, M.; Girardi, M.; Mammolito, S.; Pellegrini, D.; Zini, G. Wireless sensor networks for continuous structural health monitoring of historic masonry towers. Int. J. Archit. Herit. 2021, 15, 22–44. [Google Scholar] [CrossRef]
  41. Komarizadehasl, S.; Lozano, F.; Lozano-Galant, J.A.; Ramos, G.; Turmo, J. Low-cost wireless structural health monitoring of bridges. Sensors 2022, 22, 5725. [Google Scholar] [CrossRef] [PubMed]
  42. Balakrishnan, K.; Dhanalakshmi, R.; Sinha, B.B.; Gopalakrishnan, R. Clock synchronization in industrial Internet of Things and potential works in precision time protocol: Review, challenges and future directions. Int. J. Cogn. Comput. Eng. 2023, 4, 205–219. [Google Scholar]
  43. Komarizadehasl, S.; Huguenet, P.; Lozano, F.; Lozano-Galant, J.A.; Turmo, J. Operational and analytical modal analysis of a bridge using low-cost wireless Arduino-based accelerometers. Sensors 2022, 22, 9808. [Google Scholar] [CrossRef]
  44. Rocha Ribeiro, R.; de Almeida Sobral, R.; Cavalcante, I.B.; Conte Mendes Veloso, L.A.; de Melo Lameiras, R. A Low-Cost Wireless Multinode Vibration Monitoring System for Civil Structures. Struct. Control Health Monit. 2023, 2023, 5240059. [Google Scholar] [CrossRef]
  45. Dinar, A.E.; Merabet, B.; Ghouali, S. NTP Server Clock Adjustment with Chrony. In Applications of Internet of Things: Proceedings of ICCCIOT 2020; Springer: Berlin/Heidelberg, Germany, 2020; pp. 177–185. [Google Scholar]
  46. Chowdhury, D.D. Packet timing: Network time protocol. In NextGen Network Synchronization; Springer: Berlin/Heidelberg, Germany, 2021; pp. 103–116. [Google Scholar]
  47. Sakoe, H.; Chiba, S. Dynamic programming algorithm optimization for spoken word recognition. IEEE Trans. Acoust. Speech Signal Process. 1978, 26, 43–49. [Google Scholar] [CrossRef]
  48. Silva, D.; Carvalho, L.I.; Soares, J.; Sofia, R.C. A performance analysis of internet of things networking protocols: Evaluating MQTT, CoAP, OPC UA. Appl. Sci. 2021, 11, 4879. [Google Scholar] [CrossRef]
  49. Basavaraju, N.; Alexander, N.; Seitz, J. Performance Evaluation of Advanced Message Queuing Protocol (AMQP): An Empirical Analysis of AMQP Online Message Brokers. In Proceedings of the 2021 International Symposium on Networks, Computers and Communications (ISNCC), Dubai, United Arab Emirates, 31 October–2 November 2021; IEEE: Piscateville, NJ, USA, 2021; pp. 1–8. [Google Scholar]
  50. Ioana, A.; Korodi, A. DDS and OPC UA protocol coexistence solution in real-time and industry 4.0 context using non-ideal infrastructure. Sensors 2021, 21, 7760. [Google Scholar] [CrossRef] [PubMed]
  51. Wytrębowicz, J.; Cabaj, K.; Krawiec, J. Messaging protocols for IoT systems—A pragmatic comparison. Sensors 2021, 21, 6904. [Google Scholar] [CrossRef] [PubMed]
  52. Ajayi, O.; Bagula, A.; Bode, J.; Damon, M. A Comparison of Publish-Subscribe and Client-Server Models for Streaming IoT Telemetry Data. In Proceedings of the International Conference on Emerging Technologies for Developing Countries, Bloemfontein, South Africa, 5–7 December 2022; Springer: Berlin/Heidelberg, Germany, 2022; pp. 129–139. [Google Scholar]
  53. Yassein, M.B.; Shatnawi, M.Q.; Aljwarneh, S.; Al-Hatmi, R. Internet of Things: Survey and open issues of MQTT protocol. In Proceedings of the 2017 International Conference on Engineering & MIS (ICEMIS), Monastir, Tunisia, 8–10 May 2017; IEEE: Piscateville, NJ, USA, 2017; pp. 1–6. [Google Scholar]
  54. Bayılmış, C.; Ebleme, M.A.; Çavuşoğlu, Ü.; Kücük, K.; Sevin, A. A survey on communication protocols and performance evaluations for Internet of Things. Digit. Commun. Netw. 2022, 8, 1094–1104. [Google Scholar] [CrossRef]
  55. Oliveira, G.M.; Costa, D.C.; Cavalcanti, R.J.; Oliveira, J.P.; Silva, D.R.; Nogueira, M.B.; Rodrigues, M.C. Comparison between MQTT and WebSocket protocols for Iot applications using ESP8266. In Proceedings of the 2018 Workshop on Metrology for Industry 4.0 and IoT, Brescia, Italy, 16–18 April 2018; IEEE: Piscateville, NJ, USA, 2018; pp. 236–241. [Google Scholar]
  56. McMillan, G. Socket Programming HOWTO. 2024. Available online: https://docs.python.org/3/howto/sockets.html#socket-howto (accessed on 8 February 2024).
  57. Analog Devices. ADXL345: Small, Low Power, 3-Axis Accelerometer. 2024. Available online: https://www.analog.com/media/en/technical-documentation/data-sheets/adxl345.pdf (accessed on 8 February 2024).
  58. Fu, Y.; Hoang, T.; Mechitov, K.; Kim, J.R.; Zhang, D.; Spencer, B.F., Jr. Sudden event monitoring of civil infrastructure using demand-based wireless smart sensors. Sensors 2018, 18, 4480. [Google Scholar] [CrossRef]
  59. Alarcón, M.; Soto, P.; Hernández, F.; Guindos, P. Structural health monitoring of South America’s first 6-Story experimental light-frame timber-building by using a low-cost RaspberryShake seismic instrumentation. Eng. Struct. 2023, 275, 115278. [Google Scholar] [CrossRef]
  60. Iwaniec, M.; Holovatyy, A.; Teslyuk, V.; Lobur, M.; Kolesnyk, K.; Mashevska, M. Development of vibration spectrum analyzer using the Raspberry Pi microcomputer and 3-axis digital MEMS accelerometer ADXL345. In Proceedings of the 2017 XIIIth International Conference on Perspective Technologies and Methods in MEMS Design (MEMSTECH), Lviv, Ukraine, 20–23 April 2017; IEEE: Piscateville, NJ, USA, 2017; pp. 25–29. [Google Scholar]
  61. Gao, S.; Zhang, X.; Du, C.; Ji, Q. A multichannel low-power wide-area network with high-accuracy synchronization ability for machine vibration monitoring. IEEE Internet Things J. 2019, 6, 5040–5047. [Google Scholar] [CrossRef]
  62. Ghazali, M.H.M.; Rahiman, W. An investigation of the reliability of different types of sensors in the real-time vibration-based anomaly inspection in drone. Sensors 2022, 22, 6015. [Google Scholar] [CrossRef]
  63. Cañete, E.; Chen, J.; Díaz, M.; Llopis, L.; Rubio, B. Sensor4PRI: A sensor platform for the protection of railway infrastructures. Sensors 2015, 15, 4996–5019. [Google Scholar] [CrossRef]
  64. Holovatyy, A.; Teslyuk, V.; Iwaniec, M.; Mashevska, M. Development of a system for monitoring vibration accelerations based on the raspberry pi microcomputer and the adxl345 accelerometer. East.-Eur. J. Enterp. Technol. 2017, 6, 52–62. [Google Scholar] [CrossRef]
  65. Chang, H.F.; Shokrolah Shirazi, M. Integration with 3D visualization and IoT-based sensors for real-time structural health monitoring. Sensors 2021, 21, 6988. [Google Scholar] [CrossRef]
  66. Vijayan, D. Prediction of displacement in Reinforced concrete based on artificial neural networks using sensors. Meas. Sens. 2023, 27, 100764. [Google Scholar]
  67. Rehman, S.U.; Usman, M.; Toor, M.H.Y.; Hussaini, Q.A. Advancing structural health monitoring: A vibration-based IoT approach for remote real-time systems. Sen. Actuators A Phys. 2024, 365, 114863. [Google Scholar] [CrossRef]
  68. The Chrony Project. Chrony Documentation. Available online: https://chrony-project.org/documentation.html (accessed on 17 April 2024).
  69. Choudhury, M.D.; Hong, L.; Dhupia, J.S. A methodology to handle spectral smearing in gearboxes using adaptive mode decomposition and dynamic time warping. IEEE Trans. Instrum. Meas. 2021, 70, 3510910. [Google Scholar] [CrossRef]
  70. Courty, N.; Flamary, R.; Tuia, D.; Rakotomamonjy, A. Optimal transport for domain adaptation. IEEE Trans. Pattern Anal. Mach. Intell. 2016, 39, 1853–1865. [Google Scholar] [CrossRef]
  71. Liu, Y.T.; Zhang, Y.A.; Zeng, M. Adaptive global time sequence averaging method using dynamic time warping. IEEE Trans. Signal Process. 2019, 67, 2129–2142. [Google Scholar] [CrossRef]
  72. Brincker, R.; Zhang, L.; Andersen, P. Modal identification of output-only systems using frequency domain decomposition. Smart Mater. Struct. 2001, 10, 441. [Google Scholar] [CrossRef]
  73. Brincker, R.; Zhang, L. Frequency domain decomposition revisited. In Proceedings of the 3rd International Operational Modal Analysis Conference-IOMAC, Portonovo, Italy, 4–6 May 2009; Starrylink Editrice: Brescia, Italy, 2009; p. 615. [Google Scholar]
  74. Python Cryptography Package on PyPI. Available online: https://pypi.org/project/cryptography/ (accessed on 16 April 2024).
  75. Ssl—TLS/SSL Wrapper. Available online: https://docs.python.org/3/library/ssl.html (accessed on 16 April 2024).
  76. Salvador, S.; Chan, P. Toward accurate dynamic time warping in linear time and space. Intell. Data Anal. 2007, 11, 561–580. [Google Scholar] [CrossRef]
Figure 1. Sensor node and gateway devices used in this study: (a) ADXL345 (b) DS3231 RTC module (c) i2c wiring RPi02W, ADXL345, and DS3231, and (d) RPi4 as gateway.
Applsci 14 03494 g001
Figure 2. Interaction diagram of the proposed server-client based communication with mimic broadcasting interaction: illustrating the mimic mechanism and tasks between the server and clients.
Applsci 14 03494 g002
Figure 3. The experimental setup: The RPi0-2W sensor nodes were located on top of the 3DOF structure, while the PRi4 gateway was connected to a monitor for investigating the .csv file. All RPi0-2W nodes and RPi4 were controlled by a personal computer through SSH.
Applsci 14 03494 g003
Figure 4. Three-Degree-of-Freedom (3DOF) wood system: (a) 3DOF dimensions of 0.40 × 0.30 × 1.30 m, (b) Front view of the 3DOF structure with strategically placed end nodes, and (c) Top view of the 3DOF structure illustrating the location of the sensor nodes.
Applsci 14 03494 g004
Figure 5. Three-Degree-of-Freedom (3DOF) wood system: (a) The more rigid structure with full side panels, (b) The less rigid structure with partition side panels (front view and side view, respectively), (c) Sensor at first storey, (d) Sensor at second storey, and (e) Sensor at third storey.
Applsci 14 03494 g005
Figure 6. Schematic diagram of the Frequency Domain Decomposition (FDD) process applied to raw low-cost acceleration data. The diagram illustrates the five steps involved: reading raw data, detrending and resampling, selecting a window size, refining alignment using adaptive sampling DTW, and performing the FDD analysis.
Applsci 14 03494 g006
Figure 7. Experimental results obtained from the synchronization validation: (a) the time history of x-axis accelerations collected from three sensors positioned on the top storey, as illustrated in Figure 4. (b) a magnified view of the first 100 s of the recorded data.
Applsci 14 03494 g007
Figure 8. Comparison of the time and frequency domains for three sensors positioned on the top storey, as depicted in Figure 4. (a) the time history of x-axis accelerations recorded over a duration of 15 min. (b) the linear magnitude spectrum computed using the Fast Fourier Transform (FFT) of the x-axis accelerations. (c) the spectrogram of the x-axis accelerations.
Applsci 14 03494 g008
Figure 9. Comparison of the time and frequency domains for three sensors over a duration of 60 s. (a) the time history of x-axis accelerations corresponding to the first five peaks. (b) the linear magnitude spectrum of the x-axis accelerations computed for a 60-s record. (c) the spectrogram of the x-axis accelerations for the same 60-s record.
Applsci 14 03494 g009
Figure 10. Comparison of prepocessed acceleration and aligned acceleration using DTW: (a) the prepocessed acceleration time history of x-axis. (b) aligned acceleration time history of x-axis using DTW.
Applsci 14 03494 g010
Figure 11. Acceleration time history recorded from 2 structures: (a) the preprocessed acceleration time history of the full side panel (Structure 1). (b) the preprocessed acceleration time history of the partition side panel (Structure 2).
Applsci 14 03494 g011
Figure 12. Segmentation of response data for analysis: (a) Time interval selection for Structure 1, from 25 s to 65 s. (b) Time interval selection for Structure 2, from 35 s to 75 s. The labels S01, S02, and S03 represent the sensor positions on the 3DOF structure, corresponding to the first, second, and third storeys, respectively.
Applsci 14 03494 g012
Figure 13. Synchronized acceleration time history using DTW and magnitude spectra: (a) Adaptive resampled acceleration data and magnitude spectrum for Structure 1, highlighting the effectiveness of the alignment. (b) Adaptive resampled acceleration data and magnitude spectrum for Structure 2, further illustrating the benefits of the synchronization process.
Applsci 14 03494 g013
Figure 14. Plot of the first singular value obtained through the FDD algorithm applied to the DTW-aligned signals in linear scale (m2/s4/Hz). (a) Singular values plot of the responses from Structure 1, providing insights into its frequency characteristics. (b) Singular values plot of the responses from Structure 2, offering a visual representation of its distinct frequency characteristics.
Applsci 14 03494 g014
Table 1. Summary of time module of the related works.
ReferenceClock ModuleWireless TechnologyNumber of End Nodes
 [33]GPS 1LoRa 22
 [34]GPS 1TCP/IP 3 via Wi-Fi and 4G5
 [35]GPS 1NB-IoT 510
 [38]NTP 4TCP/IP 3 via Wi-Fi2
 [39]NTP 44GN/A
 [40]NTP 4MQTT 6 broker and 4GN/A
 [41]NTP 44GN/A
 [43]NTP 44GN/A
1 a Global Positioning System (GPS). 2 a Long Range (LoRa) radio module. 3 Transmission Control Protocol/Internet Protocol (TCP/IP). 4 Network Time Protocol (NTP). 5 Narrowband-IoT. 6 Message Queue Telemetry Transport (MQTT).
Table 2. Limitations and Future Research Directions.
AspectExperimental Study Proposed by AuthorsFuture Research Direction
Validate the system in real-field scenariosDemonstrated feasibility in controlled environment.Conduct field tests to validate real-world performance.
Explore scalability in larger networksFocused on local wireless sensor network with star typology.Investigate scalability to larger networks with different typologies.
Opting tree and complex cluster-tree typologies are preferable.
Address environmental factorsThe environmental impact on sensor measurements was not extensively discussed since the study was conducted in a controlled environment. Only linear detrend was applied in this study.Collect experimental data and analyze the system’s performance under different environmental conditions.
Explore the integration of ML algorithms to enhance sensor accuracy for adaptive calibration of measurements.
Ensure long-term stability and maintenanceThe study proposed the initial evaluation on a lab scale.Investigate the system’s performance over an extended period and develop maintenance strategies.
Integrate ML algorithms to predict maintenance needs based on environmental data.
Synchronization methodsThe study focused on Chrony NTP synchronization due to its ease of use and suitability for low sampling rates.Conduct comparative studies with alternative synchronization methods.
PTP and PPS-GPS integrated with Chrony can be enhanced the performance, accuracy, and efficiency in higher sampling rate applications.
Data securityThe experimental study did not discuss data security measures.Investigate and implement appropriate data security mechanisms, such as AES encryption, authentication, and SSL/TLS protocols, to protect sensitive sensor data from unauthorized access or tampering in real-world applications.
Disclaimer/Publisher’s Note: The statements, opinions and data contained in all publications are solely those of the individual author(s) and contributor(s) and not of MDPI and/or the editor(s). MDPI and/or the editor(s) disclaim responsibility for any injury to people or property resulting from any ideas, methods, instructions or products referred to in the content.

