
Characteristic Investigation of a Novel Aircraft SOFC/GT Hybrid System under Varying Operational Parameters

1
China-UK Low Carbon College, Shanghai Jiao Tong University, Shanghai 201306, China
2
UCL Energy Institute, University College London, Central House, London WC1E 6BT, UK
3
School of Mechanical Engineering, Shanghai Jiao Tong University, Shanghai 200240, China
*
Author to whom correspondence should be addressed.
Appl. Sci. 2024, 14(8), 3504; https://doi.org/10.3390/app14083504
Submission received: 21 March 2024
/
Revised: 15 April 2024
/
Accepted: 17 April 2024
/
Published: 21 April 2024
(This article belongs to the Special Issue Advances in Fuel Cell Renewable Hybrid Power Systems)
Abstract
:In this study, the implementation of a solid oxide fuel cell–gas turbine hybrid engine for primary propulsion and electric power generation in aircraft is investigated. The following three parameters, which are crucial in attaining optimal performance at any point in the flight profile, were identified: the oxygen-to-carbon ratio of the catalytic partial oxidation reformer, the fuel utilization factor of the fuel cell, and the airflow split ratio at the outlet of the high-pressure compressor. The study assesses the impact of varying these parameters within specified ranges on the performance of the hybrid system. At the design point, the system yielded a total power output of 1.96 MW, with 102.5 kW of electric power coming from the fuel cell and 7.9 kN (1.86 MW) of thrust power coming from the gas turbine. The results indicate that varying the oxygen-to-carbon ratio affected the fuel cell’s fuel utilization and resulted in a slight decrease in gas turbine thrust. The fuel utilization factor primarily affected the power output of the fuel cell stack, with a minor impact on thrust. Notably, varying the airflow split ratio showed the most significant influence on the overall system performance. This analysis provides insights into the system’s sensitivities and contributes to the development of more sustainable aircraft energy systems.
1. Introduction
The United Nations’ International Civil Aviation Organization (ICAO) [1], the European Union [2], and the Carbon Offsetting and Reduction Scheme for International Aviation (CORSIA) [3] project aviation emissions to account for 25% of the global carbon budget by 2050, up from the current 2–3% [4]. Therefore, new sustainable methods of powering aircraft are needed to ensure a different reality by 2050.
Another driving factor is the electric power demand increase in modern aircraft, which affects aircraft range and endurance. Waters [5] deduced the incoming trend of the electrical power demands on modern aircraft as the power demands keep increasing due to onboard systems being electrified, for instance, the environmental control systems and hydraulic actuators. Therefore, the electric power fraction, i.e., the ratio of electric power demand to total power demand (propulsive and electrical) of the aircraft, at any point on the flight profile, is increasing. For commercial aircraft, the power fraction is less than 5%, with the Boeing 787 being the highest power fraction of 4%. Future commercial aircraft are expected to have power fractions exceeding 25%. Currently, sensor-laden unmanned aerial vehicles (UAVs) have power fractions up to 20%, for instance, the MQ-9 and future versions of the Global Hawk RQ-4 will reach 15% power fractions.
This increase in electric power demand necessitates higher gas turbine (GT) fuel consumption to fulfill the electrical power requirements within each flight cycle. However, this heightened demand comes at a trade-off: it limits the aircraft’s range and endurance capabilities. Different alternative methods to meet this increase in electric power fractions have been proposed, the most notable amongst them being battery-powered aircraft [6], fuel cell–battery [7,8], and fuel cell-powered aircraft [9]. Amongst the fuel cell options, the solid oxide fuel cell (SOFC) has been the subject of many studies recently. Such studies have analyzed how it can be utilized in the transporting sector, including marine [10], road [11] and aviation transport. Therefore, motivated by the need to improve aero-engine range and endurance and reduce emissions, an aircraft SOFC/GT hybrid system was designed and analyzed.
The SOFC/GT hybrid system has been proven to show great potential amongst power systems utilizing SOFCs as one of the contenders replacing conventional aeroengines. The SOFC/GT combines the advantages of both systems where the electrical efficiencies of SOFC/GT can be as high as 70% [12]. One of the main advantages of SOFCs over other types of fuel cells is their fuel redundancy. They can utilize a wide range of hydrocarbon fuels, natural gas, hydrogen, carbon monoxide, and other renewable fuels, making them an attractive option [13]. This proves to be a major advantage in freight logistics. SOFCs have demonstrated reliability, and good durability in their various applications. SOFCs can also be replaced much more readily at an airport. The SOFC/GT systems have been noted to reduce fuel burn by 5–7% [5], reduce fuel costs by over 50% [14] and reduce emissions by up to 70%. Quiet vibration-free operation of SOFCs also eliminates the noise that is greatly associated with aircraft and conventional power systems. As an electric power source, it proves most useful in replacing mechanical generators and auxiliary power units (APUs), which generally have fuel first pass through the Brayton cycle for mechanical power before converting it to electrical power. This fuel-to-electric power conversion in fuel cells is direct and more efficient, up to 50–60% in systems without heat recovery cycles.
There are also shortcomings in utilizing SOFC systems in aircraft, and this is mainly due to the power density and power-to-weight ratio of the current existing SOFCs. Liu et al. [14] note that, in 2005, the power density of an SOFC stack used to be 0.25 kW/kg, which has since improved to 0.9 kW/kg. As weight is a great concern in aviation, the power-to-weight ratio is of utmost importance, and currently it is 7 kWh/kg. The other disadvantages are associated with the costs of the SOFCs and complex fabrication. As it operates at high temperatures, material degradation has been a drawback in implementing this technology on a large scale.
The applicability of the SOFC/GT hybrid system in aircraft finds validation through numerous proof-of-concept studies documented in recent publications. These studies provide a foundation for building successive or iterative research. Notably, NASA’s pioneering SOFC/GT auxiliary power unit (APU) system [15] marked an early attempt to explore its aerospace application. Eelman et al. [16] conducted a comparative analysis between an aircraft SOFC/GT APU and a PEMFC/GT APU under similar flight conditions. Their research revealed that the SOFC demonstrated superior efficiency throughout the flight cycle. Notably, it was more fuel-efficient, exhibited higher potential for water recovery, and required a 20% smaller fuel cell stack size to yield 400 kW of electric power.
Although these studies have provided support for the implementation of hybrid systems in aircraft, it is essential to acknowledge that these studies were restricted to APUs. These APUs are typically integrated within the aircraft fuselage and utilize cabin air instead of atmospheric air. This distinction in operating environments presents a limitation in comprehending the system’s applicability in aircraft propulsive power systems. Both the APU GT and SOFC are responsible for generating electrical power for the aircraft’s cabin and components, but they do not contribute to thrust generation. Therefore, to enhance our understanding of this system within aircraft applications, it is imperative to evaluate its performance in primary propulsion.
Recent studies have started exploring SOFC/GT applications in primary propulsion systems analyzing thermodynamic performance, system component integration, fuel selection, and different configurations. When applied in primary propulsion systems, the SOFC is mainly responsible for generating electric power, while the GT is responsible for propulsive power. Seyam et al. [17] analyzed a commercial turbofan SOFC system’s thermodynamic performance, emphasizing performance variation under different fuels. Papagianni et al. [18] designed an aircraft SOFC/GT based on natural gas, evaluating its performance under long and short-haul flights. Tarroja et al. [19] performed design iterations on a 50 kW system for UAVs using liquid hydrogen, focusing on pressure ratio, oxygen utilization, and current density effects. Ji et al. [20] conducted comparative studies on turbojet engines, emphasizing the advantages of the inter-stage turbine burner (ITB)-SOFC configuration, and developed a turbine-less engine integrated with SOFC for UAVs [21].
Most publications based on this hybrid system have mostly been computational analysis through modeling and simulations. However, Kojima et al. [22] recently created an experimental rig of an SOFC/GT liquid hydrogen-fueled electric propulsion system. It is a combined cycle with 1500 W planar type SOFC and two-spool 10 kW GT. It is an essential proof of concept, and the performance results obtained are essential to validate the adoption of such a system for aircraft propulsion. Wilson et al. [23] also analyzed an SOFC/GT system that demonstrated higher fuel-to-electricity conversion efficiency than traditional gas turbine engines fitted with generators. However, challenges exist when the hybrid system’s mass and volume significantly impact aircraft aerodynamics. Waters [5] addressed volume issues, suggesting geometry modifications to minimize aerodynamic drag within the hybrid system. Collins and McLarty [24] provided a detailed power density comparison, and Guo et al. [25] explored turbine-less hybrid electric propulsion, evaluating system performance in variable configurations.
In a comprehensive analysis conducted by Waters et al. [26], the aircraft SOFC/GT system is thoroughly examined using Numerical Propulsion System Simulation (NPSS) software. This study includes a detailed aerodynamic analysis of the GT, SOFC, and reformer, providing realistic representations and highlighting aerodynamic losses. The research evaluates the fuel consumption variation for each system configuration, resulting in a reduction in fuel consumption by 4–8%. Similarly, Waters et al. [27] contributed to the field by performing hybrid system optimization. This study identified local optimum fuel cell operating states through the analysis of operating voltage and percentage fuel oxidation. The authors concluded that the performance benefits of the SOFC/GT can be optimized by using careful external aerodynamic design.
The application of the SOFC/GT hybrid system for primary propulsion in aircraft has been supported by these studies, demonstrating the proof of concept. Extensive research has been conducted on various aspects, including modeling practices, configuration designs, performance evaluation with fuel variations, and performance optimization at the design point within the context of hybrid systems. However, certain areas have not received adequate attention, specifically the identification of critical operational parameters, methods for parameter selection, and evaluation of their impact on system performance.
The lack of clear explanations from previous authors regarding the selection and justification of specific critical parameters has created ambiguity in the design of SOFC/GT systems for aircraft applications. This research aims to fill this gap by identifying the key operational parameters essential for achieving optimal performance, providing guidance on parameter selection, and examining their influence on overall system performance.
This study focuses on three critical parameters associated with each component of the hybrid system: the oxygen-to-carbon ratio (O/C ratio) of the reformer, the fuel utilization of the SOFC, and the high-pressure compressor (HPC) outlet air split ratio (AS-ratio) to the reformer, SOFC, and GT. These parameters play a crucial role in delivering sufficient electric power and thrust. The research begins by establishing the optimal design point performance under specific conditions and then systematically analyzes the impact of varying each parameter within a predetermined range.
The assessment of parameter variations provides valuable insights into the sensitivity and robustness of the system, highlighting areas that require attention during design and performance optimization. Given the interconnected nature of the components, understanding the influence of these variable operational parameters on individual components and the overall hybrid system is crucial. The primary objective is to ensure consistent fulfillment of the aircraft’s fluctuating electric power demands by the SOFC while effectively meeting propulsive requirements with the gas turbine under varying working conditions. Additionally, it is essential to ensure that the CPOx system meets the reformed fuel demand under these variable conditions.
This research represents a significant innovation by identifying critical operational parameters essential for achieving optimal performance in the SOFC/GT hybrid system. By providing insights into parameter selection methods and demonstrating the potential system response when parameters are not carefully chosen, this study contributes valuable knowledge for developing effective strategies to adapt to variable flight conditions. The findings strengthen the existing research foundation and significantly advance the understanding and implementation of the SOFC/GT hybrid system in aircraft propulsion.
2. System Establishment and Modeling
2.1. Aircraft-SOFC/GT Hybrid System Description
The SOFC is integrated into the flow path of the GT alongside a reforming reactor based on either steam reforming (SR), catalytic partial oxidation (CPOx), or auto-thermal reforming (ATR). The advantage of this system arrangement is that the GT is responsible for supplying the air, and jet fuel as well as maintaining the temperature of CPOx/SOFC. This way, losses that result from the balance of plants of separate systems are eliminated.
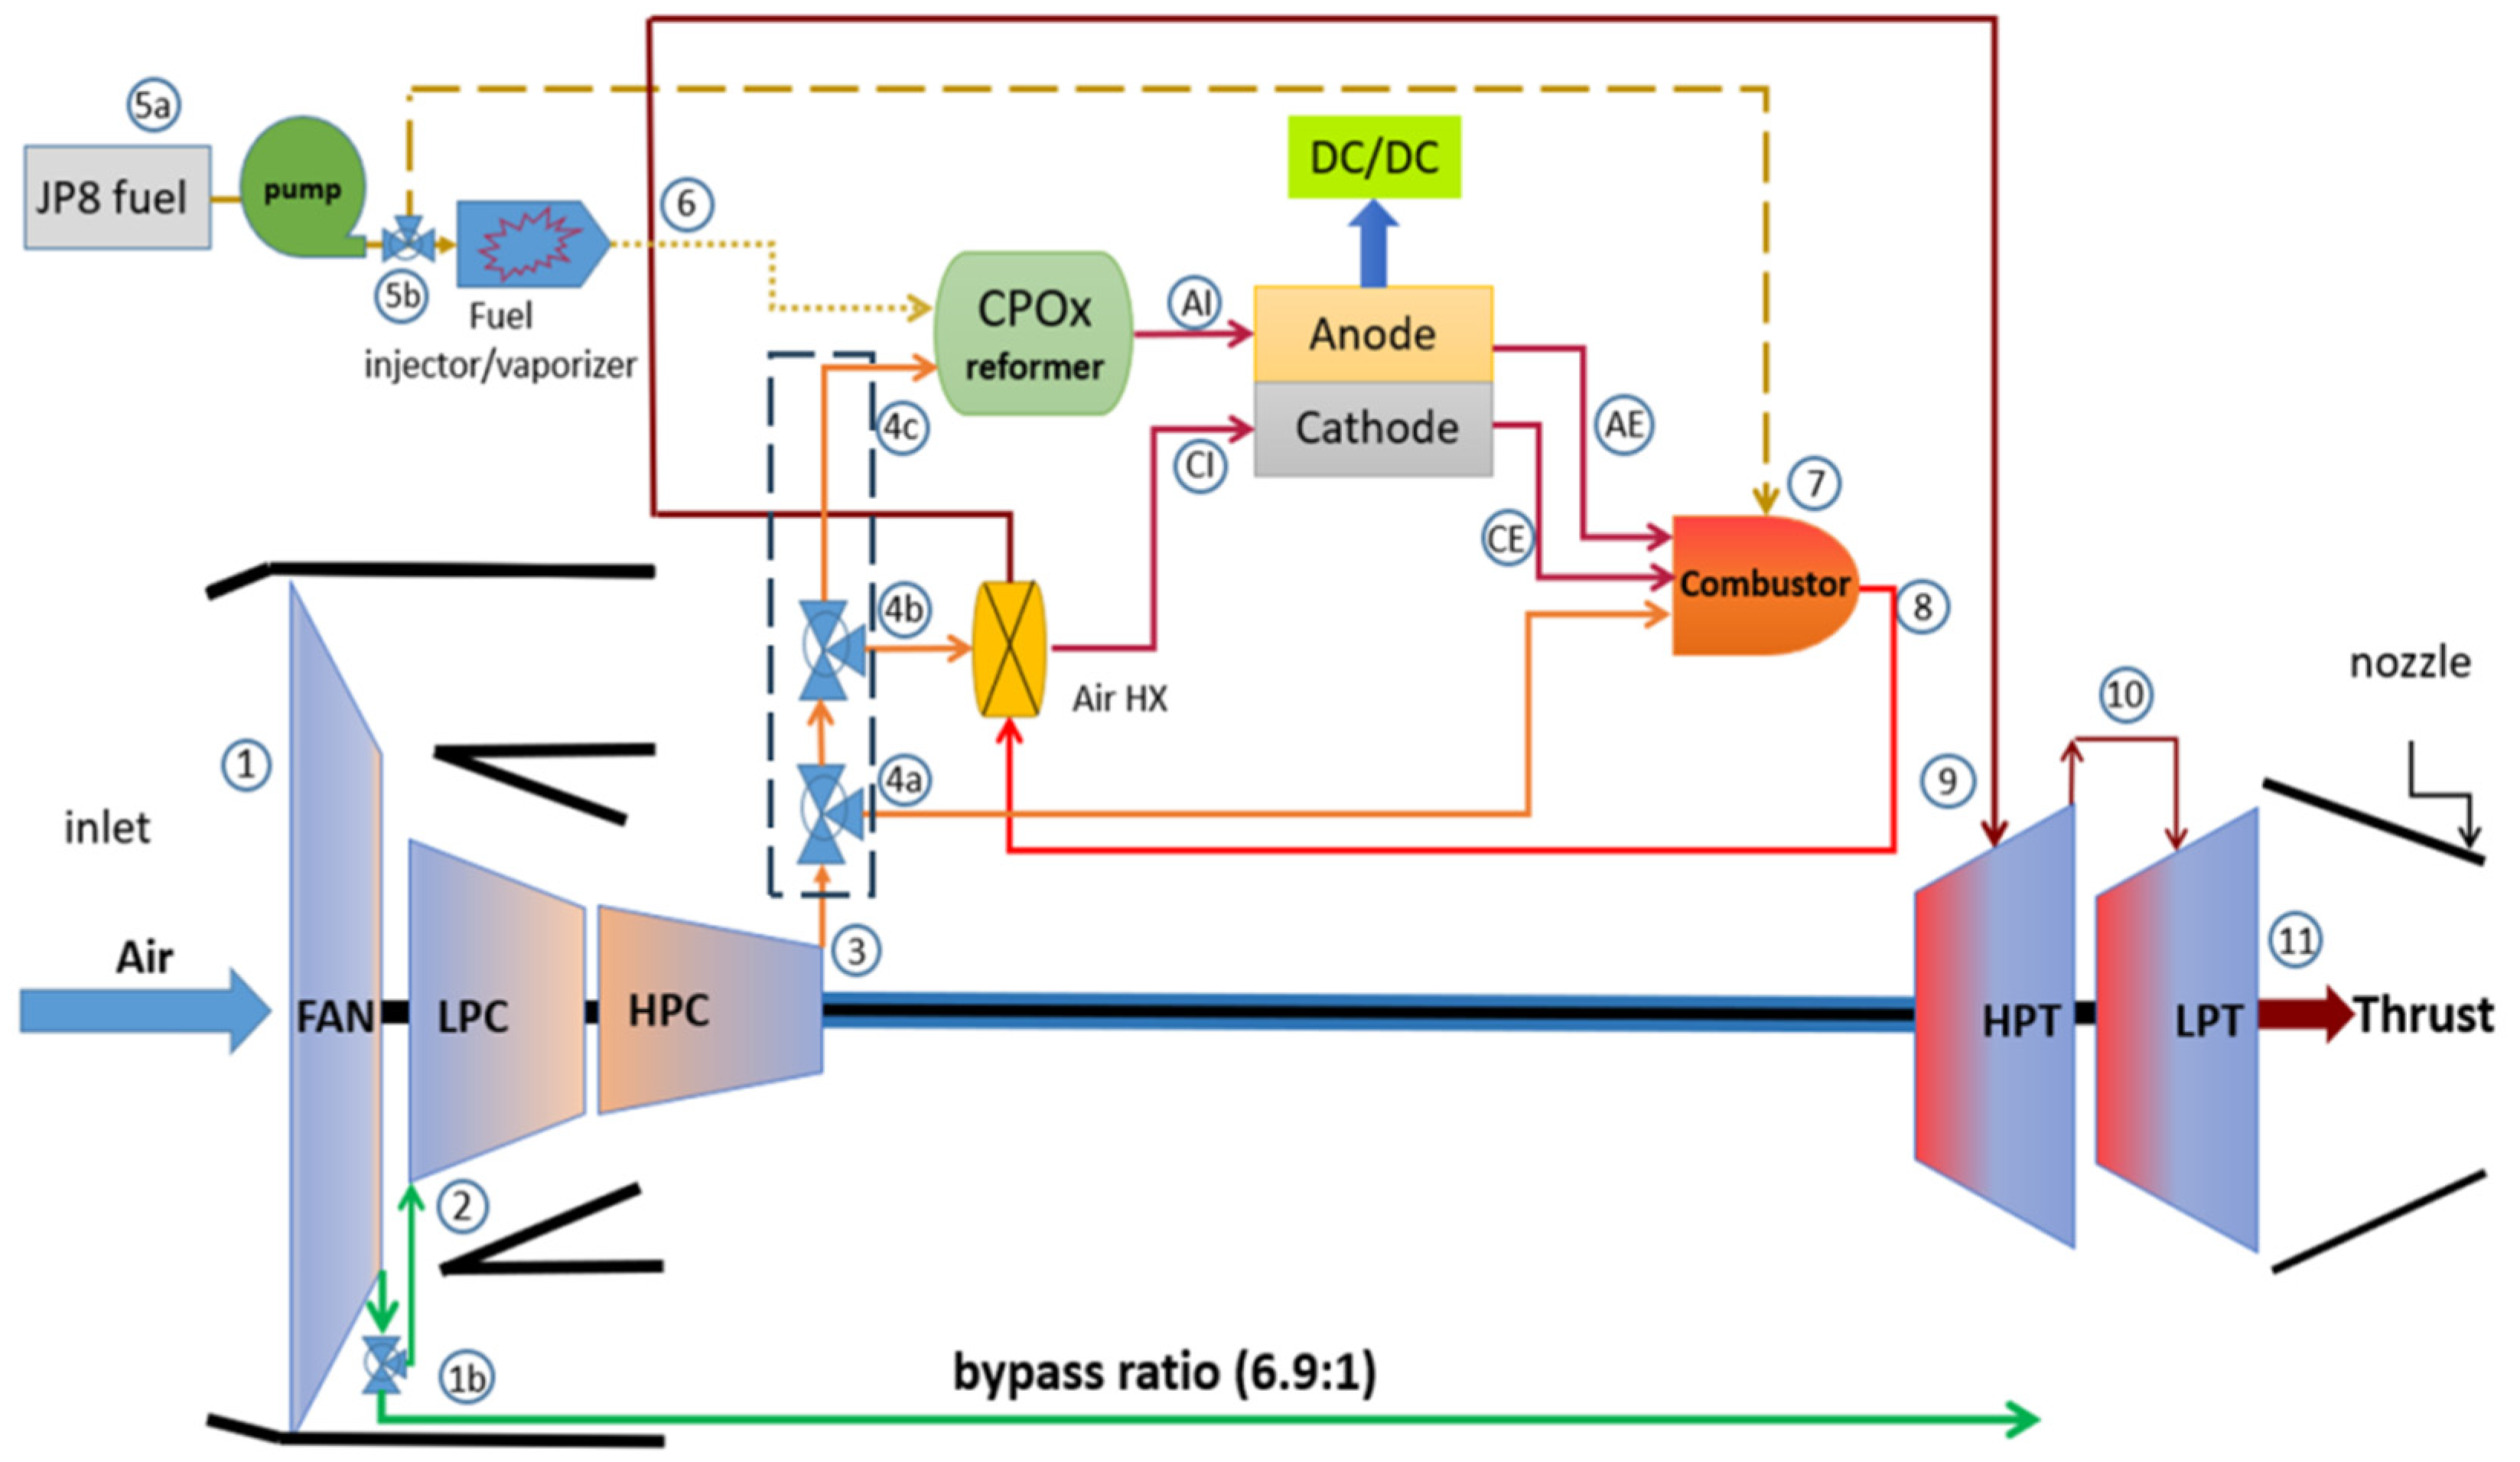
Figure 1 illustrates the chosen system configuration for analysis. This configuration directs combustor outlet fluid mass flow into the heat exchanger (HX) to facilitate heat transfer before turbine entry. This is different from the convention that utilizes the turbine outlet fluid flow for heat transfer in the HX, which is typical in SOFC/GT configurations for aircraft propulsion [23]. This intricate multi-component system is aimed at achieving optimal net system efficiency through coupling various components.
In the depicted setup, air enters the inlet diffuser at point (1), undergoes compression through the fan, and is split into bypass and core flows according to the bypass ratio at (1b). Core airflow at point (2) undergoes compression in both the low-pressure compressor (LPC) and the high-pressure compressor (HPC). The HPC outlet flow at point (3) is then further split into three streams using the split ratio (AS-ratio): reformer air flow to the CPOx (4c), cathode inlet air flow (4b), and combustor airflow (4a). The reformer air flow facilitates partial oxidation of fuel injected at (6) from the fuel injector/vaporizer at (5b), sourced from (5a). The fuel injector/vaporizer component reduces soot formation in the CPOx by utilizing higher fuel evaporation temperatures before injecting the fuel into the CPOx [28]. The resulting syngas (primarily comprising CO and H2) is then fed into the SOFC anode inlet (AI).
Cathode air flow engages in electrochemical reactions with the anode fuel and serves to cool the SOFC at the cathode inlet (CI). For cathode inlet air temperature elevation, combustor outlet flow at (8) transits through the heat exchanger (Air HX), facilitating heat transfer to the cathode inlet air from the HPC. The electrochemical reaction yields onboard electric power. Byproducts—water from the reaction, unused fuel, and SOFC exit air—are expelled at (AE and CE) and recycled into the combustor. The combustor outlet flow temperature must exceed turbine inlet temperature (TIT) because its temperature diminishes through the heat transfer in the HX before turbine entry at (9) by the nature of this configuration. To meet the TIT demands at (9), fuel injection is carried out at (7) to raise the combustor outlet air mass flow temperature. The turbine converts exit flow enthalpy and residual pressure into mechanical energy to drive the compressor and fan, with flow through the nozzle generating thrust for aircraft propulsion at (11). As this is a turbofan engine, 70% of the thrust is generated by the fan, while the rest is generated by the core flow.
2.2. Modeling
A steady-state model using a zero-dimensional approach utilizing mass and energy balance equations is sufficient to perform the necessary simulations for this investigation. Mathematical models are used to design, optimize, and predict the performance of each component within the hybrid system. The models also assist in understanding how the different components interact and affect each other within the system.
2.2.1. SOFC Model
Our research group’s previous work [29,30] developed an anode-supported SOFC model with the mathematical models used in building this system (models shown in the Supplementary Materials Table S1). In electrochemical reactions, the carbon monoxide oxidation velocity is 2–5 times slower than that of H2 and is therefore generally neglected [31,32]. The following assumptions are made upon modeling the SOFC: (1) only H2 and O2 are considered as the reacting species at the triple phase boundary, (2) there is no gas leakage in the system, (3) fuel cell stack parameters are similar, and the outlet temperature is the same as the working temperature [33], (4) the gas temperature of the cathode and anode outlet are the same, (5) changes in potential energy are not considered, (6) the flow is steady and (7) the gaseous working fluid is considered ideal.
2.2.2. Aircraft Gas Turbine Engine Model
To predict an aero-engine’s performance, a theoretical model using mathematical models has been created. It is based on the continuity of mass flow method (CMF) [34] where the flight conditions and rotational speed of the compressors are known. Using this technique, known flight conditions and compressor rotational speeds allow for calculating inlet conditions for mass flow, pressure, and temperature. These inlet conditions derive from known flight Mach numbers and rotational speeds, enabling the computation of outlet thermodynamic values for any component. An initial guess for mass flow or pressure ratio, along with gas dynamics equations, assists in calculating subsequent component starting conditions. An energy balance determines combustion chamber outlet temperatures based on known fuel flow rates, while a pressure loss factor helps derive outlet pressures from inlet pressures. Turbine entry conditions and turbine characteristics, such as shaft speeds, aid in finding outlet conditions.
The performance characteristics of the fan, low and high-pressure compressors, and turbines have been sourced from General Electric’s (GE) collaborative program with NASA, denoted as E3 [35]. These performance maps provide specific pressure ratios and efficiencies corresponding to distinct mass flow rates and rotational speeds. The ensuing mathematical models are employed to encapsulate the attributes of the gas turbine engine, culminating in a comprehensive simulation model.
- Ambient Conditions Evaluation
As the aircraft is operating in different atmospheric conditions, the first thing to model is the environmental conditions using Equations (1) and (2).
where Z—altitude, —base temperature lapse rate per kilometer of geopotential altitude = 6.5 K/km, —101,325 Pa, and —288.15 K.
- Inlet Model
Modeling the inlet diffuser of the aircraft SOFC/GT is based on the mathematical models shown in Equations (3) and (4). Its purpose is to convert the free stream inlet flow conditions to meet engine compressor air requirements.
where the speed of the sound and speed of aircraft
- M—Mach number, —specific heat ratio for the air (1.4) and R—gas constant (J/kg K)
- Compression Stage Model
To model the fan, as well as low and high-pressure compressors, the following mathematical models are utilized in this model from Equations (5)–(11). The map provides pressure ratio and mass flow rate and isentropic efficiency as a function of corrected mass flow and corrected rotational speed [36]. Each compressor in the compression stage has its own set of performance maps used to build this model. The data extracted from here are fed into the Simulink look-up tables, which are capable of outputting the required pressure ratio and efficiency for the corrected mass flow and rotational speed input.
The fan, LPC and HPC utilize the same mathematical models from Equations (5)–(11). The inlet conditions of the component are the outlet conditions of the component before it. Corrected parameters used for interpolation methods are noted in Equations (5) and (6).
where W—work, m—mass flow, cp—specific heat capacity, —pressure ratio, —efficiency, P—pressure, T—temperature, —corrected parameters, and DP—design point.
- Combustor Model
The combustor of the aircraft SOFC/GT makes use of the residual gas emanating from the SOFC anode, which is primarily made up of CH4, CO, and H2, amongst other particulates. The combustor exit temperature is solved off its inlet conditions and efficiency.
where —enthalpy; —fuel-to-air ratio (FAR). —set parameter (thrust control), determining the flow rate of the fuel into combustor, —hydrogen-to-air ratio, —the carbon-monoxide-to-air ratio, is methane-to-air ratio, Cp—heat capacity, T—Temperature, and —efficiency.
where —combustor pressure loss ~4%.
- Turbine Model
For the turbine models, performance maps are used in Simulink lookup through data extracted from the map. However, for the turbines, only the pressure ratio output requires both the corrected mass flow and corrected rotational speed like the compressor. Efficiency is a function of the pressure ratio and corrected rotational speed. The mathematical models used are from Equations (16)–(22).
where —turbine inlet temperature, g—gas, W—power, —expansion ratio, —efficiency, P—pressure, T—temperature, —corrected parameters, and DP—design point.
- Nozzle Model
The last component in the aircraft SOFC/GT design is the nozzle. The following mathematical models are used for this component as shown below. The partially expanded gas from the turbine is accelerated to high velocities, contributing to the thrust generated to propel the aircraft. A convergent nozzle is typically used in turbofan engines and is therefore selected. Firstly, the nozzle is checked for choking both in the fan and core nozzle. Equations (23) and (32) show how this is achieved.
For a choked nozzle: The ratio of nozzle inlet pressure () to ambient pressure () is greater than the ratio of nozzle inlet pressure to the choking critical pressure (). Therefore:
Then, nozzle exit conditions are:
For an unchoked nozzle: It is the opposite.
Then, nozzle exit conditions are:
- Thrust and Engine Performance Evaluation
Finally, after these parameters are evaluated, the aeroengine thrust () can be calculated using Equation (33).
where the bypass and core fractions are calculated as:
and the velocities for non-perfectly expanded nozzles are calculated as:
To evaluate the aeroengine performance, the following performance evaluation parameters are adopted as shown.
Thrust-specific fuel consumption: In the context of cycle analysis, the objective is to minimize thrust-specific fuel consumption (TSFC), aiming to achieve optimal efficiency in generating thrust while minimizing fuel consumption.
where is the GT fuel inlet flow rate.
Thermal efficiency : This parameter evaluates how well an engine converts the thermal energy inherent in the fuel resulting in the net gain of the kinetic energy of the working medium.
where is the heating value of the fuel, is the change in kinetic energy.
Propulsive efficiency : The portion of the mechanical output of the engine converted to thrust power is called propulsive efficiency.
Overall efficiency : It is the product of thermal and propulsive efficiencies.
- Shaft Model
Maintaining a power equilibrium between the compressors and turbine is of utmost importance during the operation of the GT. This task involves aligning the steady-state operation of the engine with the operational parameters of both the compressor and turbine. Any deviations from these operational parameters will lead to an unbalanced torque, which necessitates the establishment of a new steady-state equilibrium through dynamic adjustments (hence, Equation (42)). This is achieved by employing an iterative process, which iterates for a known rotational speed until the pressure ratio and efficiency of each turbine and compressor, as obtained from the performance maps, yields the power equilibrium. This power equilibrium is then utilized to perform steady-state calculations for the hybrid system. Consequently, the rotational speed is dependent on the energy discrepancy between the work extracted by the turbine and the work performed by the compressor [36]. This relationship is mathematically represented by the following model:
where is rotational speed (rpm), is the polar moment of inertia (kgm2), and is the work.
2.2.3. CPOx Model
The calculations for the reformates are all supposed to be at equilibrium since the reaction is fast. The chemical equilibrium is established using the minimization of the Gibbs free energy method (MGFE). The method is based on minimizing the Gibbs free energy of the system reacting [37]. This results in finding the molar values of the species in the reaction when that total energy reaches a minimum value at a particular temperature and pressure. We set constraints on the mass balance of the species. The product species of the CPOx reaction between air and C12H26 will be C, CO, CO2, H2, CH4, and H2O, essentially following the following reaction:
C12H26 (g) + a(O2 + 3.76N2) (g) → bCO(g) + cH2(g) + 3.76aN2(g) + dCO2(g) + eCH4 + fH2O(g) + gC(s)
As air is being added to the reaction, only the oxygen (O2) portion (approximately 21% of all inlet air) is considered for this reaction. The O2 is added to the fuel at the oxygen-to-carbon (O/C) ratio defined as the ratio of twice the molar oxygen flow rate versus the molar flow rate of the fuel carbon within a hydrocarbon reaction scheme [38]. A value of O/C of 1 denotes the stoichiometric partial oxidation point.
The air source is the HPC outlet air flow, which has its own enthalpy, and the fuel added to the reformer is assumed to be vaporized on entry with a temperature of approximately 630 K. If the fuel inlet temperature exceeds this temperature, heterogeneous reactions would initiate before the catalyst, which is undesirable [39]. The exit flow enthalpy is therefore dependent on the variable HPC outlet air flow enthalpy, which changes with the operational points. Therefore, the O/C ratio for reforming is variable to satisfy the outlet temperature requirements and, in adiabatic reforming, the heat equilibrium must be satisfied.
The energy balance equation is used to determine through iteration with the equations below:
The iteration between the reformer outlet flow rate and the is performed with the MGFE method, which utilizes the to perform chemical equilibrium reactions at a set reactor pressure, which is preferably set at 300 kPA to maximize the outlet flow composition of H2 and CO.
where is the Gibbs free energy of the reactant and product species calculated at .
Efficiencies are obtained based on the medium of fuel utilization, and in this case, the SOFC. The efficiency of the reformer is expressed by:
where LHV is the lower heating value of each of the species’ components in the equilibrium reaction. The pressure loss through the CPOx reactor is 4% of the inlet pressure.
The outlet flow rate of each of the species is solved numerically using the MATLAB-fsolve function at and set pressure . is the standard pressure of 100 kPa and is the molar fraction. The reformer outlet flow rates with the flow outlet temperature (which is also considered the reforming temperature) and pressure are then added to the SOFC anode.
2.2.4. Heat Exchanger Model
The heat transfer from the combustor outlet hot fluid to the cathode inlet cold fluid is performed by the heat exchanger. It is modeled according to the ξ-NTU method obtained through the following:
where subscripts “” and “” mean hot fluid and cold fluid flow through the heat exchanger. is the heat capacity rate and the smallest between and . The is the effectiveness of the heat exchanger evaluating how well it facilitates for heat transfer. The pressure loss through the heat exchanger is 4%.
It is important to acknowledge that, given the unique configuration employed in this study, the heat exchangers utilized are not of a conventional nature. This is due to the requirement of facilitating heat transfer, as depicted in Figure 1, where the Air HX must handle extremely high temperatures exceeding 1700 K emanating from the combustor outlet. As commercially available heat exchangers capable of meeting these specifications are not currently accessible, the proposed solution involves the utilization of specialized heat exchangers constructed from refractory materials. The following options can be considered:
Ceramic heat exchangers: These heat exchangers are manufactured using high-temperature ceramic materials such as silicon carbide (SiC) or alumina (Al2O3). They possess the ability to withstand temperatures up to 1700–1800 °C (1973–2073 K) and find applications in areas such as high-temperature gas cooling, chemical processing, and power generation [40].
Graphite heat exchangers: Graphite, a form of carbon, exhibits exceptional thermal conductivity and resistance to high temperatures. Heat exchangers made from graphite are employed in situations where temperatures can surpass 1700 K [41].
By considering the use of these specialized heat exchangers, this study aims to address the specific requirements of the heat transfer process in the given configuration. These alternatives offer the necessary properties to withstand the extreme temperatures involved, ensuring the efficient operation of the system.
2.2.5. Calculation Flow Chart
A flowchart is shown in Figure 2 which shows the calculation procedure for the hybrid system developed. The computer model is based on this lumped method developed in the MATLAB/Simulink environment. The calculation process encompasses three primary parts: CPOx fuel processing, SOFC electric power generation, and GT performance evaluation. These sections operate concurrently in every simulation, tightly intertwined to optimize the hybrid system’s performance. The analysis begins with determining the aircraft’s state (ascending or descending) to adjust engine power and inlet air mass flow based on altitude, BPR, and Mach speed. Subsequently, a compression stage analysis determines the pressure ratio and efficiency.
The reformer section involves setting the O/C ratio and reactor pressure, using MATLAB R2023a for nonlinear reforming calculations, and adjusting the AS-reformer for optimal fuel utilization. SOFC power generation entails setting current density, ensuring optimal cathode inlet temperature, and achieving 75% fuel utilization while solving electrochemical reactions. Temperature control involves adjusting HPC outlet cathode air fraction (AS-cathode) characteristics and HX effectiveness for the desired performance. The combustor section allocates fuel, determining FAR values to meet temperature demands, influenced by chosen HX effectiveness. The final stages involve turbine calculations, power balance assessment, and engine performance analysis, ensuring optimal SOFC voltage/power, thrust properties, and propulsive efficiencies. Each step requires specific adjustments for compatibility and optimal system performance. The colors of the arrows distinguish different processes associated with a calculation stage.
2.2.6. System Design Point Parameter Selection
Table 1 shows the variable parameter selection to be used in the system simulation. These parameters are carefully selected to model each of the main components used to build the system. However, under different operational conditions, these parameters are subject to change. The design point conditions are (altitude: 11 km, Mach: 0.8, standard day). The parameters for variable performance are altered relative to the design point parameters.
3. Calculation Results and Discussion
3.1. Design Point Thermodynamic Performance Analysis
At the design point (Cruise = 11 km, Mach = 0.8, AS-ratio = [0.00475(reformer):0.84532(cathode):0.15(combustor)]), Table 2 presents crucial performance indicators for each constituent within the hybrid system. The SOFC’s performance at this specific AS-ratio successfully produces power meeting the flight point’s demands without compromising the thrust generation capabilities of the GT. The performance at design point shows that this AS-ratio has a bearing on optimal performance of the hybrid system.
During cruise, the power requirement stands at 102 kW, a demand that is met by the SOFC. At various other flight points, differing power demands lead to distinct outcomes, each associated with its unique electric efficiency, voltage, and power density. Table 3 shows the system node characteristics for the hybrid system from the inlet to outlet at this flight point. The node markings are similar to those in the configuration Figure 1 and provide thermodynamic data and flow rates at that point.
3.2. Model Validation Analysis
In this research work, a 300-cell planar fuel cell stack system is intended to meet a variable electric load along the flight profile. At cruise conditions (11 km and Mach 0.8), where the SOFC validation is performed, the electric load demand is approximately 103 kW. An experimental study of an anode supported SOFC by [43] is used as a reference for SOFC cell validation. Figure 3 shows that the results between the simulation and experimental results agree within very reasonable limits, especially within the range of 5000 A/m2.
The work utilizes a model based on the General Electric energy-efficient engine (E3) [44,45], a turbofan renowned for pioneering technology in aeroengines. This choice establishes an optimal platform for testing the hybrid system. During cruise, the model aligns closely with data referenced from Patt, RF [46] and Davis et al. [47] at the design point (altitude = 11 km, Mach = 0.8, standard day). Table 4 shows the parameters used to validate the GT performance. The simulation results and referenced results are within −3% to 3% relative error. Within this difference, acceptable performance validation is granted.
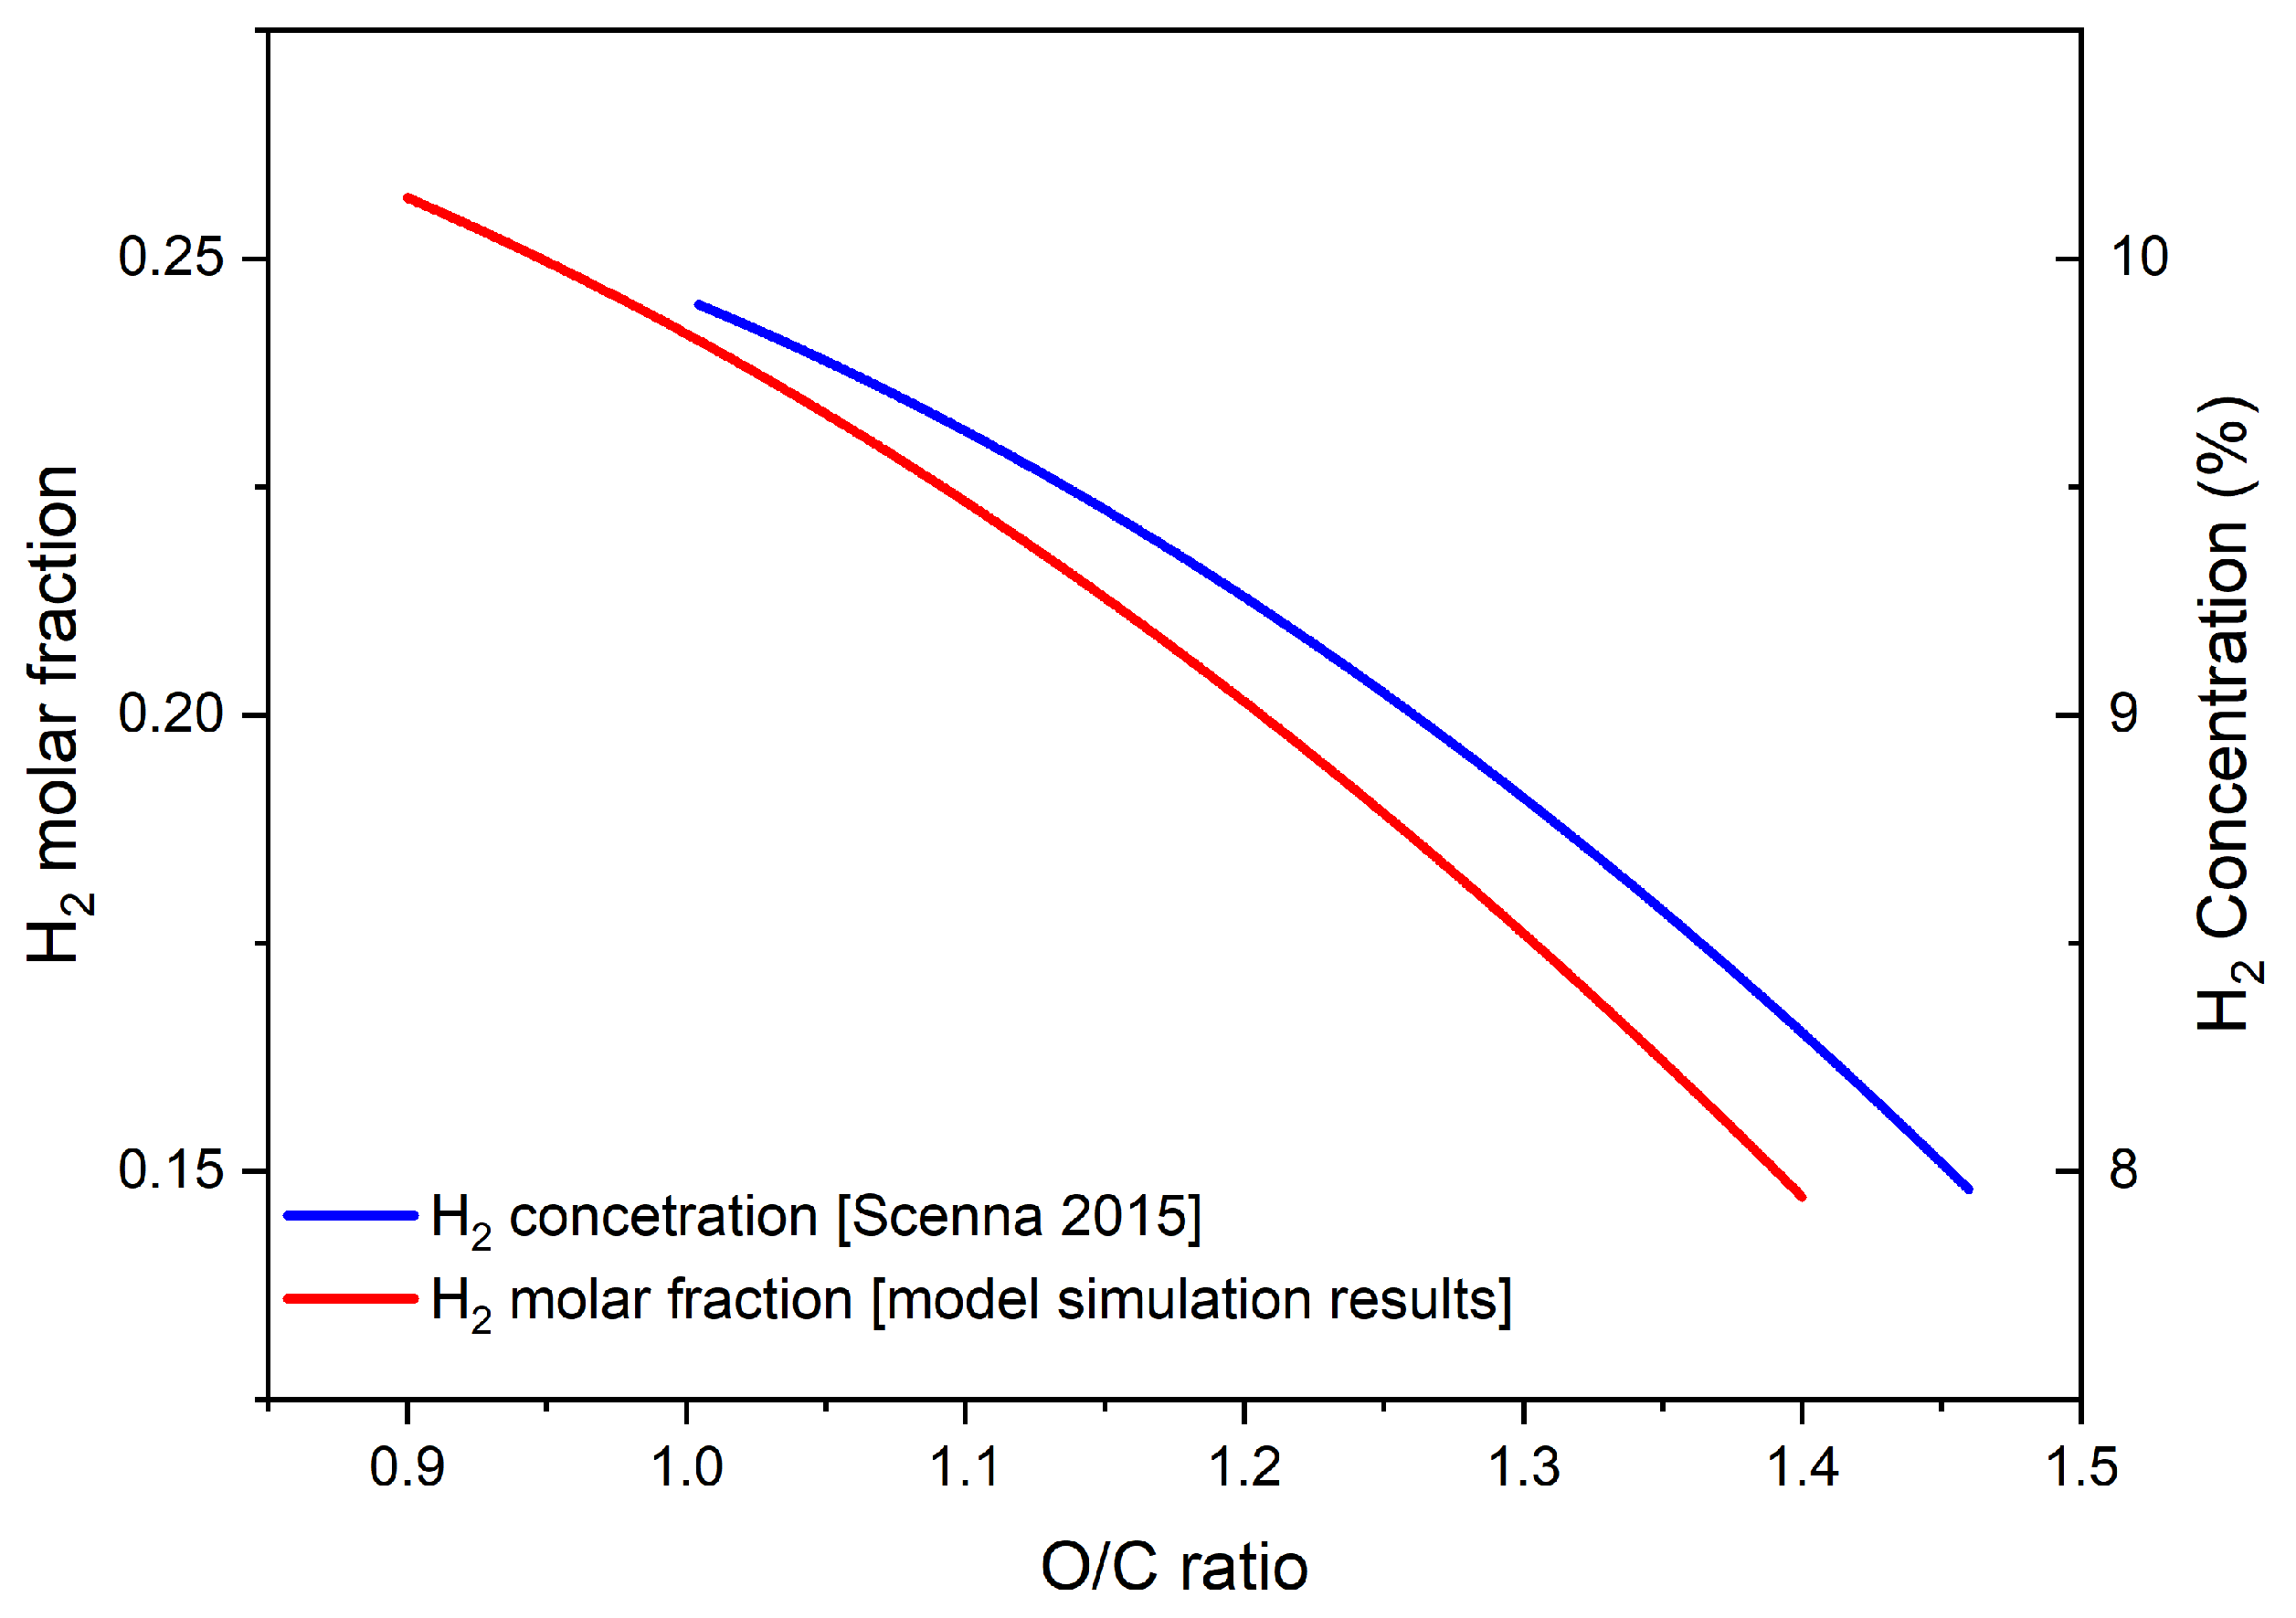
The performance of the CPOx reactor is cross-referenced and validated against prior research by the authors of [48], who conducted partial oxidation experiments using JP8, the identical fuel utilized in this present study, as shown in Table 5. Notably, this model demonstrates a comparable trend in H2 species fraction as observed in Scenna’s H2 concentration, adjusting for the O/C ratio, depicted in Figure 4. Despite quantitative discrepancies arising from differing operational conditions for the CPOx in these scenarios, the consistent performance trend persists. Furthermore, the adherence of La Chatelier’s principle amidst pressure and temperature fluctuations further reinforces the validity of the model.
3.3. Hybrid System Off-Design Performance Evaluation under Variable Operation Parameters
This study primarily focuses on the design point, where optimal performance is established. To gain a deeper understanding of the system’s behavior and assess its performance under less-than-optimal conditions, an off-design analysis was conducted. This analysis investigates the impact of varying critical parameters on achieving the best performance. Specifically, the selected parameters for analysis are the reformer O/C ratio, SOFC fuel utilization, and HPC outlet split ratio. By exploring these variable parameters, this study aims to evaluate the system’s performance when these key factors deviate from their optimal values.
By conducting the off-design analysis, this study aims to gain insights into how the system performs when operating away from its optimal design point. This analysis provides valuable information on the system’s robustness and flexibility in accommodating variations in critical parameters, which is crucial for real-world applications where operating conditions may deviate from the ideal design point. This analysis mirrors the assessment of the main hybrid system performance parameters outlined in Table 2.
This study offers a unique perspective on enhancing aircraft endurance, range, and reducing emissions through the application of the SOFC/GT system. Given the novelty of this concept, certain system sensitivities remain unexplored, especially in the context of aircraft application. The careful consideration of the three mentioned parameters during system design is crucial for achieving optimal performance at the design point. Neglecting these aspects may incur costs and hinder the attainment of increased endurance, range, and reduction in emissions.
3.3.1. Effect of O/C Ratio Variation on the Hybrid System Performance
Research findings highlight CPOx as the optimal choice for aviation fuel reforming in both aviation and aerospace applications, justifying its inclusion in this study [49]. The performance of the CPOx reactor exhibits variations based on factors such as pressure, temperature, and fuel/air inlet conditions. In this assessment, the O/C ratio of the CPOx reformer is identified as a pivotal parameter due to its significance in achieving optimal performance at design point. Given its close association with the CPOx reformer, the initial evaluation focuses on its influence on the reformer itself. The subsequent analysis extends to the immediate component affected by CPOx performance, the SOFC, with a comprehensive examination of its impact. The overall effects on the hybrid system are meticulously examined, leading to conclusive insights.
Throughout this analysis, key parameters are maintained at specific values: the reactor pressure is consistently set at 300 kPa, the HPC outlet air split ratio is held at [0.00475(reformer):0.84532(cathode):0.15(combustor)], the current density is fixed at 5000 Am−2, the HPC outlet air temperature is maintained at a constant 850.22 K, the heat exchanger effectiveness (HX-ξ) remains steady at 23%, the completely vaporized fuel is injected at a constant temperature of 643.1 K [48], the GT FAR is sustained at 0.02715, and the total engine inlet air flow is kept constant.
With the other parameters held constant as aforementioned, the O/C ratio becomes the main variable parameter in the CPOx reactor, significantly influencing the fuel generation capabilities of the reactor. Figure 5 and Figure 6 illustrate the effect of variation in the O/C ratio. A variable O/C ratio implies a change in the CPOx inlet fuel flow rate to accommodate this change in O/C ratios, as shown in Figure 6, as the CPOx inlet air flow rate is held constant. Along the flight profile, the SOFC power output is changing, and this subsequently influences the performance of the CPOx, effecting its outlet flow fractions to cater to variable SOFC fuel utilization. Figure 5 displays the composition of species in the outlet flow of the reactor. Examining the figure reveals that the composition of species in syngas is notably influenced by the selected O/C value. Specifically, the O/C variation shows that the molar fractions of hydrogen (H2) peak at lower O/C ratios (the partial oxidation regime), and beyond an O/C ratio of 0.9, the H2 molar fractions begin to decrease.
Additionally, our analysis includes a critical assessment of carbon (C) formation, which is predominant at lower O/C ratios. Consequently, this consideration plays a pivotal role in the selection of the optimal O/C ratio, as achieving a lower carbon molar fraction is desirable for enhancing the CPOx performance. Furthermore, the exothermic nature of the catalytic partial oxidation reaction presents a secondary constraint, as lower reactor temperatures are preferable to mitigate heat sintering. The ideal generation of syngas is observed at an O/C ratio of approximately one-third of stoichiometric air for combustion (O/C = 0.33). However, this region is characterized by a high presence of soot and intense coking-graphite formation, rendering it unsuitable for system application.
It is therefore important to note that lower O/C ratios, while yielding higher syngas production, are constrained by the increased formation of graphite. This limitation necessitates a balance to prevent graphite fouling while maximizing syngas production. Consequently, the shaded region denoted as “S” represents the preferred range for CPOx reactions, striking a balance between syngas production, carbon formation, and reactor temperature considerations for optimal system performance. The region “S” correlates to a bound acceptable for optimal CPOx performance ranging between 0.85 and 0.95.
A crucial aspect to consider for this analysis is the effect this outlet reformate fuel flow has on the fuel utilization (FU) of the SOFC. Only H2 is considered for the assessment of the SOFC FU. Figure 6 shows the FU increase with O/C ratio, showing that O/C ratio affects the SOFC FU. Beyond O/C = 1.1, the FU is 100%. This implies complete fuel consumption in the stack at O/C ratio > 1.1, necessitating an adjustment of the O/C ratio setting to maintain the fuel utilization within the ideal 75% range. A safe range of the SOFC utilization is ±10% of the ideal fuel utilization, as shown in shaded region “P”. Anything higher or lower than this safety margin will yield performance issues in the SOFC, either excessive fuel or fuel deprivation, which affects the longevity of the stack through overheating, inefficient electrochemical reactions and carbon deposition, ultimately making the fuel cell performance inefficient.
The impact of varying this parameter on key performance parameters of the hybrid system is evaluated. Given the established influence of the O/C ratio on SOFC FU, we extend our investigation to observe its effects on other hybrid system performance parameters. Certain SOFC performance metrics are directly linked to SOFC FU, and any variation in the latter will consequently impact these metrics. These metrics encompass SOFC cell voltage (representing SOFC power), and electric efficiency. The SOFC working temperature is also assessed, as it is an important parameter that influences the electric power generation in the SOFC.
Figure 7 illustrates that an increase in the O/C ratio results in higher SOFC voltage and electric efficiency for the stack. The working temperature exhibits a modest variation within the range of 1070–1073 K. This is attributed to the optimal selection of the HPC outlet air split fraction to the cathode (AS-cathode), maintaining the stack temperature within this range to achieve a stack output power ranging between 97 and 108 kW. The AS-cathode air fraction serves dual purposes in the stack, facilitating electrochemical reactions and providing cooling. Most of this air fraction is utilized for stack cooling, leading to minimal variation in the stack temperature. However, if the air fraction is suboptimal, the temperature variation in the SOFC would be more significant. In this assessment, the cathode inlet temperature and AS-cathode are held constant, resulting in a low variation in stack temperature.
From Figure 7, it is evident that with higher O/C ratios, the SOFC output power increases, electric efficiency also rises. However, in this operational region (O/C > 1.1), the high SOFC FU will cause performance issues. Therefore, it does not represent the optimal operational region for achieving optimal hybrid system performance. The selected O/C ratio at the design point is 0.85, resulting in the SOFC performance detailed in Table 2. For the chosen optimal region, the design point cell voltage required to meet the power demand is 0.7594 V, yielding a stack output of 102 kW and an electric efficiency of 45.89%. This leads to the conclusion that a suboptimal O/C ratio influences the electric power generation of the hybrid system.
Considering the hybrid system’s intended use for aircraft propulsion, it is essential to analyze the impact of a variable O/C ratio on thrust generation capabilities. The analysis reveals that thrust variation is not substantial, decreasing marginally from 7.92 to 7.86 kN, with an increase in O/C ratio, as shown in Figure 8. As the overall efficiency of the GT is linked to thrust generated, it exhibits a similar variation, decreasing with an increase in O/C ratios. Despite the decrease in thrust generation, with a constant FAR, the TSFC increases proportionally, rising from 308 to 311 mg/s/N. This leads to the conclusion that the thrust generation capabilities of the GT are not significantly affected by the variable O/C ratio.
3.3.2. Effect of Variable SOFC Fuel Utilization (FU) on Hybrid System Performance
Another critical parameter that greatly influences the performance of the SOFC/GT is the SOFC fuel utilization calculated in Equation (54). As observed earlier, the FU can be a dependent parameter influenced by the anode inlet conditions (H2 inlet flow rate). However, independently, the FU of the stack can be varied for constant anode inlet conditions. This analysis varies the FU from 60% to 95% by inducing a variable current density () with everything else held constant and then aims to evaluate its influence on the electric generation capabilities of the hybrid system as well as the effect that may be observed on the thrust generation capabilities of the hybrid system. The is calculated as follows:
where is the number of fuel cells in a stack, is the area of the fuel cell, is the number of electron transfer, is the current density and is the Faraday constant.
Figure 9 shows the hybrid system performance under off-design conditions. As noted earlier, the safe region of the FU is 75 ± 10% for optimal system performance. It is observed in Figure 9A that as the FU increases, the stack power also increases, as expected, making the stack more efficient. There is also an effect on the stack temperature, which changes with change in FU, with the FU between 70 and 85% showing the best performance of the stack. At the design point, the desired stack output power is 100 kW. If the inlet fuel conditions and air flow conditions into the stack are kept constant, an SOFC FU of approximately 75% will yield this desired power. Therefore, if only the SOFC FU is the variable condition and every other parameter is kept constant, the power demand will determine the stack efficiency obtained. The shaded region “P” shows the range acceptable for SOFC FU.
The influence of the SOFC FU on the GT is analyzed, and performance variation is shown in Figure 9B and Figure 10. Since a variable FU means that the SOFC anode outlet conditions are different, the SOFC outlet flow (including unreacted fuel) is recycled in the combustor. This therefore means that the combustor outlet temperature characteristics need to change. The combustor FAR is held constant at 0.02715 for this analysis. For a variable FU from 60% to 95%, the combustor outlet temperature (Tcombustor) changes from 1761 to 1755 K. This is an expected variation, as a high FU means less recycled unused fuel in the combustor, reducing the combustor temperature. As the cathode inlet temperature (Tcathode) is influenced by the Tcombustor, its variation displays the same trend as the Tcombustor, changing modestly from 1052.6 to 1051.3 K, a very slight difference for the FU change. As such, the turbine inlet temperature (TIT) follows the same variation trend for the same FU change, reducing, however, from 1558 to 1554 K. These variations are graphically represented in Figure 10.
The GT performance parameters, i.e., thrust, TSFC and overall efficiency, are assessed for performance variation as shown in Figure 9B. The thrust generated reduced from 7.907 to 7.887 kN, a very slight difference attributed to the slight variation in TIT variation. As the overall efficiency is dependent on the thrust generated, its performance variation follows the same general trend, decreasing with the increase in SOFC FU. The TSFC of the GT increases very slightly from 309 to 309.8 mg/s/N. It is therefore concluded that the SOFC FU does not yield substantial performance variations in the GT; however, it has a great influence on the electric power generation capabilities of the hybrid system.
3.3.3. Effect of Variable AS-Ratio on Hybrid System Performance
The HPC outlet air flow is distributed into three fractions, denoted as AS-ratio, directed towards the reformer (AS-reformer), SOFC cathode (AS-cathode), and combustor (AS-combustor). Figure 11 graphically depicts this ratio. While a singular optimal ratio suffices for stationary applications to yield constant output power, the dynamic operational conditions of mobile applications, such as aircraft, necessitate a varying ratio due to fluctuations in the engine inlet air mass flow rate associated with altitude changes during flight. The engine power settings (throttle setting) influence engine inlet flow rate, subsequently influencing AS-ratio. Therefore, this prompts the importance of understanding system performance when the AS-ratio is varied.
This variability in the AS-ratio has a profound impact on the overall performance of the hybrid system. At design point, an AS-ratio was optimally selected to yield optimal performance. To discern the extent of influence this parameter exerts on system performance under off-design analysis, individual fractions within the AS-ratio are subjected to perturbations. Altering one fraction inherently induces changes in the remaining two fractions. The analytical approach to AS-ratio perturbations involves selecting a specific fraction for analysis and assigning values to it. The assigned value exhibits the most substantial skew, whether an increase or decrease, from the designated design point fraction. Concurrently, the other two unassigned AS-ratio fractions are adjusted in accordance with Equation (55), ensuring a proportional variation from the design point AS-ratio. This systematic perturbation analysis provides insights into the sensitivity and interdependence of the AS-ratio fractions, offering a nuanced understanding of their role in influencing the hybrid system’s performance. Essentially, this is an analysis of the response of the hybrid system performance with variable AS-ratios that are skewed towards one fraction of the ratio. Such investigations are essential for optimizing the AS-ratio under dynamic operational conditions, particularly in mobile applications, to maintain optimal performance throughout varying flight profiles.
where is value of either one of the unassigned AS-ratio fractions; is the ratio of the unassigned fractions at design point; and is value of the assigned AS-ratio fraction. In Table 6, Table 7 and Table 8, the perturbed fraction in AS-ratio is highlighted in blue.
AS-Reformer Variation and Its Effect on Hybrid System Performance
The reformer fraction at the design point is set at 0.00475 of the total HPC outlet air fraction, allocated for reforming reactions in the CPOx process. The shaded region in Table 6 includes the design point area, representing the bound where optimal performance is achieved. Throughout this analysis, key parameters are held constant: the O/C ratio is maintained at a steady value of 0.85, current density is fixed at 5000 Am−2, HX-ξ remains constant at 23%, HPC outlet air temperature is compressed and consistently maintained at 850.22 K, GT FAR is sustained at 0.02715, and the total engine inlet air flow remains unaltered. The sole parameter subjected to variation is the AS-ratio, with specific attention given to the perturbations of the AS-reformer in this section, as detailed in Table 6. Each instance in the table corresponds to a unique AS-reformer fraction value, and the remaining fractions of the AS-ratio are determined using Equation (55) to ensure a proportional adjustment consistent with the design point AS-ratio. The ensuing graphical representation in Figure 12 and Figure 13 illustrates the variations in hybrid system performance resulting from the perturbations in the AS-reformer fraction.

Table 6.
AS-reformer ratio variations.
| Design Point AS-Ratio | 0.00475:0.84532:0.15 |
|---|---|
| AS-reformer 1 | 0.0010:0.8484:0.1506 |
| AS-reformer 2 | 0.0025:0.8472:0.1503 |
| AS-reformer 3 | 0.0550:0.8026:0.1424 |
| AS-reformer 4 | 0.1000:0.7644:0.1356 |
| AS-reformer 5 | 0.2500:0.6370:0.1130 |
| AS-reformer 6 | 0.4000:0.5096:0.0904 |
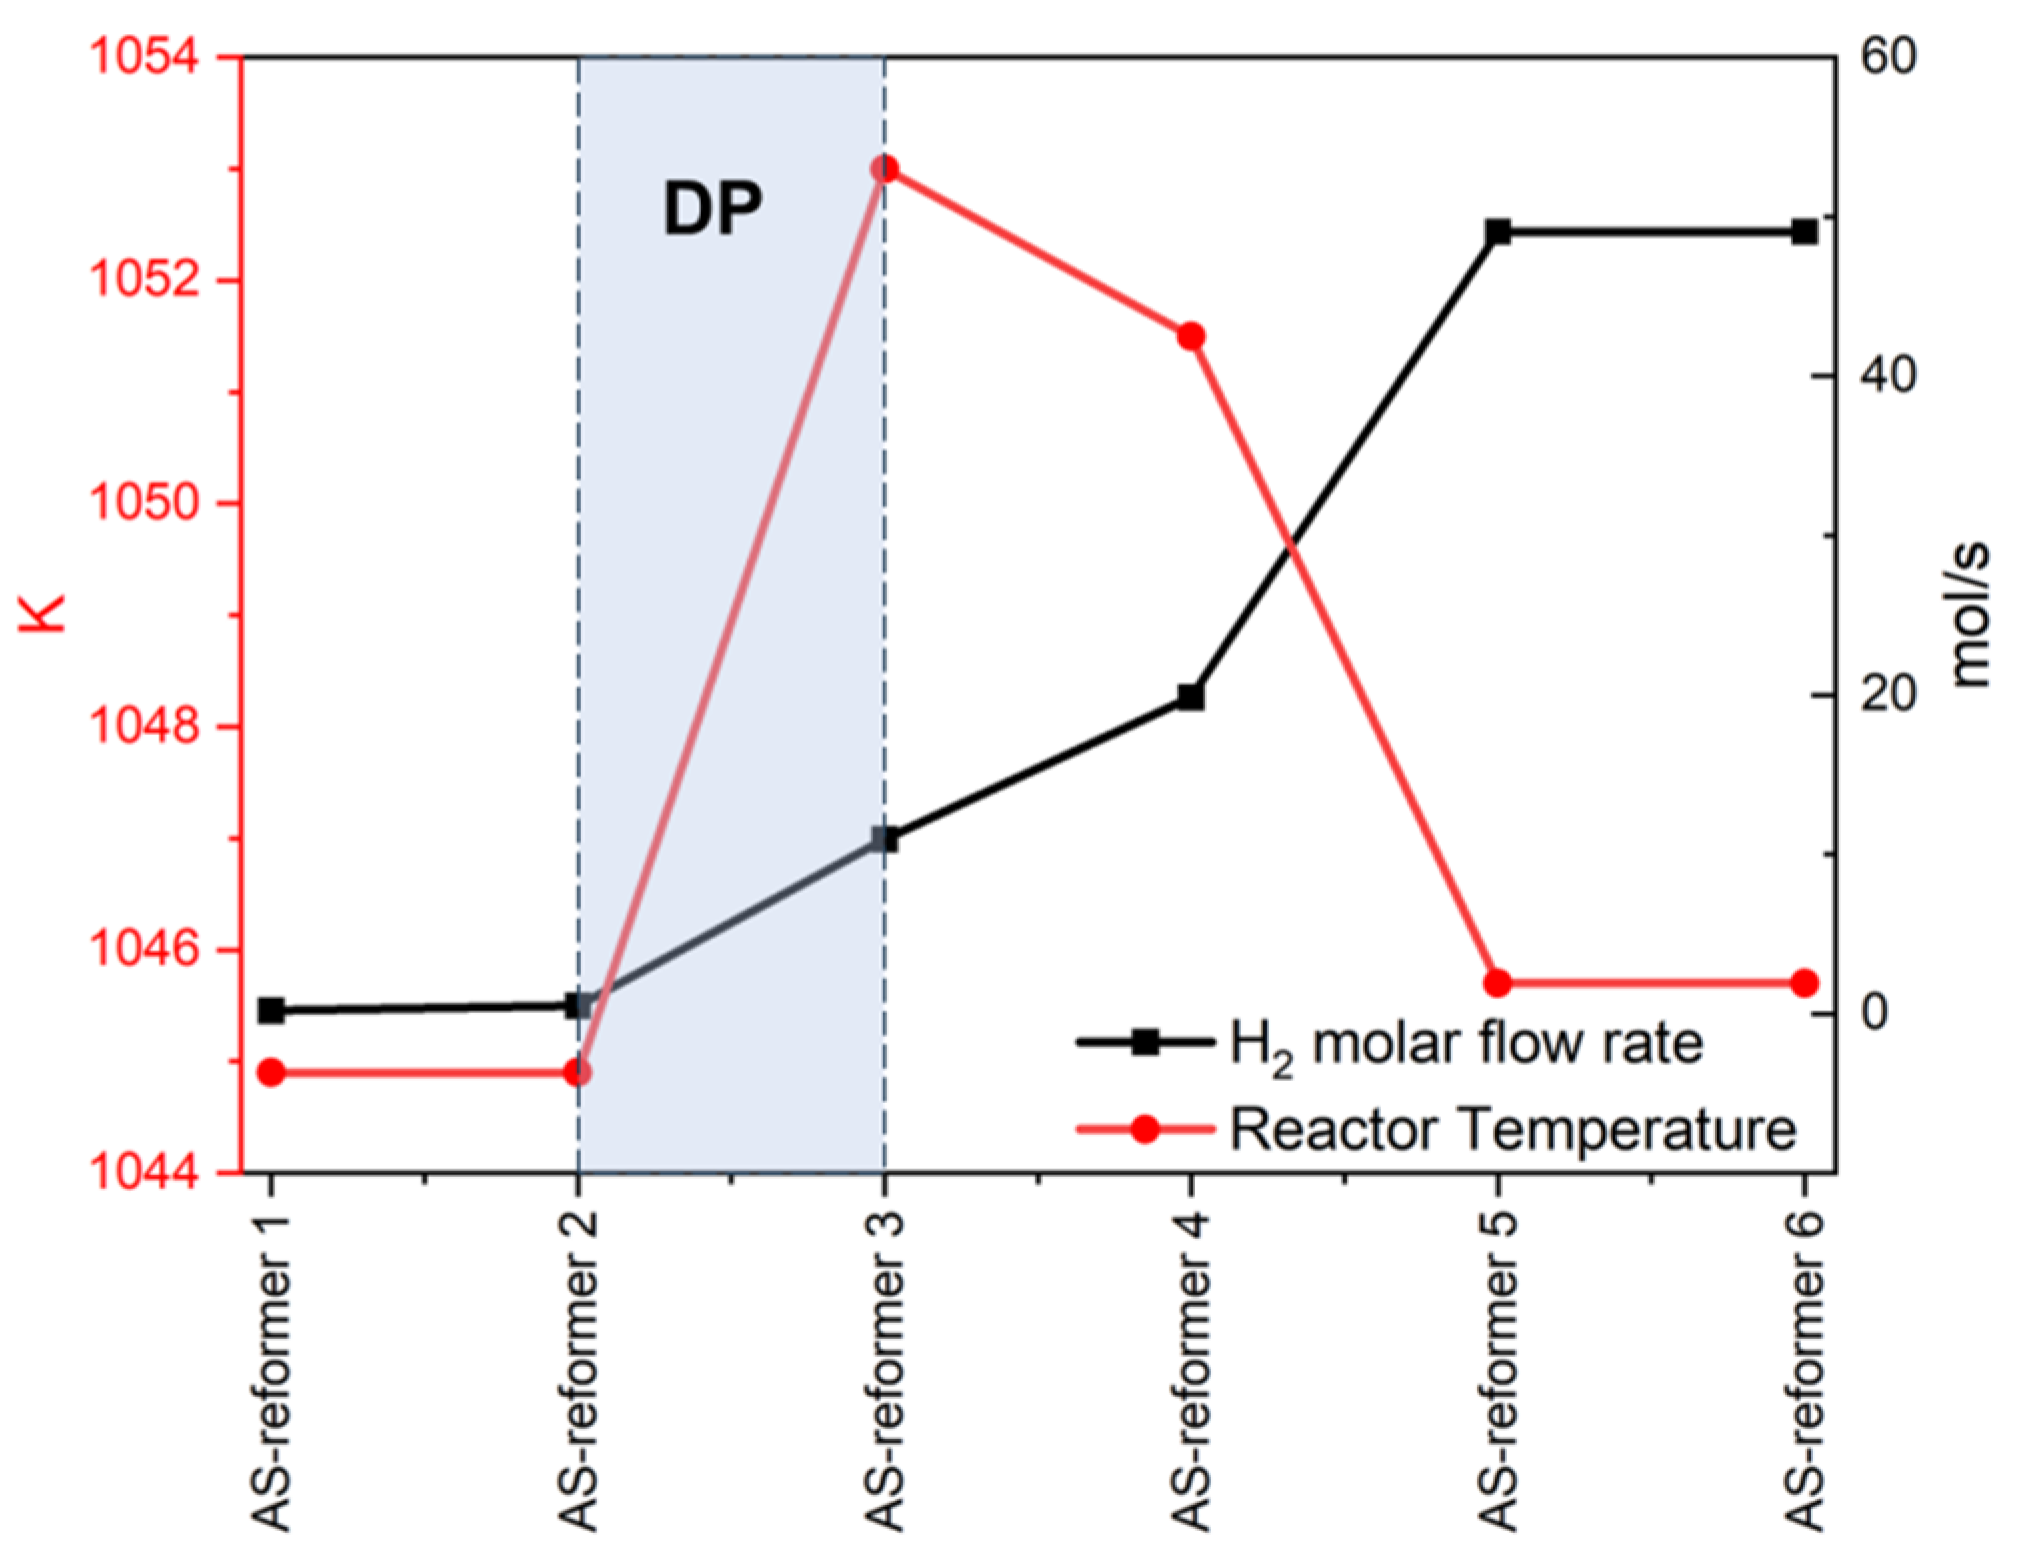
Figure 12A illustrates the key performance parameters of the SOFC, including electric power, fuel utilization, and electric efficiency. The SOFC working temperature is also included to assess how this variation in AS-reformers influences it. Six different AS-reformer fractions (1 to 6) selected in Table 6 range from 0.001 to 0.4 and yield diverse outcomes, revealing a notable reduction in electric efficiency and fuel utilization in the SOFC. Between AS-reformer 1 and 2, the SOFC FU is 100%, and this is undesirable. It is also noted that there is a rapid decrease in the electric efficiency of the SOFC from AS-reformer 2 to 3. This shows that the electric efficiency is very sensitive to variations in AS-reformer values. From 0.0025 to 0.0550, the electric efficiency of the stack drops from 80% to 4%. Within the same AS-reformer change, the SOFC FU changes from 100% to 8%. The design point fraction of 0.00475 yields an electric efficiency of 45.89% and an SOFC FU of 75.15%, which yields an SOFC output power of 102.5 kW. Therefore, AS-reformer fractions greatly influence the SOFC electric power generation capabilities, prompting system designers to pay attention in its selection and control, especially in dynamic applications.
As the AS-reformer fraction increases, Figure 13 demonstrates a parallel rise in CPOx-generated fuel, causing a decrease in SOFC fuel utilization (Figure 12A), approaching 0% at higher AS-reformer fractions. This leads to reduced voltage, inefficient electrochemical reactions, and a drop in stack power from the targeted 100 to 35 kW (Figure 12A). Excessive fuel flow rates in fuel cells result in poor fuel utilization, incomplete oxidation, and heightened overpotential, diminishing overall energy conversion efficiency. Potential consequences include temperature instabilities and risks such as system overloading, leading to increased component wear. Variable AS-reformer fractions induce similar temperature variations in both the SOFC and CPOx reactor, as shown in Figure 12A and Figure 13.
Considering the hybrid system’s propulsion role, essential performance parameters include thrust generation, TSFC, and overall efficiency (derived from the GT’s propulsive and thermal efficiencies). Figure 12B demonstrates the unique influence of each AS-ratio on hybrid system performance, with thrust and overall efficiency trending upward. Notably, TSFC decreases from 310 to 235 mg/s/N, indicating improved efficiency as more thrust is generated for the same fuel input. However, this improvement in GT performance comes at the expense of electric power generation, underscoring the significance of optimizing the AS-ratio to strike a balance between propulsive and electric power requirements in the hybrid system.
AS-Cathode Variation and Its Effect on Hybrid System Performance
The design point cathode fraction constitutes 0.84532 of the total HPC outlet air fraction for electrochemical reactions and cooling in the SOFC stack. Throughout this analysis, the O/C ratio is maintained at a constant value of 0.85, the current density is held at 5000 Am−2, the HX-ξ is constant at 23%, the HPC outlet air temperature is compressed and kept constant at 850.22 K, the GT FAR is sustained at 0.02715, and the total engine inlet air flow remains constant. The sole varied parameter is the AS-ratio, and perturbations in the AS-cathode are detailed in Table 7, where each unique AS-cathode fraction value is assigned, and the remaining fractions are determined using Equation (55) to ensure proportional variations consistent with the design point AS-ratio. The resulting hybrid performance variations are graphically illustrated in Figure 14 and Figure 15.
Table 7.
AS-cathode variations.
| Design Point AS-Ratio | 0.00475:0.84532:0.15 |
|---|---|
| AS-cathode 1 | 0.0246:0.2000:0.7754 |
| AS-cathode 2 | 0.0200:0.3500:0.6300 |
| AS-cathode 3 | 0.0138:0.5500:0.4362 |
| AS-cathode 4 | 0.0107:0.6500:0.3393 |
| AS-cathode 5 | 0.0061:0.8000:0.1939 |
| AS-cathode 6 | 0.0031:0.9000:0.0969 |
Perturbations in AS-cathode significantly impact SOFC electric power generation. Figure 14A illustrates the variation of key performance parameters with six AS-cathode from Table 7, perturbed from 0.2 to 0.9. As AS-cathode increases, SOFC power converges to design point demand. Moreover, at lower AS-cathode ratios in Figure 15, the CPOx fuel generation is suboptimal leading to lower SOFC FU, hence lower electric efficiencies in the SOFC (Figure 14A). Higher AS-cathode values enhance stack efficiency by improving working temperature and electrochemical reactions, yielding design point power output. Enhanced SOFC FU at higher AS-cathode ratios approaches the ideal 75%, improving electric efficiency, enabling the SOFC to produce 102 kW, and meeting design point power demand.
Evaluation of GT performance parameters from Figure 14B reveals an inverse trend compared to Figure 12B. TSFC increases with higher AS-cathode ratios, from 280 to 312.5 mg/s/N, and this is due to decreasing thrust, necessitating more fuel consumption for less thrust generated—an undesirable outcome. However, the thrust decrease remains within an acceptable range, ranging from 8.7 to 8 kN, a modest reduction given the concurrent improvement in SOFC performance within the same range. Hence, achieving a delicate balance between thrust and electric power generation is crucial, and optimal equilibrium is achieved towards AS-cathode 6, where reformer operation ensures adequate fuel supply for the SOFC without compromising thrust generation. The shaded region represents the design point where optimal performance is achieved.
AS-Combustor Variation and Its Effect on Hybrid System Performance
At the designated operating point, the combustor fraction is set at 0.15 of the total HPC outlet air fraction for engaging combustion. Throughout this analysis, the O/C ratio remains constant at 0.85, the current density is maintained at 5000 Am−2, and the GT FAR is sustained at 0.02715. The total engine inlet air flow is held constant, with the sole variable being the AS-ratio. In this section, AS-combustor perturbations (1 to 6) are detailed in Table 8, ranging from 0.05 to 0.7. Each instance is assigned a unique AS-combustor fraction value, and the remaining fractions of the AS-ratio are determined using Equation (54) to ensure a proportionate variation consistent with the design point AS-ratio. The resultant hybrid system performance variations with perturbed AS-combustor are visually presented in Figure 16 and Figure 17.
Table 8.
AS-combustor variations.
| Design Point AS-Ratio | 0.00475:0.84532:0.15 |
|---|---|
| AS-combustor 1 | 0.0053:0.9447:0.0500 |
| AS-combustor 2 | 0.0042:0.7458:0.2500 |
| AS-combustor 3 | 0.0036:0.6464:0.3500 |
| AS-combustor 4 | 0.0031:0.5469:0.4500 |
| AS-combustor 5 | 0.0020:0.3480:0.6500 |
| AS-combustor 6 | 0.0017:0.2983:0.7000 |
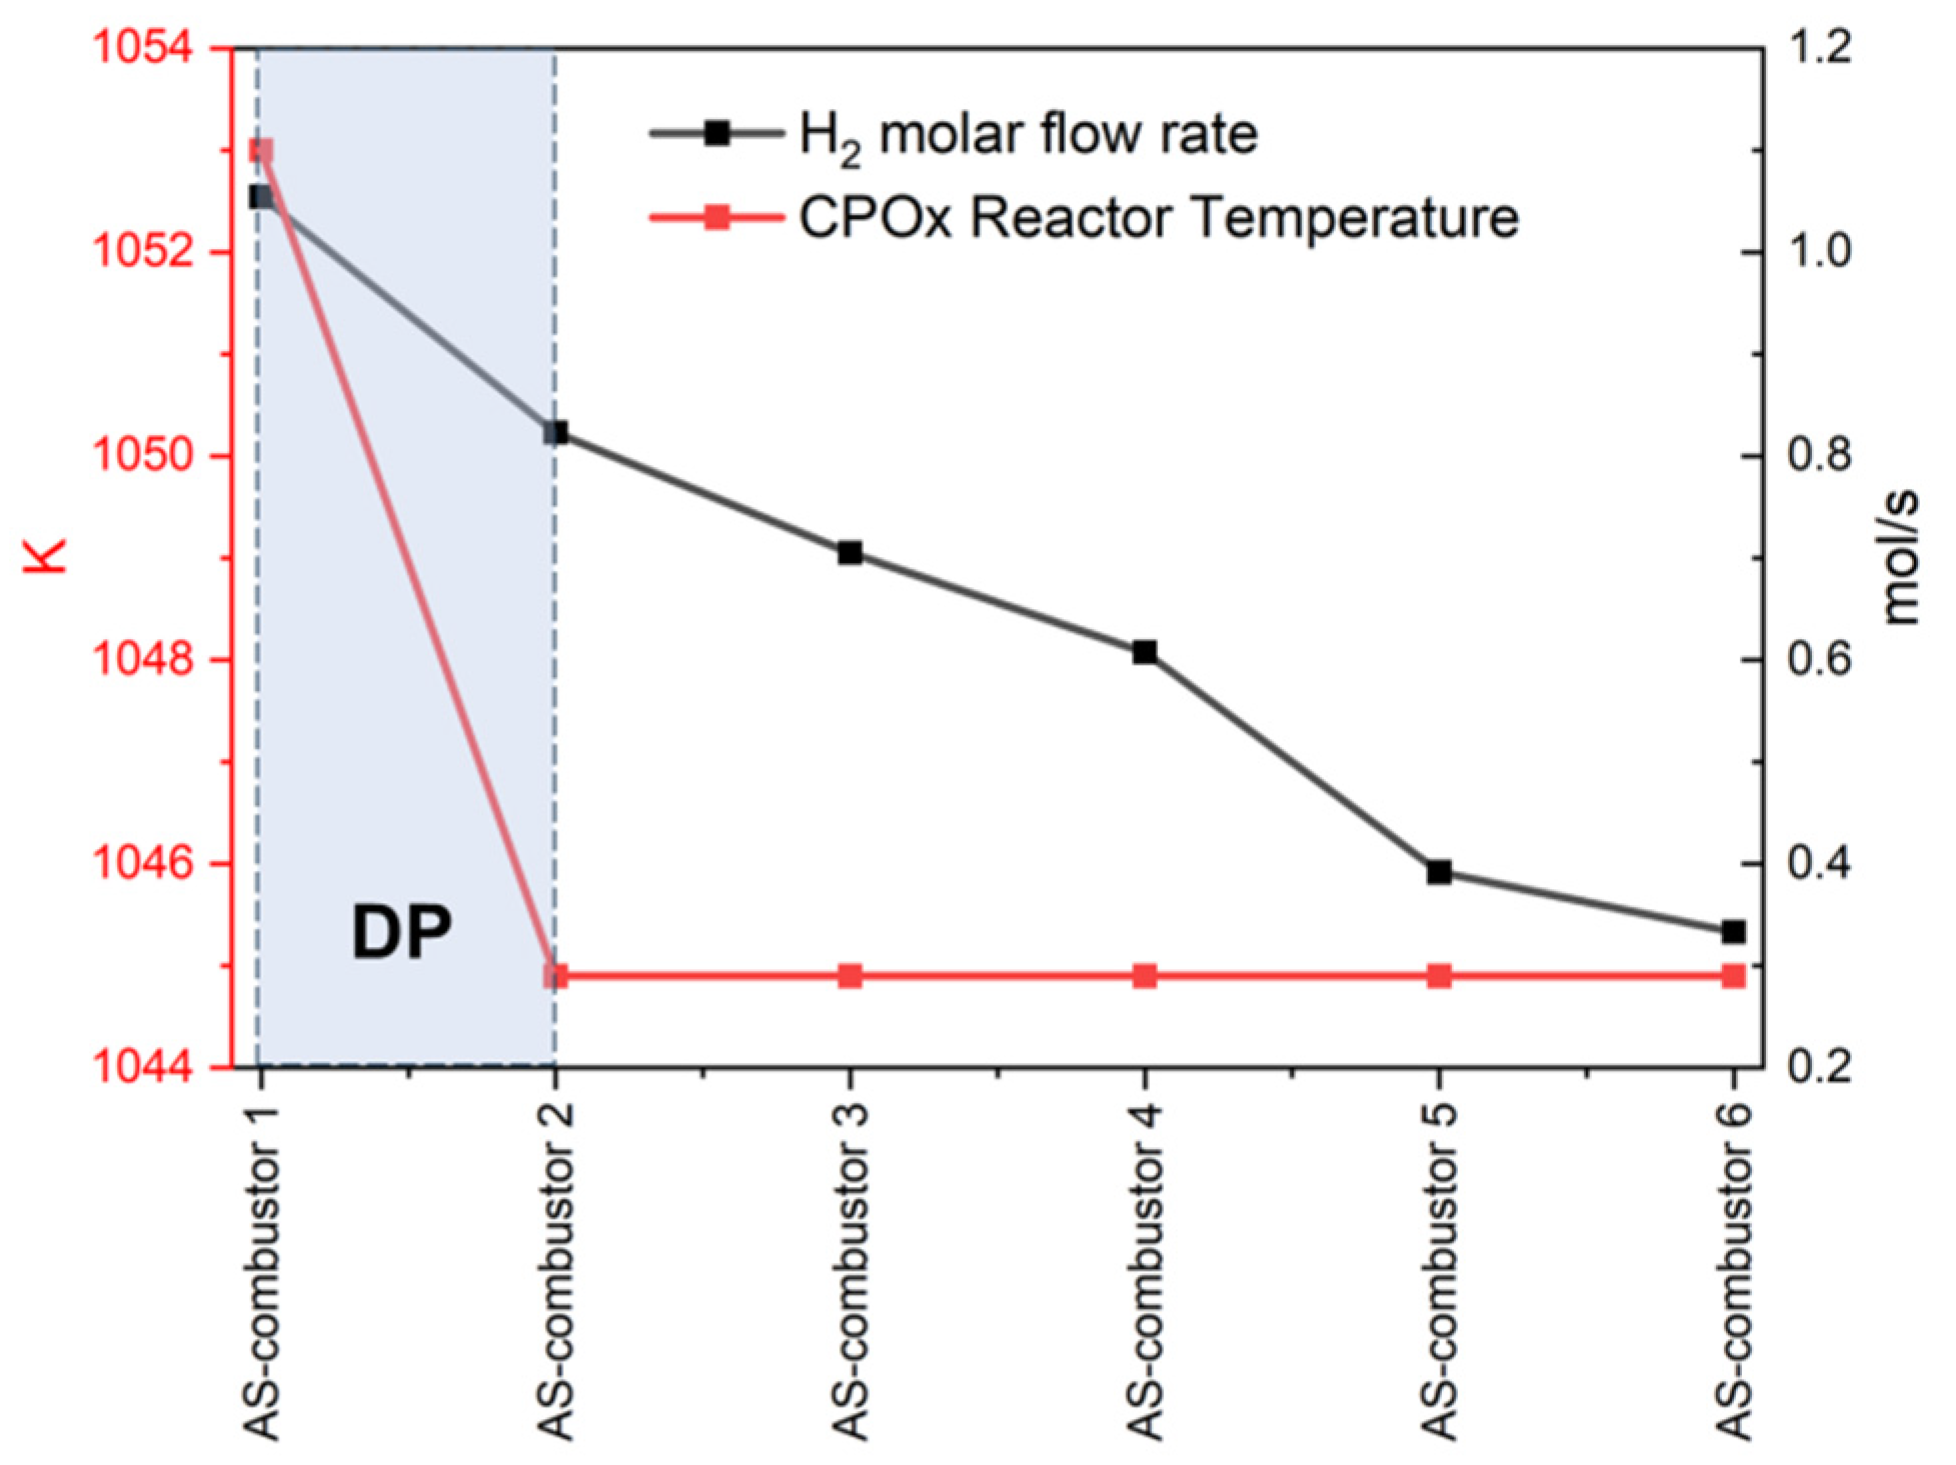
The introduction of a variable AS-combustor induces fluctuations in SOFC power output, ranging from approximately 60 to 120 kW. This range encompasses the required power of about 102 kW at the design point, and a significant jump in SOFC power is noted from AS-combustor 2, which moderately increases for subsequent increases in AS-combustor ratios. Notably, Figure 16A illustrates the variations in the three main performance parameters of the SOFC. Beyond AS-combustor 2, fuel utilization in the SOFC begins to increase, an undesirable outcome. This occurs because, with changes in the AS-ratio, the CPOx reformer yields less fuel than required for optimal SOFC operation, as shown in Figure 17. While the power output remains elevated, surpassing the FU safe margin for continual operation, the heightened fuel utilization poses a considerable risk. The design point performance region lies between AS-combustor 1 and AS-combustor 2, as depicted in Figure 16. The GT performance also improves, at the expense, however, of SOFC stack safe operation, as shown in Figure 16B. As the AS-combustor ratio increases, the TSFC decreases from 315 to 256 mg/s/N means a more efficient conversion of fuel to thrust. The thrust also increases from 7.78 to 8.6 kN. Therefore, under a variable AS-combustor, the shaded region here yields an optimal performance. This correlates to the design point AS-combustor of about 0.15.
Discussion
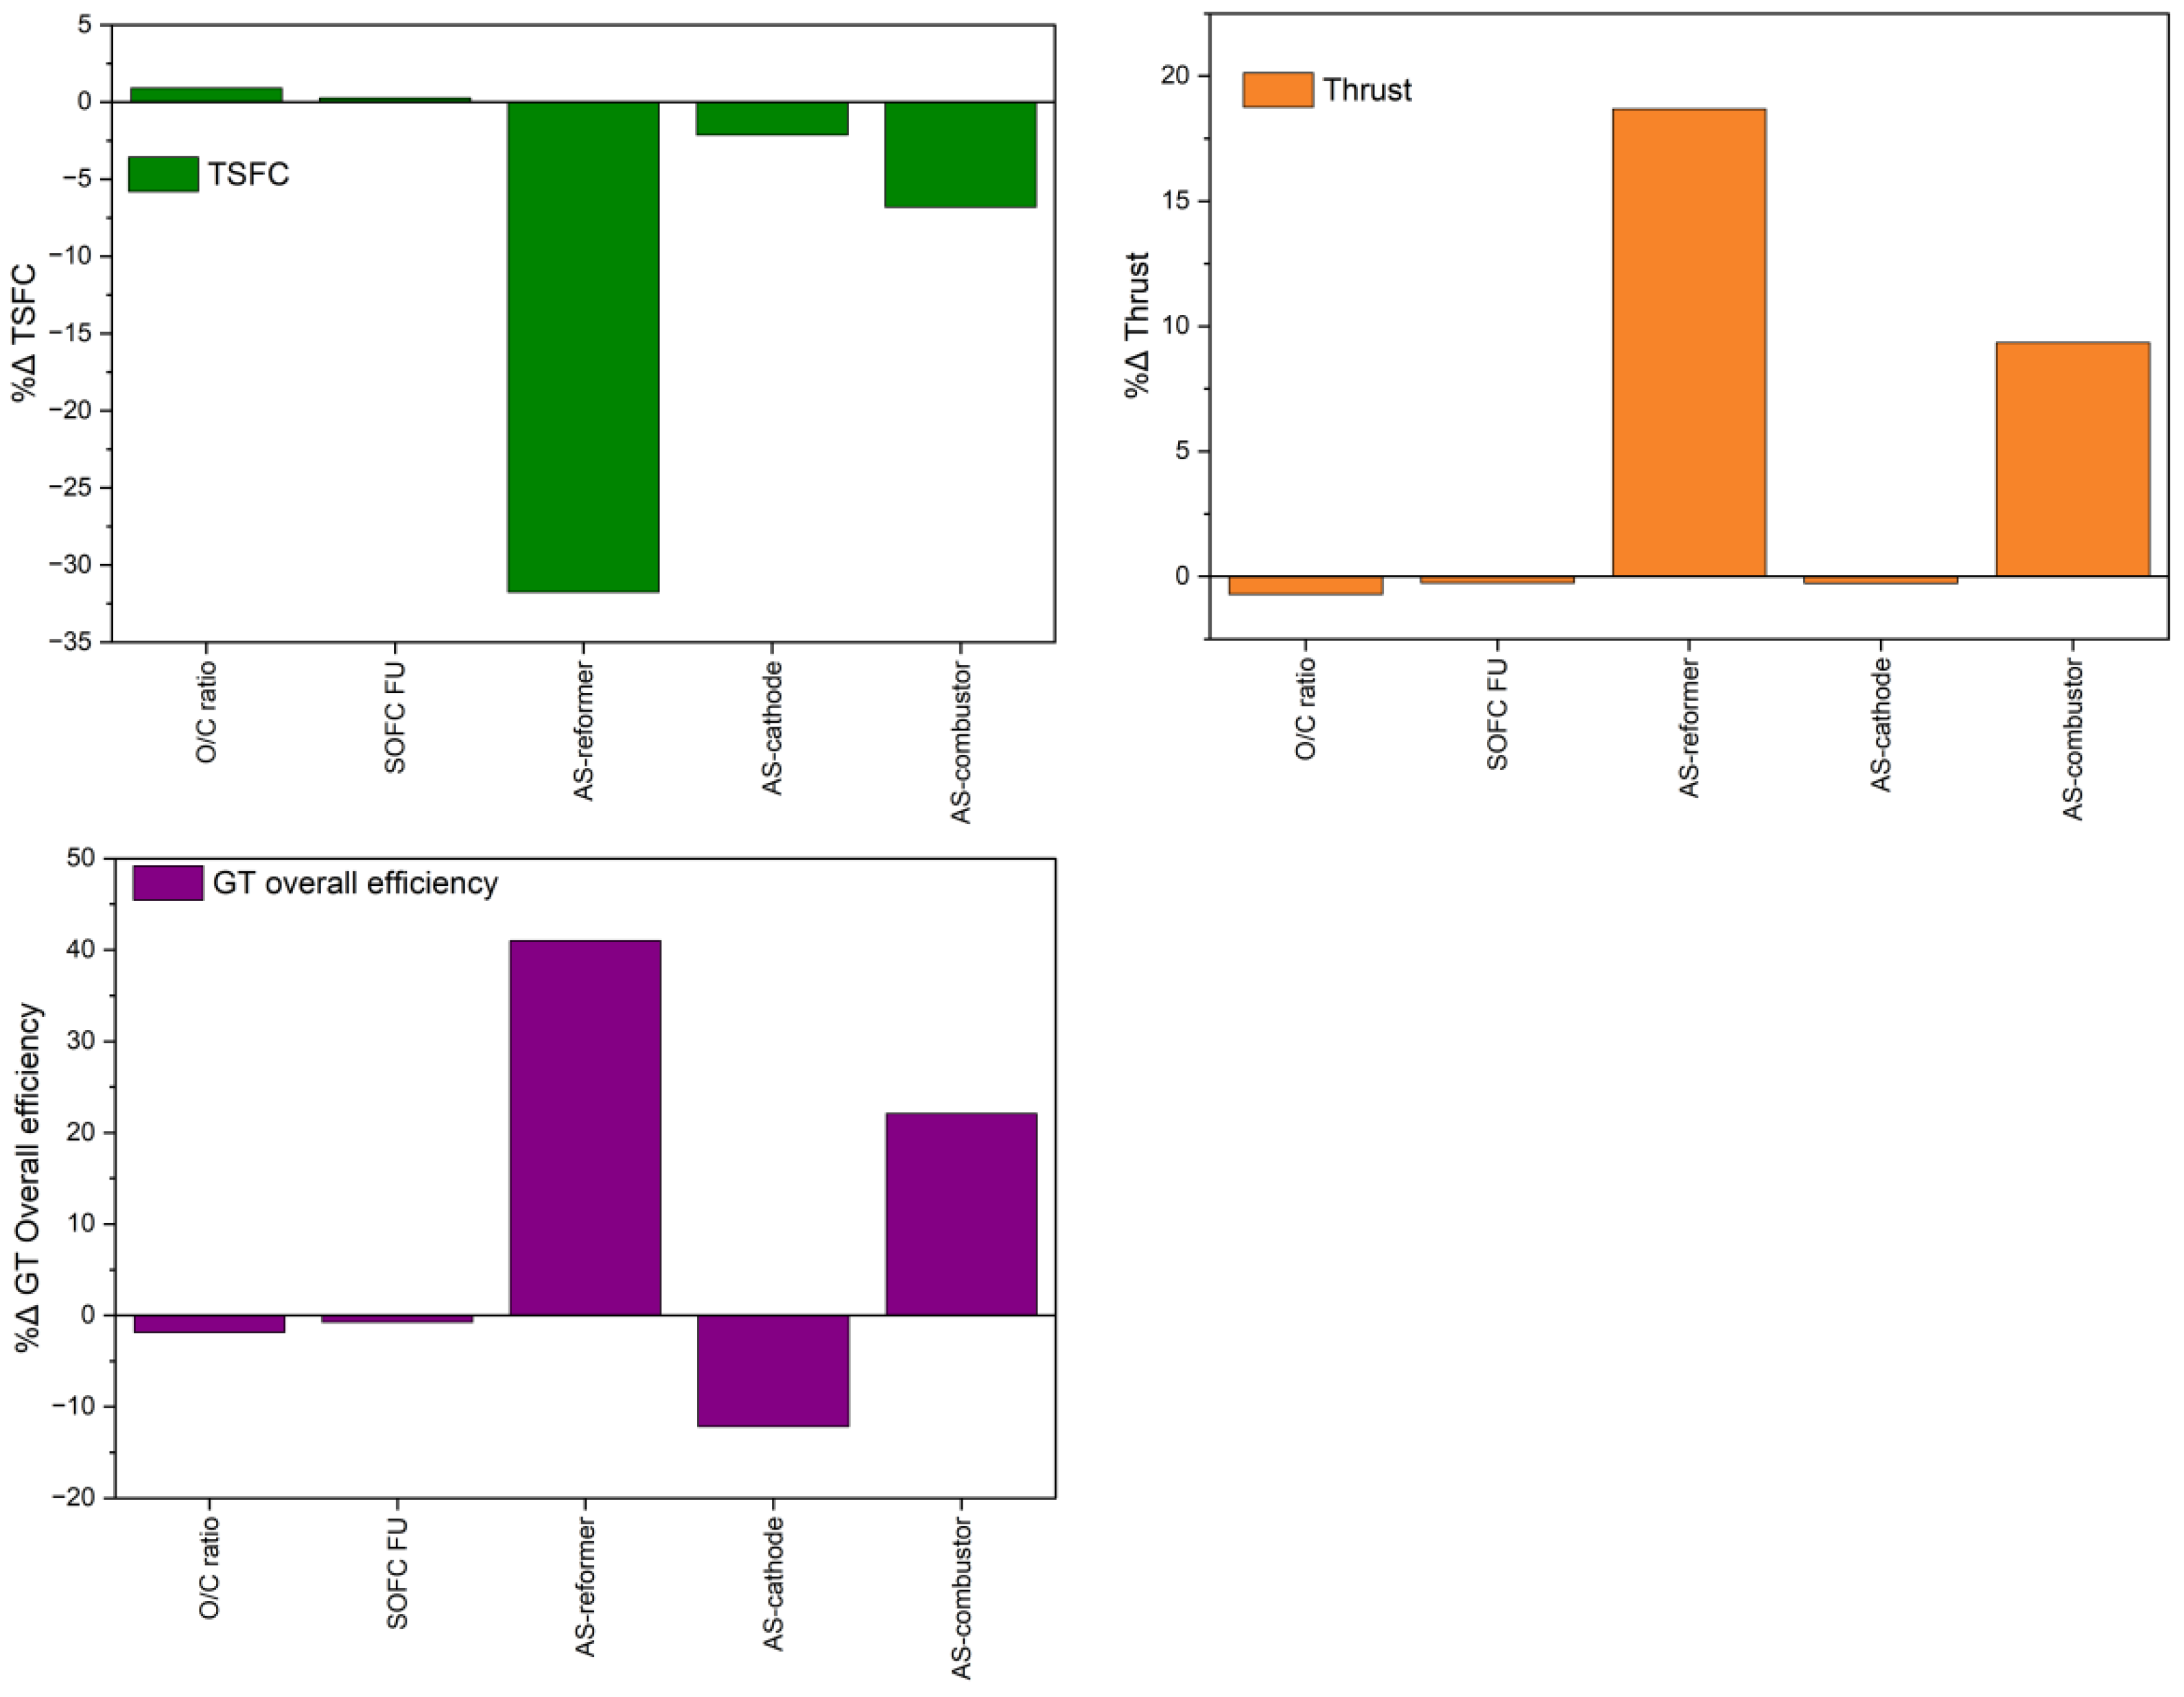
The obtained results provide a unique perspective on aircraft SOFC/GT hybrid power systems by examining the impact of variable parameters on both electric generation and thrust generation aspects. Figure 18 and Figure 19 presents a comparative analysis of performance parameter responses for each variable parameter. The critical performance parameters considered include electric power generated, electric efficiency, SOFC fuel utilization, SOFC temperature, TSFC, GT overall efficiency, and thrust. This comprehensive analysis enables a thorough understanding of the crucial parameters for system development. The findings from the table indicate that the AS-ratio has a significant influence on both electric power and thrust generation.
On the other hand, variations in CPOx and SOFC fuel utilization mainly affect the electric generation capabilities of the system, as evidenced by the percentage change in performance parameters. Notably, the results highlight that the AS-ratio plays the most substantial role in the system and should be optimally selected to ensure optimal performance of the overall hybrid system. A variable AS-reformer yields a 100% change in SOFC power, electric efficiency and fuel utilization. This essentially means that SOFC breaks down when the AS-reformer is not optimally selected. The AS-cathode and AS-combustor also yield high changes in performance parameters compared with O/C ratio and SOFC FU.
Before conducting this study, the assessment of system response to selected variable parameters was lacking, creating a gap in our understanding of system behavior and flexibility. Previous studies did not recognize the AS-ratio as a crucial parameter that significantly influences system performance. This novel finding contributes significantly to our understanding of the system, particularly in the context of aircraft applications.
As the system is intended for dynamic environments, future SOFC/GT hybrid system designs will require the implementation of control systems. Without a thorough understanding of the sensitive parameters and their impact on system performance, the tuning and implementation of control systems could become more challenging. The results of this study shed light on the influence of various parameters and system responses, offering important insights for the future implementation of control systems.
This study also highlights a parameter that has not been extensively assessed in previous studies—the AS-ratio—and measures its effect on the hybrid system. Additionally, given the unique configuration being explored for application, the performance of this system in comparison to conventional SOFC/GT hybrid system configurations falls beyond the scope of this investigation, yet remains a valuable avenue for further exploration and understanding.
4. Conclusions
This study aims to enhance our understanding of the performance of a hybrid solid oxide fuel cell–gas turbine (SOFC/GT) system when applied to aircraft. The investigation focuses on evaluating a specific system configuration, considering the intricate interdependence among the system’s components and their influence on each other’s performance. Continual parameter adjustments within an ever-changing operational context are necessary to optimize system performance. Of particular importance are the HPC outlet air split ratio (referred to as the AS-ratio) and its direct impact on SOFC fuel utilization and electric power generation. Consistent fine-tuning of the AS-ratio is crucial, as failure to do so adversely affects the hybrid system’s performance. The study also assesses the influence of the CPOx O/C ratio on the overall system performance. The study also investigates the effect of varying the SOFC fuel utilization (FU) on system performance. To fully comprehend the impact of these parameters on system performance, the study evaluates the system’s performance when these parameters deviate from the design point parameters. Under specified design conditions (altitude: 11 km, Mach: 0.8, standard day, aircraft speed: 849.6 km/hr.), the system achieves a total power output of 1.96 MW, with 102 kW generated by the SOFC and 7.9 kN (1.86 MW) of thrust. The SOFC’s electric efficiency at this point is 45.89%, determined by the specific AS-ratio configuration and power demand.
System off-design performance is assessed under variable parameters, particularly the O/C ratio, SOFC fuel utilization (FU) and the HPC outlet air split ratio (AS-ratio). The key findings of the off-design analysis are as follows:
- O/C ratio variation: By varying the fuel flow rate into the CPOx, its influence on the hybrid system performance is assessed. It is observed that it influences SOFC electric efficiency as the fuel utilization in the stack is compromised by suboptimal O/C ratios. An O/C ratio between 0.85 and 0.9 leads to the production of reformed hydrogen, resulting in a fuel utilization of 75 ± 10%. In this same range, a balance between optimal fuel generated, carbon deposition and reactor temperature are obtained. The variable O/C ratio is also observed to yield performance variation in the GT, where there is a modest thrust decrease from 7.92 to 7.86 kN. The TSFC is also observed to increase from 308.5 to 311 mg/s/N.
- SOFC FU variation: The effect of a variable SOFC FU on the hybrid system is assessed by varying the FU from 60% to 95%. It is observed that the SOFC performance parameters (SOFC power, electric efficiency, Power density) increase within this same variation range. Subsequently, its influence on the GT is assessed, where it is observed that there is a slight decrease in thrust from 7.907 to 7.887 kN, prompting a slight decrease in the GT overall efficiency. The TSFC also increases slightly from 309 to 309.8 mg/s/N. This showed that the SOFC FU bears a greater influence on the SOFC than it does the GT.
- AS-ratio variation: As the hybrid system is operating in flight, due to the variable engine inlet air mass flow rate, one critical parameter is influenced, and therefore variable, and that is the AS-ratio. The three fractions to the reformer, cathode and combustor are perturbed to assess their influence on the hybrid system performance parameters. The reformer, cathode and combustor fractions are perturbed from 0.001 to 0.4, 0.2 to 0.9 and 0.05 to 0.7, respectively. From these perturbations, it is noted that it is imperative to always optimize the AS-ratio at any point in the aircraft operation. This analysis provides insight to optimize these variable operational parameters for optimal hybrid system performance.
The obtained results significantly enhance our understanding of the application of SOFC/GT systems in aircraft, particularly by identifying the crucial parameters necessary for achieving optimal performance. Given the dynamic nature of the system’s application, future designs will incorporate control systems, and this study provides valuable guidance for their implementation. Successful implementation of control systems relies on a thorough understanding of the system’s potential response and expected range of performance. This study offers insights in this regard, enabling the development of control systems that can effectively leverage this knowledge. Overall, this study contributes to the comprehensive understanding of SOFC/GT hybrid systems in aircraft and sheds light on the impact of specific critical parameters on system performance.
Supplementary Materials
The following supporting information can be downloaded at: https://www.mdpi.com/article/10.3390/app14083504/s1, Table S1: SOFC mathematical models.
Author Contributions
Conceptualization, T.M.M. and X.L.; methodology, T.M.M. and J.W.; software, T.M.M.; validation, X.L., Y.W. and C.S.; formal analysis, T.M.M.; investigation, T.M.M.; resources, X.L.; data curation, T.M.M.; writing—original draft preparation, T.M.M.; writing—review and editing, X.L.; visualization, Y.W.; supervision, X.L.; project administration, Y.W.; funding acquisition, X.L. All authors have read and agreed to the published version of the manuscript.
Funding
The research is supported by National Natural Science Foundation of China under Grant No. (52176013), Shanghai Government International Cooperation Project under Grant No. 23160710200, National Science and Technology Major Project (J2019-I-0012-0012).
Institutional Review Board Statement
Not applicable.
Informed Consent Statement
Not applicable.
Data Availability Statement
The data that support the findings of this study are available from the corresponding author, Lv Xiaojing, upon reasonable request.
Conflicts of Interest
The authors declare no conflict of interest.
References
- Erling, U.M. International Aviation Emissions under International Civil Aviation Organization’s Global Market Based Measure: Ready for Offsetting? Air Space Law 2017, 42, 115023610. [Google Scholar] [CrossRef]
- Mai, D.T.T. Revising the EU ETS and CORSIA in times of the COVID-19 pandemic: Challenges for reducing global aviation emissions. Clim. Policy 2021, 21, 1357–1367. [Google Scholar] [CrossRef]
- Terrenoire, E.; Hauglustaine, D.; Gasser, T.; Penanhoat, O. The contribution of carbon dioxide emissions from the aviation sector to future climate change. Environ. Res. Lett. 2019, 14, 084019. [Google Scholar] [CrossRef]
- Graver, B.; Zhang, K.; Rutherford, D. Emissions from Commercial Aviation, 2018; The International Council on Clean Transportation: Washington, DC, USA, 2019. [Google Scholar]
- Waters, D.F. Modeling of Gas Turbine-Solid Oxide Fuel Cell Systems for Combined Propulsion and Power on Aircraft. Ph.D. Thesis, University of Maryland, College Park, MD, USA, 2015. [Google Scholar]
- Traub, L.W. Range and endurance estimates for battery-powered aircraft. J. Aircr. 2011, 48, 703–707. [Google Scholar] [CrossRef]
- Chiang, C.; Herwerth, C.; Mirmirani, M.; Ko, A.; Matsuyama, S.; Choi, S.B.; Nomnawee, N.; Gamble, D.; Arena, A.; Gu, G. Systems integration of a hybrid PEM fuel cell/battery powered endurance UAV. In Proceedings of the 46th AIAA Aerospace Sciences Meeting and Exhibit, Reno, NV, USA, 7–10 January 2008; p. 151. [Google Scholar]
- Barzkar, A.; Ghassemi, M. Electric power systems in more and all electric aircraft: A review. IEEE Access 2020, 8, 169314–169332. [Google Scholar] [CrossRef]
- Kim, T.; Kwon, S. Design and development of a fuel cell-powered small unmanned aircraft. Int. J. Hydrogen Energy 2012, 37, 615–622. [Google Scholar] [CrossRef]
- Wang, X.; Mi, X.; Lv, X.; Weng, Y. Fast and stable operation approach of ship solid oxide fuel cell-gas turbine hybrid system under uncertain factors. Int. J. Hydrogen Energy 2022, 47, 21472–21491. [Google Scholar] [CrossRef]
- Rechberger, J.; Kaupert, A.; Hagerskans, J.; Blum, L. Demonstration of the First European SOFC APU on a Heavy Duty Truck. Transp. Res. Procedia 2016, 14, 3676–3685. [Google Scholar] [CrossRef]
- Baldi, F.; Moret, S.; Tammi, K.; Maréchal, F.J.E. The role of solid oxide fuel cells in future ship energy systems. Energy 2020, 194, 116811. [Google Scholar] [CrossRef]
- Choudhury, A.; Chandra, H.; Arora, A. Application of solid oxide fuel cell technology for power generation—A review. Renew. Sustain. Energy Rev. 2013, 20, 430–442. [Google Scholar] [CrossRef]
- Liu, H.; Qin, J.; Li, C.; Li, C.; Dong, P. Performance comparison and potential evaluation of energy systems with different fuel cells for electric aircraft. Appl. Therm. Eng. 2024, 242, 122447. [Google Scholar] [CrossRef]
- Steffen, C.J., Jr.; Freeh, J.E.; Larosiliere, L.M. Solid oxide fuel cell/gas turbine hybrid cycle technology for auxiliary aerospace power. In Proceedings of the Turbo Expo: Power for Land, Sea, and Air, Reno, NV, USA, 6–9 June 2005; pp. 253–260. [Google Scholar]
- Eelman, S.; de Poza, I.D.P.; Krieg, T. Fuel Cell APU’S in Commercial Aircraft an Assessment of SOFC and PEMFC Concepts. In Proceedings of the 24th International Congress of the Aeronautical Sciences, (ICAS 2004), Yokohama, Japan, 29 August–3 September 2004. [Google Scholar]
- Seyam, S.; Dincer, I.; Agelin-Chaab, M. Novel hybrid aircraft propulsion systems using hydrogen, methane, methanol, ethanol and dimethyl ether as alternative fuels. Energy Convers. Manag. 2021, 238, 114172. [Google Scholar] [CrossRef]
- Papagianni, A.; Kavvalos, M.; Aslanidou, I.; Kyprianidis, K.; Kalfas, A. Conceptual design of a hybrid gas turbine-solid oxide fuel cell system for civil aviation. In Proceedings of the International Symposium on Air Breathing Engines, (ISABE 2019), Canberra, Australia, 23–28 September 2019. Paper No. ISABE-2019-24214. [Google Scholar]
- Tarroja, B.; Mueller, F.; Pratt, J.; Brouwer, J. Thermodynamic design analysis of a solid oxide fuel cell gas turbine hybrid system for high-altitude applications. In Proceedings of the 7th International Energy Conversion Engineering Conference, Denver, CO, USA, 2–5 August 2009; p. 4526. [Google Scholar]
- Ji, Z.; Qin, J.; Cheng, K.; Liu, H.; Zhang, S.; Dong, P. Performance evaluation of a turbojet engine integrated with interstage turbine burner and solid oxide fuel cell. Energy 2019, 168, 702–711. [Google Scholar] [CrossRef]
- Ji, Z.; Qin, J.; Cheng, K.; Dang, C.; Zhang, S.; Dong, P. Thermodynamic performance evaluation of a turbine-less jet engine integrated with solid oxide fuel cells for unmanned aerial vehicles. Appl. Therm. Eng. 2019, 160, 114093. [Google Scholar] [CrossRef]
- Kojima, T.; Okai, K.; Tagashira, T.; Fukuyama, Y. Experimental Study on SOFC/GT Hybrid Engine for Liquid Hydrogen Fueled Electric Propulsion System. In Proceedings of the AIAA AVIATION 2023 Forum, San Diego, CA, USA, 12–16 June 2023; p. 3989. [Google Scholar]
- Wilson, J.A.; Wang, Y.; Carroll, J.; Raush, J.; Arkenberg, G.; Dogdibegovic, E.; Swartz, S.; Daggett, D.; Singhal, S.; Zhou, X.-D. Hybrid Solid Oxide Fuel Cell/Gas Turbine Model Development for Electric Aviation. Energies 2022, 15, 2885. [Google Scholar]
- Collins, J.M.; McLarty, D. All-electric commercial aviation with solid oxide fuel cell-gas turbine-battery hybrids. Appl. Energy 2020, 265, 114787. [Google Scholar] [CrossRef]
- Guo, F.; Li, C.; Liu, H.; Cheng, K.; Qin, J. Matching and performance analysis of a solid oxide fuel cell turbine-less hybrid electric propulsion system on aircraft. Energy 2023, 263, 125655. [Google Scholar] [CrossRef]
- Waters, D.; Pratt, L.; Cadou, C. Gas Turbine/Solid Oxide Fuel Cell Hybrids for Aircraft Propulsion and Power. J. Propuls. Power 2021, 37, 349–361. [Google Scholar] [CrossRef]
- Waters, D.; Cadou, C. Optimization of Gas Turbine—Solid Oxide Fuel Cell Systems for Aircraft Power Generation. J. Propuls. Power 2015, 37, 349–361. [Google Scholar] [CrossRef]
- Hosseini, V.; Neill, W.; Thomson, K.; Chippior, W. Effect of initial and operating conditions on soot emissions from an HCCI engine. In Proceedings of the Combustion Institute/Canadian Section, Spring Technical Meeting, Montreal, QC, Canada, 11–13 May 2009. [Google Scholar]
- Lv, X.; Lu, C.; Wang, Y.; Weng, Y.J.E. Effect of operating parameters on a hybrid system of intermediate-temperature solid oxide fuel cell and gas turbine. Energy 2015, 91, 10–19. [Google Scholar] [CrossRef]
- Lv, X.; Lu, C.; Zhu, X.; Weng, Y.J. Technology, Safety analysis of a solid oxide fuel cell/gas turbine hybrid system fueled with gasified biomass. J. Electrochem. Energy Convers. Storage 2015, 12, 011008. [Google Scholar]
- Hosseinpour, J.; Chitsaz, A.; Eisavi, B.; Yari, M. Investigation on performance of an integrated SOFC-Goswami system using wood gasification. Energy 2018, 148, 614–628. [Google Scholar] [CrossRef]
- Sghaier, S.F.; Khir, T.; Ben Brahim, A. Energetic and exergetic parametric study of a SOFC-GT hybrid power plant. Int. J. Hydrogen Energy 2018, 43, 3542–3554. [Google Scholar] [CrossRef]
- Ding, X.; Sun, W.; Harrison, G.P.; Lv, X.; Weng, Y.J.E. Multi-objective optimization for an integrated renewable, power-to-gas and solid oxide fuel cell/gas turbine hybrid system in microgrid. Energy 2020, 213, 118804. [Google Scholar] [CrossRef]
- Baki, T. The Predicted Performance of a Two-Spool Turbofan Engine in Rainstorms; University of Glasgow: Glasgow, Scotland, 1993. [Google Scholar]
- Jones, S.M. An Introduction to Thermodynamic Performance Analysis of Aircraft Gas Turbine Engine Cycles Using the Numerical Propulsion System Simulation Code; NASA Center for Aerospace Information: Hanover, MD, USA, 2007.
- Tsoutsanis, E.; Meskin, N.; Benammar, M.; Khorasani, K. Dynamic performance simulation of an aeroderivative gas turbine using the matlab simulink environment. In Proceedings of the ASME International Mechanical Engineering Congress and Exposition, American Society of Mechanical Engineers, San Diego, CA, USA, 15–21 November 2013; p. V04AT04A050. [Google Scholar]
- Pan, F.; Cheng, X.; Wu, X.; Wang, X.; Gong, J. Thermodynamic Design and Performance Calculation of the Thermochemical Reformers. Energies 2019, 12, 3693. [Google Scholar] [CrossRef]
- Gallagher, M.J. Partial Oxidation and Autothermal Reforming of Heavy Hydrocarbon Fuels with Non-Equilibrium Gliding arc Plasma for Fuel Cell Applications. Ph.D. Thesis, Drexel University, Philadelphia, PA, USA, 2010. [Google Scholar]
- Howell, T.G. Catalytic Partial Oxidation Reforming of JP8 and S8. Master’s Thesis, Air Force Institute of Technology Wright-Patterson Air Force Base, Wright-Patterson AFB, OH, USA, 2007. [Google Scholar]
- Schulte-Fischedick, J.; Zunft, S.; Streuber, C. Development of a ceramic plate-fin heat exchanger for operation temperatures up to 1250 C. In Proceedings of the Sixth International Conference on Enhanced, Compact and Ultra-Compact Heat Exchangers, Whistler, BC, Canada, 11–16 September 2005. [Google Scholar]
- Thermal, C. Graphite Heat Exchangers. Available online: https://cgthermal.com/heat-exchangers/graphite/ (accessed on 3 March 2024).
- Wang, X.; Lv, X.; Weng, Y. Performance analysis of a biogas-fueled SOFC/GT hybrid system integrated with anode-combustor exhaust gas recirculation loops. Energy 2020, 197, 117213. [Google Scholar] [CrossRef]
- Zhao, F.; Virkar, A.V. Dependence of polarization in anode-supported solid oxide fuel cells on various cell parameters. J. Power Sources 2005, 141, 79–95. [Google Scholar] [CrossRef]
- Hall, E.; Delaney, R.; Lynn, S.; Veres, J. Energy efficient engine low pressure subsystem aerodynamic analysis. In Proceedings of the 34th AIAA/ASME/SAE/ASEE Joint Propulsion Conference and Exhibit, Cleveland, OH, USA, 13–15 July 1998; p. 3119. [Google Scholar]
- Ciepluch, C.C.; Davis, D.Y.; Gray, D.E. Power, Results of NASA’s energy efficient engine program. J. Propuls. Power 1987, 3, 560–568. [Google Scholar] [CrossRef]
- Patt, R. Energy Efficient Engine Flight Propulsion System: Aircraft/Engine Integration Evaluation; NASA Center for Aerospace Information: Hanover, MD, USA, 1980.
- Davis, D.Y.; Stearns, E.M. Energy Efficient Engine: Flight Propulsion System Final Design and Analysis; NASA Center for Aerospace Information: Hanover, MD, USA, 1985.
- Scenna, R.; Gupta, A.K. Partial oxidation of JP8 in a distributed reactor. Fuel Process. Technol. 2015, 134, 205–213. [Google Scholar] [CrossRef]
- Smith, M.W.; Shekhawat, D. Chapter 5—Catalytic partial oxidation. In Fuel Cells: Technologies for Fuel Processing; Shekhawat, D., Spivey, J.J., Berry, D.A., Eds.; Elsevier: Amsterdam, The Netherlands, 2011; pp. 73–128. [Google Scholar]
Figure 1.
A-SOFC/GT configuration.

Figure 2.
Calculation flow chart for the aircraft SOFC/GT system.

Figure 3.
SOFC model validation with experimental results [43].
Figure 3.
SOFC model validation with experimental results [43].

Figure 4.
CPOx H2 outlet flow variation with change in O/C ratio [48].
Figure 4.
CPOx H2 outlet flow variation with change in O/C ratio [48].

Figure 5.
CPOx reactor outlet flow molar fraction variation with O/C ratio.

Figure 6.
O/C variation with CPOx inlet fuel flow rate and SOFC fuel utilization.

Figure 7.
Effect of variable O/C ratio on SOFC performance.

Figure 8.
Effect of variable O/C ratio on GT performance.

Figure 9.
SOFC fuel utilization effects the SOFC and GT performance.

Figure 10.
Temperature variations relative to variable SOFC FU.

Figure 11.
The HPC outlet air split ratio to the reformer, cathode, and combustor.

Figure 12.
AS-reformer variation and performance variation in SOFC and GT.

Figure 13.
AS-reformer variation and performance variation with CPOx.

Figure 14.
AS-cathode variation and performance variation in SOFC and GT.

Figure 15.
AS-cathode variation with CPOx performance.

Figure 16.
AS-combustor variation and performance variation in SOFC and GT.

Figure 17.
AS-combustor variation with CPOx performance parameters.

Figure 18.
Comparative graphs of system response by % change (%Δ) in performance parameter.

Figure 19.
Comparative graphs of thrust generation capabilities of GT by % change (%Δ) in GT performance parameters.
Figure 19.
Comparative graphs of thrust generation capabilities of GT by % change (%Δ) in GT performance parameters.

Table 1.
A-SOFC/GT hybrid system specifications.
| Parameter | Value | Unit |
|---|---|---|
| CPOx | ||
| O/C ratio | 0.85 | - |
| Operational pressure | 300 | kPa |
| Fuel Inlet Temperature | 643.15 | K |
| Air Inlet Temperature | 850.22 | K |
| SOFC [42] | ||
| Operational pressure | 0.4 | MPa |
| Average Current density | 5000 | Am−2 |
| Active cell area | 0.09 | m2 |
| Number of cells in one stack | 300 | - |
| Weight of one cell | 0.6 | g/cm |
| Anode thickness | 0.09 × 10⁻² | m |
| Cathode thickness | 0.005 × 10⁻² | m |
| Electrolyte thickness | 0.001 × 10⁻² | m |
| Air channel height | 0.002 | m |
| Conductivity-anode | 80 × 103 | (Ω−1·m−1) |
| Conductivity-cathode | 8.4 × 10³ | (Ω−1·m−1) |
| Electrolyte Ionic conductivity | (33.4 × 10³)e(−10.3×10³/T) | (Ω−1·m−1) |
| Anode diffusivity coefficient | 0.2 × 10⁻⁴ | m2s−1 |
| Cathode diffusivity coefficient | 0.05 × 10⁻⁴ | m2s−1 |
| 6.54 × 10⁻¹¹ | A/m2 | |
| 1.38 × 10⁻⁵ | A/m2 | |
| Fuel Utilization | 0.75 | - |
| GT | ||
| Specification | Turbofan | - |
| Aircraft engine | NASA E3 | - |
| Type | 2 shaft high bypass | - |
| Dry weight | 900 | kg |
| Combustor Exit temperature | 1758 | K |
| Turbine Inlet Turbine | 1557 | K |
| Air mass flow (cruise) | 90 | kg/s |
| Thrust cruise | 8 | kN |
| Bypass ratio | 6.9 | - |
Table 2.
A-SOFC/GT hybrid system performance parameters at design point.
| Component | Parameter | Value | Units |
|---|---|---|---|
| SOFC | Power | 102.5 | kW |
| Electrical Efficiency | 45.89 | % | |
| Terminal Voltage | 0.7594 | V | |
| Power Density | 0.3797 | kW/cm2 | |
| SOFC working temperature | 1071.25 K | K | |
| H2 rate of consumption | 0.6995 | mol/s | |
| Fuel Utilization | 75.15 | % | |
| GT System | Thrust | 7.899 | kN |
| FAR | 0.02715 | - | |
| TSFC | 309.3 | mg/s/N | |
| Overall Efficiency | 5.474 | % | |
| Thermal Efficiency | 18.4 | % | |
| Propulsive Efficiency | 29.75 | % | |
| Reformer | C12H26 conversion | 99.85 | % |
| O/C ratio | 0.85 | - | |
| Fuel utilization | 0.01266 | kg/s |
Table 3.
A-SOFC/GT hybrid system parameter at each node at design point.
| Molar Flow Rate (mol/s) | |||||||||||
|---|---|---|---|---|---|---|---|---|---|---|---|
| Node | Temperature K | Pressure kPa | H2 | CO | CO2 | CH4 | C | O2 | N2 | H2O | C12H26 |
| 1 | 216.7 | 22.77 | 0 | 0 | 0 | 0 | 0 | 590.6 | 2539 | 0 | 0 |
| 1b | 282.2 | 54.21 | 0 | 0 | 0 | 0 | 0 | 515.9 | 2218 | 0 | 0 |
| 2 | 282.2 | 54.21 | 0 | 0 | 0 | 0 | 0 | 74.76 | 321.4 | 0 | 0 |
| 3 | 850.22 | 1600 | 0 | 0 | 0 | 0 | 0 | 74.76 | 321.4 | 0 | 0 |
| 4a | 850.22 | 1600 | 0 | 0 | 0 | 0 | 0 | 11.21 | 48.21 | 0 | 0 |
| 4b | 850.22 | 1600 | 0 | 0 | 0 | 0 | 0 | 63.2 | 271.7 | 0 | 0 |
| 4c | 850.22 | 1600 | 0 | 0 | 0 | 0 | 0 | 0.3551 | 1.527 | 0 | 0 |
| 5a | 280 | 110 | 0 | 0 | 0 | 0 | 0 | 0 | 0 | 0 | 0.3467 |
| 5b | 345 | 1600 | 0 | 0 | 0 | 0 | 0 | 0 | 0 | 0 | 0.2724 |
| 6 | 645 | 1600 | 0 | 0 | 0 | 0 | 0 | 0 | 0 | 0 | 0.07435 |
| AI | 1044.92 | 1536 | 0.9307 | 0.7044 | 0.0223 | 0 | 0.1655 | 0 | 1.476 | 0.0358 | 0 |
| AE | 1071.25 | 1475 | 0.2312 | 0.7044 | 0.0223 | 0 | 0 | 0 | 1.476 | 0.7353 | 0 |
| CI | 1052 | 1536 | 0 | 0 | 0 | 0 | 0 | 63.2 | 271.7 | 0 | 0 |
| CE | 1071.25 | 1475 | 0 | 0 | 0 | 0 | 0 | 62.85 | 271.7 | 0 | 0 |
| 7 | 345 | 1600 | 0 | 0 | 0 | 0 | 0 | 0 | 0 | 0 | 0.2724 |
| 8 | 1758 | 1386 | 0 | 0 | 3.973 | 0 | 0 | 69.78 | 320 | 3.772 | 0 |
| 9 (TIT) | 1557 | 1386 | 0 | 0 | 3.973 | 0 | 0 | 69.78 | 320 | 3.772 | 0 |
| 10 | 1132 | 333.4 | 0 | 0 | 3.973 | 0 | 0 | 69.78 | 320 | 3.772 | 0 |
| Nozzle core | 739.8 | 59.61 | 0 | 0 | 3.973 | 0 | 0 | 69.78 | 320 | 3.772 | 0 |
| Nozzle fan | 235.2 | 28.07 | 0 | 0 | 0 | 0 | 0 | 515.9 | 2218 | 0 | 0 |
Table 4.
Validation of GT model with referenced data.
| Simulation Results | Referenced E3 Data [46,47] | Relative Error (%) | |
|---|---|---|---|
| Fan efficiency | 0.8793 | 0.887 | −0.87 |
| Fan Pressure ratio | 1.562 | 1.61 | −2.98 |
| LPC efficiency | 0.902 | 0.861 | 4.73 |
| HPC efficiency | 0.813 | 0.821 | −0.96 |
| HPT efficiency | 0.916 | 0.924 | −0.90 |
| HPT expansion ratio | 4.158 | 4.2 | −1.00 |
| LPT efficiency | 0.910 | 0.917 | −0.75 |
| LPT expansion ratio | 2.977 | 3.1 | −3.96 |
| TIT | 1557 K | 1517.15 K | 2.62 |
Table 5.
CPOx performance data validation.
| Simulation Data | Referenced Data [48] | Relative Error | |
|---|---|---|---|
| Inlet air temperature | 850.22 K | 873.15 K | 3% |
| Fuel inlet temperature | 643.15 K | 643.15 K | 0 |
| Reactor temperature | 1045 K | 1037.15 K | −0.76% |
Disclaimer/Publisher’s Note: The statements, opinions and data contained in all publications are solely those of the individual author(s) and contributor(s) and not of MDPI and/or the editor(s). MDPI and/or the editor(s) disclaim responsibility for any injury to people or property resulting from any ideas, methods, instructions or products referred to in the content. |
© 2024 by the authors. Licensee MDPI, Basel, Switzerland. This article is an open access article distributed under the terms and conditions of the Creative Commons Attribution (CC BY) license (https://creativecommons.org/licenses/by/4.0/).
Share and Cite
MDPI and ACS Style
Mashamba, T.M.; Wen, J.; Spataru, C.; Weng, Y.; Lv, X. Characteristic Investigation of a Novel Aircraft SOFC/GT Hybrid System under Varying Operational Parameters. Appl. Sci. 2024, 14, 3504. https://doi.org/10.3390/app14083504
AMA Style
Mashamba TM, Wen J, Spataru C, Weng Y, Lv X. Characteristic Investigation of a Novel Aircraft SOFC/GT Hybrid System under Varying Operational Parameters. Applied Sciences. 2024; 14(8):3504. https://doi.org/10.3390/app14083504
Chicago/Turabian StyleMashamba, Takudzwa Martin, Jiale Wen, Catalina Spataru, Yiwu Weng, and Xiaojing Lv. 2024. "Characteristic Investigation of a Novel Aircraft SOFC/GT Hybrid System under Varying Operational Parameters" Applied Sciences 14, no. 8: 3504. https://doi.org/10.3390/app14083504
Note that from the first issue of 2016, this journal uses article numbers instead of page numbers. See further details here.