Article

Estimating the Uncertainty of Measurements for Various Methods and 3D Printed Parts

1
Faculty of Mechatronics and Mechanical Engineering, Kielce University of Technology, 25-314 Kielce, Poland
2
Central Office of Measures, Elektoralna 2, 00-139 Warsaw, Poland
3
Department of Machining, Assembly and Engineering Metrology, Faculty of Mechanical Engineering, VSB–Technical University of Ostrava, 708 00 Ostrava, Czech Republic
*
Author to whom correspondence should be addressed.
Appl. Sci. 2024, 14(8), 3506; https://doi.org/10.3390/app14083506
Submission received: 25 March 2024 / Revised: 16 April 2024 / Accepted: 17 April 2024 / Published: 21 April 2024
(This article belongs to the Section Additive Manufacturing Technologies)

Abstract

:
This paper presents the results of a study on the dimensional accuracy analysis of models produced by 3D printing technology—Fused Filament Fabrication (FFF). Geometric measurements were conducted using a dial caliper, a 3D scanner and a coordinate measuring machine. In addition, a statistical analysis of the test results was carried out, considering the division into different numbers of test samples (3, 5, 10, 20, 30). The analysis of the test results made it possible to assess the influence of the measuring tools used and the number of samples tested on the final measurement result, as well as to determine the consequences associated with it.

1. Introduction

Developing 3D printing technologies are increasingly competing with conventional manufacturing technologies. This is mainly due to the development of 3D printers, the increasing accuracy of the models produced, and the growing range of materials available. Nowadays, 3D printing is based on both plastic-based materials, metal powders, and ceramics. In the case of the 3D printing process, the dimensional and shape accuracy of the produced models depends on the technological parameters of the manufacturing process, which are variable depending on the 3D printing technology used.
Studies of the dimensional and shape accuracy, and surface texture of models produced by 3D printing have been described in many scientific publications [1,2,3,4,5] and doctoral dissertations, but in many cases, the number of samples tested has been significantly limited. There are cases where studies aimed at determining the influence of technological parameters on the accuracy of 3D printing manufacturing have been carried out on only three or five manufactured samples. In such a situation, reporting the average value result alone is an incomplete representation of the actual result. Such situations may occur in the case of high production costs or a time-consuming process, but in the case of technologies such as FFF, they are unjustified. Therefore, in the present work, the study of the dimensional accuracy of models manufactured by 3D printing technology-FFF from the material based on pure PLA using three measuring tools, along with a comprehensive statistical analysis of the test results, was undertaken. This approach will make it possible to determine the influence of the measuring instrument used for testing and the number of samples evaluated on the value of the result. The results of metrological measurements of dimensional accuracy in many cases carry consequences regarding the decisions made on their basis, and therefore the information presented in this publication can be used by both 3D printing technologists and decision-makers responsible for the manufacture of prototypes. In the case of technologists, decisions made based on the dimensional accuracy testing performed can impinge on decisions regarding 3D printer service, calibration, component replacement, or the ability to manufacture a custom order. For scientists, knowledge of measurement methods, and their advantages and disadvantages, can contribute to the development of appropriate measurement methods, strategy [6], and improvement of the measurement processes for 3D printed models [7,8].
The rapid development of additive technologies observed in recent years requires the determination of the current dimensional and shape accuracy of the manufactured parts. Accordingly, research work is being carried out on the metrology of measurement of geometric quantities of models produced by 3D printing. Various measuring devices such as hand-held measuring instruments, coordinate measuring machines (CMM—coordinate measuring machine), 3D scanning (3DS), computer tomography (CT) [9], etc., are used for this purpose. In addition, there are publications where the authors also conduct a comparison of the accuracy of the mentioned systems. Ref. [10] presents the results of measurements for the three systems analyzed: coordinate measuring machine (CMM), 3D scanning, and computed tomography for samples produced using 3D printing technology: fused filament fabrication (FFF) and selective laser sintering (SLS). The results of the study indicate differences in measurement results for the different measurement systems and point to, among other things, equal measurement procedures and parameters as the reason. Very often, when describing the results of the tests, the issues of the number of samples on which they were conducted are overlooked. In the lack of information on the number of samples tested, it can be concluded that the tests were carried out on a single sample, which affects the reliability of the results obtained and is undoubtedly an inappropriate action [9,11]. The results of testing for a small number of samples in determining the type A standard uncertainty and for the expanded uncertainty are crucial and affect the final results [12]. The most common instruments for measuring geometric quantities such as shaft diameters are hand-held measuring instruments such as calipers and bore gages. These instruments usually have a measurement resolution of about 0.01 mm, and their accuracy is at a similar level. Measurements made with these devices are subject to numerous errors such as observer error and low-precision pressing force. In Ref. [13], the authors described the results of tests conducted using hand-held measuring instruments such as calipers and the errors associated with this type of measurement. The authors pointed out that upper limb motor skills (especially finger coordination) significantly affect the accuracy of measurement using a caliper.
Coordinate measuring machines (CMMs) are another common method for measuring the geometry of 3D printed parts. Measurement using CMM for 3D printing involves the need for stable mounting of the test sample, proper selection of the diameter of the probe tip, and appropriate force of the probe tip on the test piece. In an article [9] on the measurement of 3D printed parts manufactured using fused deposition modeling/fused filament fabrication (FDM/FFF) technology on a CMM, the authors pointed out that the results obtained from the measurement of internal diameters were lower than the nominal diameters of these holes. On the other hand, the authors of Ref. [13], who conducted a study on the geometric accuracy of stationary 3D printers using a CMM, obtained similar results for internal diameters, where in each case the diameter had a value lower than the nominal one. However, when measuring external diameters for a nominal value of 20 mm, the diameter value was higher, and for a nominal value of 30 mm, the value was lower than expected.
One of the popular methods of measuring the geometry and surface of a component is 3D scanning. It is distinguished by its remarkable measurement speed as well as technological intuitiveness. However, it has its limitations [14], such as the requirement for adequate illumination of the sample under examination; for example, if it has deep narrow holes, errors in the virtual model and inaccurate representation of the geometry are possible. Another important aspect of the scanning method is that it is a non-contact measurement, which prevents potential changes in the surface of the measured sample, although there may be larger deviations created in the intermediate stages and the performance of 3D model fitting [15,16,17,18,19]. Associated with the measurement of the geometry of parts manufactured by 3D printing technologies is the problem of estimating the uncertainty of the results of these measurements. Measurement uncertainty u is a parameter that allows one to determine the limits of the interval containing, with assumed probability, the unknown true value of the measured quantity. Measurement uncertainty is affected by a number of uncertainty components. Their determination can be made based on the evaluation of standard deviation estimators for the obtained scatter of the results of a series of measurements or, in the case of single measurements, by means of standard deviations determined on the basis of predicted probability distributions [20].
Ref. [21] proposed a general method for establishing a mathematical model of spatial uncertainty based on the measured geometry of microstructures created in the manufacturing of parts by 3D printing technology. Whereby, the spatial uncertainty was defined as the deviation between the planned and actual geometry of the model structure made by 3D printing. The dimensions of a part produced by an additive method often deviate from the nominal values of 3D model features due to factors such as printer resolution, printing parameters, printing technology, and measurement method. Using the example of a standard test artifact from the National Institute of Standards and Technology (NIST) containing a set of different features that can be used to characterize the performance of 3D printers, comparative tests were performed using different additive technologies [22].
The standard [23] for additive manufacturing recommends different shapes of master samples, for evaluating, among other things, the spatial uncertainty of parts that can be made using different 3D printing technologies.
Achieving high dimensional accuracy in 3D printing technology, selecting a suitable measurement method for geometric dimensions, and estimating the uncertainty of measurement results is a considerable problem, as demonstrated in this work.
In scientific research, a frequently used concept is measurement uncertainty, but in the presented work, the so-called production uncertainty was examined, which has been shown to be significantly influenced by the number of samples tested, and the final result varies depending on the measurement method used. The main purpose of the measurement is the diameter of the sample and the assessment of the impact of measurement accuracy on its values. Moreover, an additional goal of our research was to show how an accidental encounter of a seam by the operator of both the caliper and the coordinate measuring machine can be misinterpreted and falsify the result of the diameter, not the distance. We treat the seam as a defect that the operator taking the measurement is unaware of, because the seam may be scattered across the diameter and invisible at first view.

2. Materials and Methods

2.1. FDM/FFF Technology
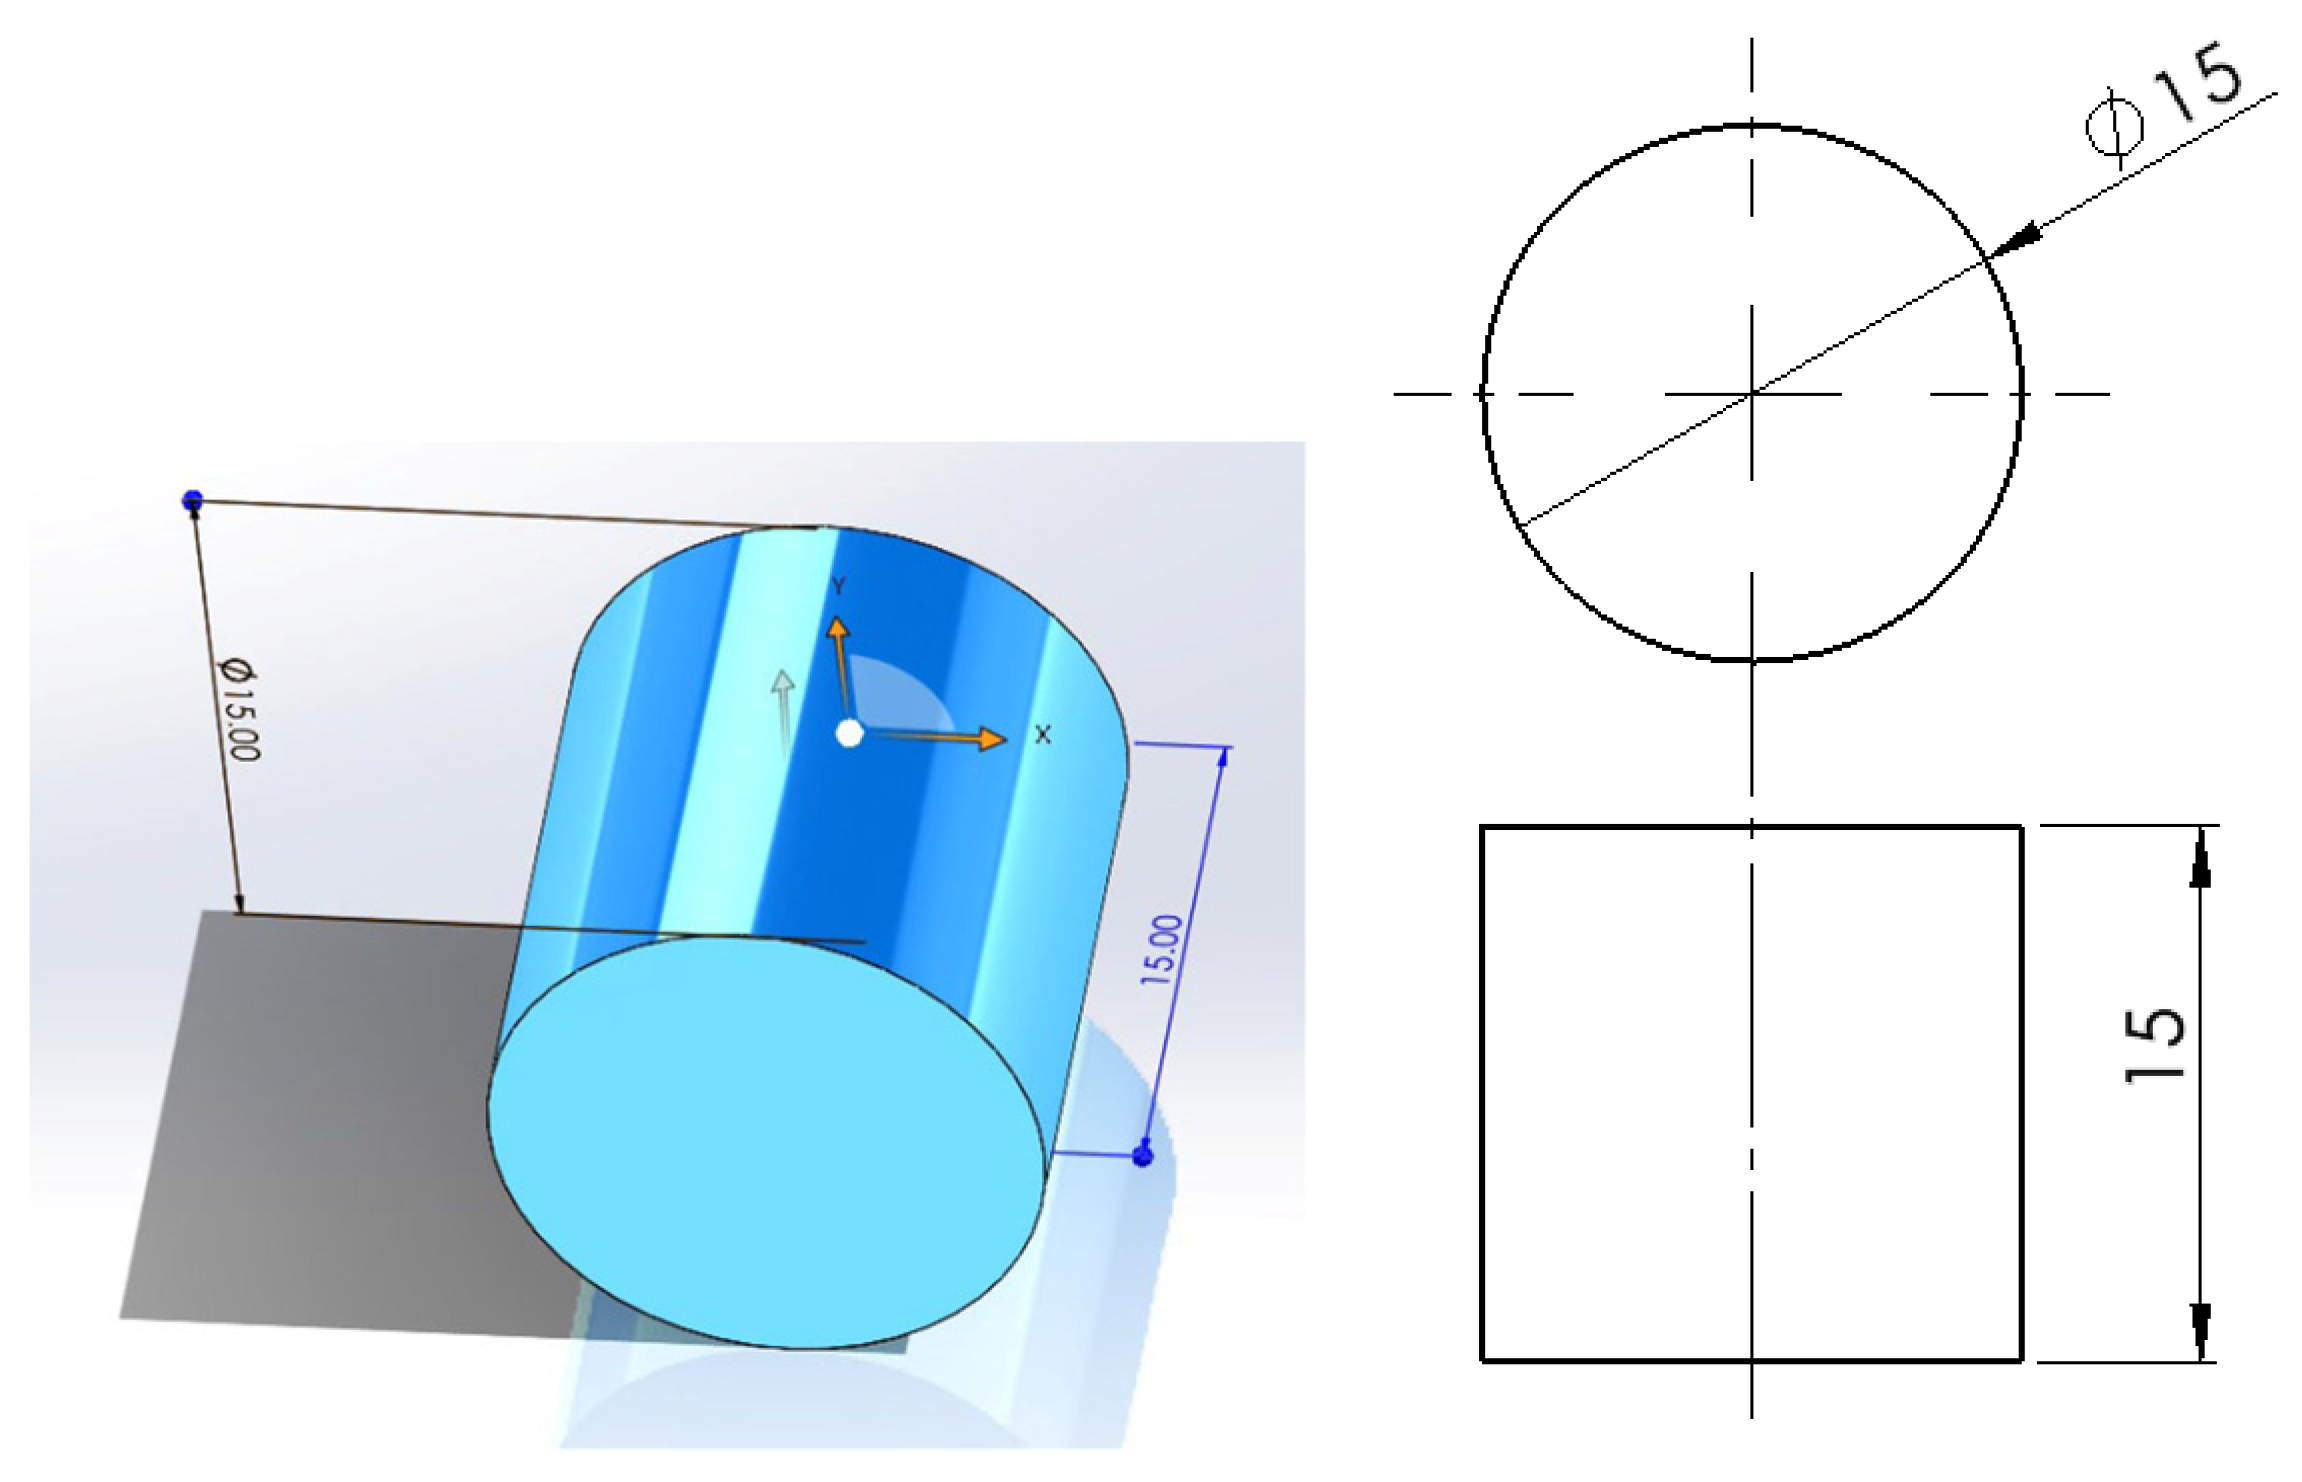
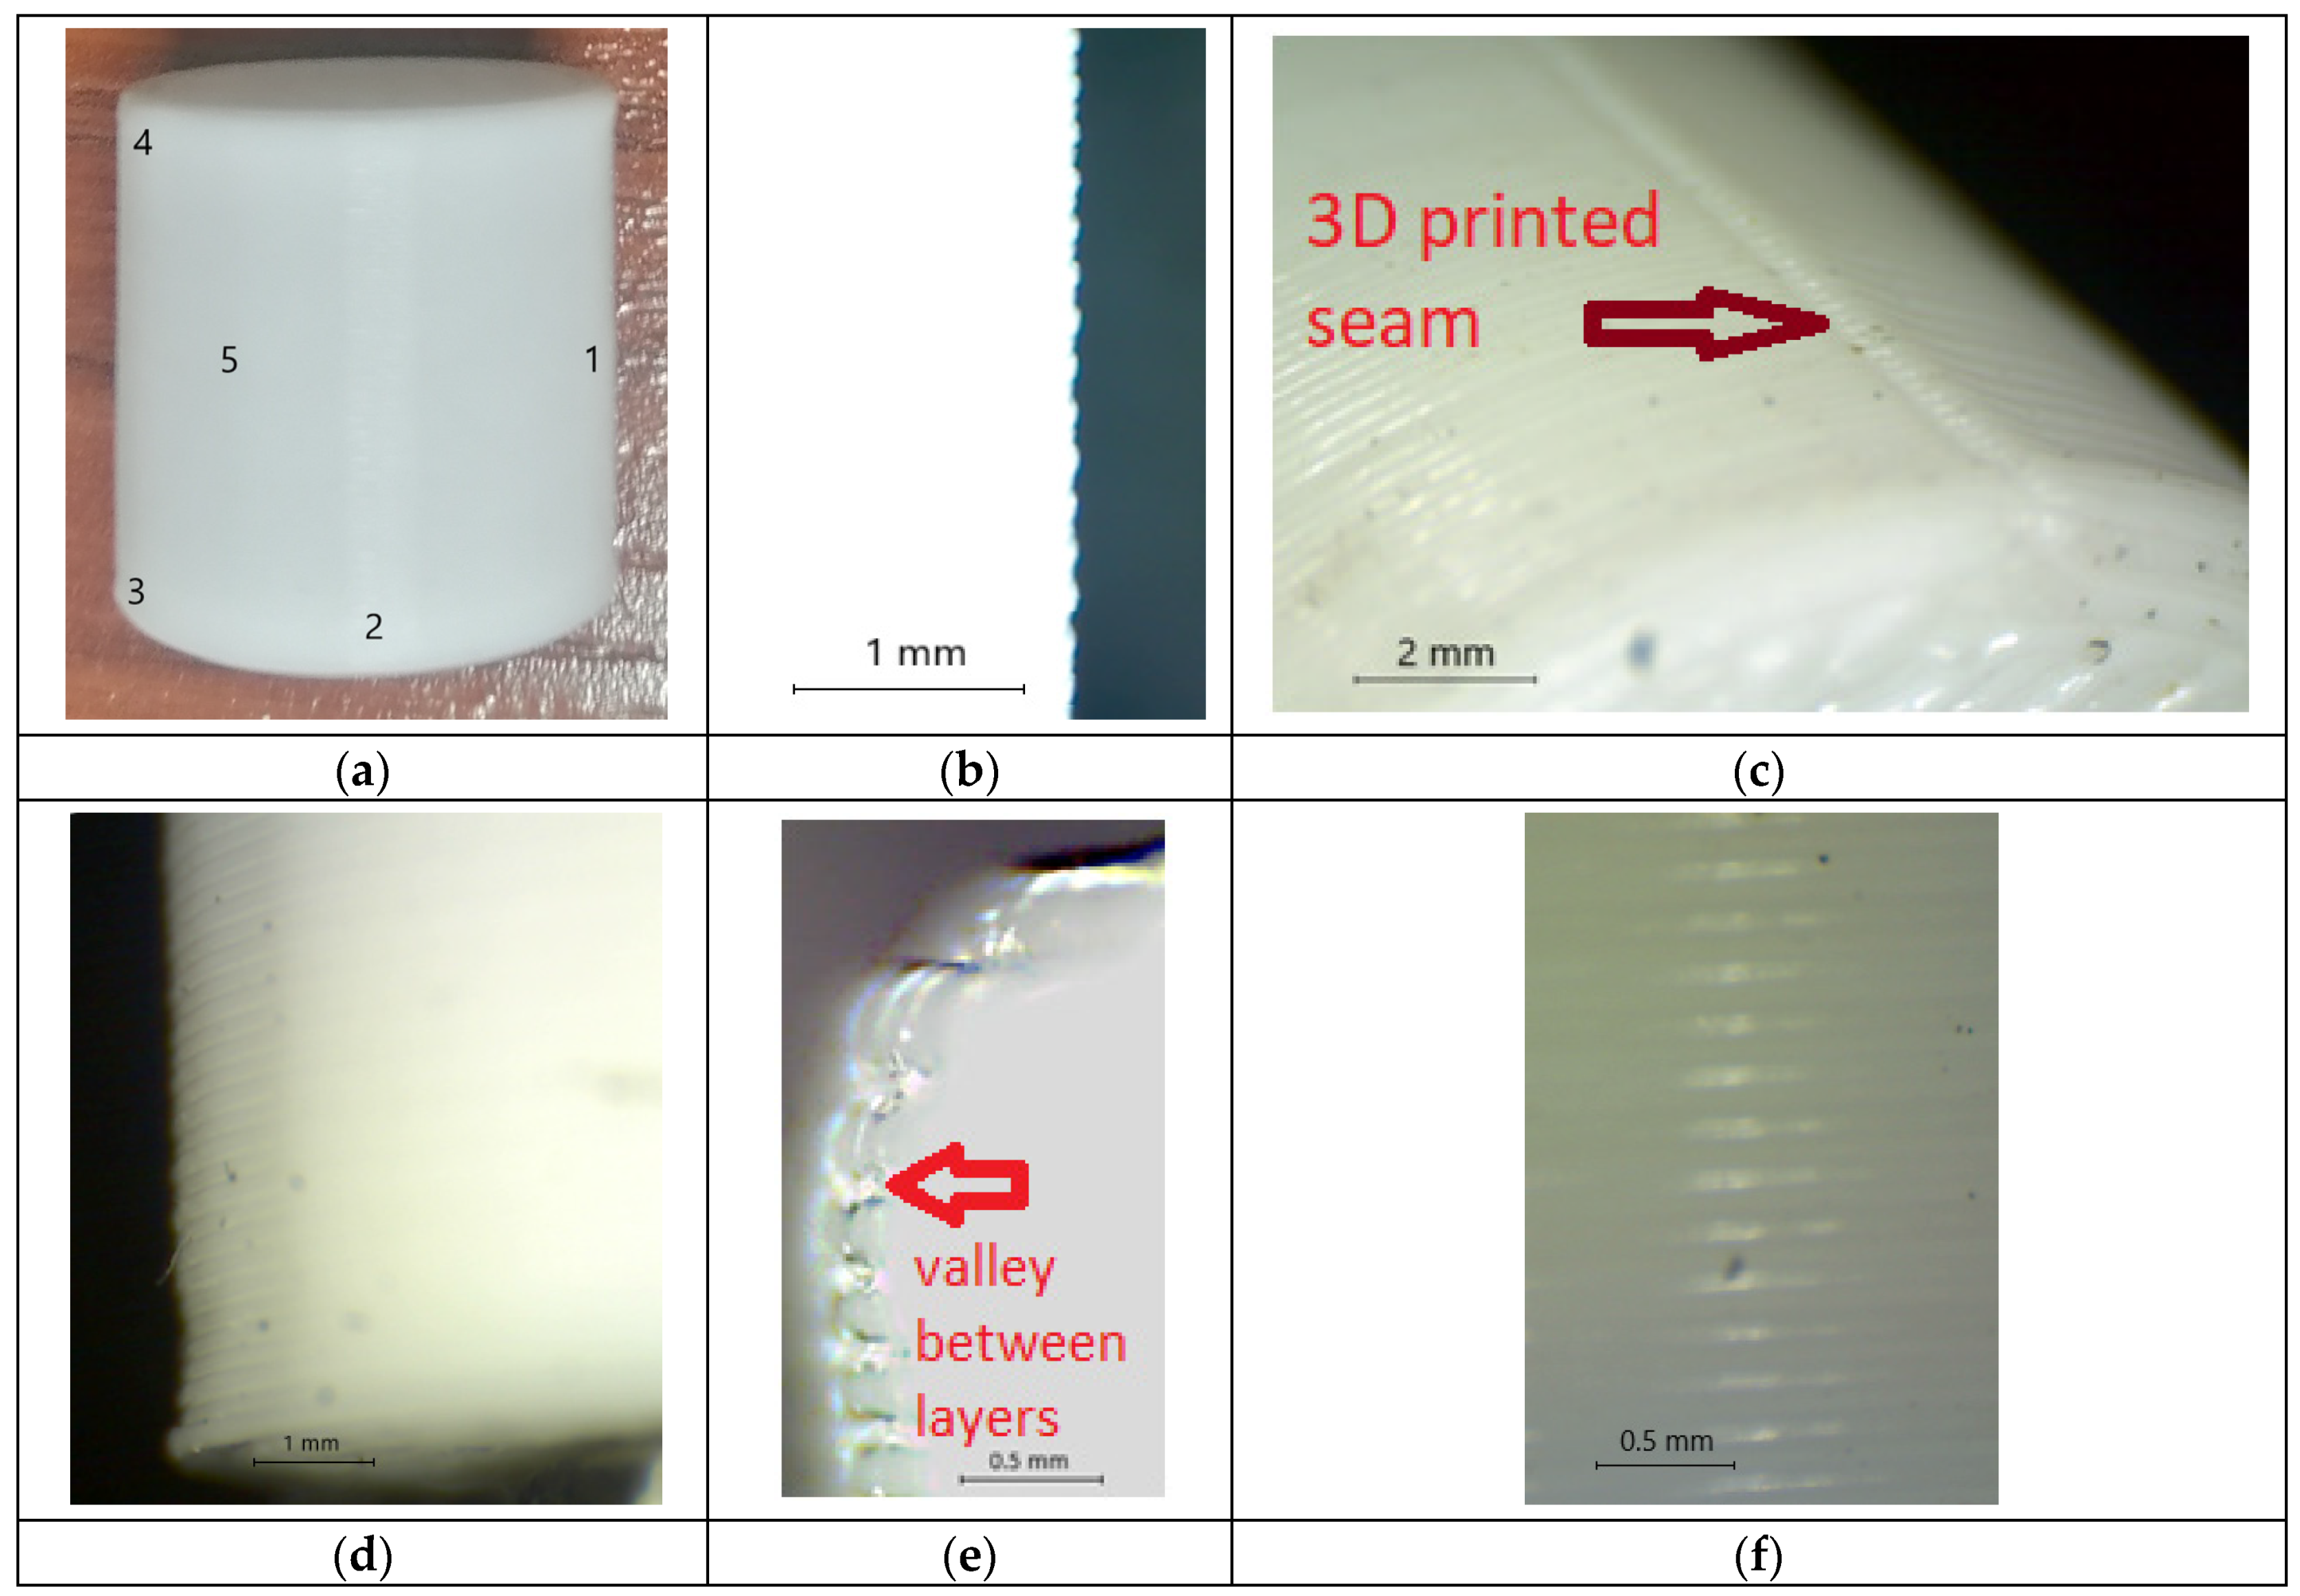
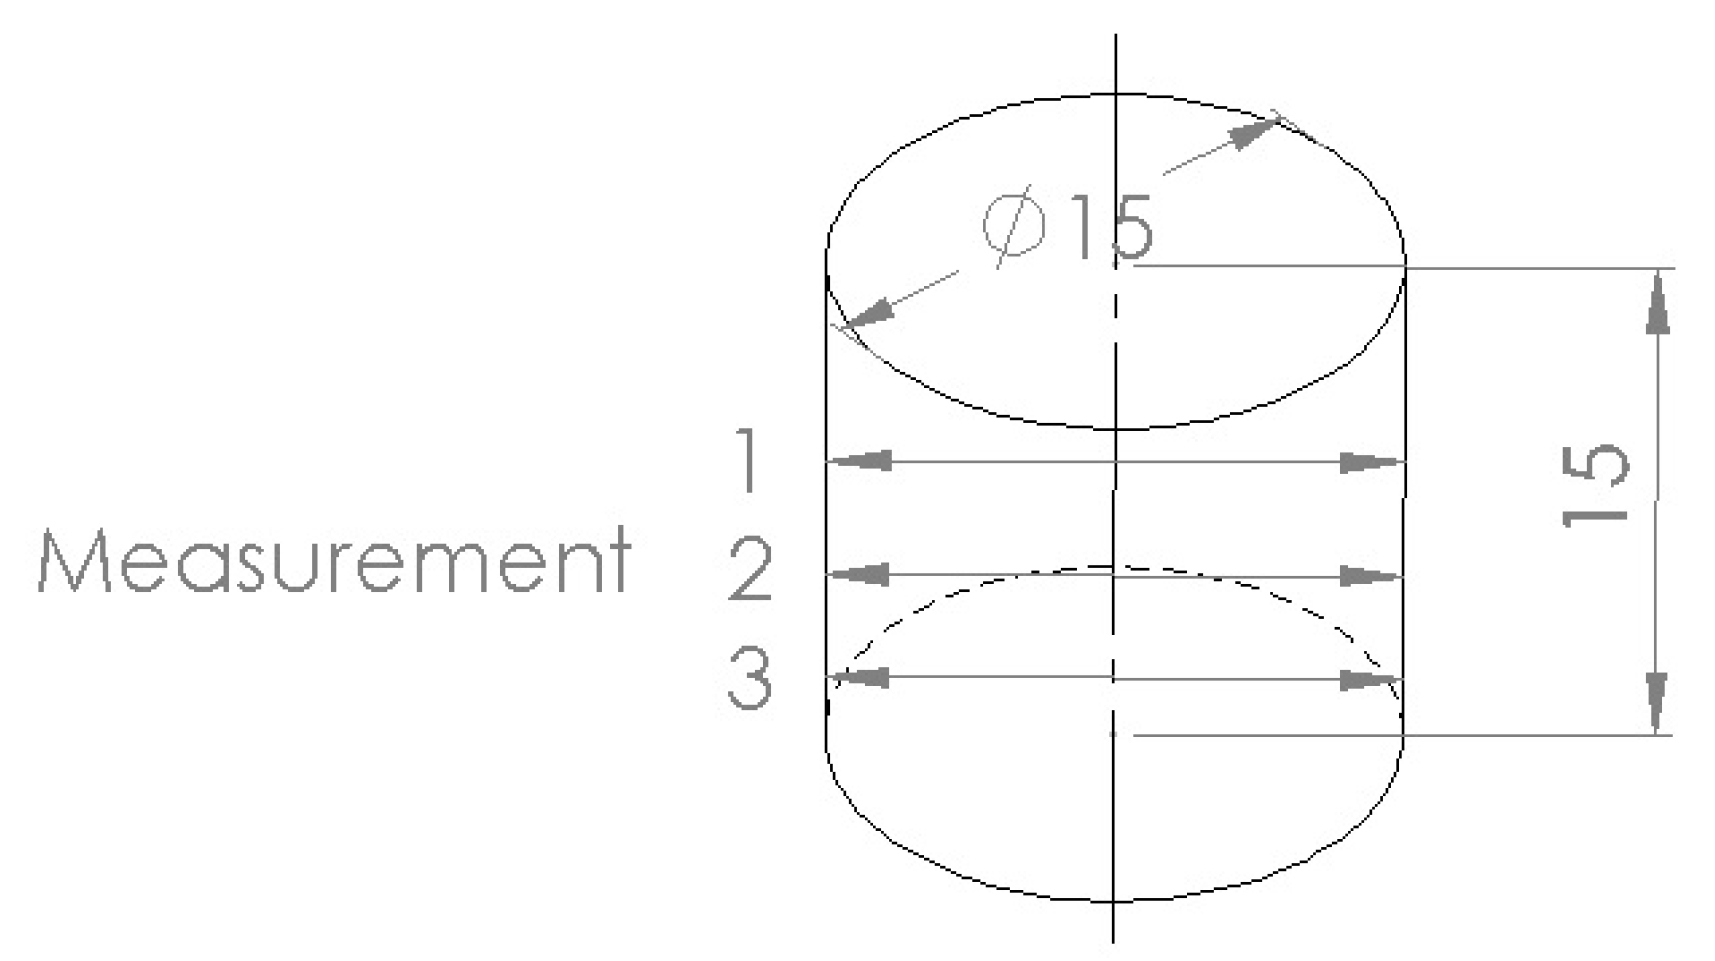
The FDM (fused filament fabrication) method, also known as FFF (fused filament fabrication), is one of the most popular 3D printing methods. These technologies have been included in the so-called group called MEX—material extrusion—for less than 3 years, according to the ISO/ASTM 52900:2021 standard [24]. In the presented article, due to the slow coming into use of the nomenclature mentioned in the standard, the widely used names FDM/FFF were used. In accordance with the above standard, the short name for the samples used in the article, describing the technology and material, is as follows: MEX-TRB/P/PLA, where TRB means thermal reaction bonding, and P-polymer material. It involves building the model layer by layer. The material, which is supplied in the form of a filament usually with a diameter of 1.75–3 mm to the printer’s extruder, is heated to a temperature slightly below the melting point of the material, and it is spread in the form of a thin filament, where during solidification it combines with another filament deployed by the device along a predefined trajectory [25].

2.1.1. Samples

The sample model was designed using a 3D CAD program—SolidWorks 2024. The created model was cylindrical in shape with a diameter of 15 mm and a height of 15 mm, as shown in Figure 1.
The 3D CAD model was saved in STL form (Figure 2), which creates a solid model using a triangle mesh. The created model was approximated using 1440 triangles. The parameters of the STL file are: linear deviation—0.002 mm, and angle—1°.

2.1.2. PLA Material

The samples were made from one of the most popular materials used in FDM/FFF technology, namely, PLA produced by MakerBot. Selected mechanical properties of the material used are shown below in Table 1.

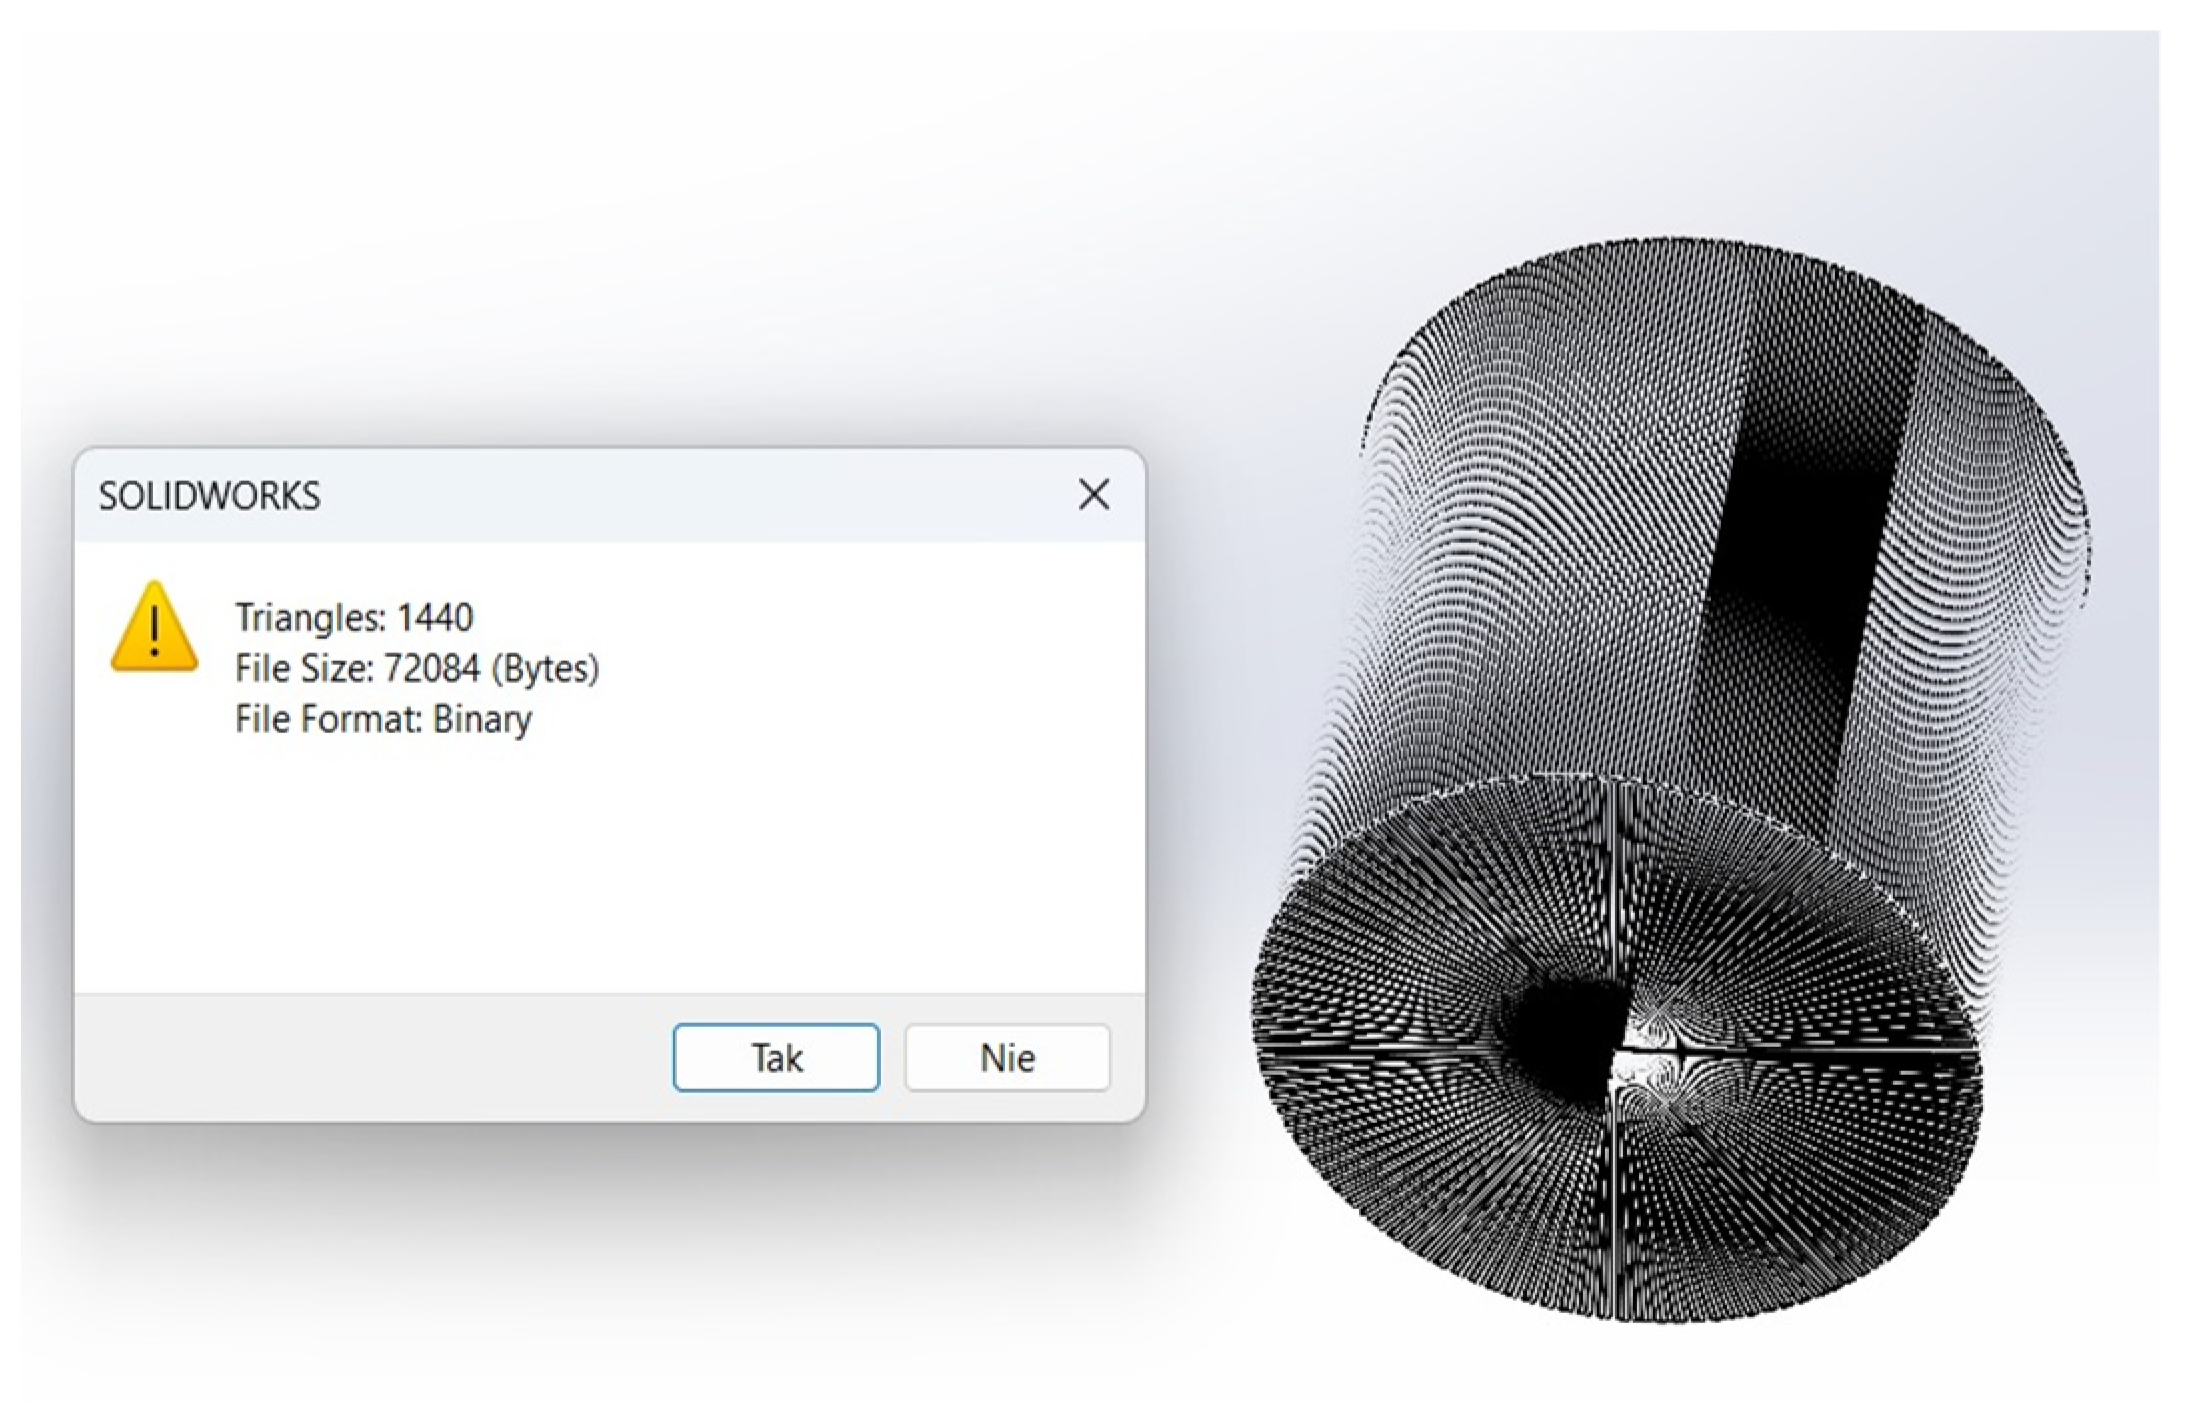
2.1.3. Samples Manufacturing

The samples were printed using a MakerBot Sketch printer (MakerBot, New York, NY, USA) [27]. The digital models of the samples were placed on the virtual platform of the MakerBot Sketch printer and printed during one printing cycle in the amount of 30 pieces. Table 2, below, presents the most important printing parameters set in the MakerBot Print program.
Figure 3 below shows the layout (manufacturing paths) of the models on the work platform in MakerBot Print for the MakerBot Sketch printer.
Each of the printed samples had a seam [28], i.e., a place where the device began and ended the placement of the next layer of building material in each model. A seam is an unintentional defect on the surface resulting from the technological process of 3D printing, and there is only a possibility of its random scattering on the surface—in our case, a cylindrical surface. A seam is a defect similar to that found in machining—a burr that, if not removed, may cause error in the measurement. Moreover, it is possible to make the seam in one line, as shown in Figure 4c; this seam location is convenient for research purposes, and that is why it was chosen in the research.

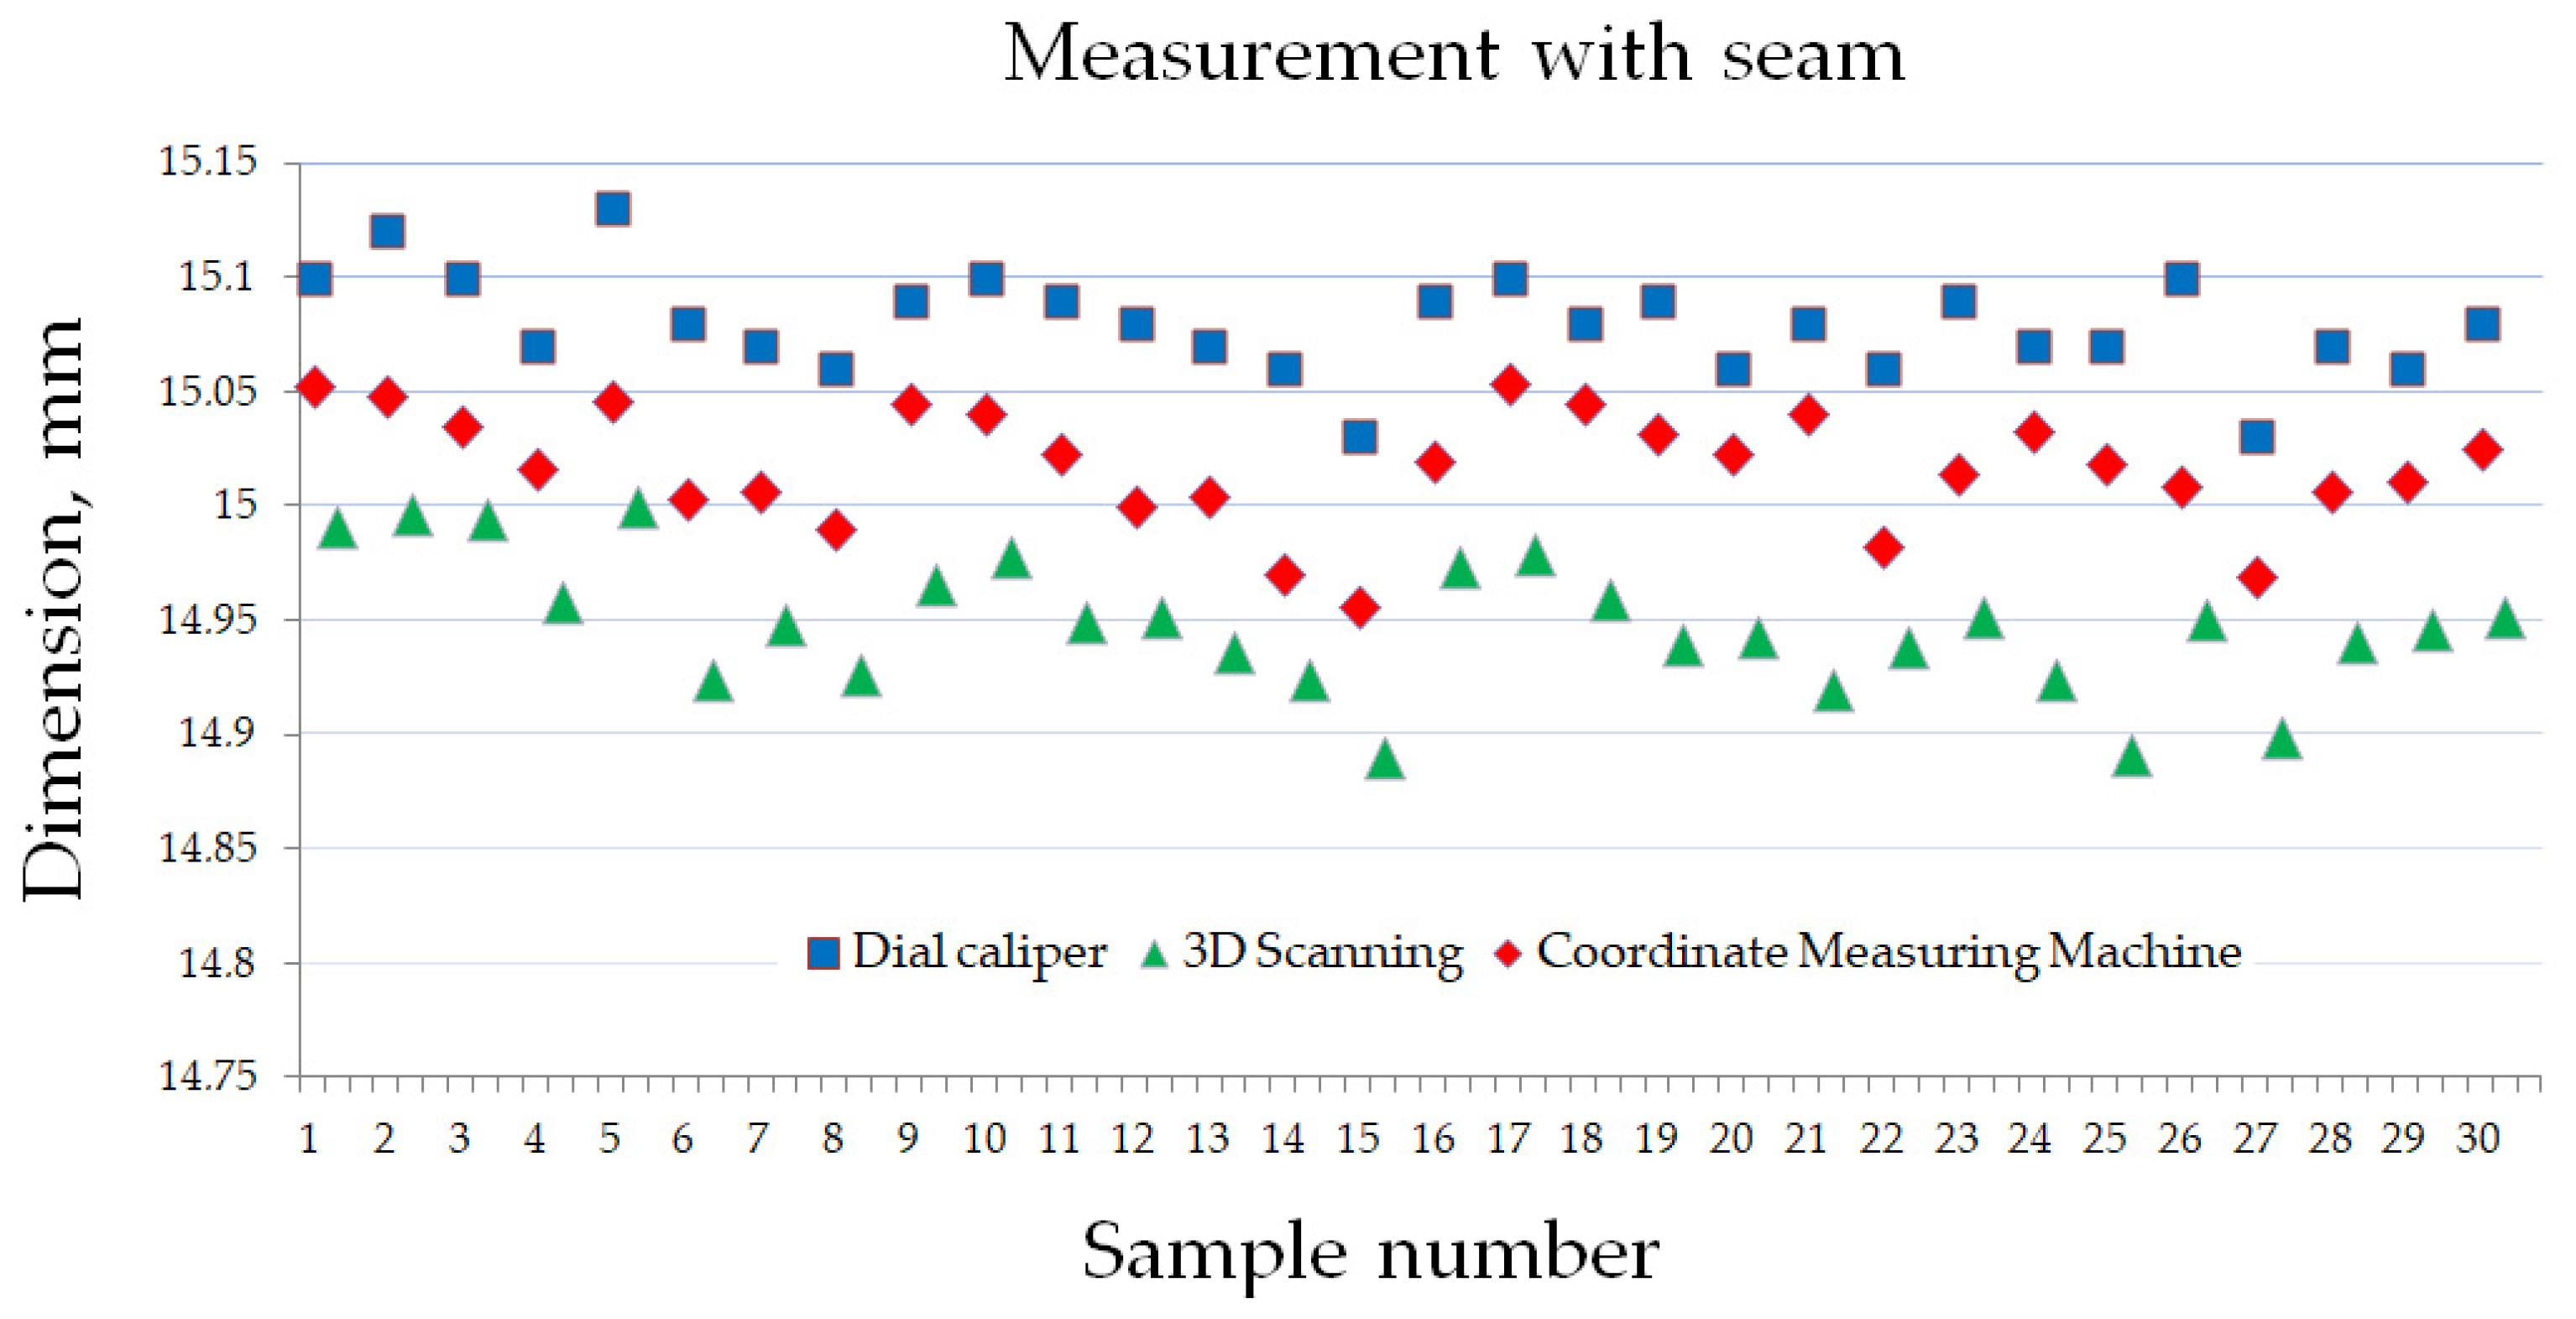
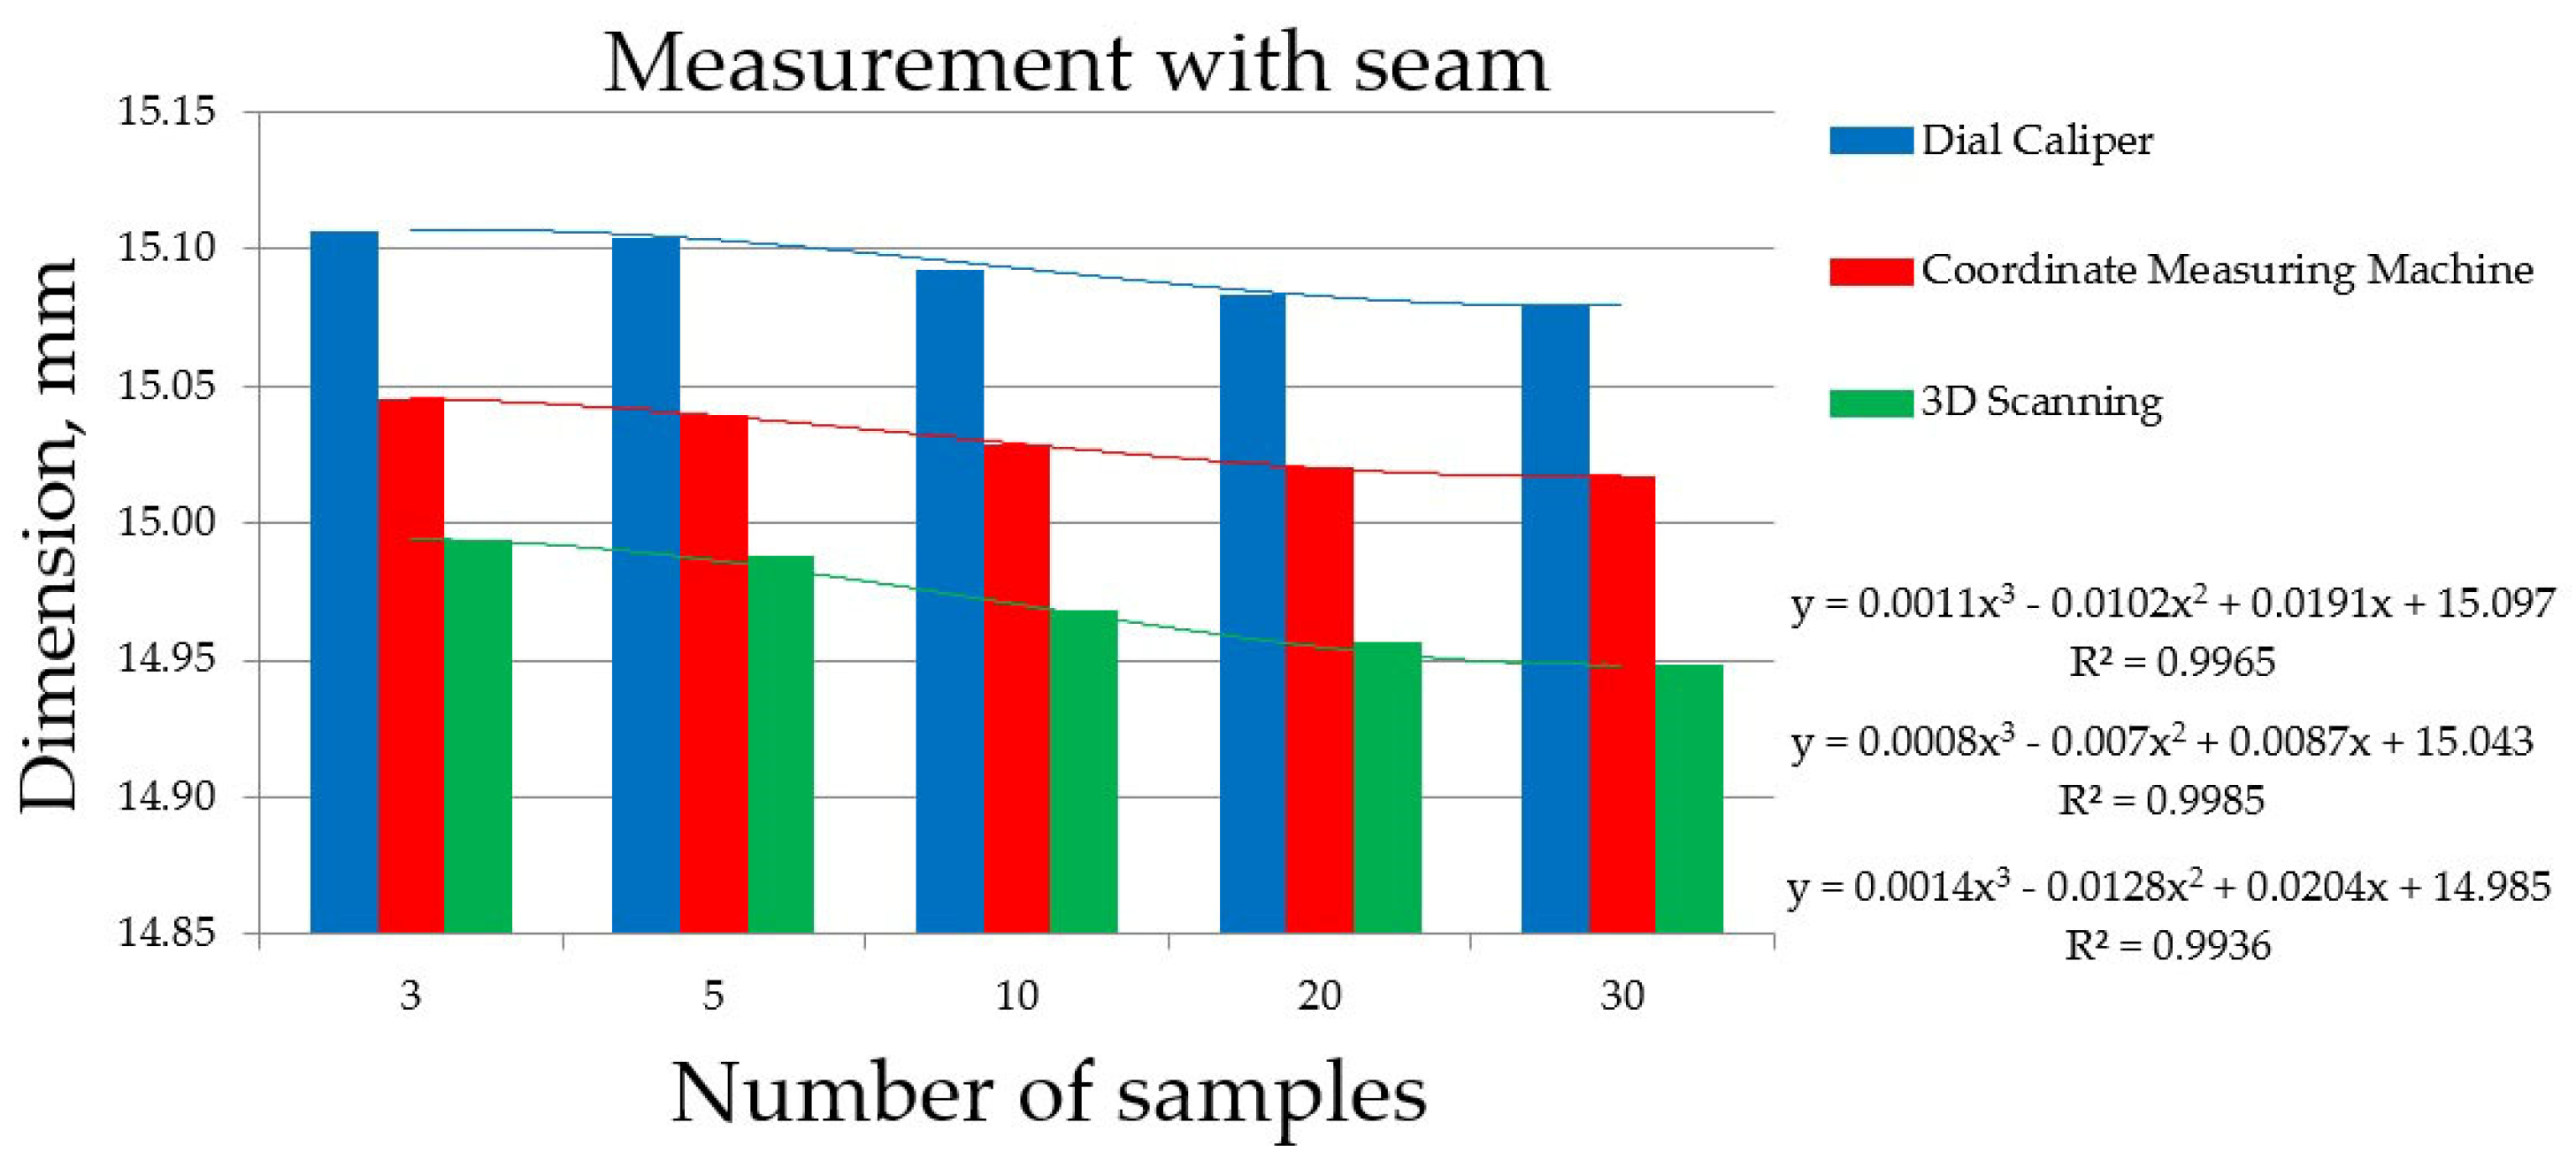
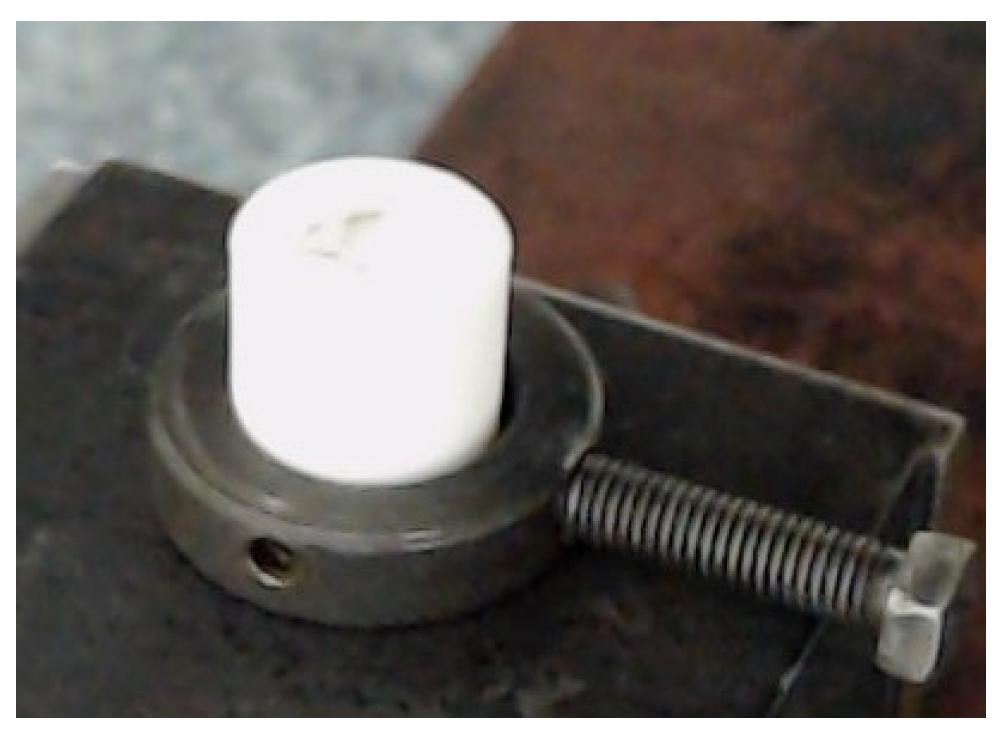
2.2. Measurement Methods
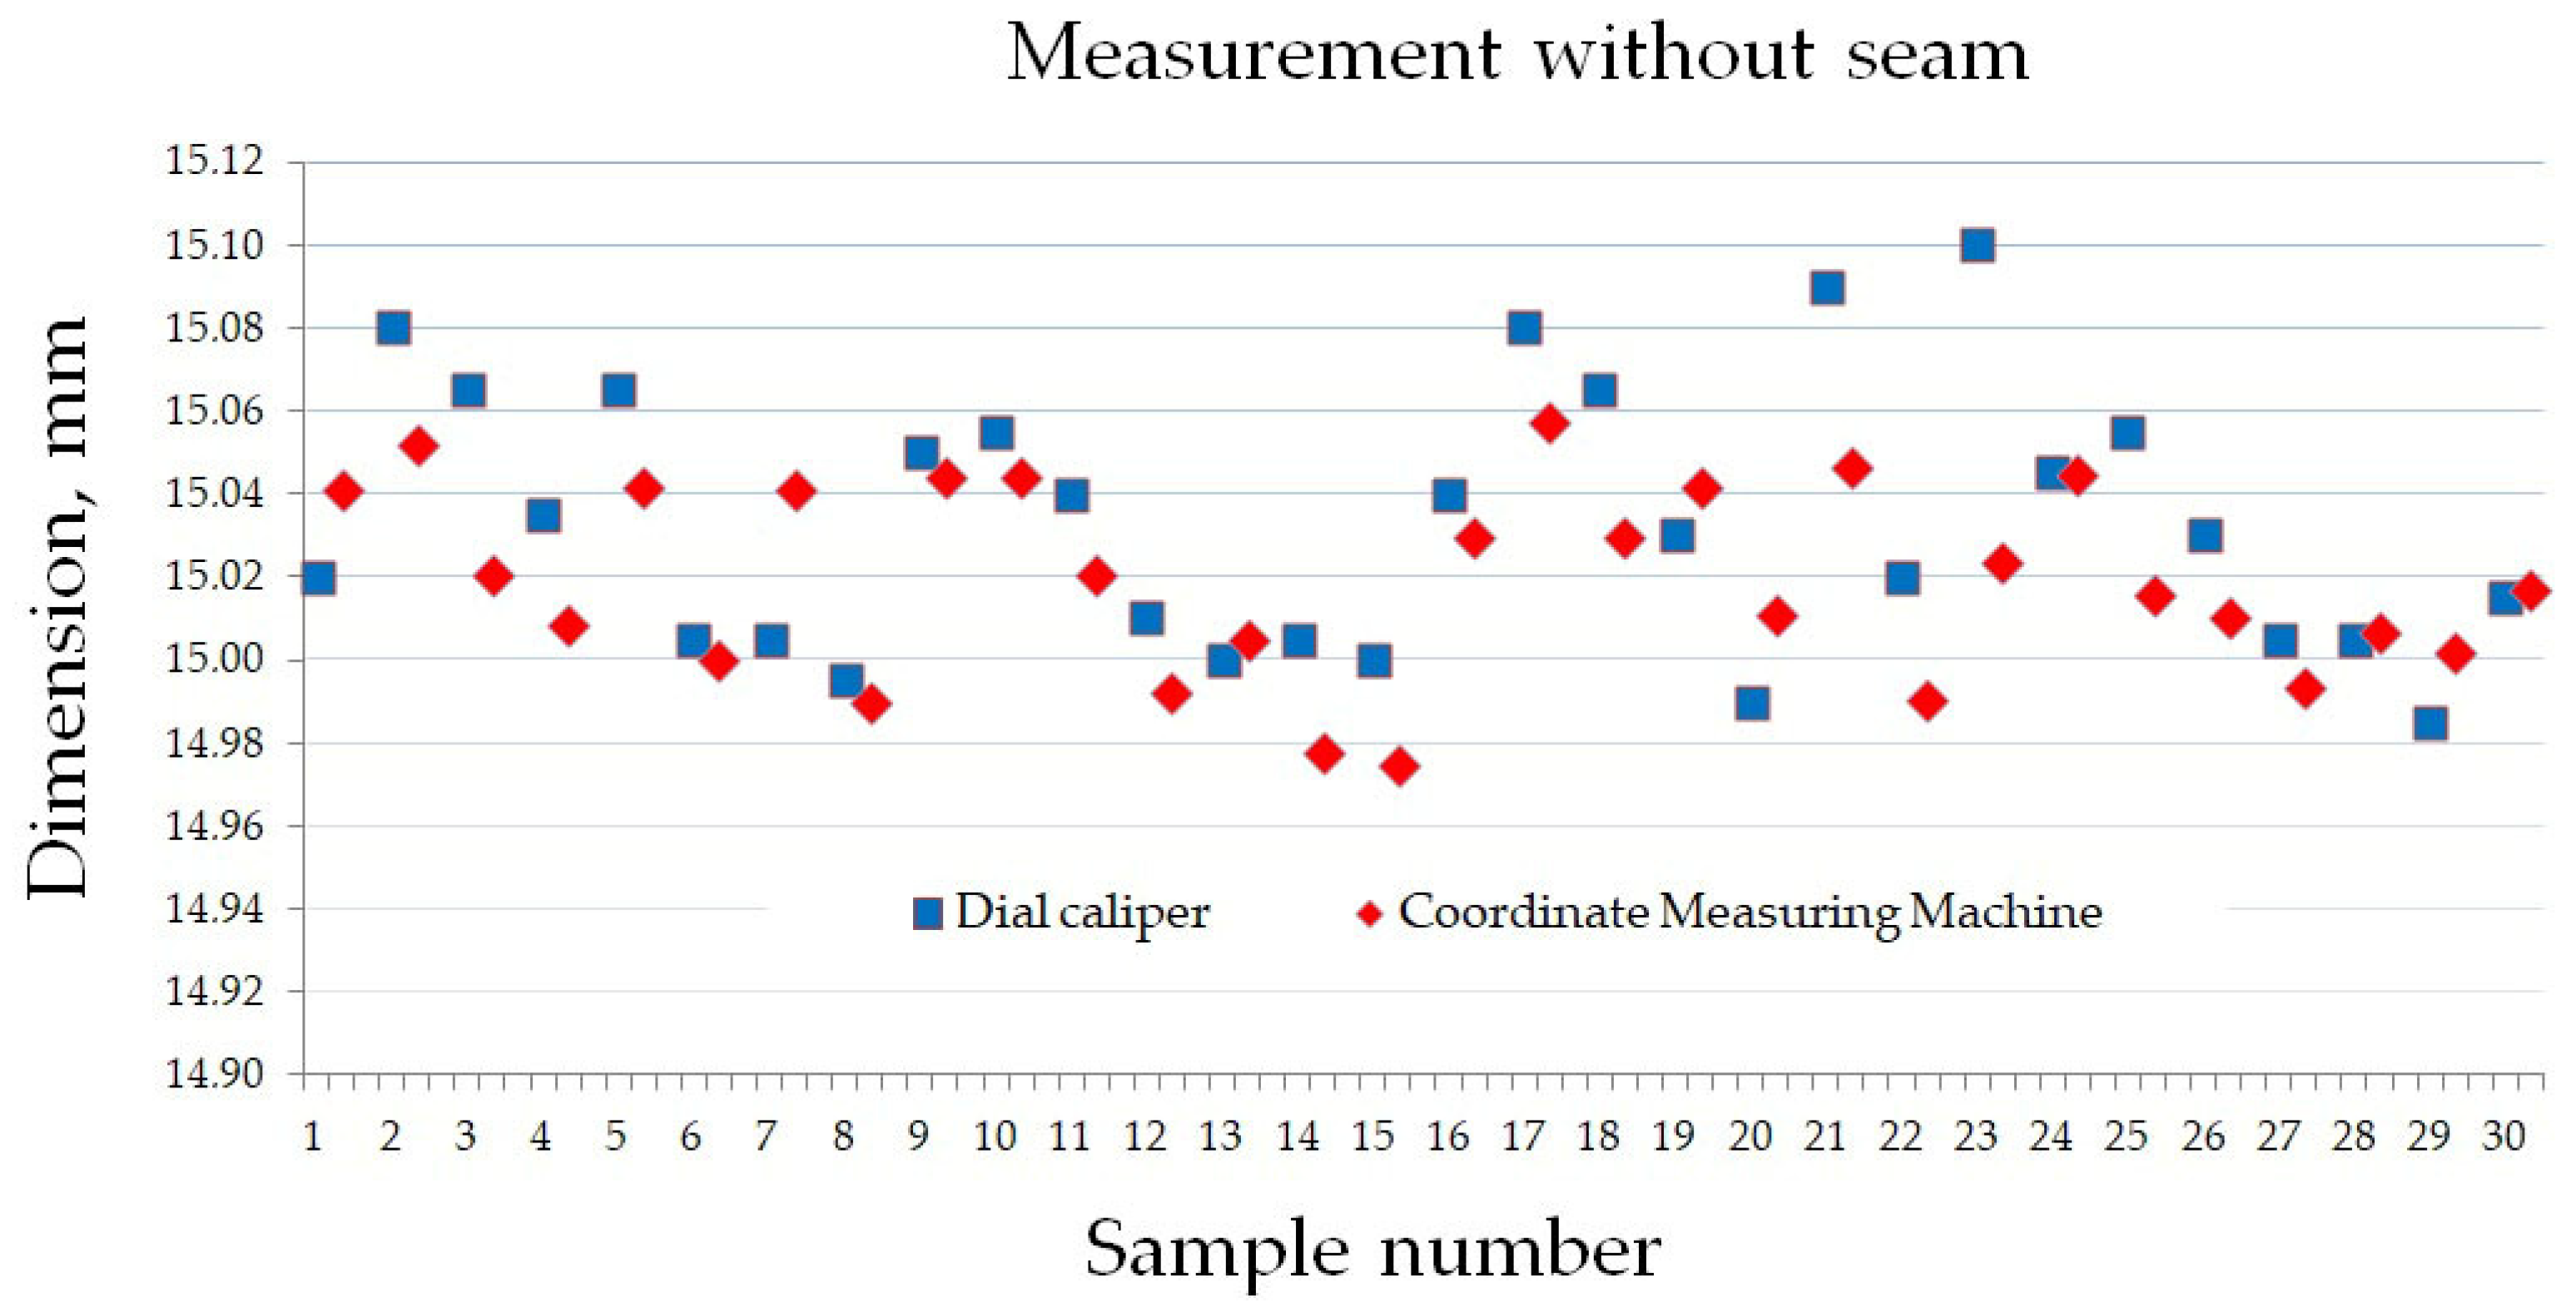
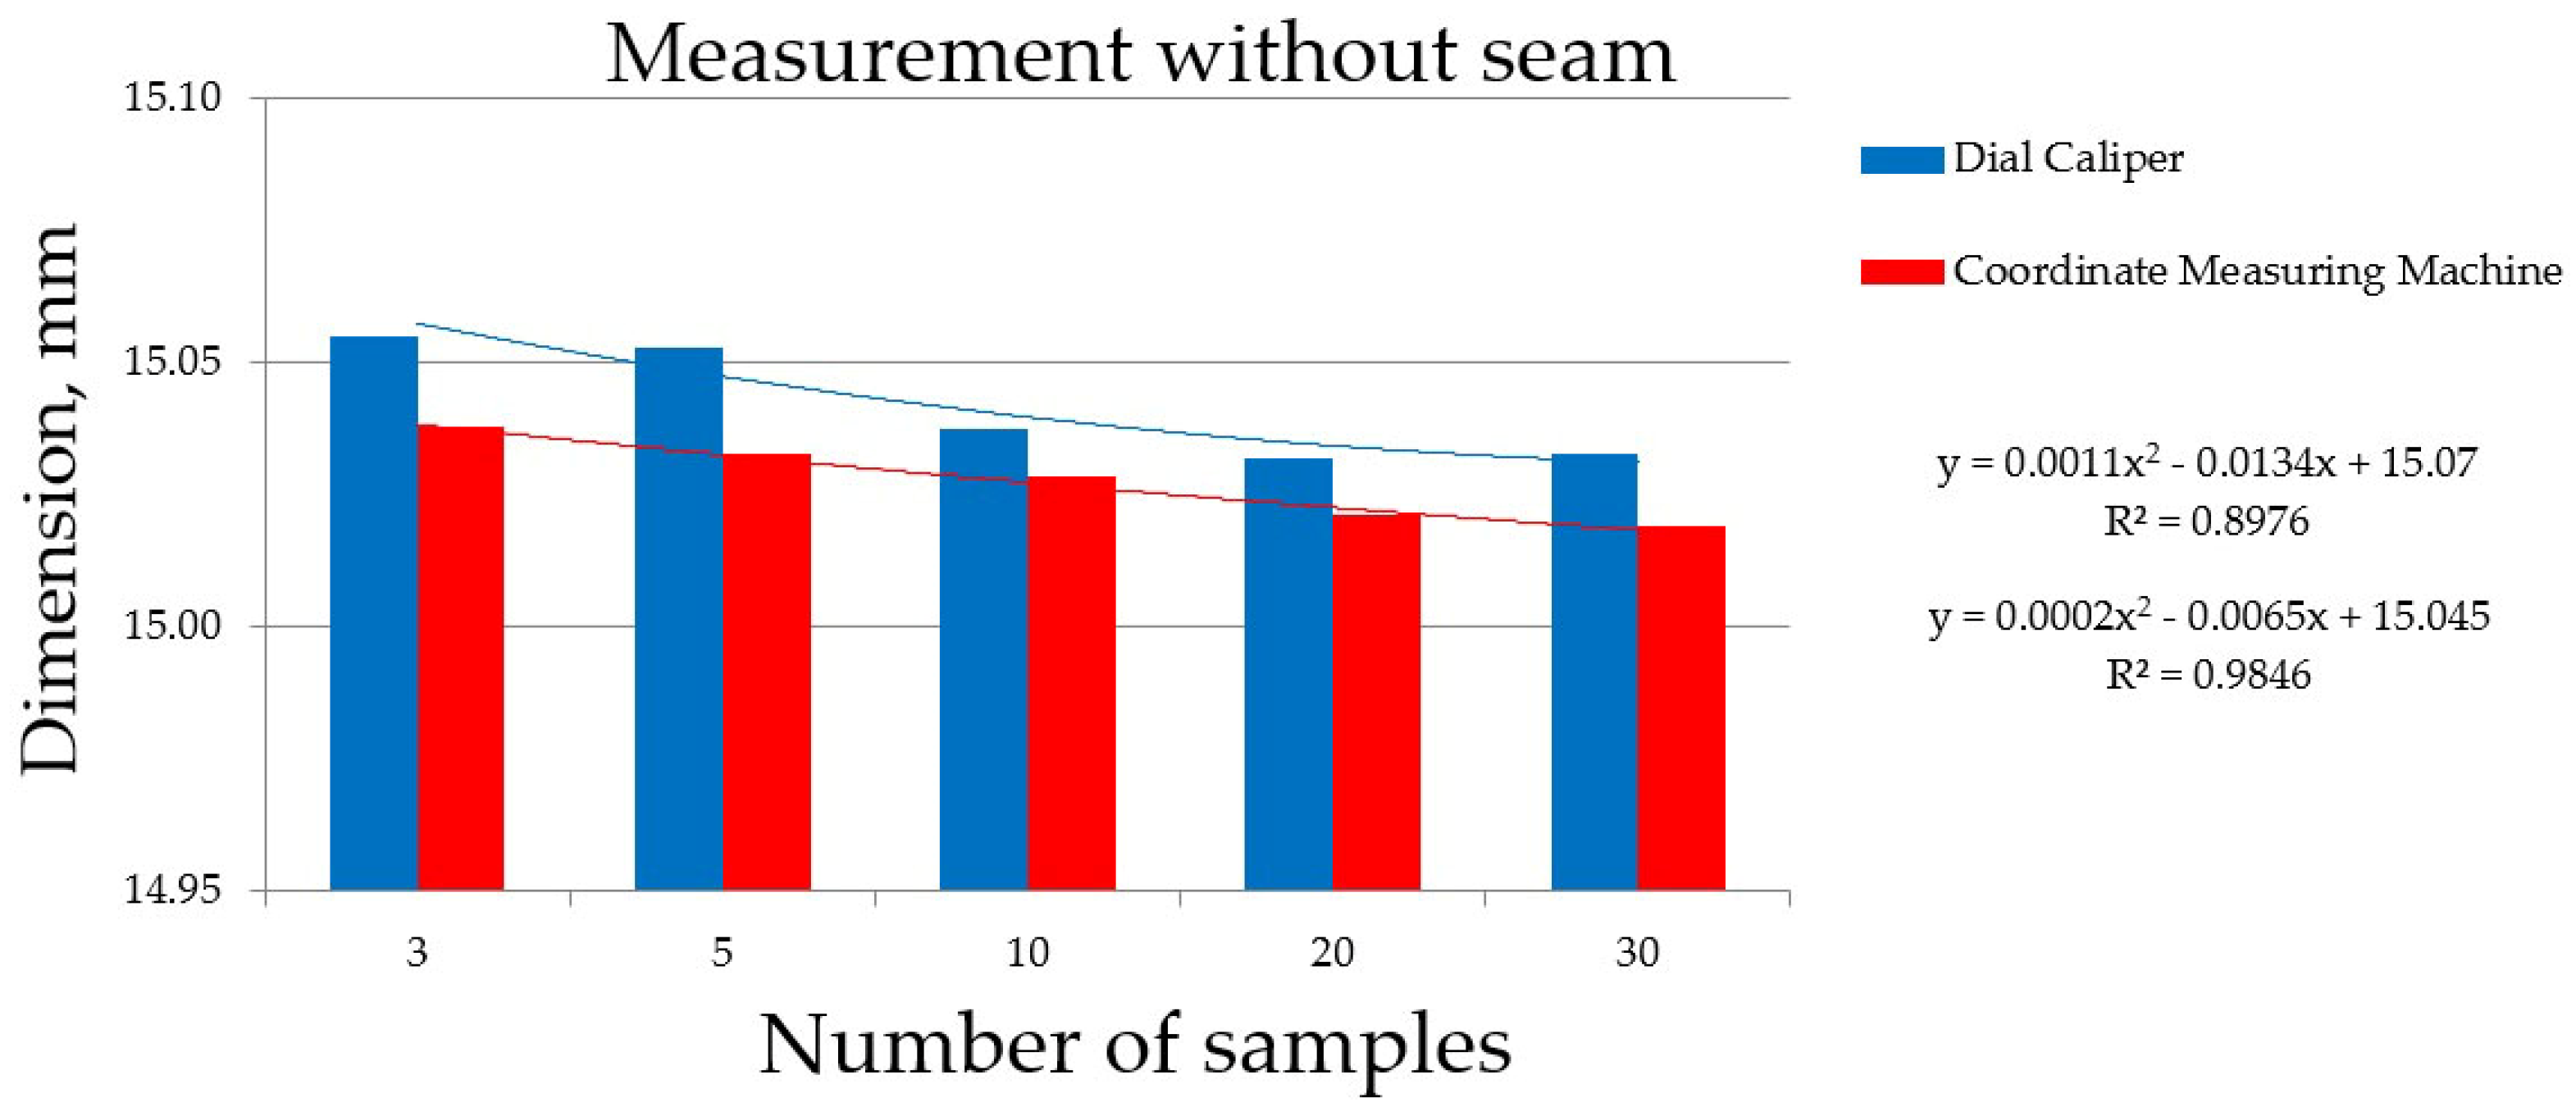
One of the manufactured samples is shown in Figure 4, displaying the macrostructure of the surface in its various sections using different magnifications of the digital microscope.
The macrostructure (shape) of the surface affects the results of geometric quantities depending on the measurement method used, as illustrated in Figure 5.
Figure 5 shows how the geometric structure (shape) of a printed sample can affect the measurement result. Different shapes of contact measurement sensors are used during measurements, and this has certain consequences, e.g., a flat tip (1) makes surface contact only with the tops of irregularities. On the other hand, blade-type (2) or ball-type (3) tips can plunge into the so-called “valleys” of irregularities, which affects the value of the final result of the measurement of a geometric quantity. The use of a scanner, which uses a light beam (4) is also not without disadvantages, as the so-called “shadow effect” (5) can be created, which affects the surface doping in the image processing on the basis of which the inspection of dimensions is carried out. When carrying out measurements using a dial caliper and a coordinate measuring machine, this phenomenon was considered and two types of measurements were made, the so-called diameter measurement with seam and the measurement without it. Each of the measuring tools had a different measurement strategy as described below, but in all cases, the values measured at three different heights were analyzed. It was decided to carry out the measurement with the diameter measurement omitted at the top surface due to a defect in the print in the form of excessive material flowing out, and the bottom surface due to the formation of a defect in the form of the so-called “Elephant foot”.
Metrology tests were conducted using three pieces of equipment:
-
Dial Caliper,
-
Coordinate Measuring Machine,
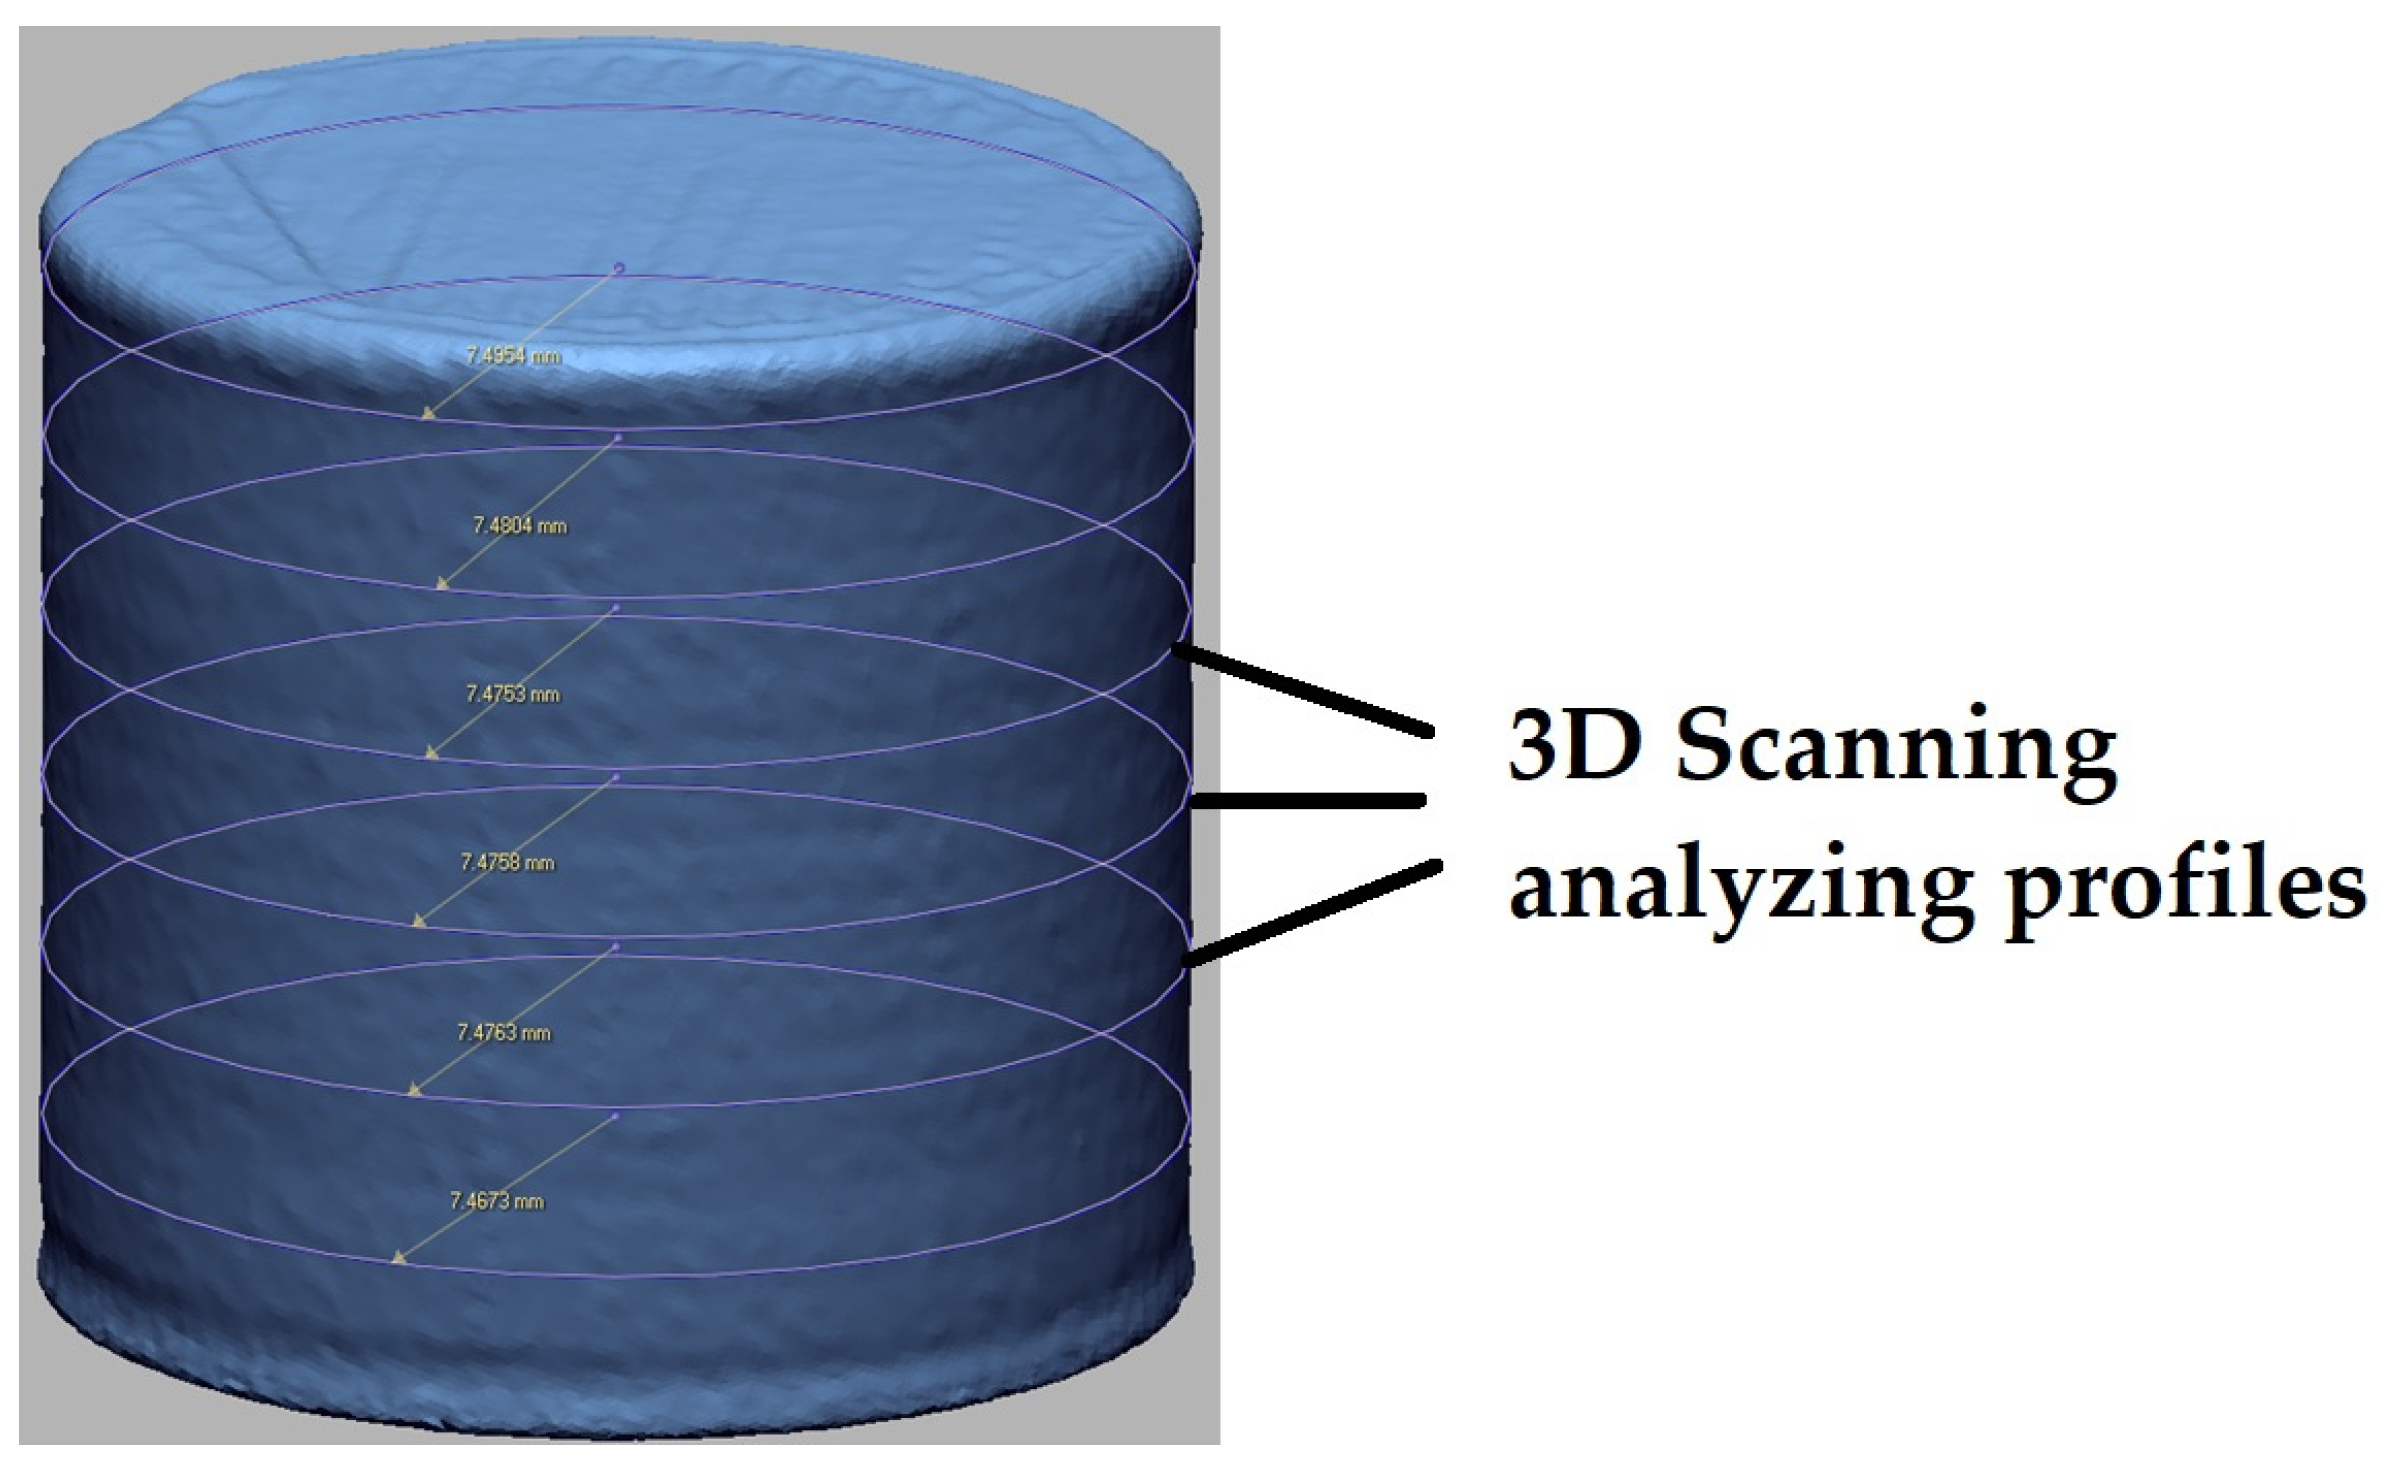
-
3D scanner.
The INSIZE 1311-150A Dial Caliper (INSIZE Co., Ltd., Suzhou, China) was the first device used to make measurements. The resolution of the Dial Caliper used was 0.01 mm, according to the producer. According to the manufacturer, the accuracy of this caliper for a measuring range of 15 mm is equal ± 0.02 mm. The Dial Caliper had a valid calibration certificate at the time of measurement. The research involved measurement using a flat measuring tip (Figure 5—type 1) of a caliper in the place closest to the main body.
The seamless measurement strategy involved taking four diameter measurements every 45° in the same cross-section (at the same height—Figure 6). The sample was measured in three different cross-sections at varying heights, resulting in a total of 12 measurements for each sample. The top surface of the sample was considered to be the face where the printing machine finished printing.
The measurement strategy with a seam involved taking four diameter measurements at one location—the occurrence of a seam in the same cross-section—and at three different heights (a total of 12 measurements).
Another measurement tool was a coordinate measuring machine (CMM), Optiv Reference 543 (Hexagon AB, Stockholm, Sweden), with metrological software PC-Dmis (https://hexagon.com/products/product-groups/measurement-inspection-software/metrology-software/pc-dmi (accessed on 24 March 2024)), equipped with the HP-S-X1 probing system. For this, machine length measurement error according to ISO10360-2 [29] is MPE_E(xy) = (0.8 + L/300) µm. The CMM measurement process is characterized by an uncertainty of 1.4 μm.
A 5 mm diameter measuring tip with a force of 0.015 N was used during the measurements (Figure 7). The measurement strategy without seam involved the determination of a single diameter based on the measurement of 14 points (to avoid seam location) equally spaced around the circumference of the sample in the same section. In addition, the sample was measured in three different cross-sections at varying heights. The measurement strategy not excluding seam (with seam) involved the determination of a diameter using over 370 measurement points (few of them were in seam location) taken during a scan around the circumference of the sample in the same three cross-sections as in the point-to-point strategy.
In this work for 3D scanning, a Creaform Handyscan Black mobile laser scanner (Canada, resolution: 0.025 mm, accuracy: 0.025 mm) was used. Scanning methods for measurement were obtained on the presented form. The scanned data were aligned using the Interactive Alignment function in GeomagicDesignX (2019) software. When carrying out the measurement using a 3D scanner, each sample was placed on the scanner platform with the flat surface of the sample, the base of the cylinder, i.e., in the same way as it was printed, as shown in Figure 3. Plane, vector, and point were used to align the polygon mesh. The plane was derived from the bottom surface of the sample, on which approximately 20 grid surface points were selected and intersected by the plane. For obtaining the axis of the cylinder, the Auto Segment function was used, which, based on the specified parameters and sensitivity, can find geometric shapes in the polygon network such as cylinder, plane, cone, etc. The Find Cylinder Axis method was used to create a center vector. The point was obtained by intersecting the plane and the vector. The alignment of the coordinate system using the Interactive Alignment function was performed to the obtained point, where the Z-axis of the coordinate system is identical to the vector and the XY-axis lies in the created plane derived from the surface. To evaluate the diameter of the printed samples, a silhouette was created in six planes derived from the XY base plane at the intersection of the plane and the polygon mesh using the Mesh Sketch function. From the silhouette, a circle was derived using the Perimeter Circle function, which, based on three selected points from the silhouette, creates a circle in the sketch, as can be seen in Figure 8.

2.3. Statistical Analysis

Statistical analysis is a key factor in the reliable presentation of measurement results, and also allows comparison of the results of different studies, so the calculation methodology used is presented [30]. The basic statistical parameter that allows further in-depth analysis is the standard deviation, which, in the presented test results, was calculated according to Equation (1) shown below.
s = 1 ( n 1 ) i = 1 n ( x i x ¯ ) 2
where:
n number of samples,
x i results of sample measurement,
x ¯ —average value for series of measurements.
Another parameter that makes it possible to assess the value of results in a much more precise way is the so-called standard uncertainty. The way of estimating the uncertainty is the criterion for its division into two types:
-
Type A uncertainties—determined by statistical methods,
-
Type B uncertainties—determined by other methods.
Measurement results are subject to both type A and type B uncertainties, and they can have comparable values or significantly dominate each other. When the dominant uncertainty is:
-
Type A standard uncertainty specified as type A overall uncertainty,
-
Type B standard uncertainty shall be referred to as type B overall uncertainty.
When the two uncertainties have comparable values, the total uncertainty will be the type AB uncertainty.
The type A uncertainty for the study was calculated according to Formula (2), shown below.
u A = 1 n ( n 1 ) i = 1 n ( x i x ¯ ) 2
The final statistical parameter that, for experimental studies, allows one to determine the result of a measurement that depends on the number of samples tested, is the Extended Uncertainty using Student’s t, or according to Gauss normal distribution. In the case of the presented research, Formula (3) was used, which takes into account an additional expansion factor—kp, the value of which in the following calculations is shown in Table 3 and Table 4. The expanded uncertainty was calculated using the Student’s t-distribution because the size of the largest series of samples did not exceed the number 30.
U C A = k p u A
where:
k p expansion factor for a series of measurements selected for a confidence level of 95%.
There may be a situation where the measurement uncertainty calculated by the type A method is exceedingly small, which may be questionable. Therefore, it is necessary to refer to the limiting error of a single measurement.
Table 3. Statistical analysis included statistical population size (number of samples) with seam.
Measurement
Tool
Series
n
Coefficient
kp
Standard
Deviation
s , mm
Standard
Uncertainty, u A ,   mm
Expanded
Uncertainty U C A , mm
Result
x   ¯   ±   U C A ,
mm
Dial Caliper34.30.0120.0070.02915.11 ± 0.029
52.780.0230.0100.02915.10 ± 0.029
102.260.0230.0070.01615.09 ± 0.016
202.090.0230.0050.01115.08 ± 0.011
302.050.0220.0040.00815.08 ± 0.008
CMM34.30.0090.0050.02315.05 ± 0.023
52.780.0150.0070.01815.04 ± 0.018
102.260.0220.0070.01615.03 ± 0.016
202.090.0270.0060.01315.02 ± 0.013
302.050.0260.0050.0115.02 ± 0.010
3D Scanner34.30.0030.0020.00714.99 ± 0.007
52.780.0170.0080.02114.99 ± 0.021
102.260.0280.0090.02014.97 ± 0.020
202.090.0290.0060.01314.96 ± 0.013
302.050.0290.0050.01114.95 ± 0.011
Table 4. Statistical analysis included statistical population size (number of samples) without seam.
Measurement
Tool
Series
n
Coefficient
kp
Standard
Deviation s , mm
Standard
Uncertainty, u A ,   mm
Expanded
Uncertainty
U C A , mm
Result
x   ¯   ±   U C A ,
mm
Dial Caliper34.30.0310.0180.07815.06 ± 0.078
52.780.0250.0110.03115.05 ± 0.031
102.260.0300.0090.02115.04 ± 0.021
202.090.0300.0070.01415.03 ± 0.014
302.050.0320.0060.01215.03 ± 0.012
CMM34.30.0160.0090.03915.04 ± 0.039
52.780.0180.0080.02215.03 ± 0.022
102.260.0220.0070.01615.03 ± 0.016
202.090.0250.0060.01215.02 ± 0.012
302.050.0230.0040.00915.02 ± 0.009

3. Results

After taking measurements with three different measuring tools, a statistical analysis of the obtained results was performed. For each sample, an average value consisting of the values from three different sections was calculated. Measurements of diameters with seam (Figure 9) and without seam (Figure 10) were also taken into account during the calculations. One of the main objectives of the study was to evaluate the effect of the number of samples analyzed on the values of the diameter measurement results and the measurement uncertainty, so Figure 9 and Figure 10 show the results of the aforementioned issues, taking into account the presence or absence of a seam in the measurement.
The next step was to divide the obtained results into a series of samples of 3-5-10-20-30 in a random manner. The arithmetic diameter was calculated for each series. Figure 11 and Figure 12 show the results of the arithmetic means, and indicate the trend lines, where a decrease in this value can be observed as the number of samples increases.

4. Discussion

Analyzing the test results presented in Table 3 and Table 4 and Figure 9, Figure 10, Figure 11 and Figure 12, one can notice some characteristic trends regarding the influence of the number of samples tested on the final result. In addition, an evaluation of the three surface geometry measurement methods used allows conclusions to be drawn about the results obtained depending on the method used.
Analyzing the overall test results for 30 samples measured by the three methods, it can be seen that in the case of samples where the longitudinal seam was included in the measurements, the smallest values were registered for the measurement method using a 3D scanner, where the obtained average value was 14.95 ± 0.011 mm. In the next order, the obtained results were as follows: CMM 15.02 ± 0.01 mm, Dial Caliper 15.08 ± 0.008 mm. Thus, we obtain an average result differing by as much as 0.13 mm, where such a large difference is only due to the measurement method used.
In the case of measurements excluding the seam, where only two methods allowed the exclusion of this area from the measurements, the results of the diameters for 30 samples look as follows: CMM 15.02 ± 0.009 mm, Dial Caliper 15.03 ± 0.012 mm. In the case of the measurement with the seam omitted, the difference between the largest result and the smallest is only 0.01 mm, which is 13 times smaller than above for the measurement with the seam (CMM 15.02 ± 0.01 mm, Dial Caliper 15.08 ± 0.008 mm, 3D Scanner 4.95 ± 0.011). The measurement using CMM and skipping the seam, despite taking the same average value of the diameters, has a smaller error in the form of expanded uncertainty, which is due to the fact that CMM included over 370 measurement points in the measurement strategy averaging the final result. In the case of the Dial Caliper, the difference in the average measurement value is as much as 0.05 mm, which is due to the fact that the seam/defect site was omitted from the measurements. It seems that randomly selecting a spot without analyzing the occurrence of a seam can result in an additional error of at least 0.05 mm and a larger diluted uncertainty in the measurement, which is all the easier because there are cases where the model is made with a so-called randomly scattered seam.
Both cases have shown, in a great quantity of the test specimens without a seam, the difference between the measured values for the two methods blurs, as shown in Figure 10.
Analyzing the values of the diameters, it can be clearly seen that the measurements with the exclusion of the seam are characterized by smaller average values of the obtained results, which is a natural phenomenon. It can also be seen that the values of the expanded uncertainty for Dial Caliper are significantly smaller when the seam location is omitted. Such a relationship is important from the point of view of analyzing the test results, as it can be seen that skipping the seam area more accurately depicts the actually reconstructed cylindrical surface, and the seam location slightly distorts both the result of the average diameter and the expanded uncertainty of the measurement. Dial Caliper measurement performed without knowledge of the described relationship regarding the occurrence of the seam is currently considered unreliable, since the seam is a fixed element regarding FDM/FFF technology. The research presented on this object is relevant insofar as the development of 3D printing technology in terms of the software of printers now offers the possibility to choose how to arrange the seam, for example, in a single line as was the case in the presented research, or as a scattered seam in different places of the printed object. Regardless of the chosen option, the seam as a fixed defect always occurs in FDM/FFF technology.
Analyzing Figure 11 and Figure 12 on the effect of the number of samples tested on the value of the result and its statistical interpretation, it can be concluded that in both the variants without and with seam, the average value of the diameters decreases with the increase of the analyzed population and stabilizes at a similar level already for 20 analyzed samples. The largest difference occurs for the test with seam using 3D scanner measurement. Table 3 and Table 4, for all samples tested and the methods used, clearly show that for 20 samples, the average values have the same values as for the measurement of all 30 samples. Moreover, not only the average value stabilizes with 20 tested samples, but also the expanded uncertainty. In the case of Figure 12 (seamless measurement) and the corresponding Table 4, the average values for 20 and 30 samples have the same values: 15.03 mm (caliper) and 15.02 (CMM), and the difference in the expanded uncertainty between both series is only 0.02 and 0.03 mm, respectively. Comparing the expanded uncertainty values for a series of 10 and 20 measurements, these differences are 0.07 mm (caliper) and 0.04 mm (CMM), respectively. The quantitative interpretation of the test results for measurements depending on the number of samples is shown in Table 3 and Table 4.
In Table 3, where the results of tests for samples with seam using Dial Caliper are presented, it can be clearly seen that as the number of samples tested increases, not only the average value of the measurement decreases, but also the expanded uncertainty, which is for the analyzed measurement methods and sample sizes respectively: n-3, UCA–0.029; n–30, UCA–0.008. As can be seen, the actual UCA value considering the measurement from 30 samples with seam is almost 3.5 times lower than for the series of three samples analyzed. The same characteristic styles can be seen when analyzing the data in Table 4, where the results for Dial Caliper were n-3, UCA-0.018; n-30, UCA-0.006. As can be seen, the actual UCA value considering the measurement from 30 samples without seam is 3 times smaller than for the series of three samples. In the case of CMM for measurement with and without seam, an identical trend can be seen, where, however, the differences in the value of the expanded uncertainty depending on the number of analyzed samples differ for the measurement with seam more than twice, and for the measurement without seam-three times.
It seems that the application of good measurement practices should take into account the minimum statistical number of samples in accordance with the adopted statistical principles at the level of 30 samples. In the case of the presented test results for 20 samples, there was a satisfactory stabilization of both the average diameter value and the expanded uncertainty. Good measurement practice should take into account whether the measurement was carried out at the seam or not, and how the measurement method, and measurement strategy, was selected. The measurement strategy should take into account the nature of the surface, the selection of appropriate sensors, measuring jaws, etc., which affect the average value, as shown by the results for 3D scanning, which are not sensitive to the influence of the measuring probe tip. Each time, the scanner measures the entire surface, including the seam, but also the valleys occurring at the junction of the layers, which is not obvious in the case of mechanical contact measurements.
Based on the evaluation of the influence of the number of samples on the final measurement result, it can be concluded that the interpretation of test results carried out for a small number of samples, despite the statistical calculations carried out, gives a completely different final result both regarding the average value and in terms of statistical evaluation. Such a situation means that in numerous cases we may consider the technology or manufacturing strategy as inaccurate, which may affect the final decisions made by customers ordering 3D prints, technologists calibrating their devices, repairing 3D printers, as well as in the case of buying or selling 3D printers. The results of this study can certainly be used to evaluate other 3D printing technologies, including those based on metal powders.

5. Conclusions

Three-dimensional printing technologies are state-of-the-art manufacturing methods, which require a reasonable approach in terms of studying quality characteristics such as geometric accuracy. Based on the conducted research and statistical analysis, the following general conclusions can be formulated.
Metrological studies of the dimensional accuracy of models manufactured using 3D printing technology must have a detailed evaluation of the measurement site and determine whether they consider permanent defects in the technological process or avoid them on purpose, since not paying attention to the so-called seam does not give full knowledge of the final measurement result.
The use of each of the metrological methods of diameter measurement analyzed has its own advantages and disadvantages, but the knowledge gained during the study allows informed decision-making about the measuring instrument used and the consequences associated with it. Incorrect selection of the measuring method depending on the application for measuring selected geometric features (e.g., valleys between layers) will not allow for obtaining correct results, on the basis of which we decide on additional calibration of the 3D printer, its service, replacement with a new one (purchase), or change of production 3D printing technology.
The reliability of the methods used also depends on the method of measurement and analysis of the results, which can only be carried out properly knowing the nature of the surface unevenness and the defects caused by the technological process.
The number of samples tested can have a very large impact on the statistical interpretation of the final measurement result, the values of which vary even several times.

Author Contributions

Conceptualization, T.K. and J.B.; methodology, T.K., J.B., D.M. and A.B.; software, J.J., J.M., A.W. and J.H.; validation, T.K and J.B.; formal analysis, T.K. and J.B.; investigation, T.K., J.B., D.M. and A.B.; resources, J.H.; data curation, A.W., J.M. and J.J.; writing—original draft preparation, T.K., D.M. and A.B.; writing—review and editing, T.K., J.H. and M.N.; visualization, D.M.; supervision, T.K. and M.N.; project administration, T.K.; funding acquisition, T.K. and J.B. All authors have read and agreed to the published version of the manuscript.

Funding

This research received no external funding.

Institutional Review Board Statement

Not applicable.

Informed Consent Statement

Not applicable.

Data Availability Statement

The raw data supporting the conclusions of this article will be made available by the authors on request.

Conflicts of Interest

The authors declare no conflict of interest.

References

  1. Pisula, J.M.; Budzik, G.; Przeszłowski, Ł. An analysis of the surface geometric structure and geometric accuracy of cylindrical gear teeth manufactured with the direct metal laser sintering (DMLS) method. J. Mech. Eng. 2019, 65, 78–86. [Google Scholar] [CrossRef]
  2. Adamczak, S.; Zmarzly, P.; Kozior, T.; Gogolewski, D. Analysis of the dimensional accuracy of casting models manufactured by fused deposition modeling technology. In Proceedings of the 23 rd International Conference Engineering Mechanics, Svratka, Czech Republic, 15–18 May 2017; pp. 66–69. [Google Scholar]
  3. Townsend, A.; Senin, N.; Blunt, L.; Leach, R.K.; Taylor, J.S. Surface texture metrology for metal additive manufacturing: A review. Precis. Eng. 2016, 46, 34–47. [Google Scholar] [CrossRef]
  4. Chen, Y.; Peng, X.; Kong, L.; Dong, G.; Remani, A.; Leach, R. Defect inspection technologies for additive manufacturing. Int. J. Extrem. Manuf. 2021, 3, 1–21. [Google Scholar] [CrossRef]
  5. Turek, P.; Budzik, G.; Sęp, J.; Oleksy, M.; Józwik, J.; Przeszłowski, Ł.; Paszkiewicz, A.; Kochmański, Ł.; Żelechowski, D. An analysis of the casting polymer mold wear manufactured using polyjet method based on the measurement of the surface topography. Polymers 2020, 12, 3029. [Google Scholar] [CrossRef] [PubMed]
  6. Pawlus, P.; Reizer, R.; Wieczorowski, M. Problem of non-measured points in surface texture measurements. Metrol. Meas. Syst. 2017, 24, 525–536. [Google Scholar] [CrossRef]
  7. Lesiak, P.; Pogorzelec, K.; Bochenek, A.; Sobotka, P.; Bednarska, K.; Anuszkiewicz, A.; Osuch, T.; Sienkiewicz, M.; Marek, P.; Nawotka, M.; et al. Three-Dimensional-Printed Mechanical Transmission Element with a Fiber Bragg Grating Sensor Embedded in a Replaceable Measuring Head. Sensors 2022, 22, 3381. [Google Scholar] [CrossRef] [PubMed]
  8. Adamczak, S.; Janecki, D.; Makieła, W.; Stepień, K. Quantitative comparison of cylindricity profiles measured with different methods using legendre-fourier coefficients. Metrol. Meas. Syst. 2010, 17, 397–403. [Google Scholar] [CrossRef]
  9. Zaimovic-Uzunović, N.; Kačmarčik, J.; Varda, K.; Lemeš, S.; Spahić, D. 3D printing additive procedure model creation and dimensional check using CMM. Mašinstvo 2018, 4, 237–245. [Google Scholar]
  10. Sagbas, B.; Poyraz, O.; Durakbasa, N. A Comparative Study on Precision Metrology Systems For Additive Manufacturing. Int. J. 3D Print. Technol. Digit. Ind. 2023, 7, 114–123. [Google Scholar] [CrossRef]
  11. Fotowicz, P. Systematic effect as a part of the coverage interval. Metrol. Meas. Syst. 2010, 17, 439–446. [Google Scholar] [CrossRef]
  12. Brychta, P.; Hojk, V.; Hrubý, J.; Pilc, J. Influence of Fine Motor Skill on Accuracy of Measurements Using a Handheld Sliding Caliper at Adolescents Group Aged 19-20. Technol. Eng. 2017, 14, 20–23. [Google Scholar] [CrossRef]
  13. Kacmarcik, J.; Spahic, D.; Varda, K.; Porca, E.; Zaimovic-Uzunovic, N. An investigation of geometrical accuracy of desktop 3D printers using CMM. In Proceedings of the IOP Conference Series: Materials Science and Engineering, Harbin, China, 4–6 May 2018; pp. 1–10. [Google Scholar]
  14. Softić, A.; Bašić, H.; Baljić, K. A Comparison of the CMM and Measuring Scanner for Printing Products Geometry Measurement. Lect. Notes Netw. Syst. 2021, 233, 301–309. [Google Scholar] [CrossRef]
  15. Farhan, M.; Wang, J.Z.; Bray, P.; Burns, J.; Cheng, T.L. Comparison of 3D scanning versus traditional methods of capturing foot and ankle morphology for the fabrication of orthoses: A systematic review. J. Foot Ankle Res. 2021, 14, 1–11. [Google Scholar] [CrossRef] [PubMed]
  16. Reichert, J.; Schellenberg, J.; Schubert, P.; Wilke, T. 3D scanning as a highly precise, reproducible, and minimally invasive method for surface area and volume measurements of scleractinian corals. Limnol. Oceanogr. Methods 2016, 14, 518–526. [Google Scholar] [CrossRef]
  17. Takeuchi, E.; Tsubouchi, T. A 3-D scan matching using improved 3-D normal distributions transform for mobile robotic mapping. In Proceedings of the IEEE International Conference on Intelligent Robots and Systems, Beijing, China, 9–13 October 2006; pp. 3068–3073. [Google Scholar]
  18. D’Apuzzo, N. State of the art of the methods for static 3D scanning of partial or full human body. In Proceedings of the Conference on 3D Modeling, Paris, France, 13–14 June 2006. [Google Scholar]
  19. Ulas, C.; Temeltas, H. A 3D scan matching method based on multi-layered Normal Distribution Transform. In Proceedings of the IFAC Proceedings Volumes (IFAC-PapersOnline), Milan, Italy, 28 August–2 September 2011. [Google Scholar]
  20. Taylor, B.N.; Kuyatt, C.E. NIST Technical Note 1297, 1994 ed.; Guidelines for Evaluating and Expressing the Uncertainty of NIST Measurement Results; National Institute of Standards and Technology: Gaithersburg, MD, USA, 1994. [Google Scholar]
  21. Kim, N.; Yang, C.; Lee, H.; Aluru, N.R. Spatial uncertainty modeling for surface roughness of additively manufactured microstructures via image segmentation. Appl. Sci. 2019, 9, 1093. [Google Scholar] [CrossRef]
  22. Mac, G.; Pearce, H.; Karri, R.; Gupta, N. Uncertainty quantification in dimensions dataset of additive manufactured NIST standard test artifact. Data Br. 2021, 38, 1–18. [Google Scholar] [CrossRef] [PubMed]
  23. ISO/ASTM 52902:2023; Additive Manufacturing, Test artefacts, Geometric Capability Assessment of Additive Manufacturing Systems. International Organization for Standardization: Geneva, Switzerland, 2023; p. 20.
  24. ISO/ASTM 52900:2021; Additive Manufacturing—General Principles—Fundamentals and Vocabulary. International Organization for Standardization: Geneva, Switzerland, 2021; p. 28.
  25. Rokicki, P.; Budzik, G.; Kubiak, K.; Dziubek, T.; Zaborniak, M.; Kozik, B.; Bernaczek, J.; Przeszlowski, L.; Nowotnik, A. The assessment of geometric accuracy of aircraft engine blades with the use of an optical coordinate scanner. Aircr. Eng. Aerosp. Technol. 2016, 88, 374–381. [Google Scholar] [CrossRef]
  26. Technical Data Sheet. Available online: https://after-support.flashforge.jp/uploads/datasheet/tds/PLA_TDS_EN.pdf (accessed on 24 March 2024).
  27. MakerBot Industries LLC. User Manual for Makerbot Sketch; MakerBot Industries LLC.: Eden Prairie, MI, USA, 2022. [Google Scholar]
  28. Seam Position. Available online: https://help.prusa3d.com/article/seam-position_151069 (accessed on 12 December 2023).
  29. ISO 10360-2:2009; Geometrical product specifications (GPS), acceptance and reverification tests for coordinate measuring machines (CMM), Part 2: CMMs used for measuring linear dimensions. ISO: Geneva, Switzerland, 2009.
  30. Adamczak, S.; Bochnia, J. Estimating the approximation uncertainty for digital materials subjected to stress relaxation tests. Metrol. Meas. Syst. 2016, 23, 545–553. [Google Scholar] [CrossRef]
Figure 1. 3D CAD model of the sample.
Applsci 14 03506 g001
Figure 2. STL model of the sample.
Applsci 14 03506 g002
Figure 3. Placement of sample models on the virtual 3D printer platform in MakerBot Print.
Applsci 14 03506 g003
Figure 4. Printed sample with characteristic spots observed under the microscope; (a)—view of the entire sample with marked observation spots, (b)—edge of the sample at observation spot 1, magnification 40×, (c)—seam of the sample, observation spot 2, magnification 60×, (d)—bottom part of the sample, contacting the printer working platform, observation spot 3, magnification 40×, (e)—top part of the sample, observation spot 4, magnification 240×, (f)—side surface of the sample, observation spot 5, magnification 125×.
Applsci 14 03506 g004
Figure 5. An example model of the effect of surface macrostructure on the result of measuring a geometric quantity, 1—the flat tip of a caliper or other contact sensor, 2—the blade of a caliper or other contact sensor, 3—the contact sensors of a measuring machine with a spherical blanket, 4—the light rays of a scanner, 5—the shadow effect from surface irregularities, 6—fragment of the sample.
Applsci 14 03506 g005
Figure 6. Sample model with indication of measurement locations at three levels.
Applsci 14 03506 g006
Figure 7. Sample clamping during CMM measurements.
Applsci 14 03506 g007
Figure 8. Final measured values from the printed cylinder with visible elephant foot in the lower part, and opposite effect in the upper part of the sample.
Applsci 14 03506 g008
Figure 9. Average diameter values—measurement with seam.
Applsci 14 03506 g009
Figure 10. Average diameter values—measurement excluding the seam point.
Applsci 14 03506 g010
Figure 11. Calculated average value for a series of 3-5-10-20-30 samples with seam.
Applsci 14 03506 g011
Figure 12. Calculated average value for a series of 3-5-10-20-30 samples measurement excluding the seam site.
Applsci 14 03506 g012
Table 1. Selected parameters of PLA material [26].
Mechanical PropertiesStandardValue and Unit
Tensile Strength (X-Y)ISO 52745~49 MPa
Elongation at Break (X-Y)ISO 52713.5~15.5%
Modulus of Elasticity (X-Y)ISO 5271000~1100 MPa
Bending Strength (X-Y)ISO 17869~75 MPa
Izod Impact Strength (X-Y)ISO 1804.5~5 KJ/m2
Table 2. MakerBot Sketch printer parameters for PLA.
Printing ParametersValue and Unit
Base layerRaft
Extruder temperature220 °C
Infill density20%
Supported MaterialsMakerBot PLA
Built plate temperature50 °C
Layer height0.2 mm
Disclaimer/Publisher’s Note: The statements, opinions and data contained in all publications are solely those of the individual author(s) and contributor(s) and not of MDPI and/or the editor(s). MDPI and/or the editor(s) disclaim responsibility for any injury to people or property resulting from any ideas, methods, instructions or products referred to in the content.

